Abstract
Background
T2 mapping is an important cardiac MRI technique with applications in various conditions. However, a comprehensive evaluation of the T2 literature for normal values is lacking.
Purpose
To characterize the ranges of normal values and variability of myocardial T2 relaxation times using a systematic review and meta-analysis of the T2 literature.
Materials and Methods
PubMed and Cochrane Central were searched from June 2019 to January 2020 for myocardial T2 measurements in healthy adults. Studies quantifying T2 relaxation times conducted at 1.5 T or 3.0 T using gradient and spin-echo (GRASE) or T2-prepared balanced steady-state free precession sequences were included. Summary means were generated using a random-effects model. Subgroup analysis and meta-regression were performed to assess factors causing heterogeneity.
Results
Of the 2481 articles retrieved, 42 studies were included with 954 healthy adults (mean age, 42.4 years ± 10.5 [standard deviation]; 538 men). The pooled mean of T2 across studies was 52 msec at 1.5 T (95% confidence interval [CI]: 51 msec, 53 msec) and 46 msec at 3.0 T (95% CI: 44 msec, 48 msec) (P ≤ .001). I2 was 98% at 1.5 T and 3.0 T. Meta-regression at 1.5 T and 3.0 T identified vendor (β at 1.5 T = –4 msec [with Philips as reference], P < .001; β at 3.0 T = –5 msec, P = .02) and pulse sequence (β at 1.5 T = –5 msec [with GRASE as reference], P < .001; β at 3.0 T = –6 msec, P = .002) as significant covariates, but it did not identify any association with covariates of age (β at 1.5 T = 0 msec per year, P = .70; β at 3.0 T = 0 msec per year, P = .83) or sex (β at 1.5 T = –1 msec, P = .88; β at 3.0 T = 6 msec, P = .42).
Conclusion
The pooled mean of T2 relaxation times in healthy adults had marked heterogeneity across studies with field strength, vendor, and pulse sequence identified as covariates associated with T2. T2-prepared measurements were similar between vendors at each field strength.
© RSNA, 2020
Summary
T2 relaxation times at cardiac MRI in healthy adults were 52 msec at 1.5 T and 46 msec at 3.0 T; the coefficient of variation was 0.07 and 0.10, respectively.
Key Results
■ The pooled mean of T2 across studies was 52 msec at 1.5 T and 46 msec at 3.0 T (P < .001).
■ In regression analysis for 1.5-T and 3.0-T MRI, vendor (β at 1.5 T = –4 msec [Philips as reference], P < .001; β at 3.0 T = –5 msec, P = .02) and pulse sequence (β at 1.5 T = –5 msec [with the gradient and spin-echo sequence as reference], P < .001; β at 3.0 T = –6 msec, P = .002) significantly affected mean T2 times of the myocardium.
■ There was no association of myocardial T2 time at 1.5-T or 3.0-T MRI with age (β at 1.5 T = 0 msec per year, P = .70; β at 3.0 T = 0 msec per year, P = .83) or sex (β at 1.5 T = 1 msec, P = .88; β at 3.0 T = 6 msec, P = .42).
Introduction
Parametric mapping in cardiac MRI has become an integral technique in the noninvasive characterization of myocardial tissue. During the past 20 years, T2 mapping has emerged as one of these important parametric mapping techniques. T2 mapping can be used to identify myocardial edema in patients with acute myocardial infarction, myocarditis, stress cardiomyopathy, cardiac sarcoidosis, and cardiac allograft rejection (1–7). Furthermore, T2 elevation is now included in cardiac MRI diagnostic criteria for myocarditis (8). Routine clinical implementation of T2 mapping has been hampered by the variability of reported normal T2 values. Factors such as differing center-specific protocols, field strength, MRI vendors, population demographics, and different pulse sequences have led to variability in defining specific cut-offs for clinically significant pathology. According to the current guidelines from the Society for Cardiovascular Magnetic Resonance, reference ranges for T2 mapping should be established, validated, and fixed at each individual local institution (9). Although a recent report in the literature has described T1 relaxation times (10), no comprehensive evaluation of the T2 literature for normal values has systematically examined the effects of pulse sequence, vendor, field strength, sex, or body mass index (BMI) on T2 relaxation times. The primary goals of our study are to summarize the literature by performing a systematic review and pooled analysis of the data, to characterize normal values of T2 relaxation times, to determine the extent of variability among studies performing T2 mapping on healthy adults, and to identify specific covariates that account for heterogeneity between studies.
Materials and Methods
Search Strategy
Two independent reviewers (A.K., a medicine resident with 3 years of experience, and C.A.H., a cardiovascular medicine and advanced cardiovascular imaging fellow with 6 years of experience) searched PubMed and Cochrane Central for articles including myocardial T2 measurements in healthy adults. The search terms used were “T2 mapping ‘AND’ heart” and “T2 ‘AND’ heart ‘AND’ MRI.” The search terms were used separately. Data limits were not used. The initial search was performed on June 17, 2019, and the final search was performed on January 10, 2020. Abstracts were reviewed if the title of the article indicated that the study involved T2 measurements of the heart or if the applicability of the study was not entirely clear by the title. Reviewers further searched reference lists of eligible articles to identify any additional articles not discovered through the database searches.
Study Selection
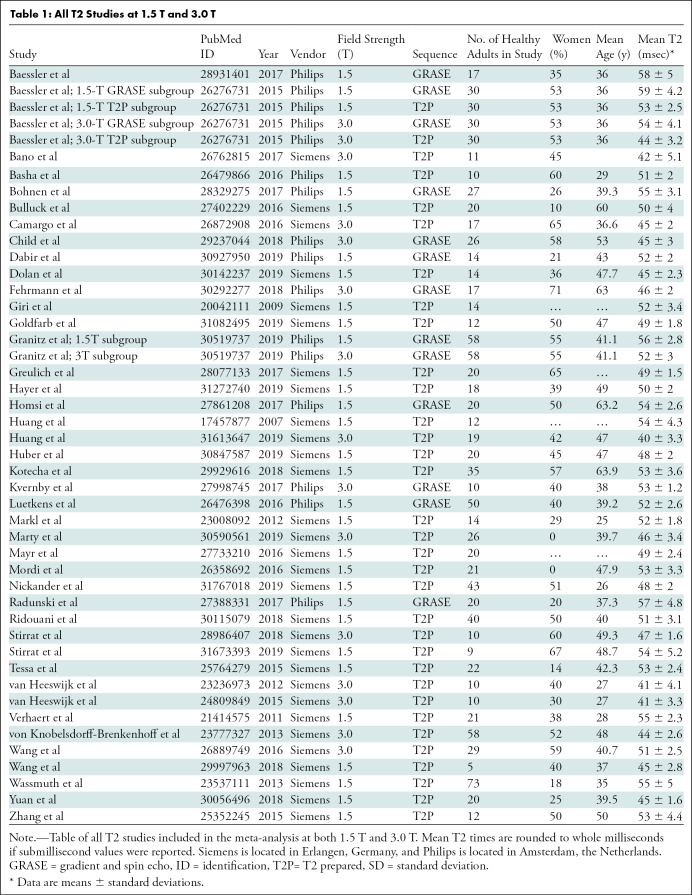
Studies were included if myocardial T2 measurements were performed using cardiac MRI in a group of healthy adults at 1.5 T or 3.0 T using gradient and spin-echo (GRASE) or T2-prepared balanced steady-state free precession sequences and published in peer-reviewed journals in English. Each study was considered for inclusion if it included a healthy study group of at least five participants who were at least 18 years of age, without known or suspected heart disease. Exclusion criteria included studies of athletes or adults who underwent physiologic or pharmacologic stress testing before MRI; studies conducted at field strengths other than 1.5 T or 3.0 T; and studies of adults with risk factors for heart disease (eg, diabetes mellitus, hypertension, or tobacco use); and conference presentations. Discrepancies regarding inclusion were resolved by a consensus of reviewers. If disagreements could not be resolved by consensus, the senior author (M.S., with 14 years of experience) made the final inclusion or exclusion decision. The included studies are shown in Table 1. The references for the articles included in this meta-analysis can be found in Appendix E1 (online). The systematic review and meta-analysis were conducted in accordance with the guidelines of Preferred Reporting Items for Systematic Reviews and Meta-Analyses(11).
Table 1:
All T2 Studies at 1.5 T and 3.0 T
Data Collection
Data review, extraction, and study appraisal were performed by three authors (C.A.H., A.K., with 3 years of experience, and M.S.). The authors directly extracted T2 measurements from text and tables of selected articles. Characteristics of the cardiac MRI protocol used in each study, including vendor, field strength, and pulse sequence, were extracted. If an article included data at different field strengths or varied pulse sequences in the same sample of adults, each data set was handled as a unique study group. The demographic information and size of each cohort were abstracted from each article.
Statistical Analysis
The data analysis was performed in a similar fashion to a meta-analysis of native T1 and extracellular volume measurements in cardiac MRI by Gottbrecht et al (10). The summary means and confidence intervals (CIs) of T2 relaxation times were calculated using random-effects models weighted by the inverse of the variance. Heterogeneity was assessed using the Cochran Q test, τ2, and the inconsistency factor, I2, with values of 25%, 50%, and 75% representing mild, moderate, and severe inconsistency, respectively. Sensitivity analysis, subgroup analysis, and meta-regression were performed to determine which variables likely affect T2 relaxation times and thus account for observed heterogeneity. The covariates queried for meta-regression were field strength, pulse sequence, vendor, age, sex, and BMI. The Cochran QE test was used to assess residual heterogeneity, and R2 was used to assess the proportion of total variance attributable to the covariates. Small study and publication bias were examined with funnel plots and the Egger test.
Coefficient of variation (COV) analysis was performed for the pooled means of all studies, studies performed at 1.5 T and 3.0 T, and studies performed at each field strength with a given pulse sequence. Additionally, COV analysis was performed for pooled means of studies using a T2-prepared pulse sequence (regardless of vendor) and 1.5 T and 3.0 T. The COV was defined as the ratio of the standard deviation to the mean. In an ideal model, patients identified as healthy would have no variation; however, this analysis was performed to demonstrate the degree of variation and uncertainty in the T2 measurements.
Statistical analysis was performed with R software (version 3.6.2; The R Project for Statistical Computing, Vienna, Austria) with the threshold for statistical significance set at P < .05. Meta-analysis was performed using the metafor Package for R (version 3.6.2).
Results
Results of the Literature Search
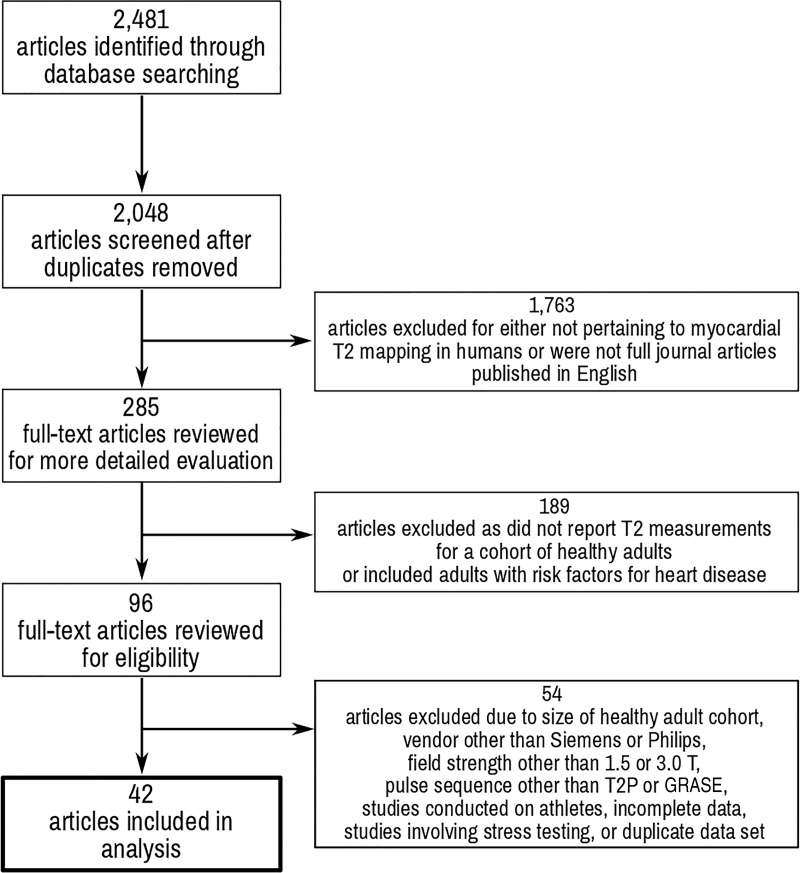
The database search identified 2481 articles: 2201 from PubMed (T2 mapping AND heart, 373 articles; T2 AND heart AND MRI, 1828 articles) and 280 from Cochrane Central (T2 mapping AND heart, 199 articles; T2 AND heart AND MRI, 81 articles). Duplicate articles were removed. The titles of the 2048 unique articles were reviewed for applicability, and 285 met criteria for full-text review. One hundred eighty-nine articles were excluded because T2 measurements were not reported in healthy adults or included adults with risk factors for heart disease. Our search included all vendors and all pulse sequence techniques, but the number of studies for pooled analysis was only sufficient for studies using Siemens (Erlangen, Germany) or Philips (Amsterdam, Netherlands) scanners and only GRASE and T2-prepared–based techniques. Fifty-four full-text articles were excluded because (a) the study size was too small, field strength other than 1.5 T or 3.0 T was used, or pulse sequence other than GRASE or T2-prepared was used, (b) they involved stress testing, (c) they included an identical healthy cohort compared with previous studies published by the authors, or (d) they had incomplete data. Ultimately, 42 articles met the selection criteria and are summarized in Table 1. Some articles included multiple study groups. These different study groups varied according to the field strength, technique, pulse sequence, contrast agent, or contrast agent dose used in the study. Only one study identified a Philips 3.0-T scanner and the T2-prepared protocol that met the aforementioned criteria. Details of the search strategy are outlined in Figure 1.
Figure 1:
Preferred Items for Systematic Reviews and Meta-Analysis flowchart of study review process. GRASE = gradient and spin echo, T2P = T2 prepared.
One study conducted with a 1.5-T GE scanner, using a T2-prepared spiral gradient-echo readout technique, met our inclusion criteria (12). However, there were only 10 healthy control patients, so we excluded it from our pooled analysis due to the lack of similar studies.
Study Characteristics
Study characteristics are shown in Table 1. The 42 articles with T2 relaxation times included 954 healthy adults. Two articles presented multiple study groups for a total of 46 study groups. Forty-one of the 46 study groups (89%) included fewer than 50 adults. The mean age of healthy adults in our study was 42.4 years ± 10.5 (standard deviation), and 538 were men.
Pooled Analysis of T2 Relaxation Times
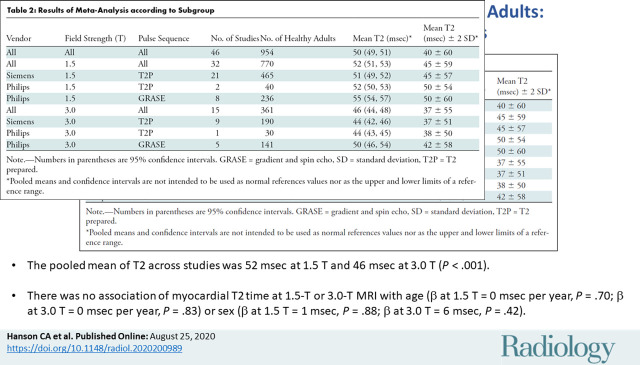
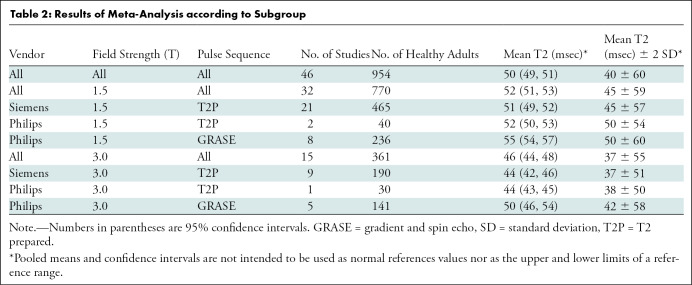
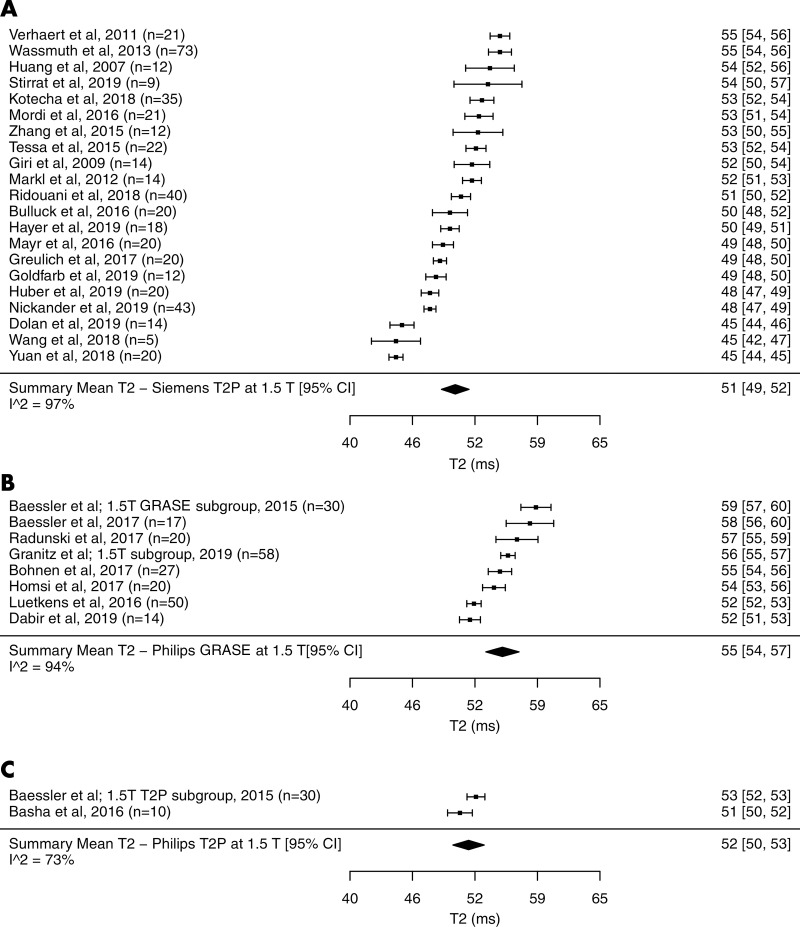
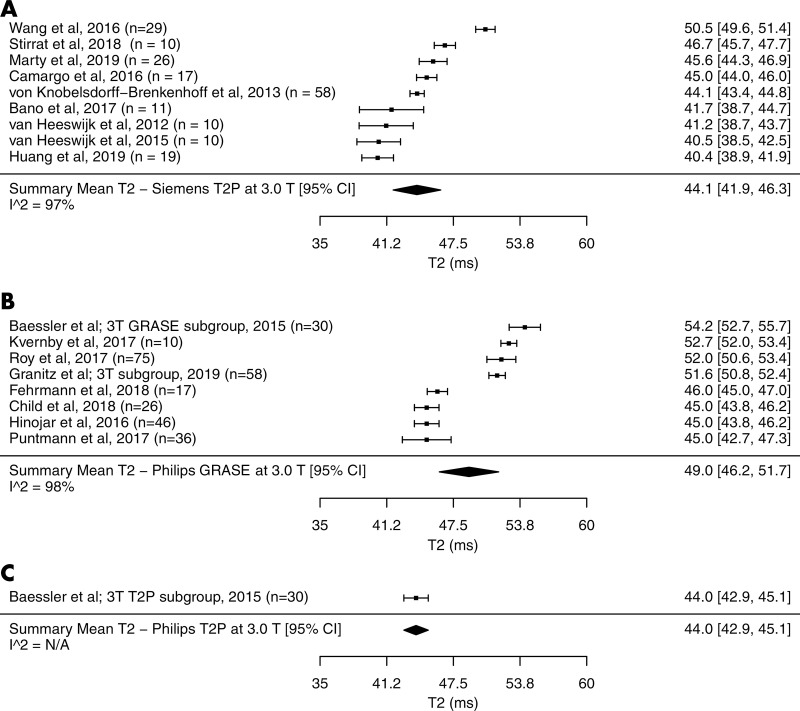
The summary mean of T2 measurements across all studies was 50 msec (95% CI: 49 msec, 51 msec). The summary mean of T2 measurements was 52 msec at 1.5 T (95% CI: 51 msec, 53 msec) and 46 msec at 3.0 T (95% CI: 44 msec, 48 msec) (P < .001). Pooled means across various subgroups are summarized in Table 2. Both pools had marked heterogeneity; I2 was 98% in both the 1.5-T and 3.0-T pools. The forest plots of T2 study groups at 1.5 T and 3.0 T are shown in Figures 2 and 3, respectively.
Table 2:
Results of Meta-Analysis according to Subgroup
Figure 2:
Forest plots of T2 studies show T2 relaxation times at cardiac MRI at 1.5 T in healthy adults. Studies are grouped by vendor and pulse sequences. A, T2 studies performed with a Siemens scanner at 1.5 T using T2-prepared (T2P) sequence. B, T2 studies performed with a Philips scanner at 1.5 T using gradient and spin-echo sequence (GRASE). C, T2 studies performed with a Philips scanner at 1.5 T using T2P sequence. Studies with multiple subgroups are noted by author’s last name, year of publication, and number of patients in each study. CI = confidence interval.
Figure 3:
Forest plots of T2 studies show T2 relaxation times at cardiac MRI at 3.0 T in healthy adults. Studies are grouped by vendor and pulse sequences. A, T2 studies performed with a Siemens scanner at 3.0 T using T2-prepared (T2P) sequence, B, T2 studies performed with a Philips scanner at 3.0 T using gradient and spin-echo sequence (GRASE), C, T2 studies performed with a Philips scanner at 3.0 T using T2P sequence. Studies with multiple subgroups are noted by author’s last name, year of publication, and number of patients in each study. CI = confidence interval, N/A = not applicable.
The mean T2 time with the Siemens T2-prepared pulse sequence was 1 msec shorter than that with the Philips T2-prepared pulse sequence at 1.5 T (51 msec [95% CI: 49 msec, 52 msec] vs 52 msec [95% CI: 50 msec, 53 msec], respectively; P = .59). The mean T2 time for the Siemens T2-prepared pulse sequence and Philips T2-prepared pulse sequence at 3.0 T were similar (44 msec [95% CI: 42 msec, 46 msec] vs 44 msec [95% CI: 43 msec, 45 msec], respectively); however, only one included study used the Philips T2-prepared pulse sequence. Therefore, statistical significance cannot be determined. The mean T2 time for the Philips T2-prepared pulse sequence was on average 3 msec shorter than that with the Philips GRASE pulse sequence at 1.5 T (52 msec [95% CI: 40 msec, 53 msec] vs 55 msec [95% CI: 54 msec, 57 msec], respectively; P = .049). Similarly at 3.0 T, the T2 time with the Philips T2-prepared pulse sequence was 6 msec shorter than that with the Philips GRASE pulse sequence (44 msec [95% CI: 43 msec, 45 msec] vs 50.0 msec [95% CI: 46 msec, 54 msec], respectively); however, only one included study used the Philips T2-prepared pulse sequence. Therefore, statistical significance cannot be determined.
The mean T2 time in the excluded study with only 10 healthy control patients was reported to be 54 msec (95% CI: 52 msec, 56 msec) (12).
There was no evidence of small study or publication bias in the pool of all included studies as assessed by means of the funnel plot and Egger test (P = .84).
Meta-Regression Analysis of T2 Relaxation Times
For meta-regression of all T2 studies, significant covariates for T2 relaxation times included field strength (β = –4 msec [with 1.5 T as a reference], P < .001), vendor (β = –4 msec [with Philips as reference]; P = .004), and pulse sequence (β = –5 msec [with GRASE as reference], P = .001). The following covariates for all T2 studies were not significant: age (β = 0 msec per year, P = .95), BMI (β = 0 msec per kg/m2, P = .84), and sex (β = –3 msec, P = .54). Significant covariates for meta-regression of 1.5-T studies included vendor (β = –4 msec [with Philips as a reference], P < .001) and pulse sequence (β = –5 msec [with GRASE as reference], P < .001). The following covariates for 1.5-T studies were not significant: age (β = 0 msec per year; P = .70), BMI (β = 0 msec per kg/m2; P = .88), and sex (β = –1 msec, P = .88). Meta-regression of 3.0-T studies included vendor (β = –5 msec [with Philips as a reference], P = .02) and pulse sequence (β = –6 msec [with GRASE as the reference), P = .002). The following covariates for 3.0-T studies were not significant: age (β = 0 msec per year, P = .83), BMI (β = –1 msec per kg/m2, P = .37), and sex (β = 6 msec, P = .42). Significant study variability remained after field strength, vendor, and pulse sequence were accounted for, and I2 was 97% at both field strengths. Furthermore, I2 remained greater than 93% when each covariate was accounted for in each subgroup.
COV of T2 Relaxation Times
The COVs of the pools of T2 studies are shown in Tables E1 and E2 (online). The pooled COV of all T2 studies was 0.09, which was slightly higher compared with the pooled COV of T2 at 1.5 T (COV, 0.07) and at 3.0 T (COV, 0.10) (P = .98 and P = .99, respectively). The pooled COV of all T2 studies using a T2-prepared protocol at 1.5 T was 0.06, which was slightly lower than that at 3.0 T (COV, 0.07) (P = .99).
Discussion
In our study, we analyzed 42 studies in the literature that measured T2 relaxation times in healthy adults with a goal of understanding the range and the variability of reported T2 times in the literature. The T2-prepared T2 times at each field strength were consistent between the two vendors (51 msec vs 50 msec at 1.5 T and 44 msec vs 44 msec at 3.0 T). This suggests that at a given field strength, T2-prepared T2 times are similar. At both field strengths, gradient and spin-echo–generated T2 times were 3–6 msec longer than those with T2-prepared mapping (55 msec vs 52 msec at 1.5 T and 50 msec vs 44 msec at 3.0 T).
We determined the uncertainty in T2 relaxation times within the individual studies, as defined by the COV. We found that the mean COV of T2 of studies performed was 0.07 at 1.5 T and 0.10 at 3.0 T. We also found the the mean COV of T2 studies performed using a T2-prepared protocol was 0.06 at 1.5 T and 0.07 at 3.0 T. These results suggest that precision is not significantly different between 1.5 T and 3.0 T.
Many factors likely contributed to the heterogeneity of T2 relaxation times observed among studies. The first obvious source of heterogeneity among studies was the pulse sequence. Studies included in this analysis used either a T2-prepared or GRASE pulse sequence. However, heterogeneity among studies using the same field strength and pulse sequence was also seen. These differences are likely secondary to pulse sequences variables, including vendor differences, echo times used during acquisition, use of a two-parameter versus three-parameter fit model, motion, sensitivity to off-resonance, and B1 inhomogeneity (9,13–17). Patient-specific differences leading to heterogeneity must also be considered. All of the studies included individuals who were free of cardiovascular disease without cardiovascular risk factors, although site-specific differences existed in the composition of the cohorts in terms of age and sex. The cumulative effects of center-specific differences, however, are likely very small, but may also contribute to heterogeneity.
To ensure accurate and reproducible T2 mapping for all patients, institutions should aim to limit intra- and interpatient variability. It is critical that institutions establish protocols and sequence parameters for T2 measurements with minimal changes over time to ensure consistency as emphasized in the current Society for Cardiovascular Magnetic Resonance parametric mapping guidelines (9). These guidelines strongly suggest that each institution determine its own reference ranges for T2 relaxation times, preferably in groups of healthy individuals with similar demographic characteristics to the patients imaged at each center. Once an institution establishes reference ranges, the scan parameters should not be changed (9). Furthermore, phantom validation can validate the control group measurement and also serve as a reliable quality control mechanism. This validation allows for centers to revalidate their measurements following changes to the cardiac MRI hardware or software. The Society for Cardiovascular Magnetic Resonance parametric mapping guidelines recommend performing such a validation every 3 months (9).
Due to the aforementioned heterogeneity in T2 measurement, caution should be applied when using T2 measurement to guide diagnosis of clinical pathology, especially when only global mild increases in T2 are present. Larger increases in T2 (such as is seen in the regional variation of acute myocardial infarction) and myocarditis can be readily detected. Fortunately, we found that T2 measurements procured with T2-prepared sequences demonstrate little variation at a given field strength between studies.
This meta-analysis had several limitations, which include the inherit limitations of meta-analysis and the available data available to analyze. Reporting of normal T2 measurements in studies including healthy individuals is varied and not standardized. Differences in scanning parameters, if present, among the healthy adults were not reported, and demographics were not uniformly reported. Given that a small number of the included studies did not report sex percentages or median age, the statistical ability to identify age or sex as significant covariates may be limited. Additionally, we could not analyze heart rate as a covariate because this was not reported in any of the studies. T2-prepared can introduce heart rate dependence and as such could be a potential covariate (9). All of these covariates likely contributed to some degree of heterogeneity that was discovered in our meta-analysis despite subgroup analyses and meta-regression. We only investigated vendor-specific differences between Philips and Siemens scanners and likewise between T2-prepared and GRASE pulse sequences. It is essential to recognize that I2 indicates observed heterogeneity is statistically present but does not suggest that the observed heterogeneity is clinically relevant (10,18,19). This meta-analysis does not provide a suggestion that the observed heterogeneity observed between studies represents a clinically significant difference. The heterogeneity observed in our meta-analysis precludes the use of the provided pooled means and CIs as a universal normal range for T2 across all studies, vendors, and pulse sequences. Importantly, the pooled means were not generated at an individual patient level, which limited their ability to be used as normal references values. Similarly, the CIs should not be used as the upper and lower limits of a reference range. Furthermore, most studies had small sample sizes, most with less than 50 and all with less than 75 individuals.
In conclusion, this meta-analysis provides a comprehensive analysis of the range and heterogeneity of MRI T2 measurements in healthy adults at 1.5 T and 3.0 T and identified covariates of field strength, vendor, and pulse sequence for T2. We found that the pooled mean T2 values from healthy adults acquired with T2-prepared T2 mapping were similar between vendors at each field strength. The similarity of T2-prepared measurements across the two vendors provides the appropriate context for future guidelines. We recommend using fixed parameters for T2-prepared as future standard practice for T2 mapping because this will allow for minimal variation between centers and for accepted normal ranges. However, the pooled mean of T2 relaxation times in healthy adults had marked heterogeneity across studies using T2-prepared, which remained significant after controlling for various covariates. The observed heterogeneity illustrated the need for future guidelines to recommend fixed T2 mapping protocols and pulse sequence parameters to minimize variability between patients and imaging centers.
APPENDIX
Acknowledgments
Acknowledgment:
The authors acknowledge Austin Robinson, MD, for his help producing the figures.
C.A.H. supported by National Institute of Biomedical Imaging and Bioengineering (grant no. 5T32EB003841). M.S. supported by Siemens Medical Solutions and the National Heart, Lung, and Blood Institute (5T32 EB003841, R01 HL131919).
Disclosures of Conflicts of Interest: C.A.H. disclosed no relevant relationships. A.K. disclosed no relevant relationships. M.G. disclosed no relevant relationships. S.I. disclosed no relevant relationships. M.S. Activities related to the present article: institution received a grant from the National Institutes of Health; receives fees from the American College of Cardiology for participation in review activities such as data monitoring boards, statistical analysis, end point committees, and the like; receives money from Siemens Healthcare for research support. Activities not related to the present article: has grants/grants pending with the National Institutes of Health, the American Heart Association, and the Coulter Foundation; received reimbursement for travel/accommodations/meeting expenses from the Society for Cardiovascular Magnetic Resonance board of trustees. Other relationships: disclosed no relevant relationships.
Abbreviations:
- BMI
- body mass index
- CI
- confidence interval
- COV
- coefficient of variation
- GRASE
- gradient and spin echo
References
- 1.Verhaert D, Thavendiranathan P, Giri S, et al. Direct T2 quantification of myocardial edema in acute ischemic injury. JACC Cardiovasc Imaging 2011;4(3):269–278. [DOI] [PMC free article] [PubMed] [Google Scholar]
- 2.Thavendiranathan P, Walls M, Giri S, et al. Improved detection of myocardial involvement in acute inflammatory cardiomyopathies using T2 mapping. Circ Cardiovasc Imaging 2012;5(1):102–110. [DOI] [PMC free article] [PubMed] [Google Scholar]
- 3.Roller FC, Harth S, Schneider C, Krombach GA. T1, T2 Mapping and Extracellular Volume Fraction (ECV): Application, Value and Further Perspectives in Myocardial Inflammation and Cardiomyopathies. Rofo 2015;187(9):760–770. [DOI] [PubMed] [Google Scholar]
- 4.Crouser ED, Ono C, Tran T, He X, Raman SV. Improved detection of cardiac sarcoidosis using magnetic resonance with myocardial T2 mapping. Am J Respir Crit Care Med 2014;189(1):109–112. [DOI] [PMC free article] [PubMed] [Google Scholar]
- 5.Salerno M, Kramer CM. Advances in parametric mapping with CMR imaging. JACC Cardiovasc Imaging 2013;6(7):806–822. [DOI] [PMC free article] [PubMed] [Google Scholar]
- 6.Usman AA, Taimen K, Wasielewski M, et al. Cardiac magnetic resonance T2 mapping in the monitoring and follow-up of acute cardiac transplant rejection: a pilot study. Circ Cardiovasc Imaging 2012;5(6):782–790. [DOI] [PubMed] [Google Scholar]
- 7.Dolan RS, Rahsepar AA, Blaisdell J, et al. Cardiac Structure-Function MRI in Patients After Heart Transplantation. J Magn Reson Imaging 2019;49(3):678–687. [DOI] [PMC free article] [PubMed] [Google Scholar]
- 8.Ferreira VM, Schulz-Menger J, Holmvang G, et al. Cardiovascular Magnetic Resonance in Nonischemic Myocardial Inflammation: Expert Recommendations. J Am Coll Cardiol 2018;72(24):3158–3176. [DOI] [PubMed] [Google Scholar]
- 9.Messroghli DR, Moon JC, Ferreira VM, et al. Clinical recommendations for cardiovascular magnetic resonance mapping of T1, T2, T2* and extracellular volume: A consensus statement by the Society for Cardiovascular Magnetic Resonance (SCMR) endorsed by the European Association for Cardiovascular Imaging (EACVI). J Cardiovasc Magn Reson 2017;19(1):75 [Published correction appears in J Cardiovasc Magn Reson 2018;20(1):9.]. [DOI] [PMC free article] [PubMed] [Google Scholar]
- 10.Gottbrecht M, Kramer CM, Salerno M. Native T1 and Extracellular Volume Measurements by Cardiac MRI in Healthy Adults: A Meta-Analysis. Radiology 2019;290(2):317–326. [DOI] [PMC free article] [PubMed] [Google Scholar]
- 11.Moher D, Liberati A, Tetzlaff J, Altman DG; PRISMA Group . Preferred reporting items for systematic reviews and meta-analyses: the PRISMA Statement. Open Med 2009;3(3):e123–e130. [PMC free article] [PubMed] [Google Scholar]
- 12.Sparrow P, Amirabadi A, Sussman MS, Paul N, Merchant N. Quantitative assessment of myocardial T2 relaxation times in cardiac amyloidosis. J Magn Reson Imaging 2009;30(5):942–946. [DOI] [PubMed] [Google Scholar]
- 13.Foltz WD, Al-Kwifi O, Sussman MS, Stainsby JA, Wright GA. Optimized spiral imaging for measurement of myocardial T2 relaxation. Magn Reson Med 2003;49(6):1089–1097. [DOI] [PubMed] [Google Scholar]
- 14.Huang TY, Liu YJ, Stemmer A, Poncelet BP. T2 measurement of the human myocardium using a T2-prepared transient-state TrueFISP sequence. Magn Reson Med 2007;57(5):960–966. [DOI] [PubMed] [Google Scholar]
- 15.van Heeswijk RB, Feliciano H, Bongard C, et al. Free-breathing 3 T magnetic resonance T2-mapping of the heart. JACC Cardiovasc Imaging 2012;5(12):1231–1239. [DOI] [PubMed] [Google Scholar]
- 16.Sprinkart AM, Luetkens JA, Träber F, et al. Gradient Spin Echo (GraSE) imaging for fast myocardial T2 mapping. J Cardiovasc Magn Reson 2015;17(1):12. [DOI] [PMC free article] [PubMed] [Google Scholar]
- 17.Dalager-Pedersen S, Falk E, Ringgaard S, Kristensen IB, Pedersen EM. Effects of temperature and histopathologic preparation on the size and morphology of atherosclerotic carotid arteries as imaged by MRI. J Magn Reson Imaging 1999;10(5):876–885. [DOI] [PubMed] [Google Scholar]
- 18.Vo HQ, Marwick TH, Negishi K. MRI-Derived Myocardial Strain Measures in Normal Subjects. JACC Cardiovasc Imaging 2018;11(2 Pt 1):196–205. [DOI] [PubMed] [Google Scholar]
- 19.Salerno M. Feature Tracking by CMR: A “Double Feature”? JACC Cardiovasc Imaging 2018;11(2 Pt 1):206–208. [DOI] [PubMed] [Google Scholar]
Associated Data
This section collects any data citations, data availability statements, or supplementary materials included in this article.


