

Neurexins (Nrxns) and LAR-RPTPs (leukocyte common antigen-related protein tyrosine phosphatases) are presynaptic adhesion proteins responsible for organizing presynaptic machineries through interactions with nonoverlapping extracellular ligands. Here, we report that two members of the LAR-RPTP family, PTPσ and PTPδ, are required for the presynaptogenic activity of Nrxns.
Keywords: alternative splicing, heparan sulfates, LAR-RPTPs, neurexin, synaptic adhesion, synaptogenic
Abstract
Neurexins (Nrxns) and LAR-RPTPs (leukocyte common antigen-related protein tyrosine phosphatases) are presynaptic adhesion proteins responsible for organizing presynaptic machineries through interactions with nonoverlapping extracellular ligands. Here, we report that two members of the LAR-RPTP family, PTPσ and PTPδ, are required for the presynaptogenic activity of Nrxns. Intriguingly, Nrxn1 and PTPσ require distinct sets of intracellular proteins for the assembly of specific presynaptic terminals. In addition, Nrxn1α showed robust heparan sulfate (HS)-dependent, high-affinity interactions with Ig domains of PTPσ that were regulated by the splicing status of PTPσ. Furthermore, Nrxn1α WT, but not a Nrxn1α mutant lacking HS moieties (Nrxn1α ΔHS), inhibited postsynapse-inducing activity of PTPσ at excitatory, but not inhibitory, synapses. Similarly, cis expression of Nrxn1α WT, but not Nrxn1α ΔHS, suppressed the PTPσ-mediated maintenance of excitatory postsynaptic specializations in mouse cultured hippocampal neurons. Lastly, genetics analyses using male or female Drosophila Dlar and Dnrx mutant larvae identified epistatic interactions that control synapse formation and synaptic transmission at neuromuscular junctions. Our results suggest a novel synaptogenesis model whereby different presynaptic adhesion molecules combine with distinct regulatory codes to orchestrate specific synaptic adhesion pathways.
SIGNIFICANCE STATEMENT We provide evidence supporting the physical interactions of neurexins with leukocyte common-antigen related receptor tyrosine phosphatases (LAR-RPTPs). The availability of heparan sulfates and alternative splicing of LAR-RPTPs regulate the binding affinity of these interactions. A set of intracellular presynaptic proteins is involved in common for Nrxn- and LAR-RPTP-mediated presynaptic assembly. PTPσ triggers glutamatergic and GABAergic postsynaptic differentiation in an alternative splicing-dependent manner, whereas Nrxn1α induces GABAergic postsynaptic differentiation in an alternative splicing-independent manner. Strikingly, Nrxn1α inhibits the glutamatergic postsynapse-inducing activity of PTPσ, suggesting that PTPσ and Nrxn1α might control recruitment of a different pool of postsynaptic machinery. Drosophila orthologs of Nrxns and LAR-RPTPs mediate epistatic interactions in controlling synapse structure and strength at neuromuscular junctions, underscoring the physiological significance in vivo.
Introduction
Synaptic adhesion molecules direct establishment of specific synapse types by mediating interactions between presynaptic and postsynaptic partners (Krueger et al., 2012; Um and Ko, 2013; de Wit and Ghosh, 2014, 2016; Jang et al., 2017; Südhof, 2018). In addition to dictating initial synapse formation, they drive coordinated assembly and shape patterned alignment of presynaptic and postsynaptic compartments, forming a nanocolumnal architectural unit (Tang et al., 2016; Südhof, 2018). For proper orchestration of synaptic cell-adhesion pathways at neuronal membranes, variable signaling events are dynamically propagated in an anterograde and/or retrograde manner across the synaptic cleft. Although a multitude of trans-synaptic adhesion molecules have been identified in recent years, the contribution of these molecules to mediating the specificity of synaptic connectivity has recently begun to be revealed (Condomitti and de Wit, 2018; Park et al., 2018; Südhof, 2018). Intriguingly, a subset of trans-synaptic adhesion molecules interacts in cis with other neural glycosylphosphatidylinositol-anchored proteins to promote synapse development (Lee et al., 2013; Pettem et al., 2013; Um and Ko, 2017).
Neurexins (Nrxns) and leukocyte common antigen-related receptor tyrosine phosphatases (LAR-RPTPs) have been proposed to act as presynaptic platforms that orchestrate neurotransmitter release and physically and functionally organize distinct intercellular molecular complexes (Takahashi and Craig, 2013; Um and Ko, 2013; Südhof, 2017; Han et al., 2020). Nrxns and LAR-RPTPs bind to nonoverlapping postsynaptogenic proteins, and both undergo extensive alternative splicing events to mediate distinct extracellular interactions (Südhof, 2017). In addition, Nrxns and LAR-RPTPs mediate presynaptic assembly via different molecular mechanisms (Gokce and Südhof, 2013; Han et al., 2018). More specifically, LAR-RPTPs require interactions with Slitrks and heparan sulfates (HS), tyrosine phosphatase activities, and the ability to bind a subset of intracellular scaffolds (Han et al., 2018), whereas Nrxns do not require direct interactions with intracellular proteins (Gokce and Südhof, 2013). Intriguingly, liprin-α2 and -α3 are required for neuroligin-2 (Nlgn2)-mediated presynaptic differentiation that occurs via Nrxns (Han et al., 2018), implying that LAR-RPTPs and Nrxns might share conserved pathways in presynaptic neurons. However, it remains unclear how various presynaptic components are engaged with the presynaptic assembly and whether these components contribute in common to LAR-RPTP- and Nrxn-mediated presynaptic differentiation. Although presynaptic vesicular components at both excitatory and inhibitory synapses are largely similar (Takamori et al., 2000), synaptic specificity is conferred by different combinations of presynaptic and postsynaptic partners, and by different types of trans-synaptic signals that might be patterned by local neurotransmitters (Südhof, 2018).
Here, we found that LAR-RPTPs are required for presynaptic differentiation-inducing activities of Nrxns in presynaptic neurons. PTPσ and Nrxn1 mediate high-affinity interactions in a manner that requires attached HS moieties, and is modulated by the splicing status of PTPσ. Moreover, Nrxn1α inhibits the postsynaptogenic activity of PTPσ at excitatory, but not inhibitory, synapses. Furthermore, an analysis of presynaptic boutons and synaptic strength showed that double-heterozygous mutants of Dlar and Dnrx exhibited phenotypes similar to those of Dlar or Dnrx single-null flies. Collectively, our data provide novel insights into synaptic organization, establishing that presynaptic Nrxns and LAR-RPTPs act as platforms to bidirectionally orchestrate the flow of trans-synaptic signals and thereby contribute to shaping specific and diverse properties of synaptic adhesion pathways.
Materials and Methods
Construction of expression vectors
Short-hairpin constructs: The indicated shRNA or scrambled shRNA lentiviral expression constructs targeting individual synaptic genes were generated by annealing, phosphorylating, and subcloning into L-309 or L-315 lentiviral vectors at XhoI/XbaI sites. The detailed oligonucleotides sequences of shRNAs used in the current study and their KD efficacies are presented in Table 1, and the oligonucleotide sequences of the scrambled shRNAs are presented in Table 2. Expression constructs: pCAGG-FLAG-Nrxn1α−SS4 ΔHS was generated by mutagenesis PCR amplification using pCAGG-FLAG-Nrxn1α−SS4 WT as a template. L-313 Nrxn1α−SS4 WT and L-313 Nrxn1α−SS4 ΔHS were generated by PCR amplification using pCAGG-FLAG-Nrxn1α−SS4 WT and pCAGG-FLAG-Nrxn1α−SS4 ΔHS as templates, respectively. These PCR products were then subcloned into a L-313 lentiviral vector at NheI/BsrGI sites. The pDisplay-PTPσ Ig1-3 (aa 30-337) was generated by PCR amplification using L-313 PTPσ WT as a template and then subcloned into a pDisplay vector at XmaI/SacII sites. The following constructs were previously described: pDisplay-Slitrk6, L-313 PTPσ variants, and L-313 PTPδ (Han et al., 2018); L-315 Nrxn-TKD (Um et al., 2016); pCMV5-Nlgn1-mVenus (Lee et al., 2013); pCAGG-FLAG-Nrxn1α−SS4, pCAGG-FLAG-Nrxn1α+SS4, pCAGG-FLAG-Nrxn1β-SS4, pCAGG-FLAG-Nrxn1β+SS4, pCMV-IgC-Nrxn1α−SS4, and pCMV-IgC-Nrxn1α+SS4 (Matsuda and Yuzaki, 2011); L313-PTPσMeA-MeB- AAAA (Ko et al., 2015); and L-309-sh-PTPσ and L-309-sh-PTPδ (Yim et al., 2013). IgC constructs: pCMV-IgC-Nrxn1β-SS4, pCMV-IgC-Nrxn1β+SS4, and pCMV-IgC-Nrxn3α+SS4 were generated by PCR amplification of the indicated extracellular regions of Nrxn1β-SS4 (aa 1-359), Nrxn1β+SS4 (aa 1-389), and Nrxn3α+SS4 (aa 28-1612), respectively, followed by digestion with SalI (for Nrxn1β and Nrxn3α), and cloning into a pCMV-IgC vector or a modified pCMV-IgC vector harboring the signal peptide sequence of PrP. pCMV-IgC-Nrxn1α deletion variants were generated by PCR amplification of different extracellular regions of Nrxn1α (Nrxn1α-1, aa 282-478; Nrxn1α-2, aa 282-491; Nrxn1α-3, aa 282-727; Nrxn1α-4, aa 463-908; Nrxn1α-5, aa 715-908; and Nrxn1α-6, aa 897-1338), followed by digestion with EcoRI and SalI, and cloning into the pCMV-IgC vector. The pCMV-IgC-Nrxn1α−SS4 ΔHS mutant (S1327A) and the pCMV-IgC-Nrxn1β-SS4 ΔHS mutant (S346A) were generated by mutagenesis PCR amplification using the pCAGG-Nrxn1α−SS4 and pCMV-IgC-Nrxn1β-SS4 constructs as backbones, respectively, after which the PCR products were subcloned into EcoRI and SalI sites of the pCMV-IgC vector using an In-Fusion HD cloning kit (Clontech). The shRNA-resistant rescue vectors expressing the indicated full-length genes were PCR-amplified and subcloned into the L-313 lentiviral vector at NheI/BsrGI sites. shRNA-resistant expression vectors were constructed by mutation of three to four nucleotides in pCMV5-CASK (CASK; 5′-gcaaatggagacatggacatggagaatgtgaccagagttcgcctggtacagtt-3′ to 5′-gcaaatggagacatggacatggaaaacgtcactagagttcgcctggtacagttt-3′), pCMV5-Caskin1 (Caskin1, 5′-aggccagcaaggagatcaagcaactgcttcgagaggct-3′ to 5′-aggccagcaaggaaattaagcaactgctccgagaggct-3′), pNICE-HA-mSYD1A (SYD1A, 5′-cgggctccctctgcagcttctggtagaacgtgagcagtccc-3′ to 5′-cgggctccctctgcaactcctggtggagcgtgagcagtccc-3′), and pCMV5-RIM-BP2 (RIM-BP2, 5′-ccactgggttgtccaatggagcaaatgtcacaggatatggcgtgtacg-3′ to 5′-cactgggttgtccaatggtgccaacgtaacaggatatggcgtgtacg-3′) vectors, where the underlined residues are those that were altered. The plasmids pCMV5-hABL1 (catalog #HS11199-NY), pGEM-T-MTSS1 (catalog #HG13085-G), and pCMV5-hEna (catalog #HG12723-UT) were purchased from Sino Biological; and pNICE-HA-mSYD1A (catalog #59361) was from Addgene. pCMV5-RIM-BP2 was a gift from Pascal Kaeser (Harvard University, Cambridge, MA). pCMV5-Caskin-1 was a gift from Katsuhiko Tabuchi (Shinshu University). pCMV5-CASK and pGW1-hELKS2 were described previously (Ko et al., 2003, 2006). Details of the rescue vector design are presented in Table 3.
Table 1.
Lentiviral shRNA constructs used in the current study
| shRNA construct | Target nucleotide sequence (5′−3′) | Reference | KD efficiency (%) |
|---|---|---|---|
| L-309 sh-PTPσ | GCCACACACCTTCTATAAT | Yim et al., 2013 | 89.7 ± 3.2 |
| L-309 sh-PTPδ | GTGCCGGCTAGAAACTTG | Yim et al., 2013 | 93.5 ± 1.6 |
| L-315 sh-β-catenin | GCAATCAGCTGGCCTGGTTTG | Han et al., 2018 | 83.8 ± 8.0 |
| L-315-sh-Abl1/2 | AACCTGTACACATTCTGTGTG | Current study | 81.4 ± 0.7 |
| L-315-sh-p250RhoGAP | ACAAGAAGCACCAAGTA | Takamori et al., 2000 | 38.3 ± 5.9 |
| L-315-sh-Ena | TTGTGGAAGAGGTGCGGAA | Current study | 71.8 ± 4.0 |
| L-315-sh-MIM-B | CCGGTTCTGCACCTTCATT | Current study | 85.6 ± 6.4 |
| L-315-sh-CASK | GCTGAAGCATCCACACATTGT | Current study | 78.2 ± 4.1 |
| L-315-sh-Caskin-1 | GGAGATCAAGCAACGGCTTCG | Current study | 90.6 ± 3.1 |
| L-315-sh-Caskin-2 | GCTGATCTCAGGCCAGATTTC | Current study | 51.3 ± 7.1 |
| L-315-sh-RIM1 | AGTCCACAGGGTAAAGTTC | Spangler et al., 2013 | 47.4 ± 7.8 |
| L-315-sh-RIM-BP1 | GCCAGATCCTCAAGGTGTTTG | Current study | 64.2 ± 9.8 |
| L-315-sh-RIM-BP2 | GGAGCAAATGTCACAGGATAT | Current study | 49.7 ± 9.7 |
| L-315 sh-Liprin-α2 | AGCCAGTCTGATTACAGAA | Spangler et al., 2013 | 74.9 ± 7.6 |
| L-315 sh-Liprin-α3 | GCTAACATGAAGAAGCTTCAA | Han et al., 2018 | 82.1 ± 5.8 |
| L-315-sh-Piccolo | AAGTGCTGTCTCCTCTGTTGT | Spangler et al., 2013 | 78.8 ± 11.9 |
| L-315-sh-ELKS1 | GCTCGGGATGAGTCCATTAAG | Current study | 66.3 ± 2.4 |
| L-315-sh-ELKS2 | GCAAGGAGCTTGACATTAAGG | Current study | 87.6 ± 2.9 |
| L-315-sh-Trio | GCAGTTCCAGCACGCTATTG | Current study | 70.1 ± 3.7 |
| L-315-sh-SYD1A | GCAGCTTCTGGTAGAACGTGA | Current study | 50.9 ± 8.6 |
| L-315-sh-N-cadherin | GGACAACTGTCAGTCACAAAG | Han et al., 2018 | 70.3 ± 5.9 |
| L-315-Nrxn TKD | GTGCCTTCCTCTATGACAACT (for Nrxn1); GAACAAAGACAAAGAGTAT (for Nrxn2); and ATGCTACACTTCAGGTGGACA (for Nrxn3) | Um et al., 2014 | 86.7 ± 3.6 |
Table 2.
Oligonucleotides for scrambled shRNAs used in the current study
| Gene | Oligo sequence (5′−3′) |
|---|---|
| Mim-b | Forward: tcgacccGCCGCTTCCGTTATCTACTttcaagagaAGTAGATAACGGAAGCGGCtttttggaaat Reverse: ctagatttccaaaaaGCCGCTTCCGTTATCTACTtctcttgaaAGTAGATAACGGAAGCGGCggg |
| Abl1/2 | Forward: tcgacccGCACGTCTATTGAATGTCACTttcaagagaAGTGACATTCAATAGACGTGCtttttggaaat Reverse: ctagatttccaaaaaGCACGTCTATTGAATGTCACTtctcttgaaAGTGACATTCAATAGACGTGCggg |
| Ena | Forward: tcgacccGGAAAGAGGCGTGTAGTGTttcaagagaACACTACACGCCTCTTTCCtttttggaaat Reverse: ctagatttccaaaaaGGAAAGAGGCGTGTAGTGTtctcttgaaACACTACACGCCTCTTTCCggg |
| Caskin-1 | Forward: tcgacccGGGCACAGTGACACGGTATCAttcaagagaTGATACCGTGTCACTGTGCCCtttttggaaat Reverse: ctagatttccaaaaaGGGCACAGTGACACGGTATCAtctcttgaaTGATACCGTGTCACTGTGCCCggg |
| Caskin-2 | Forward: tcgacccGGCCCTAGCTACTGACGTATTttcaagagaAATACGTCAGTAGCTAGGGCCtttttggaaat Reverse: ctagatttccaaaaaGGCCCTAGCTACTGACGTATTtctcttgaaAATACGTCAGTAGCTAGGGCCggg |
| Rimbp1 | Forward: tcgacccGGTGCTCCAATGAACTGGTCTttcaagagaAGACCAGTTCATTGGAGCACCtttttggaaat Reverse: ctagatttccaaaaaGGTGCTCCAATGAACTGGTCTtctcttgaaAGACCAGTTCATTGGAGCACCggg |
| Rimbp2 | Forward: tcgacccGAACGTCGAGAGGAACTTTAAttcaagagaTTAAAGTTCCTCTCGACGTTCtttttggaaat Reverse: ctagatttccaaaaaGAACGTCGAGAGGAACTTTAAtctcttgaaTTAAAGTTCCTCTCGACGTTCggg |
| Syd1a | Forward: tcgacccGCGCTAAGGTCGGTCGTTAAAttcaagagaTTTAACGACCGACCTTAGCGCtttttggaaat Reverse: ctagatttccaaaaaGCGCTAAGGTCGGTCGTTAAAtctcttgaaTTTAACGACCGACCTTAGCGCggg |
Table 3.
Oligonucleotides for rescue vectors used in the current study
| Gene | Species | Oligo sequence (5′−3′) |
|---|---|---|
| Rimbp2 | Rat |
For mutagenesis Forward: CGTACACGCCATATCCTGTTACGTTGGCACCATTGGACAACCCAGTGG Reverse: CCACTGGGTTGTCCAATGGTGCCAACGTAACAGGATATGGCGTGTACG |
|
For L-313 vector cloning Forward: TCCCGAATTCGCTAGCGCCACCATGCGAGAGGCTGCT Reverse: CCGCTTTACTTGTACATTAGGGTGTGAAATGAACACT | ||
| Caskin-1 | Rat |
For first mutagenesis Forward: AGGCCAGCAAGGAAATTAAGCAACTGCTTCGAGAGGCT Reverse: AGCCTCTCGAAGCAGTTGCTTAATTTCCTTGCTGGCCT |
|
For second mutagenesis Forward: CAGCAAGGAAATTAAGCAACTGCTCCGAGAGGCT Reverse: AGCCTCTCGGAGCAGTTGCTTAATTTCCTTGCTG | ||
|
For L-313 vector cloning Forward:TCCCGAATTCGCTAGCGCCACCATGGGGAAGGAGCAGG Reverse:CCGCTTTACTTGTACATCACTCCAGCATGGC | ||
| Syd1a | Mouse |
For mutagenesis Forward: GGGACTGCTCACGCTCCACCAGGAGTTGCAGAGGGAGCCCG Reverse: CGGGCTCCCTCTGCAACTCCTGGTGGAGCGTGAGCAGTCCC |
|
For L-313 vector cloning (including HA tag) Forward: TCCCGAATTCGCTAGCGCCACCATGTACCCCTACGACG Reverse: CCGCTTTACTTGTACATCAGAGGCACACATTGATC | ||
| Ena | Human |
For L-313 vector cloning Forward: TCCCGAATTCGCTAGCGCCACCATGAGTGAACAGAGTATCTGTCA Reverse: CCGCTTTACTTGTACACTATGCAGTATTTGACTTGCTC |
| Abl1 | Human |
For L-313 vector cloning (including HA tag) Forward: TCCCGAATTCGCTAGCGCCACCATGTATCCTTACGACGTGCC Reverse: CCGCTTTACTTGTACATTACCTCTGCACTATGTCACT |
| Mim-b | Human |
For L-313 vector cloning Forward: TCCCGAATTCGCTAGCGCCACCATGGAGGCTGTGATTGAGAA Reverse: CCGCTTTACTTGTACA CTAAGAAAAGCGAGGGGC |
| Cask | Rat |
For mutagenesis Forward: GCGGAATTCGCCACCATGGAGACAGACACACTCC Reverse: CGCGTCGACGGTGATTGGGTCCAAAGTTG |
|
For L-313 vector cloning Forward: TCCCGAATTCGCTAGCGCCACCATGGCCGACGACGA Reverse: CCGCTTTACTTGTACACTAATAGACCCAGGAGACCG |
Antibodies
The following antibodies were obtained commercially: mouse monoclonal anti-HA (clone 16B12; BioLegend, RRID:AB_2565006); rabbit polyclonal anti-HA (Sigma, RRID:AB_260070); mouse monoclonal anti-GAD67 (clone 1G10.2; Millipore, RRID:AB_2278725); rabbit polyclonal anti-VGLUT1 (Synaptic Systems, RRID:AB_887880); mouse monoclonal anti-PTPσ (clone 17G7.2; MediMabs; RRID:AB_1808357); rabbit polyclonal anti-Nlgn2 (Synaptic Systems, RRID:AB_993011); rabbit monoclonal anti-TrkC (clone C44H5; Cell Signaling; RRID:AB_2155283); rabbit monoclonal anti-Enah (Cell Signaling; RRID:AB_1031036); mouse monoclonal anti-ABL (clone 8E9; BD Bioscience; RRID:AB_2220994); rabbit polyclonal anti-GABAAγ2 (Synaptic Systems; RRID:AB_2263066); rabbit polyclonal anti-RIM-BP2 (Synaptic Systems 316 103; RRID:AB_2620052); rabbit polyclonal anti-SYD1A (Fitzgerald; RRID:AB_10811953); mouse monoclonal anti-CASK (clone K56A/50; NeuroMab, RRID:AB_2068730); mouse monoclonal anti-ELKS1 (clone ELKS-30; Sigma Millipore, RRID:AB_2100013); rabbit polyclonal anti-Nrxn1α antibody (Millipore; RRID:AB_10917110); and mouse monoclonal anti-Csp2 (Developmental Studies Hybridoma Bank, RRID:AB_10805296). Rabbit polyclonal anti-Caskin-1 antibody was a gift from Katsuhiko Tabuchi (Shinshu University, Japan). Rat polyclonal anti-PTPδ antibody was a gift from Fumio Nakamura (Yokohama City University, Japan). Rabbit polyclonal anti-pan-SHANK antibody (1172; RRID:AB_2810261), rabbit polyclonal anti-ELKS2/ERC2 antibody (1292), and rabbit polyclonal anti-GluA1 (1193) antibodies were gifts from Eunjoon Kim (KAIST, Korea), respectively.
Animals
Floxed PTPσ (PTPσf/f) mice were described previously (Han et al., 2020). All mice were housed under standard, temperature-controlled laboratory conditions on a 12:12 light/dark cycle (lights on at 9:00 A.M.), and received water and food ad libitum. Animal care and use conformed to the guidelines and protocols (Daegu Gyeongbuk Institute of Science and Technology IACUC-17122104-01) for rodent experimentation approved by the Institutional Animal Care and Use Committee of Daegu Gyeongbuk Institute of Science and Technology.
Cell culture
HEK293T cells were cultured in DMEM (WELGENE) supplemented with 10% FBS Welgene and 1% penicillin-streptomycin (Thermo Fisher Scientific) at 37°C in a humidified 5% CO2 atmosphere. All procedures were performed according to the guidelines and protocols for rodent experimentation approved by the Institutional Animal Care and Use Committee of Daegu Gyeongbuk Institute of Science and Technology.
Surface biotinylation assays
Cultured PTPσf/f neurons were infected with recombinant lentiviruses expressing ΔCre (control) or Cre recombinase at DIV4. The infected neurons at DIV13 were washed twice with ice-cold PBS, incubated with 1 mg/ml Sulfo-NHS-LC-biotin (Pierce) in ice-cold PBS for 30 min on ice, rinsed briefly 3 times with 0.1 m glycine in PBS, and incubated with 0.1 m glycine in PBS for 15 min at room temperature to completely quench biotin reactions. The cells were lysed with lysis buffer (1% Triton X-100, 0.1% SDS, 5 mm EDTA, 2 mm DTT, and protease inhibitors) and incubated for 30 min at 4°C. After removing the cell debris by centrifugation, 200 μg of lysates was incubated with streptavidin agarose beads (Pierce) for 4 h at 4°C. The beads were washed 3 times with lysis buffer. Surface-labeled proteins were eluted with the sample buffer, and analyzed by immunoblotting using the indicated antibodies.
Cell-surface binding assays
Recombinant Fc-fusion Nrxn1 splice variant proteins (Nrxn1α−ss4, Nrxn1α+SS4, Nrxn1β-SS4, and Nrxn1β+SS4) were produced in HEK293T cells. HEK293T cells were transfected with Nrxn1 splice variant constructs or pCMV-IgC empty vector for 72 h. The media of transfected cells were collected, and 50 mm HEPES (pH 7.4) and 0.5 mm EDTA were added. Soluble Fc-fusion proteins were purified using protein A-Sepharose beads (GE Healthcare). Pulled-down proteins were eluted with 0.1 m glycine, pH 2.2, and then neutralized with 1 m Tris-HCl, pH 8.0. HEK293T cells expressing HA-PTPσ splice variants were incubated with 10 μg/ml of indicated Fc-fusion Nrxn1 variants or Nrxn3α-Fc. Images were acquired using a confocal microscope (LSM800; Carl Zeiss).
Affinity measurement
HEK293T cells were transfected with the indicated constructs. After 48 h, cells were incubated with DMEM containing 50 mm HEPES, pH 7.4, 2 mm CaCl2, 2 mm MgCl2, and the indicated concentrations of Nrxn1α−SS4-Fc or Nrxn1β-SS4-Fc for 2 h at 4°C. The cells were washed twice with ice-cold PBS, fixed with 4% PFA/4% sucrose in PBS for 10 min at 4°C, and washed twice with ice-cold PBS. Fixed cells were incubated with blocking solution (3% horse serum/0.1% BSA in PBS) for 1 h at room temperature, then incubated with an HRP-conjugated rabbit anti-human IgG antibody (Sigma Millipore) in blocking solution for 1 h at room temperature. The cells were then washed 3 times with ice-cold PBS, after which a colorimetric 3,3′,5,5′-tetramethylbenzidine peroxidase enzyme immunoassay (Bio-Rad) was conducted according to the manufacturer's instructions.
Pulldown assays
For in vitro pulldown assays, HEK293T cells were transiently transfected with HA-tagged PTPσ constructs (WT or AAAA). After incubating for 48 h, cells were lysed and cell lysates were incubated with protein-A Sepharose bead-conjugated Fc-fusion proteins for 2 h at 4°C with gentle agitation. The beads were collected, washed 3 times with lysis buffer, and analyzed by SDS-PAGE and immunoblotting. For in vivo pulldown assays, 10 μg of purified Fc fusion proteins was incubated with 30 μl of a 1:1 suspension of glutathione-Sepharose beads or Protein-A-Sepharose beads for 2 h at 4°C with gentle rotation. The beads were collected, washed 2 times with lysis buffer, and incubated with 1 mg of mouse brain P2 fraction for 2 h at 4°C. The proteins were then precipitated, washed 3 times with lysis buffer, and analyzed by SDS-PAGE and immunoblotting.
Direct protein interaction assays
For direct interaction assays, 10 μg of IgC (control) or Ig-Nrxn1α−SS4 was incubated with 5 μg of purified HA-PTPσ Ig1-3 for 2 h at 4°C in binding buffer (25 mm Tris, pH 7.5, 30 mm MgCl2, 40 mm NaCl, and 0.5% Trion X-100). Sepharose CL-4B resins beads (GE Healthcare) were then added to purified protein mixtures as indicated, and incubated for 2 h at 4°C. Beads were washed 3 times with binding buffer, solubilized in SDS sample buffer, and loaded onto SDS-PAGE gels for immunoblot analyses. Anti-HA antibodies were used for immunoblotting.
Coimmunoprecipitation assays
Mouse brain homogenates from P42 mice were incubated with anti-PTPσ antibody overnight at 4°C, after which 30 μl of a 1:1 suspension of protein A-Sepharose (Incospharm) was added, and the mixture was incubated for 2 h at 4°C with gentle rotation. In detail, mouse brains were homogenized in 10 ml of ice-cold homogenization buffer consisting of 320 mm sucrose, 5 mm HEPES-NaOH, pH 7.5, 1 mm EDTA, 0.2 mm PMSF, 1 μg/ml aprotinin, 1 μg/ml leupeptin, 1 μg/ml pepstatin, and 1 mm Na3VO4. The homogenized tissue was centrifuged at 2000 × g for 15 min, and then the supernatant was centrifuged at 16,000 × g for 30 min. The pellets were homogenized in buffer consisting of 20 mm HEPES-NaOH, pH 7.5, 0.15 m NaCl, 2 mm CaCl2, 2 mm MgCl2, 0.2 mm PMSF, 1 μg/ml aprotinin, 1 μg/ml leupeptin, 1 μg/ml pepstatin, and 1 mm Na3VO4. Triton X-100 was added to a final concentration of 1% (w/v) and dissolved with constant stirring at 4°C for 1 h. Supernatants obtained after centrifugation at 16,000 × g for 30 min were used for coimmunoprecipitation assays. The beads were pelleted and washed 3 times with lysis buffer (20 mm HEPES-NaOH, pH 7.5, 0.15 m NaCl, 2 mm CaCl2, 2 mm MgCl2, 1% Triton X-100, 0.2 mm PMSF, 1 μg/ml aprotinin, 1 μg/ml leupeptin, 1 μg/ml pepstatin, and 1 mm Na3VO4). Immune complexes were then resolved by SDS-PAGE and immunoblotted with anti-Nrxn1 antibodies.
qRT-PCR in cultured neurons
For production of recombinant lentiviruses, HEK293T cells were transfected with three plasmids (lentivirus vectors, psPAX2, and pMD2G) at a 2:2:1 ratio using FuGene-6 (Roche Diagnostics), according to the manufacturer's protocol, as previously described (Ko et al., 2011). After 72 h, lentiviruses were harvested by collecting the media from transfected HEK293T cells and briefly centrifuging at 1000 × g to remove cellular debris. Filtered media containing 5% sucrose were centrifuged at ∼118,000 × g for 2 h, after which supernatants were removed and washed with ice-cold PBS. The virus pellet was resuspended in 80 μl of PBS. The detailed oligonucleotide sequences of probes for qRT-PCR are listed in Table 4.
Table 4.
Oligonucleotides for qRT-PCRs used in the current study
| Gene | Oligo sequence (5′−3′) | Reference |
|---|---|---|
| Ptprs | Forward: GAACCGATACGCCAATGTCA Reverse: TCACTACCCATGATGCCTTCTAAA |
Yim et al., 2013 |
| Ptprd | Forward: GGCGGATTGCAGCATAGG Reverse: TGGTGCGGAGCACATCTG |
Yim et al., 2013 |
| β-catenin | Forward: TTCCTGAGCTGACCAAACTG Reverse: GCACTATGGCAGACACCATC |
Han et al., 2018 |
| Abl1/2 | Forward: CATCTCGCTGCGGTATGAAG Reverse: CTTGCCATCAGAGGCAGTGTT |
Current study |
| p250RhoGAP | Forward: GACCTGGAAGGTGAACAGGT Reverse: TGGACTTTACGGGATCCTTC |
Current study |
| Ena | Forward: ACGAGACGGTCATTTGTTCC Reverse: CGGAAAGAGTTAGCAGTGGG |
Current study |
| Mim-b | Forward: CCCACCTTCAGACCATATCAGAAG Reverse: CGAGGAGGGCAGTTTGTGA |
Current study |
| Cask | Forward: GGAGAATGTGACCAGAGTTCG Reverse: AGTGTACCTTGCCTGTGAATC |
Current study |
| Caskin-1 | Forward: TGGCCTCTGTAAAGCACAAAGA Reverse: GCGAGCAGTGGCCAAAAGT |
Current study |
| Caskin-2 | Forward: GCCAGCCGGGAAATCAA Reverse: GCGCTCGAACCTTCAAGATC |
Current study |
| Rim1 | Forward: CCAAATCGGGATGGAGGATAAG Reverse: ATAGGGAGCGGGTGTAGATT |
Current study |
| Rimbp1 | Forward: GGTATGTCAGAGCTTGGAGTTC Reverse: CTCTTCCTCCTCTTCCTCTTCT |
Current study |
| Rimbp2 | Forward: GCCTTGATGTCTGGCCTTAT Reverse: ACTGTGTCAGTGAGGTTGAAG |
Current study |
| Liprin-α2 | Forward: CTGCCTCTCTTGAGCCAGATAGA Reverse: TGAAGAGAGTCCTGGCTGCTATT |
Han et al., 2018 |
| Liprin-α3 | Forward: CTGCCCCAGTACCGAAGCT Reverse: TGGTCCAACATCCGAGCAT |
Han et al., 2018 |
| Piccolo | Forward: GGAACAGCAACAGAGGAAGAG Reverse: TCCTCGATGGGAGAGAGATTAC |
Current study |
| Elks1 | Forward: GATGGCTATGGAGAAGGTGAAG Reverse: GGAGGTTGGTTAGATGTGTCTC |
Current study |
| Elks2 | Forward: GGAGTTATCTGCCTCCAAGAAG Reverse: CTATTCTGGGTCTGCTGCTTTA |
Current study |
| Trio | Forward: AGAGTCCATGCTGAATGCTG Reverse: TCTCAATAGCGTGCTGGAAC |
Current study |
| Syd1a | Forward: AGATGAGGATGAGAGTGGAGAG Reverse: CAGGATGAGGGCATCAAAGT |
Current study |
| N-cadherin | Forward: TGGAAGGCAATCCCACTTAC Reverse: CGTAGAAGGTCATGGCAGTAAA |
Han et al., 2018 |
Semiquantitative immunoblot analyses
Cultured cortical rat neurons were infected with the indicated recombinant lentiviruses at DIV4. Neurons were lysed at DIV11, and immunoblotting analyses were performed using the indicated antibodies. The immunoblot images were quantified using ImageJ software (Fiji, RRID:SCR_002285). Immunoblotting signals were normalized relative to those of β-actin (used as an internal control).
Heterologous synapse-formation assays
Cultured hippocampal neurons were infected with the indicated virus at DIV4. Forty-eight hours after transfecting with the indicated expression vectors, HEK293T cells were trypsinized, seeded onto cultured hippocampal neurons, and cocultured for 6-72 h, as indicated. Cocultured neurons were coimmunostained with antibodies against the indicated antibodies. Images were acquired by confocal microscopy (LSM780, Carl Zeiss). Results were quantified by measuring the fluorescence intensities of synaptic marker puncta in randomly selected transfected HEK293 cells (ROI), normalized with respect to the area of each cell. Results were quantified for both red and green channels using MetaMorph Software (Molecular Devices, RRID:SCR_002368).
Primary neuronal culture, infections, immunocytochemistry, image acquisition, and analysis
Hippocampal and cortical rat neuron cultures were prepared from embryonic day 18 (E18) rat embryos, as described (Um et al., 2020). Cultured neurons were infected with the indicated lentiviruses at DIV4, and immunostained at DIV12 or DIV14. For immunocytochemistry, cultured rat neurons were fixed with 4% PFA/4% sucrose in PBS for 10 min at 4°C, and permeabilized with 0.2% Triton X-100 in PBS for 10 min at 4°C. Neurons were then blocked by incubating with 3% horse serum/0.1% BSA in PBS for 15 min at room temperature, then stained with the indicated primary and secondary antibodies for 70 min at room temperature. z-stack images of randomly selected neurons were acquired using a confocal microscope (LSM780, Carl Zeiss) with a 63× objective lens. Obtained z-stack images were converted to maximal projections, and puncta size, intensity, and density were analyzed for the indicated synaptic marker proteins in a blinded manner using MetaMorph software (Molecular Devices).
Drosophila stocks
Drosophila strains were raised on a standard yeast, sugar, and agar medium at 25°C. The w1118 strain was used as the WT control. Dlar5.5 and Df(2L)E55 (a deficiency covering the lar locus) were obtained from David Van Vactor (Harvard Medical School) (Krueger et al., 1996), and DnrxΔ83 was obtained from Junhai Han (Southeast University) (Zeng et al., 2007).
Immunohistochemistry and imaging of Drosophila larval neuromuscular junction (NMJ)
Wandering third-instar larvae were dissected in Ca2+-free HL3.1 saline (70 mm NaCl, 5 mm KCl, 4 mm MgCl2, 10 mm NaHCO3, 5 mm trehalose, 115 mm sucrose, and 5 mm HEPES) and fixed in 4% formaldehyde/PBS or Bouin's fixative for 20 min or 10 min, respectively. Fixed samples were washed with PBS containing 0.1% Triton X-100 (PBST) and blocked in 5% BSA in PBST for 1 h. Samples were incubated with primary antibodies at 4°C overnight. After several washes with PBST, samples were incubated with secondary antibodies for 1 h at room temperature. For immunohistochemistry, the following antibodies were used: anti-Csp2 mAb 6D6 (1:1000), FITC-conjugated anti-HRP (1:200), and Cy3-conjugated anti-mouse secondary antibodies (1:200). Fluorescence images were acquired with an LSM 700 laser-scanning confocal microscope (Carl Zeiss) with ZEN imaging software using a C-Apo 40 × 1.20 W objective. For comparisons between genotypes, samples were processed simultaneously with controls in the same tube and imaged under identical confocal settings. All quantifications were performed at NMJ 6/7 in the A2 segment.
Drosophila NMJ recordings
Two-electrode voltage-clamp recordings of wandering third-instar larvae NMJs were obtained at room temperature, as described previously, with modifications (Choi et al., 2018). All dissections and recordings were performed in HL3.1 saline. Larvae were dissected in Ca2+-free saline to minimize muscle contraction, and subsequent two-electrode voltage-clamp recordings were performed in saline containing 2 mm Ca2+. Muscle 6 in abdominal segments 3 or 4 was impaled with two microelectrodes (resistance, 10-15 mΩ) filled with 3 m KCl. Recordings were made from cells with an initial resting membrane potential negative to −60 mV at a holding potential of −80 mV with a GeneClamp 500 amplifier (Molecular Devices). The severed motor nerve was stimulated with a fire-polished glass suction electrode at a suprathreshold level (5 mA) for 0.2 ms. Signals were acquired with Axoscope 10.3 (Molecular Devices), filtered at 10,000 Hz, and analyzed with Clampfit 10.3 (Molecular Devices).
Quantification and statistical analysis
Data analysis and statistical tests were performed using GraphPad Prism7.0 software (RRID:SCR_002798). Heterologous synapse-formation assays and surface-binding assays were quantified by randomly selecting transfected HEK293T cells as the ROI. The fluorescence intensities of synaptic marker puncta or Fc-fusion proteins were normalized to transfected protein signal intensities using MetaMorph Software (Molecular Devices). All data are expressed as mean ± SEM unless stated otherwise, and significance is indicated with an asterisk. All experiments were performed using at least 3 independent mice, cultures, and/or cohorts of grouped mice, and the normality of data distributions was evaluated using the Shapiro-Wilk test. Data were compared using Student's t test or ANOVA using a nonparametric Kruskal–Wallis test, followed by Dunn's multiple comparison test for post hoc group comparisons, t test, Mann–Whitney U test, or Fisher's least significance difference; n is indicated in the figure legends. Numbers shown indicate replicates, and tests used to determine statistical significance are stated in the text and legends of figures depicting the results of the respective experiments. A p value < 0.05 was considered statistically significant, and individual p values are indicated in the respective figure legends.
Results
PTPσ and PTPδ are required for presynaptic differentiation activity mediated by Nrxn1
Prior studies showed that Nrxns and LAR-RPTPs are responsible for mediating presynaptic assembly induced by various postsynaptogenic ligands (Gokce and Südhof, 2013; Han et al., 2018). Intriguingly, Nrxns and LAR-RPTPs use distinct mechanisms to drive presynaptic assembly (Han et al., 2019), although both share common pathways involving liprin-α (Han et al., 2018). However, intracellular sequences of Nrxns are dispensable in this process, suggesting that Nrxns may require the presence of coreceptor(s) to transduce trans-synaptic signals during presynaptic assembly. On the basis of a recent study showing that HS binding to Nrxn ligands is involved in synaptic development, which hinted at this possibility (Zhang et al., 2018), we hypothesized that the presence of LAR-RPTPs is required for Nrxns. To test this hypothesis, we performed an extensive series of heterologous synapse-formation assays (Fig. 1). Specifically, we tested whether loss of PTPσ, PTPδ, or Nrxns exerted any effect on the synapse-inducing ability of Nlgn1 or Slitrk6. To knockdown (KD) PTPσ, PTPδ, or Nrxns in cultured hippocampal neurons, we used previously characterized lentiviral small hairpin RNAs (shRNAs) against PTPσ (Yim et al., 2013), PTPδ (Yim et al., 2013), or Nrxns (Um et al., 2014). Deletion effects during the early phase of presynaptic assembly were monitored by coculturing neurons with heterologous cells for only 12-24 h, instead of 72 h culture period used in our previous studies (Yim et al., 2013; Um et al., 2014, 2016; Han et al., 2018). Strikingly, PTPσ KD (sh-PTPσ) decreased Nlgn1 activity at excitatory, but not inhibitory, synapses in cultured neurons incubated with heterologous cells for a 12 h period (Fig. 1A,B). Conversely, PTPδ KD (sh-PTPδ) significantly reduced Nlgn1 activity at inhibitory, but not excitatory, synapses (Fig. 1A,B). This PTPσ KD effect was not recapitulated by a 6 h culture period, or a 24 h period (Fig. 2). The PTPσ KD effect was also not observed after prolonged culture (i.e., 72 h), whereas the Nrxn triple KD (sh-Nrxns) effect was maintained in parallel culture (Extended Data Fig. 2-1), suggesting that, unlike Nrxns, PTPσ might be responsible for timed maturation of presynaptic assembly. We also infected cultured hippocampal neurons from PTPσ floxed mice with recombinant lentiviruses expressing inactive Cre (ΔCre, control) and active Cre recombinase, and performed heterologous synapse formation assays. We found that the synaptogenic activities of Nlgn1 and Slitrk6 were significantly reduced in PTPσ KO neurons, effects similar to those in PTPσ KD neurons (Fig. 1C,D). PTPσ KO, however, did not influence surface expression and localization of Nrxn1α at presynaptic axonal boutons in cultured hippocampal neurons (Extended Data Fig. 1-1). We confirmed that sh-Nrxns significantly reduced the synaptogenic activity of Nlgn1 at excitatory synapses, but reduced that of Slitrk6 only at inhibitory synapses (Gokce and Südhof, 2013) (Fig. 1A,B). These results suggest that PTPσ and PTPδ are required for Nrxns at distinct synapse types that mediate synaptogenic activity through their postsynaptic ligands.
Figure 1.
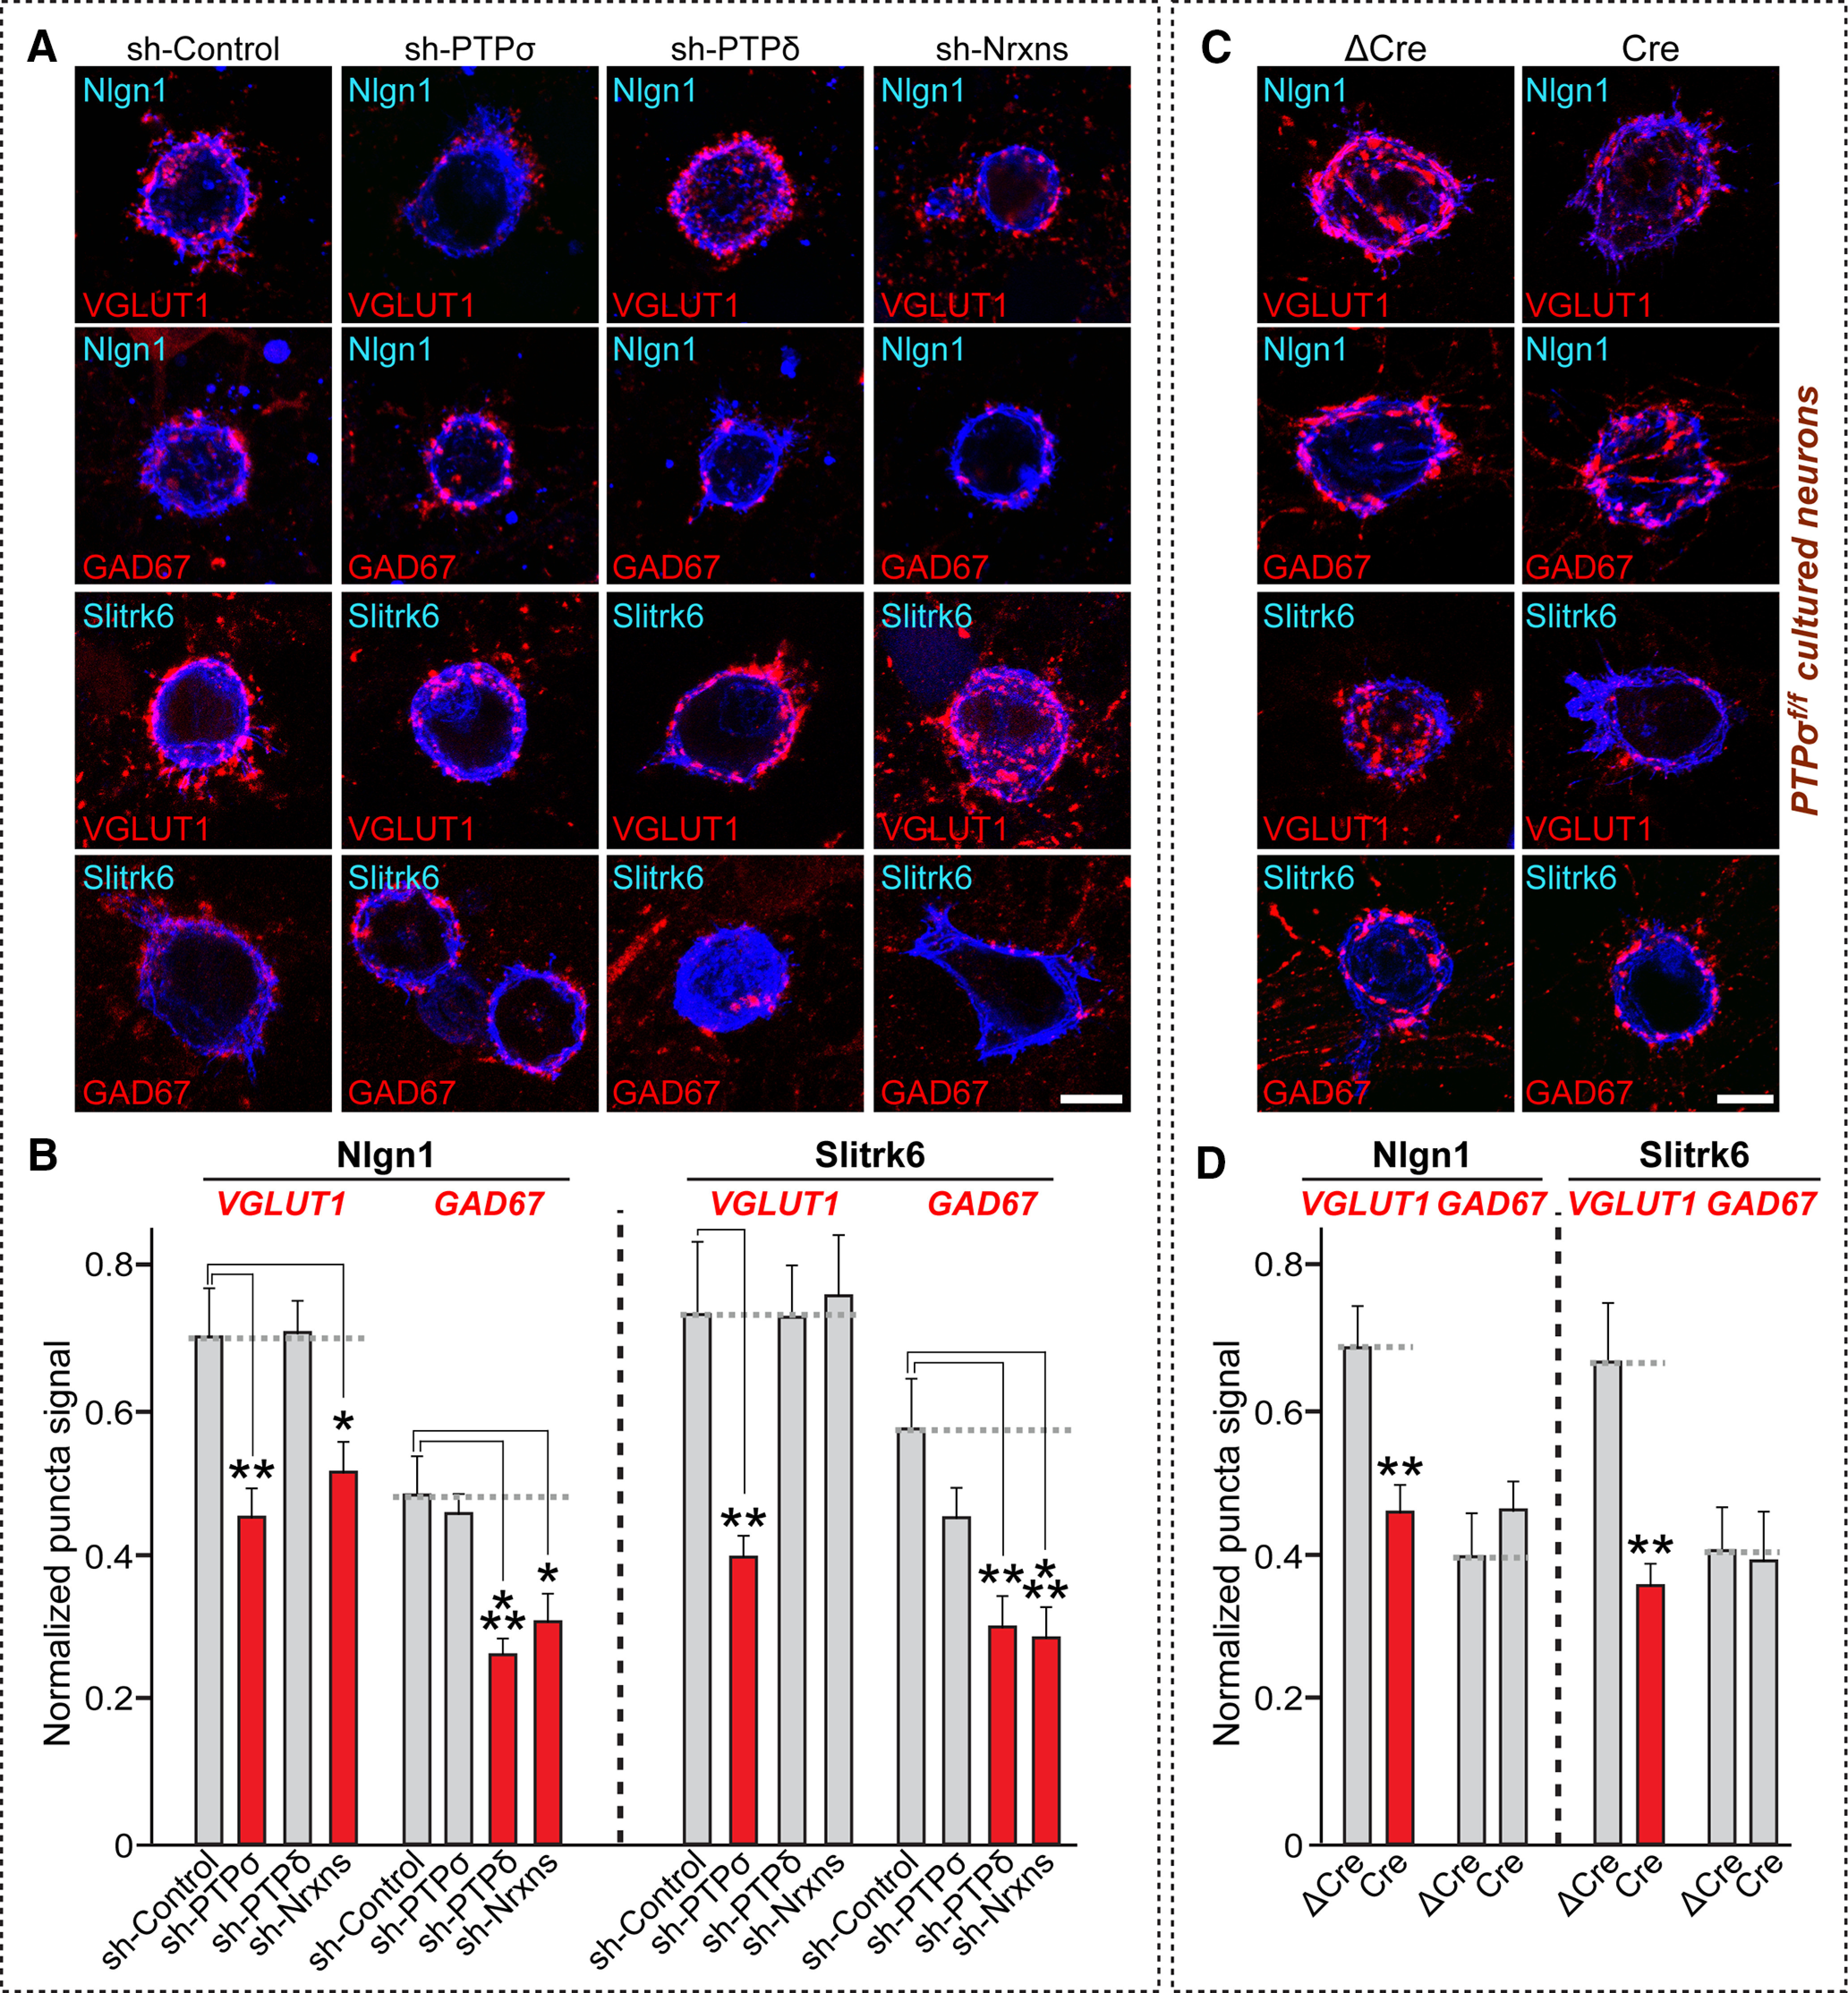
PTPσ and PTPδ are required for Nrxns-mediated presynaptic assembly at excitatory and inhibitory synapses, respectively. A, Representative images of the heterologous synapse-formation activity of Nlgn1 and Slitrk6 in PTP-KD or Nrxn-KD neurons. Cultured hippocampal neurons were infected with the indicated lentiviruses at DIV4, and HEK293T cells expressing HA-tagged Nlgn1 or Slitrk6 were cocultured at DIV12 for 12 h (Nlgn1) or 24 h (Slitrk6). Synaptogenic activities were analyzed by double-immunostaining for HA (blue) and VGLUT1 (red) or GAD67 (red). Scale bar, 10 μm. B, Quantification of synaptogenic activities in A by measuring red staining intensity normalized to blue staining intensity. Data are mean ± SEM. *p < 0.05; **p < 0.01; ***p < 0.001; ANOVA with a nonparametric Kruskal–Wallis test. n indicates the number of neurons as follows: sh-Control/Nlgn1/VGLUT1, n = 31; sh-PTPσ/Nlgn1/VGLUT1, n = 24; sh-PTPδ/Nlgn1/VGLUT1, n = 28; sh-Nrxns/Nlgn1/VGLUT1, n = 28; sh-Control/Nlgn1/GAD67, n = 30; sh-PTPσ/Nlgn1/GAD67, n = 34; sh-PTPδ/Nlgn1/GAD67, n = 32; sh-Nrxns/Nlgn1/GAD67, n = 20; sh-Control/Slitrk6/VGLUT1, n = 15; sh-PTPσ/Slitrk6/VGLUT1, n = 18; sh-PTPδ/Slitrk6/VGLUT1, n = 18; sh-Nrxns/Slitrk6/VGLUT1, n = 16; sh-Control/Slitrk6/GAD67, n = 13; sh-PTPσ/Slitrk6/GAD67, n = 15; sh-PTPδ/Slitrk6/GAD67, n = 13; and sh-Nrxns/Slitrk6/GAD67, n = 14. p values for individual comparisons are as follows: sh-Control versus sh-PTPσ/Nlgn1/VGLUT1, p = 0.0035; sh-Control versus sh-PTPδ/Nlgn1/VGLUT1, p > 0.9999; sh-Control versus sh-Nrxns/Nlgn1/VGLUT1, p = 0.0391; sh-Control versus sh-PTPσ/Nlgn1/GAD67, p > 0.9999; sh-Control versus sh-PTPδ/Nlgn1/GAD67, p = 0.0009; sh-Control versus sh-Nrxns/Nlgn1/GAD67, p = 0.0153; sh-Control versus sh-PTPσ/Slitrk6/VGLUT1, p = 0.0024; sh-Control versus sh-PTPδ/Slitrk6/VGLUT1, p > 0.9999; sh-Control versus sh-Nrxns/Slitrk6/VGLUT1, p > 0.9999; sh-Control versus sh-PTPσ/Slitrk6/GAD67, p = 0.938; sh-Control versus sh-PTPδ/Slitrk6/GAD67, p = 0.0024; and sh-Control versus sh-Nrxns/Slitrk6/GAD67, p = 0.0004. C, Representative images of showing the heterologous synapse-formation activity of Nlgn1 and Slitrk6 in PTPσ-KO neurons. Cultured hippocampal neurons were infected with ΔCre or Cre viruses at DIV4, and HEK293T cells expressing HA-tagged Nlgn1 or Slitrk6 for 12 h (Nlgn1) or 24 h (Slitrk6). Synaptogenic activities were analyzed by double-immunostaining for HA (blue) and VGLUT1 (red) or GAD67 (red). Scale bar, 10 μm. For analyzing effects of PTPσ KO on surface expression or presynaptic localization of Nrxn1α, see Extended Data Figure 1-1. D, Quantification of synaptogenic activities in C by measuring red staining intensity normalized to blue staining intensity. Data are mean ± SEM. **p < 0.01; Mann–Whitney U test. n indicates the number of cells as follows: ΔCre/Nlgn1/VGLUT1, n = 16; Cre/Nlgn1/VGLUT1, n = 25; ΔCre/Nlgn1/GAD67, n = 15; Cre/Nlgn1/GAD67, n = 17; ΔCre/Slitrk6/VGLUT1, n = 15; Cre/Slitrk6/VGLUT1, n = 13; ΔCre/Slitrk6/GAD67, n = 12; and Cre/Slitrk6/GAD67, n = 12. p values for individual comparisons are as follows: ΔCre versus Cre/Nlgn1/VGLUT1, p = 0.0018; ΔCre versus Cre/Nlgn1/GAD67, p = 0.2777; ΔCre versus Cre/Slitrk6/VGLUT1, p = 0.0015; and ΔCre versus Cre/Slitrk6/GAD67, p = 0.7987.
Figure 2.

PTPσ is required for timed presynaptic differentiation. A, B, Representative images of heterologous synapse-formation assays. Cultured hippocampal neurons were infected with the indicated lentiviruses at DIV4, and cocultured with mVenus-fused Nlgn1 (A) or Slitrk6-expressing (B) HEK293T cells at DIV12 for 6, 12, or 24 h. Synaptogenic activities were analyzed by double-immunostaining for HA/EGFP (blue) and VGLUT1 (red). Scale bar, 10 μm. For additional results, see Extended Data Figure 2-1. C, D, Synapse-formation activities in A and B were quantified by measuring the ratio of VGLUT1 staining intensity (red) to HA/EGFP intensity (blue). Data are mean ± SEM. *p < 0.05; **p < 0.01; ***p < 0.001; ****p < 0.0001; ANOVA with a nonparametric Kruskal–Wallis test. n indicates the number of cells as follows: sh-Control/Nlgn1 (6 h), n = 14; sh-PTPσ/Nlgn1 (6 h), n = 13; sh-PTPδ/Nlgn1 (6 h), n = 12; sh-Nrxns/Nlgn1 (6 h), n = 14; sh-Control/Slitrk6 (6 h), n = 10; sh-PTPσ/Slitrk6 (6 h), n = 11; sh-PTPδ/Slitrk6 (6 h), n = 13; and sh-Nrxns/Slitrk6 (6 h), n = 11; sh-Control/Nlgn1 (12 h), n = 13; sh-PTPσ/Nlgn1 (12 h), n = 14; sh-PTPδ/Nlgn1 (12 h), n = 12; sh-Nrxns/Nlgn1 (12 h), n = 13; sh-Control/Slitrk6 (12 h), n = 12; sh-PTPσ/Slitrk6 (12 h), n = 11; sh-PTPδ/Slitrk6 (12 h), n = 11; sh-Nrxns/Slitrk6 (12 h), n = 11; sh-Control/Nlgn1 (24 h), n = 14; sh-PTPσ/Nlgn1 (24 h), n = 13; sh-PTPδ/Nlgn1 (24 h), n = 14; sh-Nrxns/Nlgn1 (24 h), n = 14; sh-Control/Slitrk6 (24 h), n = 15; sh-PTPσ/Slitrk6 (24 h), n = 12; sh-PTPδ/Slitrk6 (24 h), n = 13; and sh-Nrxns/Slitrk6 (24 h), n = 12; sh-Control/Control (24 h), n = 10; sh-PTPσ/Control (24 h), n = 10; sh-PTPδ/Control (24 h), n = 9; sh-Nrxns/Control (24 h), n = 11. p values for each comparison are as follows: sh-Control versus sh-PTPσ/Nlgn1 (6 h), p > 0.9999; sh-Control versus sh-PTPδ/Nlgn1 (6 h), p > 0.9999; sh-Control versus sh-Nrxns/Nlgn1 (6 h), p > 0.9999; sh-Control versus sh-PTPσ/Slitrk6 (6 h), p = 0.0575; sh-Control versus sh-PTPδ/Slitrk6 (6 h), p > 0.9999; and sh-Control versus sh-Nrxns/Slitrk6 (6 h), p > 0.9999; sh-Control versus sh-PTPσ/Nlgn1 (12 h), p = 0.0002; sh-Control versus sh-PTPδ/Nlgn1 (12 h), p = 0.2086; sh-Control versus sh-Nrxns/Nlgn1 (12 h), p < 0.0001; sh-Control versus sh-PTPσ/Slitrk6 (12 h), p > 0.9999; sh-Control versus sh-PTPδ/Slitrk6 (12 h), p > 0.9999; sh-Control versus sh-Nrxns/Slitrk6 (12 h), p > 0.9999; sh-Control versus sh-PTPσ/Nlgn1 (24 h), p > 0.9999; sh-Control versus sh-PTPδ/Nlgn1 (24 h), p = 0.5651; sh-Control versus sh-Nrxns/Nlgn1 (24 h), p = 0.0071; sh-Control versus sh-PTPσ/Slitrk6 (24 h), p = 0.0215; sh-Control versus sh-PTPδ/Slitrk6 (24 h), p = 0.8652; and sh-Control versus sh-Nrxns/Slitrk6 (24 h), p > 0.9999; sh-Control versus sh-PTPσ/Control (24 h), p = 0.6487; sh-Control versus sh-PTPδ/Control (24 h), p = 0.6644; sh-Control versus sh-Nrxns/Control (24 h), p > 0.9999.
PTPσ loss does not influence surface expression or presynaptic localization of Nrxn1α. A, B, Representative immunoblot images (A) and summary bar graphs (B) quantifying the surface expression levels of endogenous Nrxn1α in PTPσf/f neurons infected with lentiviruses expressing ΔCre (control) or Cre recombinase. Individual band intensities were normalized to input lanes. Data are mean ± SEM. n = 3 independent experiments). C, Representative images of cultured neurons (DIV10) derived from PTPσf/f mice infected with lentiviruses expressing ΔCre or Cre at DIV3 and transfected with FLAG-tagged Nrxn1α (red) at DIV8. Anti-synapsin (green) was used to mark the presynaptic vesicles. Scale bar, 10 μm. D, Quantification of Nrxn1α puncta enrichment at presynaptic vesicles for the images in (C). Data are mean ± SEMs (n denotes the number of analyzed neurons; ΔCre, n = 15; Cre, n = 11; Mann–Whitney U test). Download Figure 1-1, TIF file (3.7MB, tif) .
PTPσ is not required for the late phase of presynaptic differentiation. A, Representative images of the results of heterologous synapse-formation assays. Cultured hippocampal neurons were infected with the indicated lentiviruses at DIV4, starting at DIV12, cocultured with mVenus-fused Nlgn1-expressing HEK293T cells for 12, 24, 48 or 72 hr. Synaptogenic activities were analyzed by double-immunostaining for EGFP (blue) and VGLUT1 (red). Scale bar, 10 μm. B, Quantification of the synapse-formation activities of the images in panel A by measuring the ratio of VGLUT1 staining intensity (red) to EGFP intensity (blue). Data are mean ± SEMs (*p < 0.05; **p < 0.01; ***p < 0.001; ANOVA with nonparametric Kruskal–Wallis tests). n indicates the number of neurons as follows: sh-Control/Nlgn1 (12 h), n = 12; sh-PTPσ/Nlgn1 (12 h), n = 15; sh-PTPδ/Nlgn1 (12 h), n = 12; sh-Nrxns/Nlgn1 (12 h), n = 12; sh-Control/Nlgn1 (24 h), n = 11; sh-PTPσ/Nlgn1 (24 h), n = 13; sh-PTPδ/Nlgn1 (24 h), n = 12; sh-Nrxns/Nlgn1 (24 h), n = 13; sh-Control/Nlgn1 (48 h), n = 19; sh-PTPσ/Nlgn1 (48 h), n = 15; sh-PTPδ/Nlgn1 (48 h), n = 14; sh-Nrxns/Nlgn1 (48 h), n = 18; sh-Control/Nlgn1 (72 h), n = 13; sh-PTPσ/Nlgn1 (72 h), n = 14; sh-PTPδ/Nlgn1 (72 h), n = 12; sh-Nrxns/Nlgn1 (72 h), n = 10; sh-Control/Control (48 h), n = 13; sh-PTPσ/Control (48 h), n = 13; sh-PTPδ/Control (48 h), n = 11; and sh-Nrxns/Control (48 h), n = 12. p values for individual comparisons are as follows: sh-Control versus sh-PTPσ/Nlgn1 (12 h), p = 0.0012; sh-Control versus sh-PTPδ/Nlgn1 (12 h), p > 0.9999; sh-Control versus sh-Nrxns/Nlgn1 (12 h), p = 0.0410; sh-Control versus sh-PTPσ/Nlgn1 (24 h), p > 0.9999; sh-Control versus sh-PTPδ/Nlgn1 (24 h), p = 0.9950; sh-Control versus sh-Nrxns/Nlgn1 (24 h), p = 0.0004; sh-Control versus sh-PTPσ/Nlgn1 (48 h), p > 0.9999; sh-Control versus sh-PTPδ/Nlgn1 (48 h), p > 0.9999; sh-Control versus sh-Nrxns/Nlgn1 (48 h), p = 0.0021; sh-Control versus sh-PTPσ/Nlgn1 (72 h), p > 0.9999; sh-Control versus sh-PTPδ/Nlgn1 (72 h), p > 0.9999; and sh-Control versus sh-Nrxns/Nlgn1 (72 h), p = 0.0025. Download Figure 2-1, TIF file (12.3MB, tif) .
Distinct sets of intracellular proteins are involved in Nrxn- and LAR-RPTP-mediated presynaptic assembly
It was recently shown that both Nrxn- and LAR-RPTP-mediated presynaptic differentiation require liprin-α proteins (Um and Ko, 2013; Han et al., 2018). In addition, Nrxns and LAR-RPTPs are linked to various active zone proteins, intracellular scaffolds, signaling proteins, and cytoskeletal regulators in presynaptic neurons (LaConte et al., 2016), suggesting a convergence on presynaptic signaling cascades. Thus, we tested whether various classes of presynaptic proteins are required in common for Nrxn- and LAR-RPTP-mediated presynaptic assembly. To this end, we targeted a subset of presynaptic proteins that had previously been physically and/or functionally linked to LAR-RPTPs and generated a series of shRNA vectors that most efficiently knocked down target mRNAs (for detailed KD efficacies from quantitative RT-PCR screens, see Table 1; for KD efficacies from semiquantitative immunoblot analyses, see Extended Data Fig. 3-1). Apart from the previously validated shRNA sequences, 12 shRNA sequences screened out from the current study were further tested to determine whether they actually suppress the level of their respective protein targets in cultured neurons. Ten of these shRNA sequences were shown to be effective by immunoblot analyses. We were unable, however, to obtain antibodies to TRIO and CASKIN-2 for immunoblot analyses. Surprisingly, extensive heterologous synapse-formation analyses in cultured hippocampal neurons deficient for a specific intracellular protein showed that Slitrk6 and Nlgn1 require distinct sets of these proteins to drive presynaptic differentiation at glutamatergic and/or GABAergic synapses (Fig. 3). Notably, among proteins that directly bind to the D2 domain of LAR-RPTPs, liprin-α and MIM-B, but not Trio, are required in common for both pathways. MIM-B is dispensable for PTPσ-mediated excitatory assembly, whereas Caskins act oppositely at glutamatergic and GABAergic synapses (Fig. 3). Various liprin-α-binding proteins are differentially required for both pathways: SYD1A, similar to liprin-α, is essential for all examined pathways, whereas CASK is required only for the Nrxn-mediated pathway at GABAergic synapses. Presynaptic active zones are critical at both synapse types, albeit to different extents. Infection of cultured neurons with lentiviruses expressing the scrambled version of a subset of presynaptic scaffold KD did not affect the synaptogenic activities of Nlgn1 and Slitrk6 (Fig. 4; Table 2), indicating that the shRNA vectors that exhibit some biological effects do not have off-target effects (Fig. 3). Moreover, rescue experiments using lentiviruses expressing the shRNA-resistant presynaptic scaffold protein in respective protein-deficient cultured neurons confirmed their specificity in cellular phenotype(s) determined from heterologous synapse-formation analyses (Fig. 5; see also Extended Data Fig. 5-1; Table 3; Fig. 3). Overall, our results suggest that various presynaptic proteins form distinct complexes that are differentially and selectively coupled to Nrxns and LAR-RPTPs.
Figure 3.

Distinct sets of intracellular proteins are involved in LAR-RPTP- and Nrxn-mediated presynaptic assembly. A, B, Representative images of heterologous synapse-formation activities of Nlgn1 and Slitrk6. Cultured hippocampal neurons were infected with KD lentiviruses against the indicated scaffold proteins at DIV4 and cocultured with Nlgn1- or Slitrk6-expressing HEK293T cells for 12 h (Nlgn1) or 24 h (Slitrk6). Hemi-synapse induction was analyzed by double-immunostaining for HA (blue) and VGLUT1 (red, A) or GAD67 (red, B). Scale bar, 10 μm. β-Catn, β-Catenin; N-Cad, N-cadherin. For semiquantitative immunoblot data to analyze KD efficacies of a subset of presynaptic proteins, see Extended Data Figure 3-1. C, Quantification of synapse-formation activity in A and B by measuring the ratio of red staining intensity to blue staining intensity. Data are mean ± SEM. *p < 0.05; **p < 0.01; ***p < 0.001; ****p < 0.0001; Mann–Whitney U test. Green-colored proteins represent liprin-α-binding proteins. Blue-colored proteins represent PTP substrates. Red-colored proteins represent active-zone proteins. n indicates the number of cells as follows: Control/Control/VGLUT1, n = 52; sh-liprin-α/Control/VGLUT1, n = 10; sh-Trio/Control/VGLUT1, n = 10; sh-MIM-B/Control/VGLUT1, n = 12; sh-Caskins/Control/VGLUT1, n = 10; sh-β-Catn/Control/VGLUT1, n = 13; sh-Abl/Control/VGLUT1, n = 17; sh-Ena/Control/VGLUT1, n = 16; sh-p250GAP/Control/VGLUT1, n = 12; sh-N-Cad/Control/VGLUT1, n = 10; sh-Piccolo/Control/VGLUT1, n = 10; sh-ELKS/Control/VGLUT1, n = 11; sh-SYD1A/Control/VGLUT1, n = 9; sh-CASK/Control/VGLUT1, n = 11; sh-RIM1/Control/VGLUT1, n = 9; sh-RIM-BPs/Control/VGLUT1, n = 11; sh-Control/Slitrk6/VGLUT1, n = 20; sh-liprin-α/Slitrk6/VGLUT1, n = 24; sh-Trio/Slitrk6/VGLUT1, n = 18; sh-MIM-B/Slitrk6/VGLUT1, n = 21; sh-Caskins/Slitrk6/VGLUT1, n = 33; sh-β-Catn/Slitrk6/VGLUT1, n = 17; sh-Abl/Slitrk6/VGLUT1, n = 19; sh-Ena/Slitrk6/VGLUT1, n = 20; sh-p250GAP/Slitrk6/VGLUT1, n = 18; sh-N-Cad/Slitrk6/VGLUT1, n = 28; sh-Piccolo/Slitrk6/VGLUT1, n = 21; sh-ELKS/Slitrk6/VGLUT1, n = 19; sh-SYD1A/Slitrk6/VGLUT1, n = 21; sh-CASK/Slitrk6/VGLUT1, n = 20; sh-RIM1/Slitrk6/VGLUT1, n = 19; sh-RIM-BPs/Slitrk6/VGLUT1, n = 23; sh-Control/Nlgn1/VGLUT1, n = 35; sh-liprin-α/Nlgn1/VGLUT1, n = 18; sh-Trio/Nlgn1/VGLUT1, n = 18; sh-MIM-B/Nlgn1/VGLUT1, n = 15; sh-Caskins/Nlgn1/VGLUT1, n = 16; sh-β-Catn/Nlgn1/VGLUT1, n = 16; sh-Abl/Nlgn1/VGLUT1, n = 17; sh-Ena/Nlgn1/VGLUT1, n = 18; sh-p250GAP/Nlgn1/VGLUT1, n = 17; sh-N-Cad/Nlgn1/VGLUT1, n = 17; sh-Piccolo/Nlgn1/VGLUT1, n = 16; sh-ELKS/Nlgn1/VGLUT1, n = 16; sh-SYD1A/Nlgn1/VGLUT1, n = 17; sh-CASK/Nlgn1/VGLUT1, n = 17; sh-RIM1/Nlgn1/VGLUT1, n = 16; sh-RIM-BPs/Nlgn1/VGLUT1, n = 18; sh-Control/Control/GAD67, n = 41; sh-liprin-α/Control/GAD67, n = 10; sh-Trio/Control/GAD67, n = 13; sh-MIM-B/Control/GAD67, n = 11; sh- Caskins/Control/GAD67, n = 9; sh-β-Catn/Control/GAD67, n = 13; sh-Abl/Control/GAD67, n = 12; sh-Ena/Control/GAD67, n = 13; sh-p250GAP/Control/GAD67, n = 12; sh-N-Cad/Control/GAD67, n = 10; sh-Piccolo/Control/GAD67, n = 9; sh-ELKS/Control/GAD67, n = 9; sh-SYD1A/Control/GAD67, n = 9; sh-CASK/Control/GAD67, n = 11; sh-RIM1/Control/GAD67, n = 10; sh-RIM-BPs/Control/GAD67, n = 12; sh-Control/Slitrk6/GAD67, n = 23; sh-liprin-α/Slitrk6/GAD67, n = 21; sh-Trio/Slitrk6/VGLUT1, n = 19; sh-MIM-B/Slitrk6/GAD67, n = 26; sh-Caskins/Slitrk6/GAD67, n = 27; sh-β-Catn/Slitrk6/GAD67, n = 16; sh-Abl/Slitrk6/GAD67, n = 17; sh-Ena/Slitrk6/GAD67, n = 16; sh-p250GAP/Slitrk6/GAD67, n = 16; sh-N-Cad/Slitrk6/GAD67, n = 26; sh-Piccolo/Slitrk6/GAD67, n = 17; sh-ELKS/Slitrk6/GAD67, n = 20; sh-SYD1A/Slitrk6/GAD67, n = 10; sh-CASK/Slitrk6/GAD67, n = 20; sh-RIM1/Slitrk6/GAD67, n = 26; sh-RIM-BPs/Slitrk6/GAD67, n = 26; sh-Control/Nlgn1/GAD67, n = 35; sh-liprin-α/Nlgn1/GAD67, n = 18; sh-Trio/Nlgn1/GAD67, n = 18; sh-MIM-B/Nlgn1/GAD67, n = 18; sh-Caskins/Nlgn1/GAD67, n = 17; sh-β-Catn/Nlgn1/GAD67, n = 23; sh-Abl/Nlgn1/GAD67, n = 22; sh-Ena/Nlgn1/GAD67, n = 19; sh-p250GAP/Nlgn1/GAD67, n = 21; sh-N-Cad/Nlgn1/GAD67, n = 17; sh-Piccolo/Nlgn1/GAD67, n = 16; sh-ELKS/Nlgn1/GAD67, n = 16; sh-SYD1A/Nlgn1/GAD67, n = 18; sh-CASK/Nlgn1/GAD67, n = 19; sh-RIM1/Nlgn1/GAD67, n = 21; and sh-RIM-BPs/Nlgn1/GAD67, n = 19. p values for each comparison are as follows: sh-Control versus sh-liprin-α/Slitrk6/VGLUT1, p < 0.0001; sh-Control versus sh-Trio/Slitrk6/VGLUT1, p = 0.8228; sh-Control versus sh-MIM-B/Slitrk6/VGLUT1, p = 0.0943; sh-Control versus sh-Caskins/Slitrk6/VGLUT1, p = 0.0078; sh-Control versus sh-β-Catn/Slitrk6/VGLUT1, p = 0.4586; sh-Control versus sh-Abl/Slitrk6/VGLUT1, p = 0.0503; sh-Control versus sh-Ena/Slitrk6/VGLUT1, p = 0.2515; sh-Control versus sh-p250GAP/Slitrk6/VGLUT1, p < 0.0001; sh-Control versus sh-N-Cad/Slitrk6/VGLUT1, p = 0.0034; sh-Control versus sh-Piccolo/Slitrk6/VGLUT1, p = 0.0098; sh-Control versus sh-ELKS/Slitrk6/VGLUT1, p = 0.9197; sh-Control versus sh-SYD1A/Slitrk6/VGLUT1, p = 0.0059; sh-Control versus sh-CASK/Slitrk6/VGLUT1, p = 0.4047; sh-Control versus sh-RIM1/Slitrk6/VGLUT1, p = 0.7157; sh-Control versus sh-RIM-BPs/Slitrk6/VGLUT1, p < 0.0001; sh-Control versus sh-liprin-α/Nlgn1/VGLUT1, p = 0.0005; sh-Control versus sh-Trio/Nlgn1/VGLUT1, p = 0.3909; sh-Control versus sh-MIM-B/Nlgn1/VGLUT1, p = 0.0039; sh-Control versus sh-Caskins/Nlgn1/VGLUT1, p = 0.4677; sh-Control versus sh-β-Catn/Nlgn1/VGLUT1, p = 0.0026; sh-Control versus sh-Abl/Nlgn1/VGLUT1, p < 0.0001; sh-Control versus sh-Ena/Nlgn1/VGLUT1, p = 0.0242; sh-Control versus sh-p250GAP/Nlgn1/VGLUT1, p < 0.0001; sh-Control versus sh-N-Cad/Nlgn1/VGLUT1, p = 0.0017; sh-Control versus sh-Piccolo/Nlgn1/VGLUT1, p = 0.2858; sh-Control versus sh-ELKS/Nlgn1/VGLUT1, p = 0.2703; sh-Control versus sh-SYD1A/Nlgn1/VGLUT1, p = 0.0223; sh-Control versus sh-CASK/Nlgn1/VGLUT1, p = 0.7299; sh-Control versus sh-RIM1/Nlgn1/VGLUT1, p = 0.6353; sh-Control versus sh-RIM-BPs/Nlgn1/VGLUT1, p = 0.0042; sh-Control versus sh-liprin-α/Slitrk6/GAD67, p < 0.0001; sh-Control versus sh-Trio/Slitrk6/GAD67, p =0.1079; sh-Control versus sh-MIM-B/Slitrk6/GAD67, p = 0.0008; sh-Control versus sh-Caskins/Slitrk6/GAD67, p < 0.0001; sh-Control versus sh-β-Catn/Slitrk6/GAD67, p = 0.0022; sh-Control versus sh-Abl/Slitrk6/GAD67, p = 0.0200; sh-Control versus sh-Ena/Slitrk6/GAD67, p = 0.0002; sh-Control versus sh-p250GAP/Slitrk6/GAD67, p < 0.0001; sh-Control versus sh-N-Cad/Slitrk6/GAD67, p < 0.0001; sh-Control versus sh-Piccolo/Slitrk6/GAD67, p < 0.0001; sh-Control versus sh-ELKS/Slitrk6/GAD67, p = 0.9177; sh-Control versus sh-SYD1A/Slitrk6/GAD67, p = 0.0044; sh-Control versus sh-CASK/Slitrk6/GAD67, p = 0.0633; sh-Control versus sh-RIM1/Slitrk6/GAD67, p = 0.0384; sh-Control versus sh-RIM-BPs/Slitrk6/GAD67, p < 0.0001; sh-Control versus sh-liprin-α/Nlgn1/GAD67, p < 0.0001; sh-Control versus sh-Trio/Nlgn1/GAD67, p = 0.079; sh-Control versus sh-MIM-B/Nlgn1/GAD67, p = 0.0016; sh-Control versus sh-Caskins/Nlgn1/GAD67, p = 0.0006; sh-Control versus sh-β-Catn/Nlgn1/GAD67, p < 0.0001; sh-Control versus sh-Abl/Nlgn1/GAD67, p < 0.0001; sh-Control versus sh-Ena/Nlgn1/GAD67, p = 0.0861; sh-Control versus sh-p250GAP/Nlgn1/GAD67, p = 0.1483; sh-Control versus sh-N-Cad/Nlgn1/GAD67, p < 0.0001; sh-Control versus sh-Piccolo/Nlgn1/GAD67, p = 0.0079; sh-Control versus sh-ELKS/Nlgn1/GAD67, p = 0.0087; sh-Control versus sh-SYD1A/Nlgn1/GAD67, p < 0.0001; sh-Control versus sh-CASK/Nlgn1/GAD67, p = 0.0068; sh-Control versus sh-RIM1/Nlgn1/GAD67, p = 0.0004; and sh-Control versus sh-RIM-BPs/Nlgn1/GAD67, p > 0.9999.
Figure 4.

Scrambled shRNAs for presynaptic scaffold proteins have no effects on Slitrk6 or Nlgn1 activities during heterologous synapse formation. A, Representative images of heterologous synapse-formation activities of Nlgn1 and Slitrk6. Cultured hippocampal neurons were infected with the indicated protein KD-scrambled lentiviruses at DIV4 and cocultured with Nlgn1- or Slitrk6-expressing HEK293T cells for 12 h (Nlgn1; DIV12) or 24 h (Slitrk6; DIV11-12). Hemi-synapse induction was analyzed by double-immunostaining for EGFP/HA (blue) and VGLUT1 (red). Scale bar, 10 μm. B, Quantification of synapse-formation activity in A by measuring the ratio of red staining intensity to blue staining intensity. Data are mean ± SEM. Mann–Whitney U test. n indicates the number of cells as follows: sc-Control/Nlgn1/VGLUT1, n = 16; sc-MIM-B/Nlgn1/VGLUT1, n = 18; sc-Caskins/Nlgn1/VGLUT1, n = 15; sc-Abl/Nlgn1/VGLUT1, n = 16; sc-Ena/Nlgn1/VGLUT1, n = 18; sc-SYD1A/Nlgn1/VGLUT1, n = 17; sc-RIM-BPs/Nlgn1/VGLUT1, n = 13; sc-Control/Nlgn1/GAD67, n = 17; sc-MIM-B/Nlgn1/GAD67, n = 16; sc-Caskins/Nlgn1/GAD67, n = 9; sc-Abl/Nlgn1/GAD67, n = 9; sc-Ena/Nlgn1/GAD67, n = 9; sc-SYD1A/Nlgn1/GAD67, n = 12; sc-RIM-BPs/Nlgn1/GAD67, n = 9; sc-Control/Slitrk6/VGLUT1, n = 22; sc-MIM-B/Slitrk6/VGLUT1, n = 11; sc-Caskins/Slitrk6/VGLUT1, n = 8; sc-Abl/Slitrk6/VGLUT1, n = 8; sc-Ena/Slitrk6/VGLUT1, n = 8; sc-SYD1A/Slitrk6/VGLUT1, n = 11; sc-RIM-BPs/Slitrk6/VGLUT1, n = 10; sc-Control/Slitrk6/GAD67, n = 21; sc-MIM-B/Slitrk6/GAD67, n = 11; sc-Caskins/Slitrk6/GAD67, n = 12; sc-Abl/Slitrk6/GAD67, n = 10; sc-Ena/Slitrk6/GAD67, n = 9; sc-SYD1A/Slitrk6/GAD67, n = 13; and sc-RIM-BPs/Slitrk6/GAD67, n = 12. p values for each comparison are as follows: sc-Control versus sc-MIM-B/Nlgn1/VGLUT1, p > 0.9999; sc-Control versus sc-Caskins/Nlgn1/VGLUT1, p > 0.9999; sc-Control versus sc-Abl/Nlgn1/VGLUT1, p > 0.9999; sc-Control versus sc-Ena/Nlgn1/VGLUT1, p > 0.9999; sc-Control versus sc-SYD1A/Nlgn1/VGLUT1, p > 0.9999; sc-Control versus sc-RIM-BPs/Nlgn1/VGLUT1, p > 0.9999; sc-Control versus sc-MIM-B/Nlgn1/GAD67, p > 0.9999; sc-Control versus sc-Caskins/Nlgn1/GAD67, p > 0.9999; sc-Control versus sc-Abl/Nlgn1/GAD67, p > 0.9999; sc-Control versus sc-Ena/Nlgn1/GAD67, p > 0.9999; sc-Control versus sc-SYD1A/Nlgn1/GAD67, p > 0.9999; sc-Control versus sc-RIM-BPs/Nlgn1/GAD67, p > 0.9999; sc-Control versus sc-MIM-B/Slitrk6/VGLUT1, p > 0.9999; sc-Control versus sc-Caskins/Slitrk6/VGLUT1, p > 0.9999; sc-Control versus sc-Abl/Slitrk6/VGLUT1, p > 0.9999; sc-Control versus sc-Ena/Slitrk6/VGLUT1, p > 0.9999; sc-Control versus sc-SYD1A/Slitrk6/VGLUT1, p > 0.9999; sc-Control versus sc-RIM-BPs/Slitrk6/VGLUT1, p > 0.9999; sc-Control versus sc-MIM-B/Slitrk6/GAD67, p = 0.1839; sc-Control versus sc-Caskins/Slitrk6/GAD67, p > 0.9999; sc-Control versus sc-Abl/Slitrk6/GAD67, p > 0.9999; sc-Control versus sc-Ena/Slitrk6/GAD67, p > 0.9999; sc-Control versus sc-SYD1A/Slitrk6/GAD67, p > 0.9999; and sc-Control versus sc-RIM-BPs/Slitrk6/GAD67, p > 0.9999.
Figure 5.

Rescue experiments using lentiviruses expressing target shRNA-resistant proteins show specificity in the target shRNA-derived synaptogenic effects driven by Slitrk6 or Nlgn1 in heterologous synapse formation analyses. A, Representative images of heterologous synapse-formation activities of Nlgn1 and Slitrk6. Cultured hippocampal neurons were infected with the indicated protein KD lentiviruses and/or the target-specific rescue expression lentiviruses at DIV4 and cocultured with Nlgn1- or Slitrk6-expressing HEK293T cells for 12 h (Nlgn1; DIV11-12) or 24 h (Slitrk6; DIV12). Hemi-synapse induction was analyzed by double-immunostaining for HA/EGFP (blue) and VGLUT1 (red). Scale bar, 10 μm. CSK1, Caskin-1; RBP2, RIM-BP2. For expression levels of the shRNA-resistant vectors used in Figure 5, see Extended Data Figure 5-1. B, Quantification of synapse-formation activity in A by measuring the ratio of red staining intensity to blue staining intensity. Data are mean ± SEM. *p < 0.05; **p < 0.01; ***p < 0.001; ANOVA with a nonparametric Kruskal–Wallis test. n indicates the number of cells as follows: sh-Control/Slitrk6/VGLUT1, n = 26; sh-MIM-B/Slitrk6/VGLUT1, n = 14; + MIM-B (res)/Slitrk6/VGLUT1, n = 12; sh-Caskins/Slitrk6/VGLUT1, n = 17; + CSK1 (res)/Slitrk6/VGLUT1, n = 12; sh-Abl/Slitrk6/VGLUT1, n = 14; + Abl1 (res)/Slitrk6/VGLUT1, n = 16; sh-Ena/Slitrk6/VGLUT1, n = 14; + Ena (res)/Slitrk6/VGLUT1, n = 13; sh-ELKS/Slitrk6/VGLUT1, n = 13; + ELKS2 (res)/Slitrk6/VGLUT1, n = 19; sh-SYD1A/Slitrk6/VGLUT1, n = 16; + SYD1A (res)/Slitrk6/VGLUT1, n = 11; sh-CASK/Slitrk6/VGLUT1, n = 13; + CASK (res)/Slitrk6/VGLUT1, n = 15; sh-RIM-BPs/Slitrk6/VGLUT1, n = 15; + RBP2 (res)/Slitrk6/VGLUT1, n = 14; sh-Control/Nlgn1/VGLUT1, n = 23; sh-MIM-B/Nlgn1/VGLUT1, n = 13; + MIM-B (res)/Nlgn1/VGLUT1, n = 19; sh-Caskins/Nlgn1/VGLUT1, n = 20; + CSK1 (res)/Nlgn1/VGLUT1, n = 17; sh-Abl/Nlgn1/VGLUT1, n = 15; + Abl1 (res)/Nlgn1/VGLUT1, n = 19; sh-Ena/Nlgn1/VGLUT1, n = 17; + Ena (res)/Nlgn1/VGLUT1, n = 18; sh-ELKS/Nlgn1/VGLUT1, n = 16; + ELKS2 (res)/Nlgn1/VGLUT1, n = 15; sh-SYD1A/Nlgn1/VGLUT1, n = 14; + SYD1A (res)/Nlgn1/VGLUT1, n = 23; sh-CASK/Nlgn1/VGLUT1, n = 18; + CASK (res)/Nlgn1/VGLUT1, n = 20; sh-RIM-BPs/Nlgn1/VGLUT1, n = 19; and + RBP2 (res)/Nlgn1/VGLUT1, n = 15. p values for each comparison are as follows: sh-Control versus sh-MIM-B/Slitrk6/VGLUT1, p = 0.9366; sh-Control versus + MIM-B (res)/Slitrk6/VGLUT1, p > 0.9999; sh-Control versus sh-Caskins/Slitrk6/VGLUT1, p > 0.9999; sh-Control versus + CSK1 (res)/Slitrk6/VGLUT1, p = 0.7744; sh-Control versus sh-Abl/Slitrk6/VGLUT1, p > 0.9999; sh-Control versus + Abl1 (res)/Slitrk6/VGLUT1, p = 0.8745; sh-Control versus sh-Ena/Slitrk6/VGLUT1, p > 0.9999; sh-Control versus + Ena (res)/Slitrk6/VGLUT1, p > 0.9999; sh-Control versus sh-ELKS/Slitrk6/VGLUT1, p > 0.9999; sh-Control versus + ELKS2 (res)/Slitrk6/VGLUT1, p > 0.9999; sh-Control versus sh-SYD1A/Slitrk6/VGLUT1, p = 0.0195; sh-Control versus + SYD1A (res)/Slitrk6/VGLUT1, p > 0.9999; sh-Control versus sh-CASK/Slitrk6/VGLUT1, p > 0.9999; sh-Control versus + CASK (res)/Slitrk6/VGLUT1, p = 0.6365; sh-Control versus sh-RIM-BPs/Slitrk6/VGLUT1, p = 0.0006; sh-Control versus + RBP2 (res)/Slitrk6/VGLUT1, p > 0.9999; sh-Control versus sh-MIM-B/Nlgn1/VGLUT1, p = 0.0006; sh-Control versus + MIM-B (res)/Nlgn1/VGLUT1, p = 0.8354; sh-Control versus sh-Caskins/Nlgn1/VGLUT1, p = 0.6949; sh-Control versus + CSK1 (res)/Nlgn1/VGLUT1, p > 0.9999; sh-Control versus sh-Abl/Nlgn1/VGLUT1, p = 0.0006; sh-Control versus + Abl1 (res)/Nlgn1/VGLUT1, p = 0.3353; sh-Control versus sh-Ena/Nlgn1/VGLUT1, p = 0.0001; sh-Control versus + Ena (res)/Nlgn1/VGLUT1, p > 0.9999; sh-Control versus sh-ELKS/Nlgn1/VGLUT1, p > 0.9999; sh-Control versus + ELKS2 (res)/Nlgn1/VGLUT1, p = 0.9148; sh-Control versus sh-SYD1A/Nlgn1/VGLUT1, p = 0.0060; sh-Control versus + SYD1A (res)/Nlgn1/VGLUT1, p > 0.9999; sh-CASK/Nlgn1/VGLUT1, p = 0.3146; sh-Control versus + CASK (res)/Nlgn1/VGLUT1, p = 0.0628; sh-Control versus sh-RIM-BPs/Nlgn1/VGLUT1, p = 0.0013; and sh-Control versus + RBP2 (res)/Nlgn1/VGLUT1, p > 0.9999. CSK1, Caskin-1; RBP2, RIM-BP2.
Validation of KD efficiencies for the shRNA vectors targeting a subset of presynaptic scaffold proteins using antibodies in cultured cortical neurons. A, B, Representative semiquantitative immunoblot images (A) and quantitative summary (B) of the expression levels of the indicated synaptic proteins in cultured cortical neurons infected with lentiviruses expressing sh-Control or the indicated shRNAs. These findings show the KD efficiencies of the shRNA vectors that exhibit biological effects in Figure 3. Data are mean ± SEM. n = number of samples as follows: sh-Cont. [ELKS1], n = 4; sh-ELKS1 [ELKS1], n = 4; sh-Cont.[ELKS2], n = 4; sh-ELKS2 [ELKS2], n = 4; sh-Cont. [RIM-BP1], n = 4; sh-RBP1 [RIM-BP1], n = 4; sh-Cont. [RIM-BP2], n = 4; sh-RBP2 [RIM-BP2], n = 4; sh-Cont. [CASK], n = 5; sh-CASK [CASK], n = 5; sh-Cont. [MIM-B], n = 5; sh-MIM-B [MIM-B], n = 5; sh-Cont. [Abl1], n = 4; sh-Abl [Abl1], n = 4; sh-Cont. [Ena], n = 4; sh-Ena [Ena], n = 4; sh-Cont. [Caskin-1], n = 4; sh-CSK1 [Caskin-1], n = 4; sh-Cont. [SYD1A], n = 4; and sh-SYD1A [SYD1A], n = 4). CSK1, CASKIN-1; RBP1, RIM-BP1; and RBP2, RIM-BP2. Download Figure 3-1, TIF file (13.4MB, tif) .
Expression levels of the shRNA-resistant vectors, revealed by immunoblot analysis of HEK293T cell lysates. Representative immunoblot images from HEK293T cells transfected with the indicated expression plasmids (related to data in Fig. 5). Samples were resolved by SDS-PAGE and immunoblotted using the indicated antibodies. CSK1, CASKIN-1; and RBP2, RIM-BP2. Download Figure 5-1, TIF file (5.8MB, tif) .
Nrxns binds to LAR-RPTPs
Next, because Nrxns and LAR-RPTPs are functionally and physically coupled (Figs. 1, 3), and because Nrxns were reported to bind HS chains (Zhang et al., 2018), we wondered whether Nrxns and LAR-RPTPs directly bind to each other. To test this, we performed binding assays between recombinant Ig-fusion proteins of Nrxn1 splicing variants containing or lacking an insert at splice site 4 (SS4) (Ig-Nrxn1α−SS4, Ig-Nrxn1α+SS4, Ig-Nrxn1β-SS4, and Ig-Nrxn1β+SS4) and HEK293T cells expressing HA-tagged PTPσ splice variants (Fig. 6A,B). HA-tagged Nlgn1 was expressed in HEK293T cells as a positive control. We found that all four tested PTPσ splice variants avidly bound to Nrxn1, albeit with different binding affinities (Fig. 6A,B). Because the PTPσ variant lacking an insert in meA and meB sites in Ig domains (PTPσA–B–) exhibited the highest binding affinity for both Nrxn1α and Nrxn1β (Fig. 6A,B), functional assays in this study used the PTPσA–B– variant, unless otherwise stated. In pulldown assays using Ig-Nrxn1 fusion proteins, we observed significant enrichment of PTPσ and Nlgn2, and modest enrichment of PTPδ, but not TrkC, in the Nrxn1-bound fraction of detergent-solubilized adult rat membrane fractions (Fig. 6C). Binding assays performed using purified recombinant Ig-Nrxn1α and HA-PTPσ proteins showed that PTPσ directly bound to recombinant Nrxn1α (Fig. 6D). We further found that PTPσ immunoprecipitated from detergent-solubilized adult rat membrane coimmunoprecipitated significant amounts of Nrxn1α (Fig. 6E). To assess the affinities of these interactions of Nrxn1α with PTPσ, we first expressed the PTPσA–B– variant on the surface of HEK293T cells. We then incubated HA- PTPσA–B–-expressing and control HEK293T cells with increasing amounts of Ig-Nrxn1α or Ig-Nrxn1β, and measured cell-surface-bound proteins using HRP-tagged secondary antibody and estimated binding affinity (Fig. 6F,G). After subtracting nonspecific binding, we performed a Scatchard analysis, assuming a single independent binding site for PTPσ in each Nrxn1 molecule, and obtained a Kd of 31.25 ± 6.56 nm for Nrxn1α (Fig. 6F) and 188.68 ± 39.55 nm for Nrxn1β (Fig. 6G). These data indicate that Nrxn1α bound to PTPσ more strongly than Nrxn1β, in keeping with our previous data (Fig. 6A,B). Nrxn1α splice variants exhibited more robust interactions with PTPσ than Nrxn1β. Cell-surface binding assays using cells expressing full-length PTPσ (PTPσ Full) or Ig domain-deleted protein (PTPσ ΔIg) showed that Ig-Nrxn1α bound to HEK293T cells expressing PTPσ Full, but not to those expressing PTPσ ΔIg (Fig. 7). We then examined whether other LAR-RPTP members (PTPδ and LAR) also bound to Nrxn1α and whether these interactions were also regulated by similar alternative splicing events (Fig. 8). We found that Nrxn1α binds to all four splice variants of PTPδ and three splice variants of LAR with distinct modes of regulation (Fig. 8A,C). Ig-Nrxn3α also bound to PTPσ splice variants and PTPδ (Fig. 8B,D).
Figure 6.

Interaction of PTPσ with Nrxn1 is regulated by alternative splicing in the Ig domain of PTPσ and PTPσ complexes with Nrxn1α in vivo. A, Representative images of cell-surface binding assays. HEK293T cells expressing HA-tagged Nlgn1 or the indicated PTPσ splice variants were incubated with 10 μg/ml of control IgC, or the indicated Ig-Nrxn1 fusion proteins, and then analyzed by double-immunofluorescence imaging of Ig-fusion proteins (red) and HA antibodies (green). Scale bar, 10 μm. B, Quantification of the average red intensities of transfected HEK293T cells in A. n indicates the number of cells as follows: Ig-Nrxn1α-SS4/Nlgn1, n = 37; Ig-Nrxn1α-SS4/PTPσA+B+, n = 29; Ig-Nrxn1α-SS4/PTPσA+B–, n = 26; Ig-Nrxn1α-SS4/PTPσA–B+, n = 27; Ig-Nrxn1α-SS4/PTPσA–B–, n = 35; Ig-Nrxn1α+SS4/Nlgn1, n = 31; Ig-Nrxn1α+SS4/PTPσA+B+, n = 27; Ig-Nrxn1α+SS4/PTPσA+B–, n = 25; Ig-Nrxn1α+SS4/PTPσA–B+, n = 27; Ig-Nrxn1α+SS4/PTPσA–B–, n = 24; Ig-Nrxn1β-SS4/Nlgn1, n = 31; Ig-Nrxn1β-SS4/PTPσA+B+, n = 26; Ig-Nrxn1β-SS4/PTPσA+B–, n = 27; Ig-Nrxn1β-SS4/PTPσA–B+, n = 28; Ig-Nrxn1β-SS4/PTPσA+B–, n = 33; Ig-Nrxn1β+SS4/Nlgn1, n = 22; Ig-Nrxn1β+SS4/PTPσA+B+, n = 23; Ig-Nrxn1β+SS4/PTPσA+B–, n = 26; Ig-Nrxn1β+SS4/PTPσA–B+, n = 28; Ig-Nrxn1β+SS4/PTPσA–B–, n = 25; IgC/Nlgn1, n = 16; IgC/PTPσA+B+, n = 15; IgC/PTPσA+B–, n = 17; IgC/PTPσA–B+, n = 19; and IgC/PTPσA–B–, n = 16. C, In vivo pulldown assays. Recombinant Ig-Nrxn1α-SS4 or Ig-Nrxn1β-SS4 proteins were immobilized using protein A-Sepharose and incubated with rat synaptosomal lysates. Immunoblotting was performed using antibodies against PTPσ, PTPδ, TrkC, and Nlgn2. D, Purified recombinant HA-PTPσ Ig1-3 proteins were incubated with purified Ig-Nrxn1α-SS4 proteins, as indicated. Precipitates obtained using protein A-Sepharose were analyzed by immunoblotting with HA antibodies. *Positions of Fc fusion proteins used for binding assays, as revealed in parallel Ponceau S-stained membranes (right). Input, 2%. E, Coimmunoprecipitation experiment in mouse brains demonstrating that PTPσ forms complexes with Nrxn1α. Crude synaptosomal fractions of adult mouse brains were immunoprecipitated with anti-Nrxn1α antibody and immunoblotted with anti-PTPσ. An equal amount of rabbit IgG was used as a negative control. Input, 2%. F, G, Saturation binding of Ig-Nrxn1α-SS4 (F) or Ig-Nrxn1β-SS4 (G) to PTPσ expressed in HEK293T cells. Inset, Scatchard plot generated by linear regression of the data, with the Kd calculated from three or four independent experiments. Data are mean ± SEM.
Figure 7.
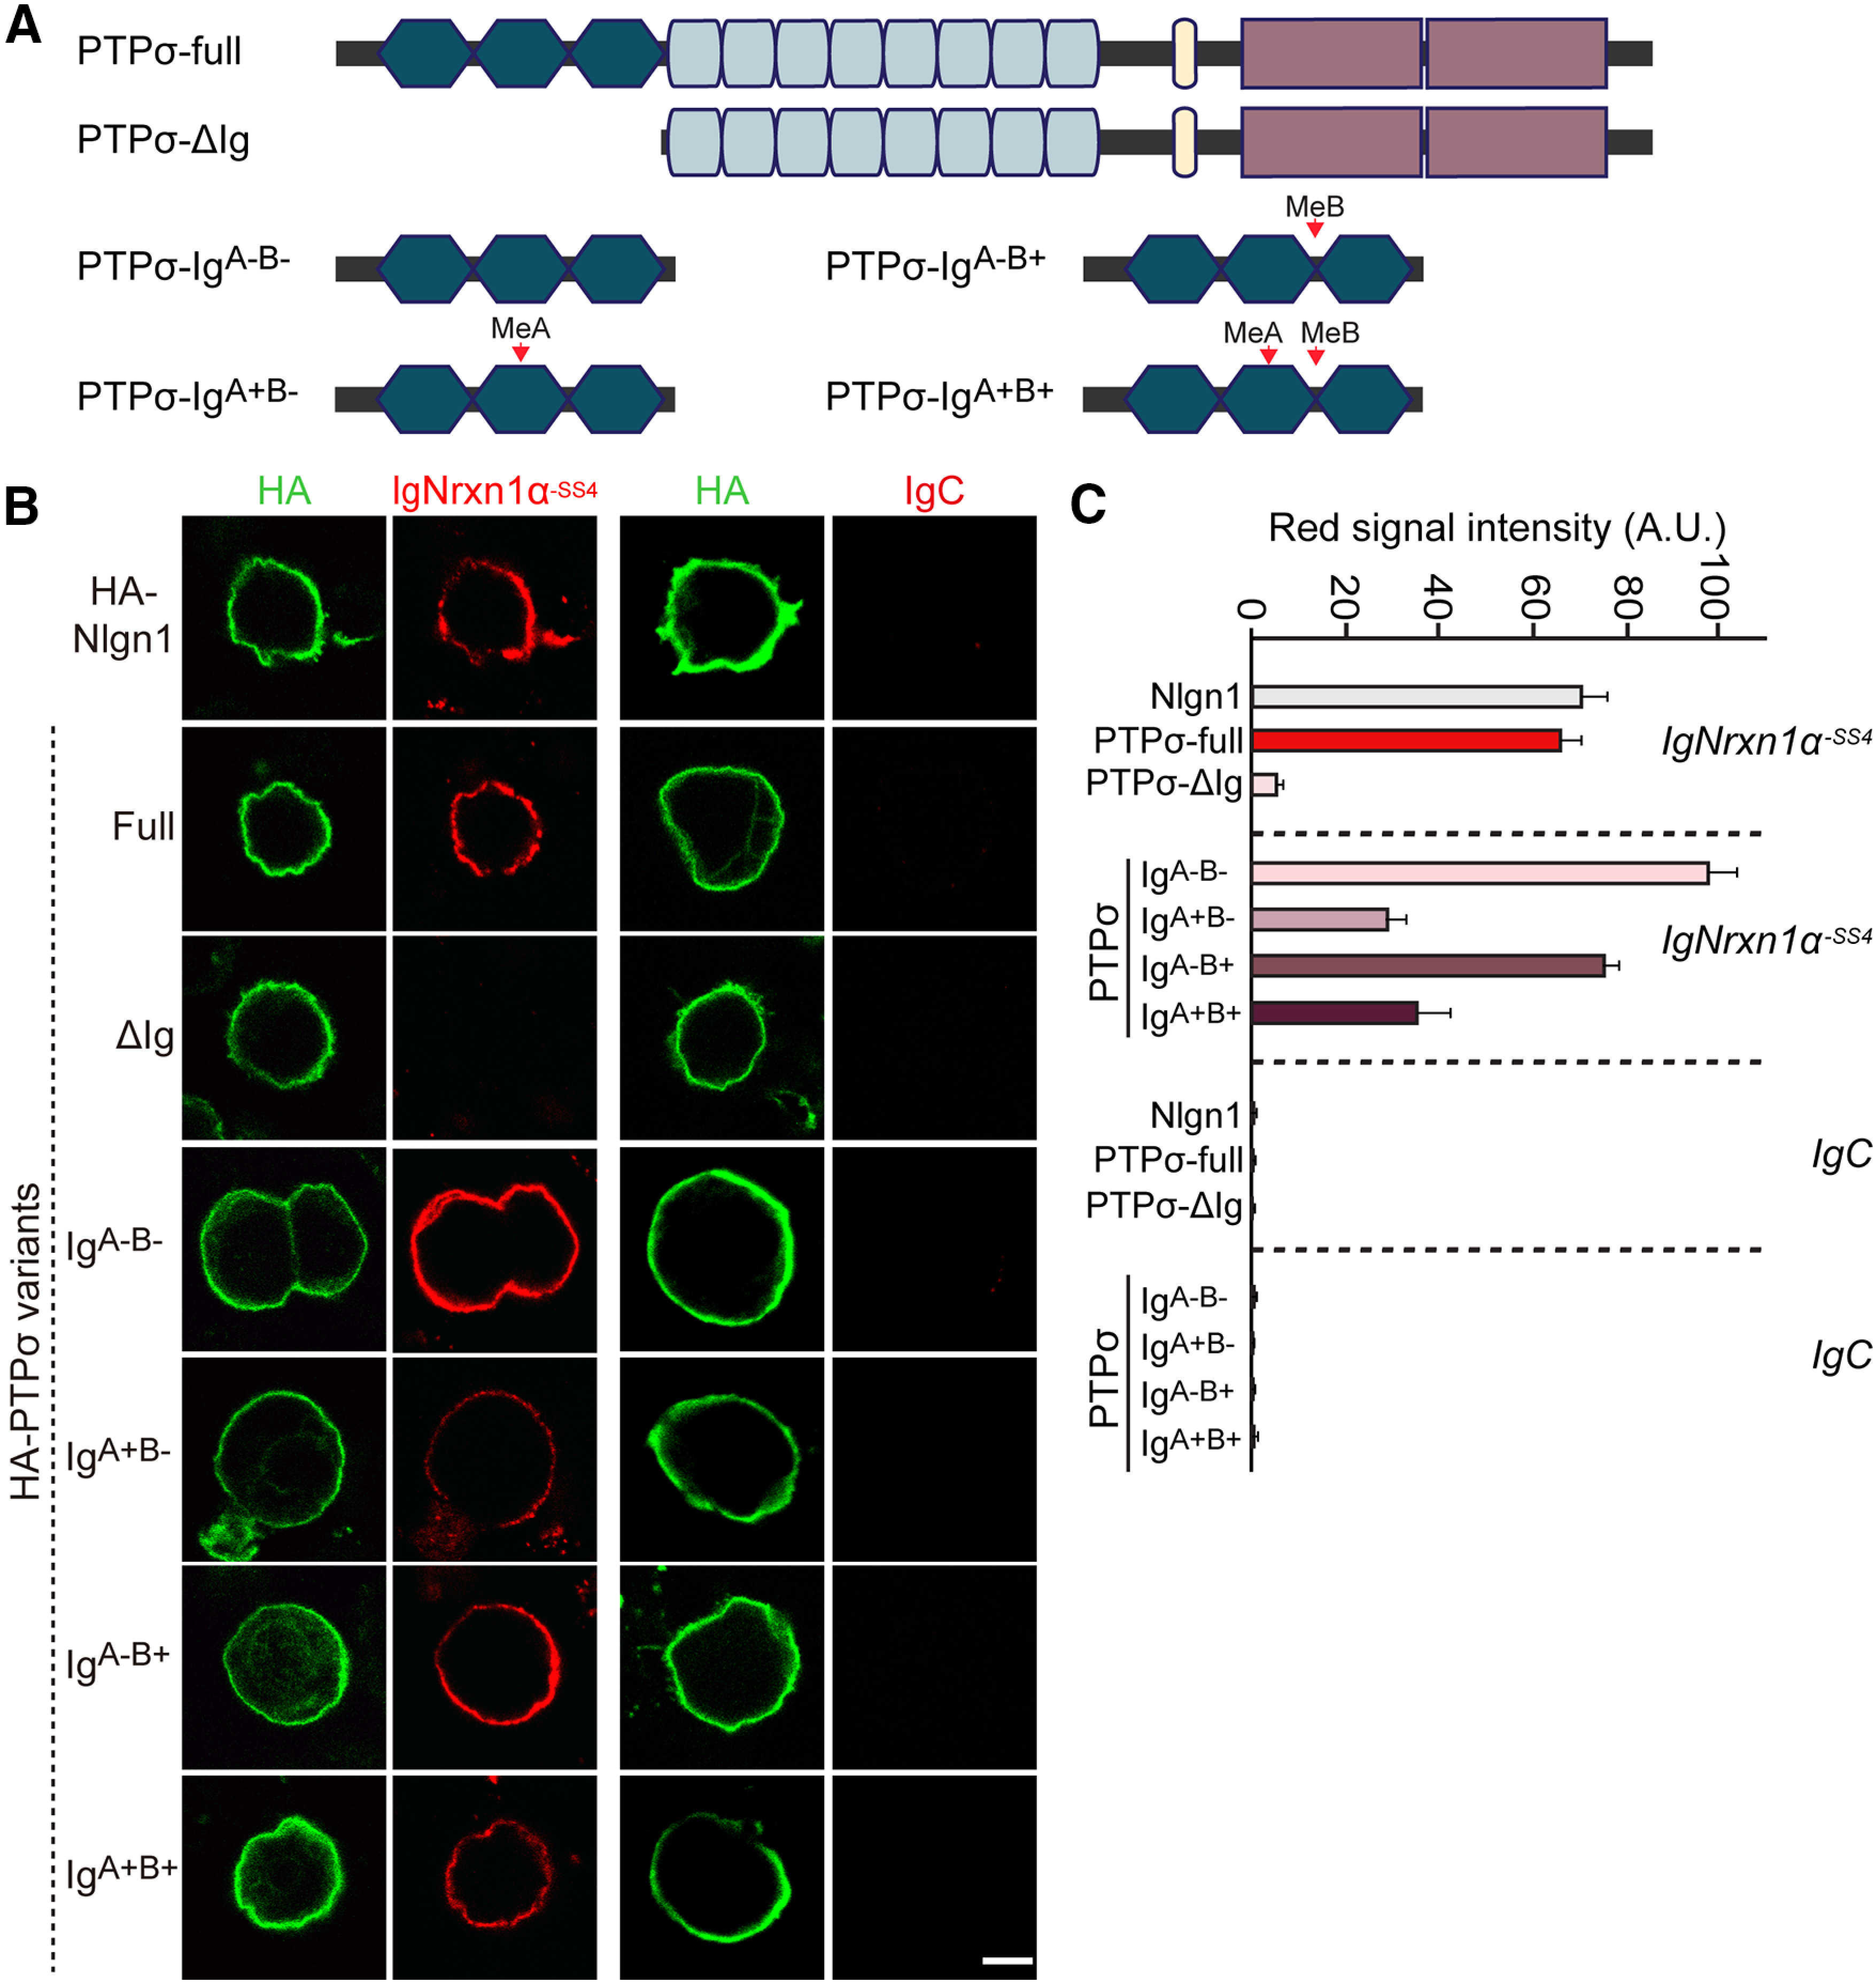
The PTPσ Ig domain is necessary and sufficient for interaction with Nrxn1α. A, Schematic diagrams of PTPσ WT and deletion mutants. B, Representative images of cell-surface binding assays. HEK293T cells expressing HA-Nlgn1, HA-PTPσ WT, HA-PTPσ ΔIg, or the indicated PTPσ Ig domain splicing variants constructs were incubated with 10 μg/ml of control IgC or Ig-Nrxn1α-SS4 and then analyzed by immunofluorescence imaging of Ig-fusion proteins (red) and HA antibodies (green). Scale bar, 10 μm. C, Quantification of the average red intensities in the green positive region of HEK293T cells in B. n indicates the number of cells as follows: Ig-Nrxn1α/Nlgn1, n = 27; Ig-Nrxn1α/PTPσ-full, n = 33; Ig-Nrxn1α/PTPσ ΔIg, n = 32; Ig-Nrxn1α/PTPσ IgA–B–, n = 30; Ig-Nrxn1α/PTPσ IgA+B–, n = 22; Ig-Nrxn1α/PTPσ IgA–B+, n = 27; Ig-Nrxn1α/PTPσ IgA+B+, n = 23; IgC/Nlgn1, n = 10; IgC/PTPσ-full, n = 11; IgC/PTPσ ΔIg, n = 15; IgC/PTPσ IgA–B–, n = 11; IgC/PTPσ IgA+B–, n = 11; IgC/PTPσ IgA–B+, n = 12; and IgC/PTPσ IgA+B+, n = 10.
Figure 8.

Analysis of the interaction of PTPδ or LAR with Nrxn1α-SS4. A, Representative images of cell-surface binding assays. HEK293T cells expressing the indicated HA-tagged LAR-RPTP splice variants were incubated with 10 μg/ml of control IgC or Ig-Nrxn1α-SS4 and then analyzed by immunofluorescence imaging of Ig-fusion proteins (red) and HA antibodies (green). Scale bar, 10 μm. B, Representative images of cell-surface binding assays. HEK293T cells expressing HA-PTPσ splice variants or HA-PTPδ were incubated with 10 μg/ml of control IgC or Ig-Nrxn3α-SS4 and then analyzed by immunofluorescence imaging of Ig-fusion proteins (red) and HA antibodies (green). Scale bar, 10 μm. C, D, Quantitation of average red intensities in the green positive region of HEK293T cells in A. n indicates the number of cells as follows: Ig-Nrxn1α/PTPδ IgA–B–, n = 23; Ig-Nrxn1α/PTPδ IgA+B–, n = 21; Ig-Nrxn1α/PTPδ IgA–B+, n = 26; Ig-Nrxn1α/PTPδ IgA+B+, n = 25; Ig-Nrxn1α/LAR IgA–B–, n = 24; Ig-Nrxn1α/LAR IgA+B–, n = 23; Ig-Nrxn1α/LAR IgA–B+, n = 25; IgC/PTPδ IgA–B–, n = 10; IgC/PTPδ IgA+B–, n = 10; IgC/PTPδ IgA–B+, n = 10; IgC/PTPδ IgA+B+, n = 11; IgC/LAR IgA–B–, n = 10; IgC/LAR IgA+B–, n = 12; and IgC/LAR IgA–B+, n = 13. Quantitation of average red intensities in the green positive region of HEK293T cells in B. n indicates the number of cells as follows: Ig-Nrxn3α/PTPσA–B–, n = 16; Ig-Nrxn3α/PTPσA+B–, n = 15; Ig-Nrxn3α/PTPσA–B+, n = 15; Ig-Nrxn3α/PTPσA+B+, n = 14; Ig-Nrxn3α/PTPδA+B+, n = 19; IgC/PTPσA–B–, n = 14; IgC/PTPσA+B–, n = 8; IgC/PTPσA–B+, n = 13; IgC/PTPσA+B+, n = 13; and IgC/PTPδA+B–, n = 8.
HS chains attached to PTPσ and Nrxn1 are critical for PTPσ-Nrxn1 interactions
Because it was previously shown that PTPσ binding to the HS chains of HS proteoglycans is involved in PTPσ action at excitatory synapses (Ko et al., 2015; Condomitti and de Wit, 2018), we next examined whether the HS glycan chains of Nrxn1 mediate their binding to PTPσ. For these experiments, we used a PTPσ construct (PTPσ AAAA) in which HS binding was abrogated by replacing four lysines of the first Ig domain (K68, K69, K71, and K72) with alanines (Ko et al., 2015). In cell-surface binding assays using Ig-Nrxn1α and HEK293T cells expressing either PTPσ WT or PTPσ AAAA, we found that PTPσ AAAA failed to bind to Nrxn1α (Fig. 9A–C). Moreover, point mutants of Nrxn1α (Nrxn1α ΔHS) or Nrxn1β (Nrxn1β ΔHS), in which the corresponding HS binding serine residue (S1327 or S346, respectively) was mutated to alanine (Zhang et al., 2018), exhibited drastically reduced binding affinity for PTPσ WT (Fig. 9D,E). However, Nrxn1α ΔHS or Nrxn1β ΔHS maintained robust interaction with Nlgn1 (Fig. 9D,E). To further identify the LAR-RPTP-binding protein domain(s) in Nrxn1α in addition to the HS binding sites, we generated a series of Ig-Nrxn1α constructs and performed cell-surface binding assays using HEK293T cells expressing HA-tagged full-length PTPσ. We found that PTPσ bound to Ig-Nrxn1α proteins containing an LNS3 domain, whereas Nlgn1 specifically bound to Ig-Nrxn1α containing an LNS6 domain, as previously reported (Fig. 10). These results suggest that PTPσ binds primarily to the HS-chains in the LNS6 domain of α-Nrxns (equivalent to a single LNS domain of β-Nrxns), but binds additionally to the LNS3 domain (Südhof, 2017).
Figure 9.

Interaction of PTPσ with Nrxn1 depends on HS moieties attached to both proteins. A, Schematic depiction of Nrxn1 WT and ΔHS mutants. B, Representative images of cell-surface binding assays. HEK293T cells expressing HA-tagged Nlgn1, PTPσ WT, or PTPσ AAAA mutant were incubated with 10 μg/ml of control IgC or Ig-Nrxn1α-SS4, and then analyzed by immunofluorescence imaging of Ig-fusion proteins (red) and HA antibodies (green). Scale bar, 10 μm. C, Quantification of average red intensity in the green-positive region of HEK293T cells in B. Data are mean ± SEM. ****p < 0.0001; ####p < 0.0001; Mann–Whitney U test or ANOVA with a nonparametric Kruskal–Wallis test. n indicates the number of cells as follows: Ig-Nrxn1α/Nlgn1, n = 25; Ig-Nrxn1α/PTPσA–B– WT, n = 25; Ig-Nrxn1α/PTPσA–B– AAAA, n = 16; Ig-Nrxn1α/PTPσA+B+ WT, n = 20; IgC/Nlgn1, n = 14; IgC/PTPσA–B– WT, n = 14; IgC/PTPσA–B– AAAA, n = 16; and IgC/PTPσA+B+ WT, n = 14. p values for individual comparisons are as follows: IgC versus Ig-Nrxn1α/Nlgn1, p < 0.0001; IgC versus Ig-Nrxn1α/PTPσA–B– WT, p < 0.0001; IgC versus Ig-Nrxn1α/PTPσA–B– AAAA, p < 0.0001; IgC versus Ig-Nrxn1α/PTPσA+B+ WT, p < 0.0001. p values for PTPσA–B– WT: Ig-Nrxn1α/PTPσA–B– WT versus PTPσA–B– AAAA, p < 0.0001; and Ig-Nrxn1α/PTPσA–B– WT versus PTPσA+B+ WT, p < 0.0001. D, Representative images of cell-surface binding assays. HEK293T cells expressing HA-Nlgn1 or HA-PTPσ were incubated with 10 μg/ml of control IgC, Ig-Nrxn1α-SS4 WT, Ig-Nrxn1α-SS4ΔHS, Ig-Nrxn1β-SS4 WT, or Ig-Nrxn1β-SS4ΔHS, and then analyzed by immunofluorescence imaging of Ig-fusion proteins (red) and HA antibodies (green). Scale bar, 10 μm. E, Quantification of the average red intensities in green-positive regions of HEK293T cells in D. Data are mean ± SEM. ****p < 0.0001; ####p < 0.0001; Mann–Whitney U test. n indicates the number of cells as follows: Ig-Nrxn1α/Nlgn1, n = 28; Ig-Nrxn1α/PTPσ, n = 26; Ig-Nrxn1α ΔHS/Nlgn1, n = 24; Ig-Nrxn1α ΔHS/PTPσ, n = 34; Ig-Nrxn1β/Nlgn1, n = 21; Ig-Nrxn1β/PTPσ, n = 28; Ig-Nrxn1βΔHS/Nlgn1, n = 20; Ig-Nrxn1βΔHS/PTPσ, n = 22; IgC/Nlgn1, n = 19; and IgC/PTPσ, n = 18. p values for individual comparisons are as follows: IgC versus Ig-Nrxn1α/Nlgn1, p < 0.0001; IgC versus Ig-Nrxn1α/PTPσ, p < 0.0001; IgC versus Ig-Nrxn1α ΔHS/Nlgn1, p < 0.0001; IgC versus Ig-Nrxn1α ΔHS/PTPσ, p = 0.1632; IgC versus Ig-Nrxn1β/Nlgn1, p < 0.0001; IgC versus Ig-Nrxn1β/PTPσ, p < 0.0001; IgC versus Ig-Nrxn1βΔHS/Nlgn1, p < 0.0001; IgC versus Ig-Nrxn1βΔHS/PTPσ, p < 0.0001; Ig-Nrxn1α versus Ig-Nrxn1α ΔHS/PTPσ, p < 0.0001; Ig-Nrxn1α versus Ig-Nrxn1β/PTPσ, p < 0.0001; and Ig-Nrxn1α versus Ig-Nrxn1βΔHS/PTPσ, p < 0.0001.
Figure 10.
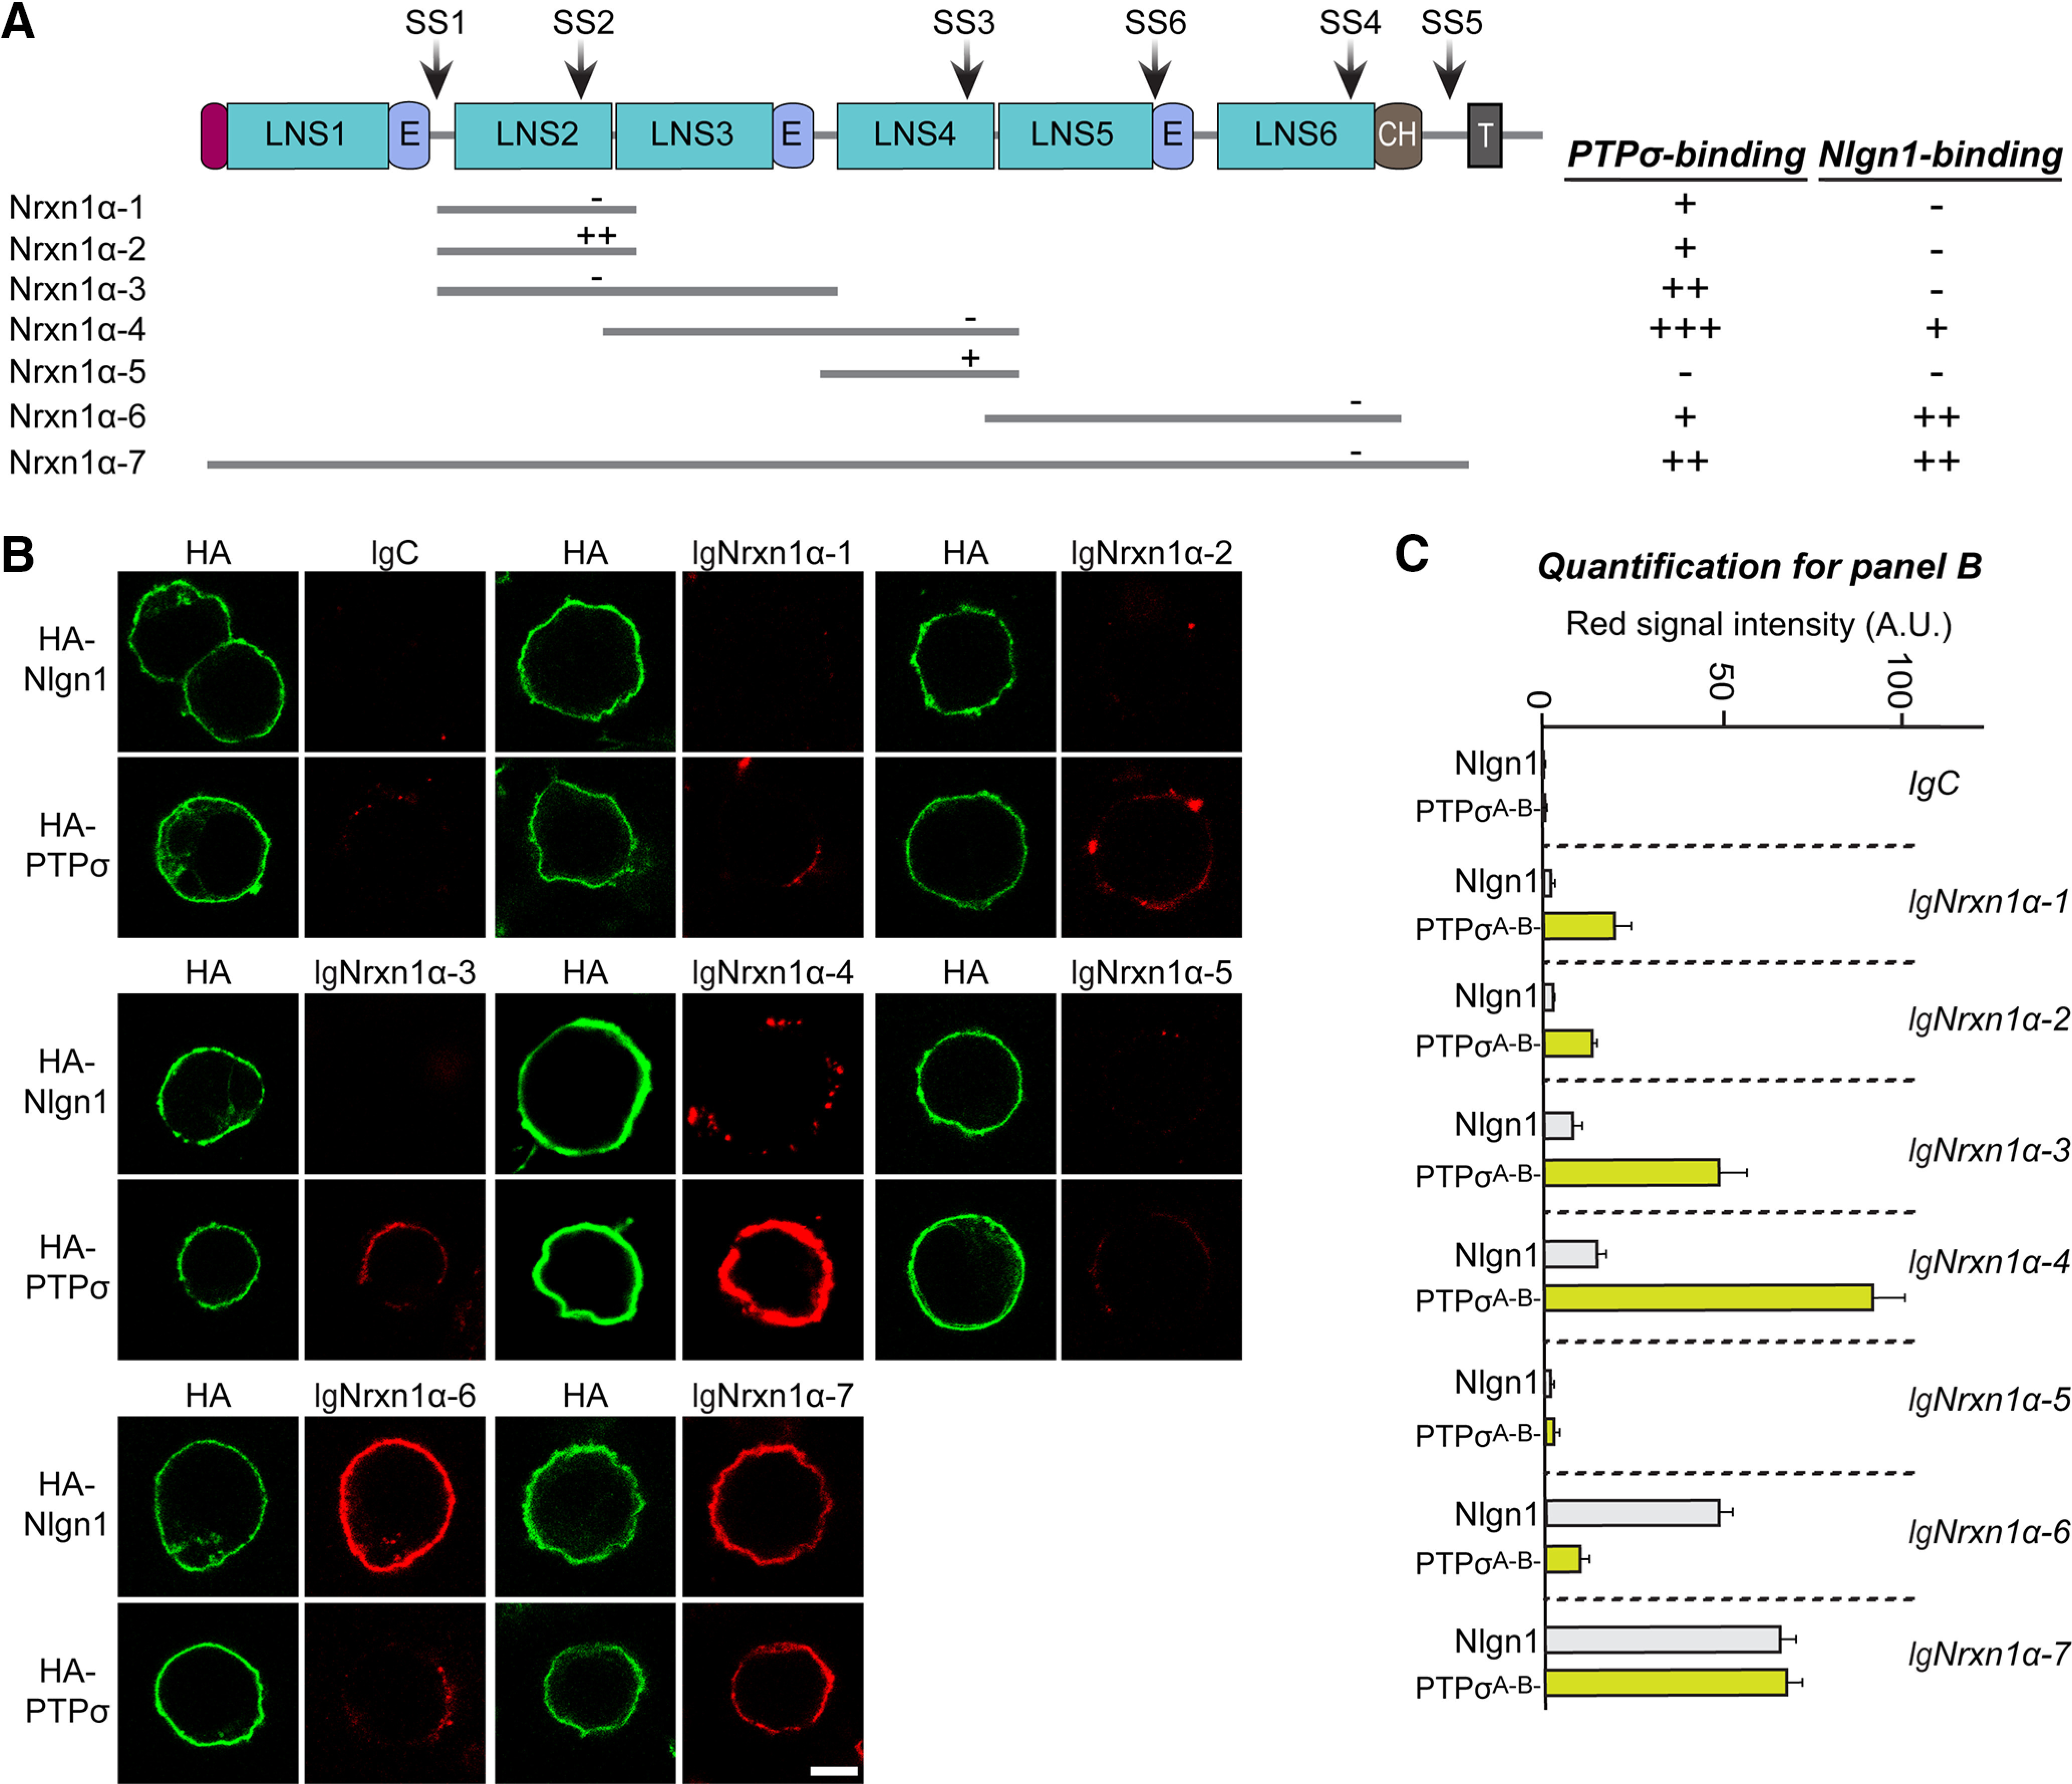
The LNS3 domain of Nrxn1α constitutes an additional PTPσ-binding region. A, Schematic diagrams of Nrxn1α WT and various deletion mutants. Binding strength was scored based on the range of the average red intensity as follows: –, 0–10; +, 10–40; ++, 40–70; and +++, > 70. B, Representative images of cell-surface binding assays. HEK293T cells expressing HA-Nlgn1 or HA PTPσ were incubated with 10 μg/ml of control IgC, Ig-Nrxn1α WT, or Ig-Nrxn1α deletion variants, and analyzed by immunostaining for HA (green) and Ig-fusion proteins (red). Scale bar, 10 μm. C, Quantification of the average red intensities in green-positive regions of HEK293T cells in B. n indicates the number of cells as follows: IgC/Nlgn1, n = 25; IgC/PTPσ, n = 32; Ig-Nrxn1α-1/Nlgn1, n = 26; Ig-Nrxn1α-1/PTPσ, n = 30; Ig-Nrxn1α-2/Nlgn1, n = 28; Ig-Nrxn1α-2/PTPσ, n = 33; Ig-Nrxn1α-3/Nlgn1, n = 16; Ig-Nrxn1α-3/PTPσ, n = 15; Ig-Nrxn1α-4/Nlgn1, n = 36; Ig-Nrxn1α-4/PTPσ, n = 48; Ig-Nrxn1α-5/Nlgn1, n = 29; Ig-Nrxn1α-5/PTPσ, n = 27; Ig-Nrxn1α-6/Nlgn1, n = 32; Ig-Nrxn1α-6/PTPσ, n = 31; Ig-Nrxn1α-7/Nlgn1, n = 44; and Ig-Nrxn1α-7/PTPσ, n = 39.
To further corroborate data from cell-surface binding assays, we performed pulldown assays using Ig-Nrxn1α WT, Ig-Nrxn1α ΔHS, or IgC (negative control) against lysates from HEK293T cells expressing HA-PTPσ WT (Fig. 11A). Ig-Nrxn1α, but not Ig-Nrxn1α ΔHS or IgC, captured PTPσ WT. We also performed pulldown assays using Ig-Nrxn1α WT against lysates from HEK293T cells expressing HA-PTPσ WT or HA-PTPσ AAAA (Fig. 11B). Again, Ig-Nrxn1α pulled down HA-PTPσ WT, but not HA-PTPσ AAAA, indicating a requirement for HS chains attached to both Nrxn1 and PTPσ. Moreover, Ig-Nrxn1α WT, but not Ig-Nrxn1α ΔHS, pulled down PTPσ in adult mouse brain synaptosomal fractions (Fig. 11C). Consistent with pulldown assay results, expression of HA-PTPσ WT, but not HA-PTPσ AAAA, in PTPσ-KD neurons rescued deficits in the induction of excitatory synapse formation in heterologous synapse-formation assays (Fig. 11D,E). Identical results were obtained using PTPσ-KO neurons (Fig. 11F,G). Collectively, these results suggest that HS binding to both PTPσ and Nrxn1 is crucial for their direct interaction and presynaptic assembly.
Figure 11.
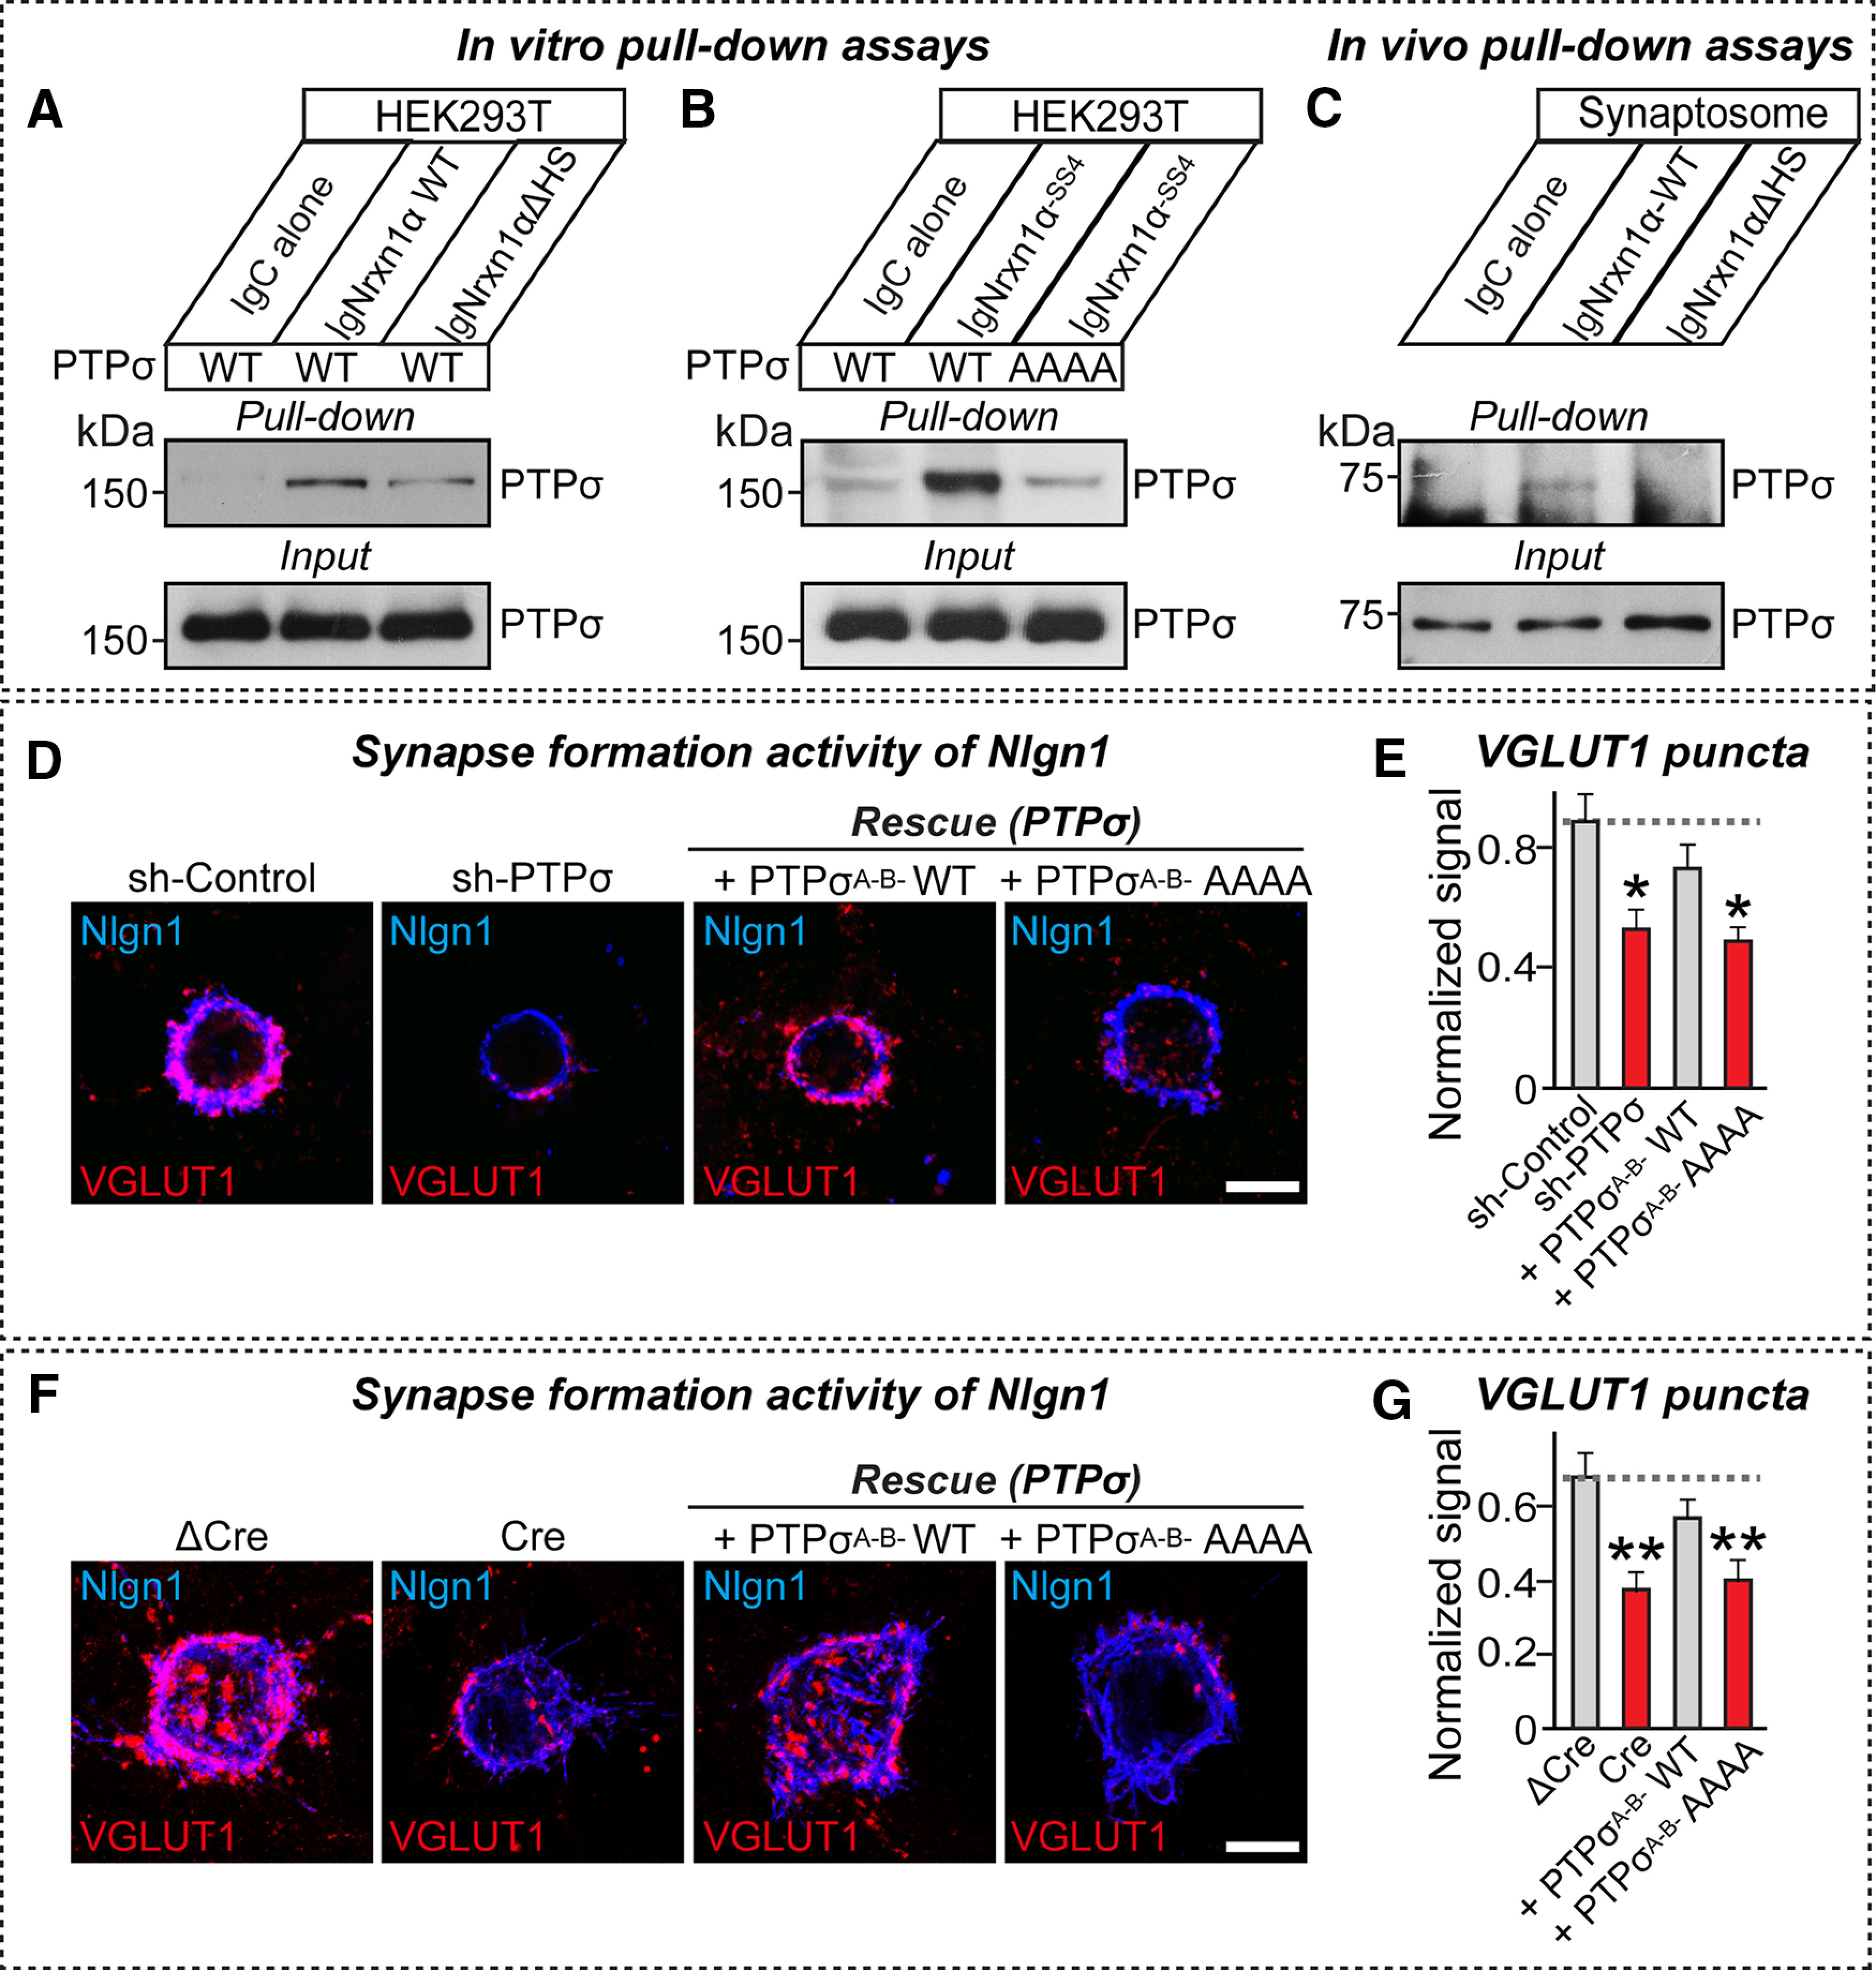
HS moieties attached to both Nrxn1α and PTPσ are critical for PTPσ-mediated presynaptic differentiation. A, B, In vitro pulldown assays. Recombinant Ig-Nrxn1α WT or Ig-Nrxn1α ΔHS proteins were immobilized using protein A-Sepharose and incubated with lysates of HEK293T cell transfected with the indicated HA-PTPσ variants. Immunoblots were performed using anti-PTPσ antibodies. C, In vivo pulldown assays. Recombinant Ig-Nrxn1α WT or Ig-Nrxn1α ΔHS proteins were immobilized using protein A-Sepharose and incubated with rat synaptosomal lysates. Immunoblotting was performed using the indicated antibodies. D, E, Representative images (D) and summary graphs (E) of heterologous synapse-formation assays. Cultured hippocampal neurons were infected with the indicated KD and/or rescue lentiviruses expressing PTPσ variants (PTPσA–B– WT or PTPσA–B– AAAA) at DIV4. HEK293T cells expressing Nlgn1-mVenus were cocultured with lentivirus-infected hippocampal neurons for 12 h at DIV12 and double-immunofluorescence stained for EGFP (blue) and VGLUT1 (red). Scale bar, 10 μm. Data are mean ± SEM. *p < 0.05; ANOVA with a nonparametric Kruskal–Wallis test. n indicates the number of cells as follows: sh-Control, n = 24; sh-PTPσ, n = 25; + PTPσA–B– WT, n = 18; and + PTPσA–B– AAAA, n = 26. p values for individual comparisons are as follows: sh-Control versus sh-PTPσ, p = 0.0193; sh-Control versus + PTPσA–B– WT, p > 0.9999; and sh-Control versus + PTPσA–B– AAAA, p = 0.0309. F, G, Representative images (F) and summary graphs (G) of heterologous synapse-formation assays in PTPσ-KO neurons. Cultured hippocampal neurons from PTPσ floxed mice were infected with lentiviruses expressing ΔCre (Control) or Cre (KO), or coinfected with Cre and the indicated lentiviruses expressing PTPσ variants (PTPσA–B– WT or PTPσA–B– AAAA) at DIV4. HEK293T cells expressing Nlgn1-mVenus were cocultured with lentivirus-infected hippocampal neurons for 12 h at DIV12 and double-immunofluorescence stained for EGFP (blue) and VGLUT1 (red). Scale bar, 10 μm. Data are mean ± SEM. **p < 0.01; ANOVA with a nonparametric Kruskal–Wallis test. n indicates the number of cells as follows: ΔCre, n = 16; Cre, n = 17; + PTPσA–B– WT, n = 15; and + PTPσA–B– AAAA, n = 19. p values for individual comparisons are as follows: ΔCre versus sh-PTPσ, p = 0.0058; ΔCre versus + PTPσA–B– WT, p > 0.9999; ΔCre versus + PTPσA–B– AAAA, p = 0.0028.
Nrxn1α inhibits PTPσ-induced postsynaptic differentiation at excitatory synapses
Previous studies have shown that Nrxns and LAR-RPTPs are sufficient to induce excitatory and inhibitory postsynaptic differentiation (Graf et al., 2004; Kang et al., 2008; Kwon et al., 2010). Notably, β-Nrxns and PTPσ are preferentially active at excitatory synapses, whereas α-Nrxns are exclusively active at inhibitory synapses (Kang et al., 2008; Kwon et al., 2010). We first asked whether different alternatively spliced variants of PTPσ have different abilities to induce postsynaptic differentiation. To test this, we cocultured hippocampal neurons with HEK293T cells expressing the indicated PTPσ splicing variants or Nrxn1 variants for 48 h, and monitored the clustering of postsynaptic marker proteins (SHANK and GABAAγ2). All tested PTPσ splice variants were capable of inducing SHANK clustering (Fig. 12A,B). Surprisingly, these PTPσ variants also recruited GABAAγ2 puncta to an extent similar to that of Nrxn1α (Fig. 12A,B). However, PTPσA–B–, the PTPσ variant with the highest Nrxn1-binding affinity (Fig. 4), recruited SHANK, but it did not recruit GABAAγ2 (Fig. 12A,B). PTPσ AAAA showed a comparable ability to trigger SHANK clustering, suggesting that HS binding to PTPσ is not a prerequisite for PTPσ postsynaptogenic activity (Fig. 12C,D). Parallel experiments showed that PTPδ was active in clustering SHANK, but not GABAAγ2, suggesting that PTPδ might be differentially engaged in inducing GABAergic presynaptic assembly and glutamatergic postsynaptic assembly (Fig. 12C,D). Notably, Nrxn1α ΔHS exhibited similar GABAAγ2 clustering activity, suggesting that HS chain moieties attached to Nrxn1α are dispensable in mediating postsynaptic differentiation (Fig. 12E,F). We then tested whether PTPσA–B– affected the ability of Nrxn1α to specifically recruit GABAAγ2, or vice versa. Remarkably, Nrxn1α, but not Nrxn1α ΔHS, significantly impaired the SHANK and GluA1 (a subunit of AMPA-type glutamate receptors) clustering ability of PTPσA–B– at glutamatergic synapses (Fig. 12G,H), underscoring the physiological significance of Nrxn1α-PTPσ interactions. PTPσA–B– did not influence Nrxn1α activity with respect to GABAAγ2 clustering (Fig. 12G,H). Coexpressed Nrxn1α and PTPσ did not influence the expression levels of each other (Fig. 12I,J). To further test whether Nrxn1α regulates the maintenance of excitatory postsynaptic specializations in PTPσ-deficient cultured hippocampal neurons, we infected lentiviruses expressing PTPσA–B–, or coexpressing PTPσA–B– with either Nrxn1α WT or Nrxn1α ΔHS at DIV4, and performed immunocytochemical analyses of SHANK, used as an excitatory postsynaptic marker (Fig. 13). We found that expression of PTPσA–B– was capable of rescuing the reduction in SHANK puncta, whereas coexpression of Nrxn1α WT with PTPσA–B– significantly attenuated the PTPσ-mediated rescue effect on excitatory synapse density (Fig. 13). In contrast, coexpression of Nrxn1α ΔHS with PTPσ exerted no suppressive effect (Fig. 13). Overall, our results suggest that Nrxn1α may restrict the ability of PTPσ to drive postsynaptic differentiation at glutamatergic, but not GABAergic, synapses.
Figure 12.
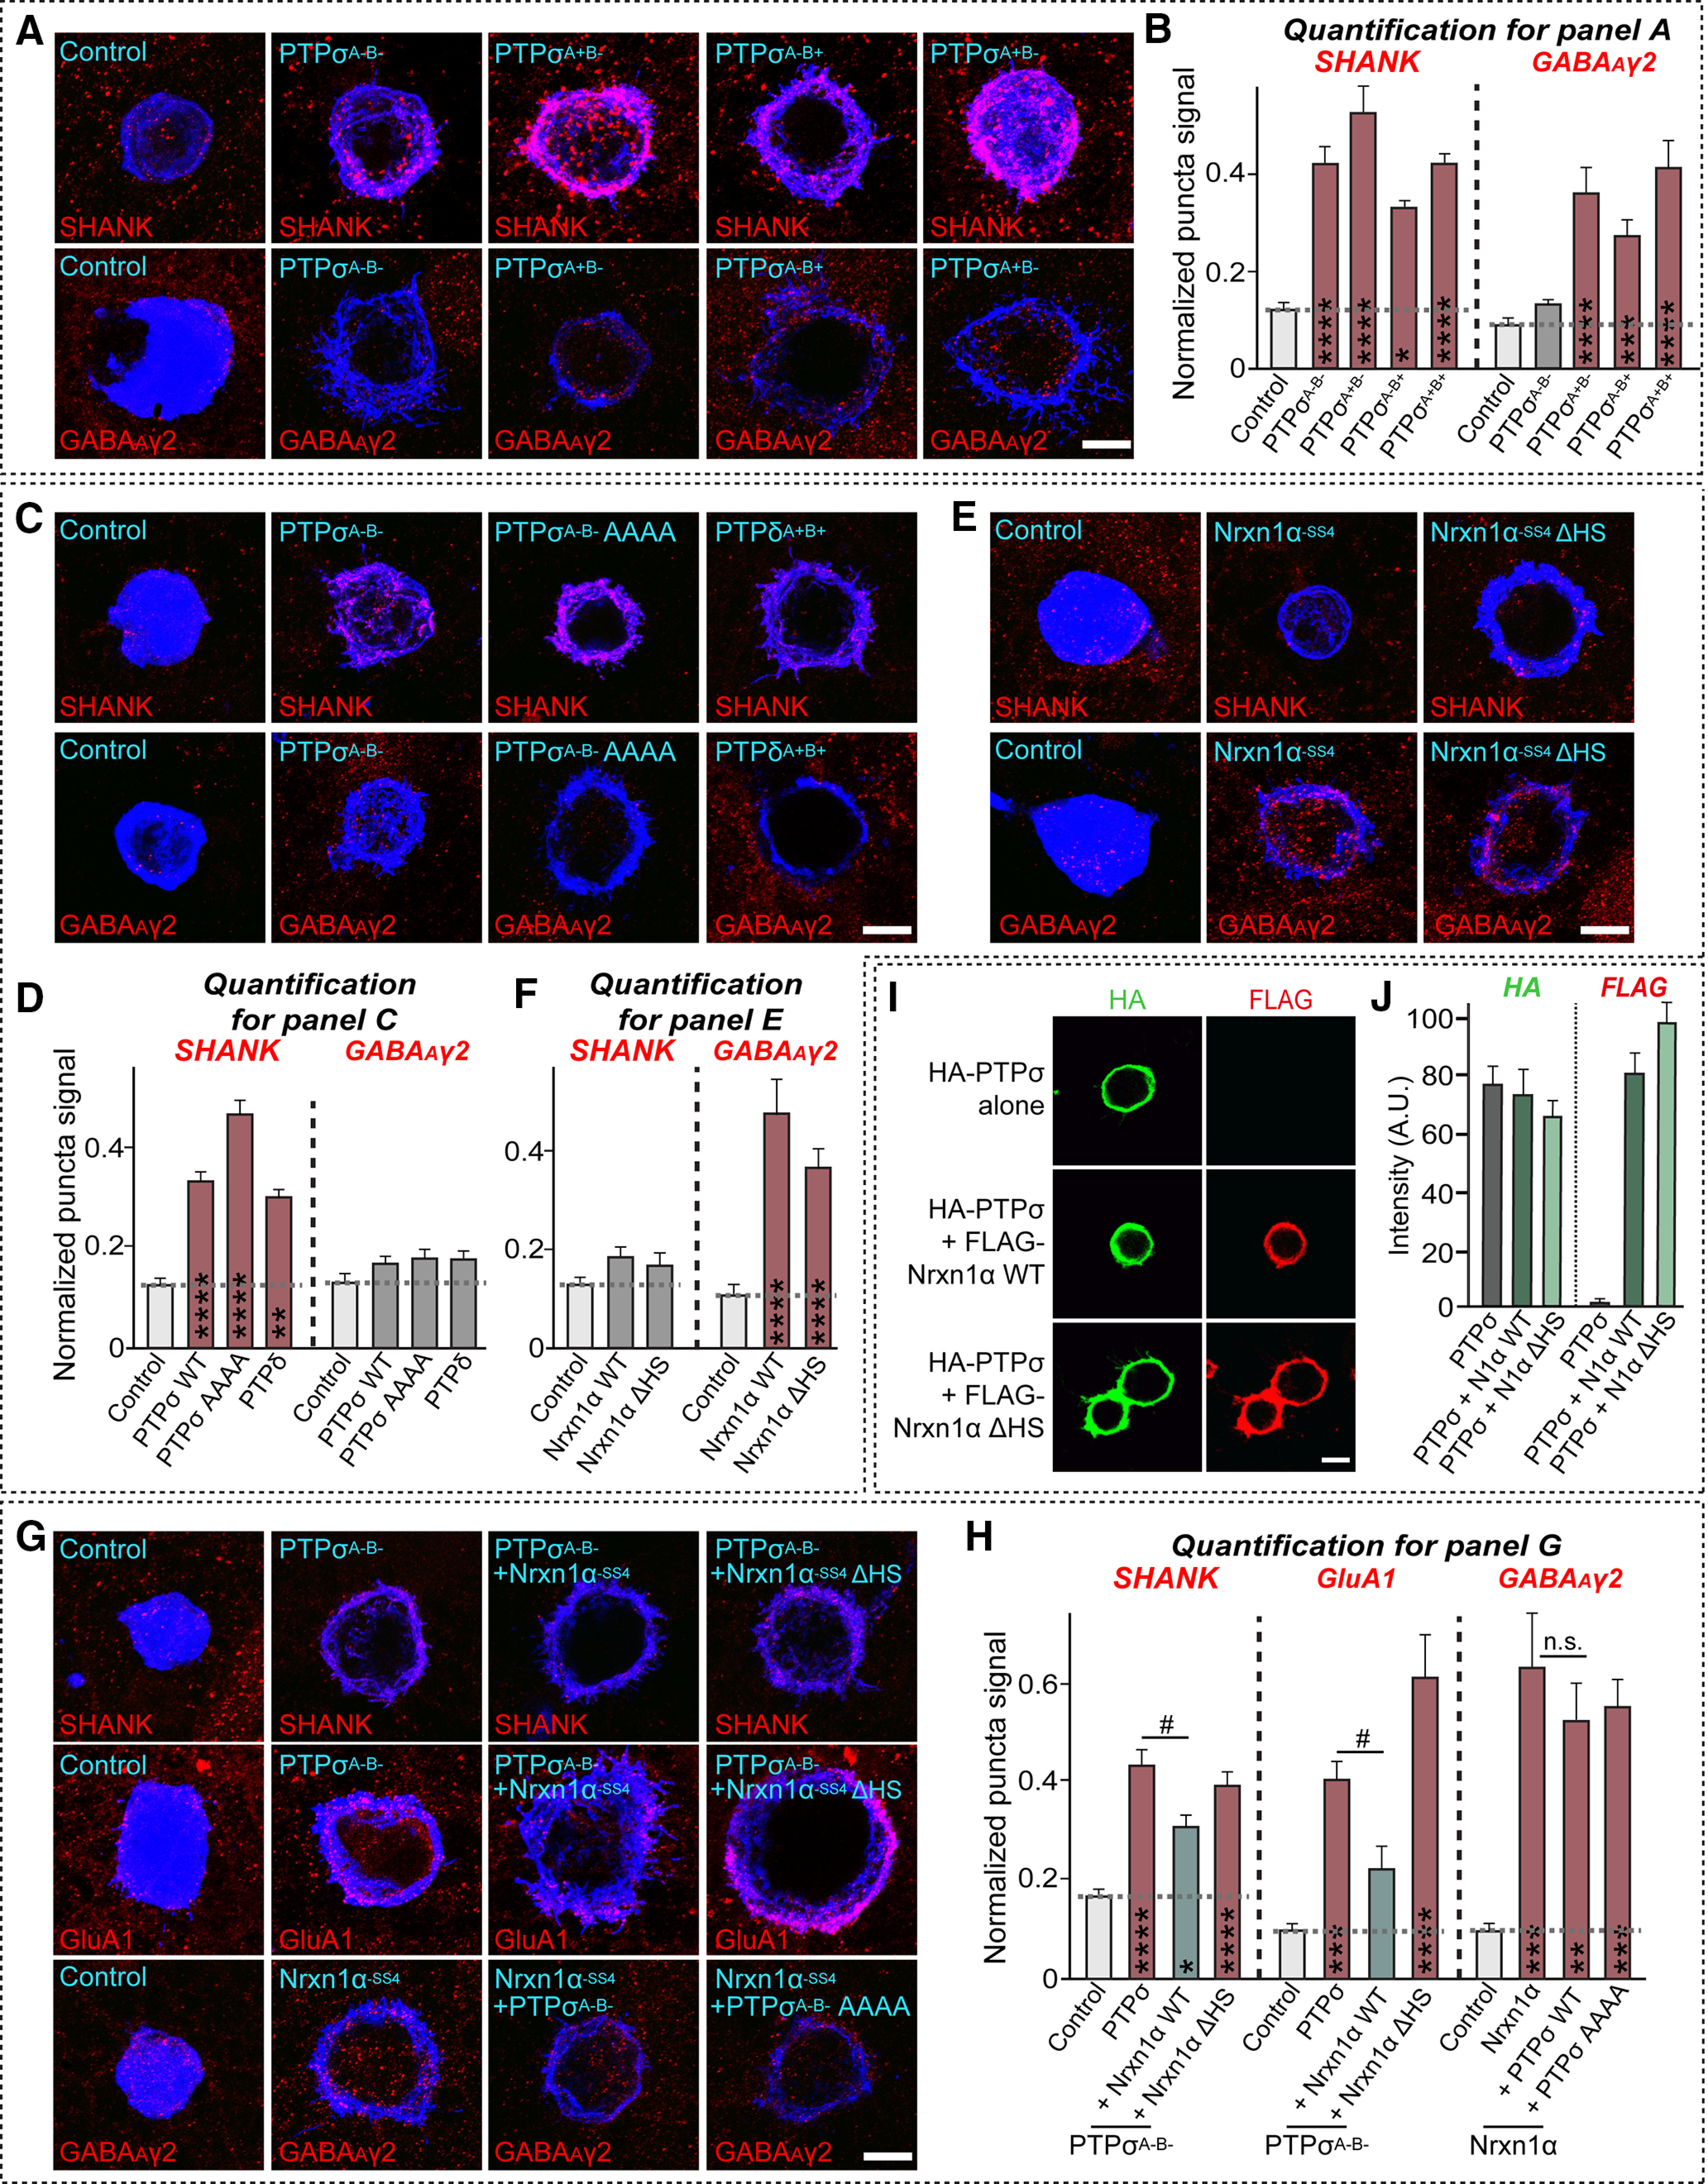
Nrxn1α modulates postsynaptic clustering activity of PTPσ at excitatory, but not inhibitory, synapses. A, Representative images of the heterologous synapse-formation activity of four different PTPσ splice variants. Hippocampal neurons were cocultured with HEK293T cells expressing HA-tagged PTPσ splice variants at DIV10 for 48 h. Synaptogenic activities were analyzed by double-immunostaining for HA (blue) and SHANK (red) or GABAAγ2 (red). Scale bar, 10 μm. B, Quantification of synaptogenic activities in A by measuring red staining intensity normalized to blue staining intensity. Data are mean ± SEM. *p < 0.05; ***p < 0.001; ****p < 0.0001; ANOVA with a nonparametric Kruskal–Wallis test. Control/SHANK, n = 31; PTPσA–B–/SHANK, n = 17; PTPσA+B–/SHANK, n = 19; PTPσA–B+/SHANK, n = 19; PTPσA+B+/SHANK, n = 14; Control/GABAAγ2, n = 12; PTPσA–B–/GABAAγ2, n = 16; PTPσA+B–/GABAAγ2, n = 18; PTPσA–B+/GABAAγ2, n = 17; and PTPσA+B+/GABAAγ2, n = 19. p values for individual comparisons are as follows: Control versus PTPσA–B–/SHANK, p < 0.0001; Control versus PTPσA+B–SHANK, p < 0.0001; Control versus PTPσA–B+/SHANK, p = 0.0109; Control versus PTPσA+B+/SHANK, p < 0.0001; Control versus PTPσA–B–/GABAAγ2, p > 0.9999; Control versus PTPσA+B–/GABAAγ2, p < 0.0001; Control versus PTPσA–B+/GABAAγ2, p = 0.0007; and Control versus PTPσA+B+/GABAAγ2, p < 0.0001. C, Representative images of the heterologous synapse-formation activity of PTPσ variants (WT or AAAA). Hippocampal neurons were cocultured with HEK293T cells expressing the indicated HA-tagged PTPσ variants at DIV10 for 72 h. Synaptogenic activities were analyzed by double-immunostaining for HA (blue) and SHANK (red) or GABAAγ2 (red). Scale bar, 10 μm. D, Quantification of synaptogenic activities in C by measuring red staining intensity normalized to blue staining intensity. Data are mean ± SEM. **p < 0.01; ****p < 0.0001; ANOVA with a nonparametric Kruskal–Wallis test. Control/SHANK, n = 20; PTPσ/SHANK, n = 24; PTPσ AAAA/SHANK, n = 28; PTPδ/SHANK, n = 18; Control/GABAAγ2, n = 24; PTPσ/GABAAγ2, n = 28; PTPσ AAAA/GABAAγ2, n = 33; and PTPδ/GABAAγ2, n = 32. p values for individual comparisons are as follows: Control versus PTPσ/SHANK, p < 0.0001; Control versus PTPσ AAAA/SHANK, p < 0.0001; Control versus PTPδ/SHANK, p = 0.0023; Control versus PTPσ/GABAAγ2, p = 0.1872; Control versus PTPσ AAAA/GABAAγ2, p = 0.0742; and Control versus PTPδ/GABAAγ2, p = 0.0597. E, Representative images of the heterologous synapse-formation activities of Nrxn1α variants (WT or ΔHS). Hippocampal neurons were cocultured with HEK293T cells expressing HA-tagged Nrxn1α variants at DIV10 for 72 h. Synaptogenic activities were analyzed by double-immunostaining for HA (blue) and SHANK (red) or GABAAγ2 (red). Scale bar, 10 μm. F, Quantification of synaptogenic activities in E by measuring red staining intensity normalized to blue staining intensity. Data are mean ± SEM. ****p < 0.0001; ANOVA with a nonparametric Kruskal–Wallis test. Control/SHANK, n = 20; Nrxn1α/SHANK, n = 18; Nrxn1α ΔHS/SHANK, n = 16; Control/GABAAγ2, n = 24; Nrxn1α/GABAAγ2, n = 23; and Nrxn1α ΔHS/GABAAγ2, n = 26. p values for individual comparisons are as follows: Control versus Nrxn1α/SHANK, p = 0.1107; Control versus Nrxn1α ΔHS/SHANK, p = 0.4697; Control versus Nrxn1α/GABAAγ2, p < 0.0001; and Control versus Nrxn1α ΔHS/GABAAγ2, p < 0.0001. G, Representative images of the heterologous synapse-formation activities of PTPσ expressed alone or coexpressed with Nrxn1α variants (WT or ΔHS). Hippocampal neurons were cocultured with HEK293T cells expressing HA-tagged Nrxn1α variants at DIV10 for 72 h. Synaptogenic activities were analyzed by double-immunostaining for HA (blue) and SHANK (red), GluA1 (red), or GABAAγ2 (red). Scale bar, 10 μm. H, Quantification of synaptogenic activities in G by measuring red staining intensity normalized to blue staining intensity. Data are mean ± SEM. *p < 0.05; **p < 0.01; ***p < 0.001; ****p < 0.0001; #p < 0.05; ANOVA with a nonparametric Kruskal–Wallis test. Data are mean ± SEM. Control/SHANK, n = 14; PTPσ/SHANK, n = 21; PTPσ + Nrxn1α/SHANK, n = 22; PTPσ + Nrxn1α ΔHS/SHANK, n = 16; Control/GluA1, n = 14; PTPσ/GluA1, n = 21; PTPσ + Nrxn1α/GluA1, n = 13; PTPσ + Nrxn1α ΔHS/GluA1, n = 13; Control/GABAAγ2, n = 12; Nrxn1α/GABAAγ2, n = 9; Nrxn1α + PTPσ/GABAAγ2, n = 9; and Nrxn1α + PTPσ AAAA/GABAAγ2, n = 9. p values for individual comparisons are as follows: Control versus PTPσ/SHANK, p < 0.0001; Control versus PTPσ + Nrxn1α/SHANK, p = 0.0116; Control versus PTPσ + Nrxn1α ΔHS/SHANK, p < 0.0001; Control versus PTPσ/GluA1, p = 0.0004; Control versus PTPσ + Nrxn1α/GluA1, p = 0.9783; Control versus PTPσ + Nrxn1α ΔHS/GluA1, p < 0.0001; Control versus Nrxn1α/GABAAγ2, p = 0.0005; Control versus Nrxn1α + PTPσ/GABAAγ2, p = 0.0024; Control versus Nrxn1α + PTPσ AAAA/GABAAγ2, p = 0.0003; PTPσ versus PTPσ + Nrxn1α/SHANK, p = 0.0432; PTPσ versus PTPσ + Nrxn1α ΔHS/SHANK, p > 0.9999; PTPσ versus PTPσ + Nrxn1α/GluA1, p = 0.0463; PTPσ versus PTPσ + Nrxn1α ΔHS/SHANK, p = 0.9801; Nrxn1α versus Nrxn1α + PTPσ/GABAAγ2, p > 0.9999; Nrxn1α versus Nrxn1α + PTPσ AAAA/GABAAγ2, p > 0.9999. I, J, Representative images (I) of HEK293T cells expressing HA-PTPσ variants (WT or ΔHS; green) or coexpressing HA-PTPσ with FLAG-tagged Nrxn1α WT (red), and quantification of green and red fluorescence intensities (J). Scale bar, 10 μm.
Figure 13.

Nrxn1α negatively regulates the excitatory postsynapse development activity of PTPσ. A, Representative images from PTPσ floxed cultured hippocampal neurons infected with lentiviruses expressing ΔCre or Cre, or coinfected with lentiviruses expressing Cre and the indicated overexpression viruses at DIV4 and captured by double-immunofluorescence detection of MAP2 (blue) and the excitatory postsynaptic marker SHANK (red) at DIV14. Scale bar: all images, 10 μm. B, Summary graphs showing SHANK puncta density (left) and SHANK puncta size (right) from A. Two or three dendrites per transfected neuron were analyzed and group-averaged. Data are mean ± SEM. **p < 0.01; ***p < 0.001; ANOVA with a nonparametric Kruskal–Wallis test. ΔCre, n = 16; Cre, n = 14; + PTPσA–B–, n = 18; + PTPσA–B– + Nrxn1α WT, n = 19; and + PTPσA–B– + Nrxn1α ΔHS, n = 15. p values for individual comparisons of puncta density are as follows: ΔCre versus Cre, p = 0.0050; ΔCre versus + PTPσA–B–, p > 0.9999; ΔCre versus + PTPσA–B– + Nrxn1α WT, p = 0.0001; and ΔCre versus + PTPσA–B– + Nrxn1α ΔHS, p > 0.9999. p values for individual comparisons of puncta size are as follows: ΔCre versus Cre, p > 0.9999; ΔCre versus + PTPσA–B–, p = 0.1013; ΔCre versus + PTPσA–B– + Nrxn1α WT, p > 0.9999; and ΔCre versus + PTPσA–B– + Nrxn1α ΔHS, p = 0.3734.
Dlar and Dnrx mediate epistatic interactions at Drosophila NMJs to promote synapse formation and synaptic transmission, but not synaptic growth
To delineate the physiological significance of Nrxn/LAR-RPTP interactions in vivo, we addressed whether these interactions regulate synaptic structure and functions at Drosophila larval NMJs, where their roles have been well described (Sun and Xie, 2012). The Dlar mutant exhibited a synaptic undergrowth phenotype similar to the Dnrx mutant (Kaufmann et al., 2002; Johnson et al., 2006), suggesting a functional relationship between these genes. To test this possibility, we examined transheterozygous interaction between Dlar and Dnrx. Intriguingly, transheterozygous Dlar5.5/+; DnrxΔ83/+ displayed morphologic phenotypes similar to those of flies single heterozygous for either Dlar or Dnrx, suggesting that Dlar and Dnrx might function separately in controlling formation of presynaptic boutons at NMJs (Fig. 14A,B; F(3,80) = 5.1032, p = 0.0028). We next measured functional properties of these NMJs by measuring synaptic currents using a two-electrode voltage-clamp approach. Measurements of evoked synaptic responses showed significantly decreased amplitudes in both Dlar5.5/Df (null for Dlar function) (Krueger et al., 1996) and DnrxΔ83 (null for Dnrx function) (Zeng et al., 2007). In transheterozygous Dlar5.5/+; DnrxΔ83/+, evoked junction current amplitudes were significantly decreased, compared with single heterozygotes (Fig. 14C,D; F(5,95) = 7.7280, p < 0.0001), suggesting that both Dlar and Dnrx act in the same pathway (Anholt and Mackay, 2004). To further probe whether these transheterozygous interactions impact presynaptic functions, we measured paired-pulse ratio (PPR), defined as the ratio of the amplitudes of first and second postsynaptic currents evoked by two closely separated stimulations. Neither heterozygous Dlar5.5/+ nor DnrxΔ83/+ had significantly increased PPRs, but transheterozygous Dlar5.5/+; DnrxΔ83/+ showed increased PPRs at 100 ms interstimulus intervals (Fig. 14E,F; F(5,110) = 3.6404, p = 0.0044), indicating that these two proteins function together in regulating presynaptic neurotransmitter release. We next analyzed synaptic vesicle populations using cysteine string protein (CSP), a synaptic vesicle-associated protein. Although expression patterns of CSP proteins were similar overall in all examined genotypes, we found that CSP intensity was markedly increased in Dlar5.5/Df and DnrxΔ83 flies compared with WT flies (Fig. 14G,H). Again, transheterozygous Dlar5.5/+; DnrxΔ83/+ mutants exhibited similarly increased CSP intensities compared with heterozygous controls (Fig. 14G,H; F(5,211) = 20.1223, p < 0.0001). These results suggest that Dlar and Dnrx regulate exocytosis, but not membrane targeting of presynaptic vesicles; thus, their deficiency might trigger enhanced accumulation of CSP proteins within the less numerous presynaptic boutons. Collectively, our results demonstrate that epistatic interactions between Dlar and Dnrx regulate Drosophila NMJ synaptic structure and function, and likely maintain appropriate numbers of functional presynaptic boutons and organize vesicle release probability.
Figure 14.

Genetic interactions of Dlar and Dnrx are required for the synaptic structure and strength, but not synaptic growth, of NMJs in Drosophila. A, B, Confocal images of NMJ6/7 labeled with an anti-HRP antibody (green) (A), and quantification of total bouton number (B) are shown for the indicated genotypes. Scale bar, 50 µm. Data are mean ± SEM. *p < 0.05; **p < 0.01; ***p < 0.001; n.s., not significant; ANOVA with Fisher's least significant difference test. n indicates the number of flies as follows: WT, n = 20; Dlar5.5/+, n = 15; DnrxΔ83/+, n = 17; and Dlar5.5/+;DnrxΔ83/+, n = 32. p values for individual comparisons are as follows: WT versus Dlar5.5/+, p = 0.0008; WT versus DnrxΔ83/+, p = 0.0153; WT versus Dlar5.5/+;DnrxΔ83/+, p = 0.0016; Dlar5.5/+ versus Dlar5.5/+;DnrxΔ83/+, p = 0.3993; and DnrxΔ83/+ versus Dlar5.5/+;DnrxΔ83/+, p = 0.7101. C, D, Representative traces of eEJCs (C) and quantification of mean EJC amplitudes (D) of NMJ synapses. Data are mean ± SEM. **p < 0.01; ***p < 0.001; #p < 0.05; ###p < 0.001; ANOVA with LSD test. n indicates the number of flies as follows: WT, n = 13; Dlar5.5/+, n = 16; Dlar5.5/Df, n = 24; DnrxΔ83/+, n = 15; DnrxΔ83, n = 16; and Dlar5.5/+; DnrxΔ83/+, n = 17. p values for individual comparisons are as follows: WT versus Dlar5.5/+, p = 0.3276; WT versus Dlar5.5/Df, p = 0.0004; WT versus DnrxΔ83/+, p = 0.0077; WT versus DnrxΔ83, p < 0.0001; WT versus Dlar5.5/+;DnrxΔ83/+, p < 0.0001; Dlar5.5/+ versus Dlar5.5/+;DnrxΔ83/+, p < 0.0001; and DnrxΔ83/+ versus Dlar5.5/+;DnrxΔ83/+, p = 0.0284. E, Representative paired-pulse traces from the indicated genotypes at 100 ms interstimulus intervals. F, Bar graphs of mean PPR at 100 ms ISI. Data are mean ± SEM. *p < 0.05; **p < 0.01; #p < 0.05; ###p < 0.001; ANOVA with LSD test. n indicates the number of flies as follows: WT, n = 14; Dlar5.5/+, n = 18; Dlar5.5/Df, n = 25; DnrxΔ83/+, n = 24; DnrxΔ83, n = 13; and Dlar5.5/+; DnrxΔ83/+, n = 22. p values for individual comparisons are as follows: WT versus Dlar5.5/+, p = 0.7152; WT versus Dlar5.5/Df, p = 0.0493; WT versus DnrxΔ83/+, p = 0.4639; WT versus DnrxΔ83, p = 0.1229; WT versus Dlar5.5/+;DnrxΔ83/+, p = 0.0038; Dlar5.5/+ versus Dlar5.5/+;DnrxΔ83/+, p = 0.0005; and DnrxΔ83/+ versus Dlar5.5/+;DnrxΔ83/+, p = 0.0110. G, H, Confocal images of NMJ 6/7 doubly immunostained with anti-HRP (green) and anti-CSP (red) antibodies (G), and quantification of CSP staining intensity normalized to that of WT controls (H) are shown for the indicated genotypes. Data are mean ± SEM. **p < 0.01; ***p < 0.001; ###p < 0.001; ANOVA with LSD test. n indicates the number of NMJ 6/7 of abdominal segment A2 as follows: WT, n = 40; Dlar5.5/+, n = 34; Dlar5.5/Df, n = 37; DnrxΔ83/+, n = 33; DnrxΔ83, n = 27; and Dlar5.5/+; DnrxΔ83/+, n = 46. Scale bar, 10 µm. p values for individual comparisons are as follows: WT versus Dlar5.5/+, p = 0.0016; WT versus Dlar5.5/Df, p < 0.0001; WT versus DnrxΔ83/+, p = 0.0004; WT versus DnrxΔ83, p < 0.0001; WT versus Dlar5.5/+;DnrxΔ83/+, p < 0.0001; Dlar5.5/+ versus Dlar5.5/+;DnrxΔ83/+, p < 0.0001; and DnrxΔ83/+ versus Dlar5.5/+;DnrxΔ83/+, p < 0.0001.
Discussion
Nrxns and LAR-RPTPs are arguably the key presynaptic adhesion molecules, mediating multifarious synaptic adhesion pathways. However, whether they cooperate in presynaptic and/or postsynaptic assembly has not been investigated. Our study extends the current conceptualization of the synaptic adhesion processes that exquisitely modulate the diversity of trans-synaptic signaling; the significance is revealed across evolution. We highlight four implications of our current study that are important for understanding synapse organization.
First, Nrxns mediate cis interactions with specific PTPσ splice variants, thereby maximizing the possibility of physical and functional intersections among intracellular components that separately couple with either Nrxns or LAR-RPTPs. Notably, Nrxns do not use a strategy similar to that of PTPσ (Fig. 15). Nrxns use intracellular sequences for preferential targeting to presynaptic membranes, particularly their C-terminal Type II PDZ-binding motifs, but do not use them for trans-synaptic coordination of synaptogenic signals (Fairless et al., 2008; Gokce and Südhof, 2013). The precise identities and roles of PDZ-containing proteins that bind to Nrxns remain to be determined, although intracellular transport vesicles driven by neuronal activity carry Nrxns and some PDZ-containing proteins together along motor protein KIF1A-mediated microtubules (Fairless et al., 2008; Neupert et al., 2015). Once Nrxns and a set of intracellular proteins are initially targeted to nascent presynaptic boutons, it is likely that interactions of Nrxns with LAR-RPTP variants stimulate further recruitment of molecular components for presynaptic functions, ultimately leading to establishment of presynaptic differentiation. In support of this hypothesis, PTPσ is not required for either the early or late phase of Nlgn1-mediated presynaptic assembly, but it is required for the middle phase (Fig. 2; Extended Data Fig. 2-1). These results suggest that different phases of presynaptic assembly feature recruitment of distinct molecular components and differential dynamics of even identical sets of molecules. Alternatively, these results could be interpreted as meaning that PTPσ is crucial for timed Nlgn1-mediated presynaptic assembly. However, although a proof of concept for distinct molecular components responsible for Nrxn- and/or LAR-RPTP-mediated presynaptic assembly was proposed (Fig. 15), it remains to be determined whether this model can be applied universally or is limited to the context of specific synapse types in vivo. In particular, given limitations of shRNA-induced KD approaches used in the current study and our limited understanding of how multicomplex components in presynaptic neurons are dynamically tuned during presynaptic assembly, a systematic validation targeting key presynaptic proteins using more sophisticated genetic tools is warranted. High-resolution time-lapse imaging in conjunction with single-particle tracking might be one way to address this concept. Importantly, how association of LAR-RPTP variants with Nrxns is coupled to recruitment of specific vesicular types (i.e., glutamate-containing vs GABA-containing synaptic vesicles) should be precisely determined.
Figure 15.

Molecular model of LAR-RPTP and Nrxn actions in shaping trans-synaptic signaling pathways. LAR-RPTPs directly interact with Nrxns and act as their coreceptors to mediate presynaptic differentiation (A). Notably, combinations of distinct molecular components in presynaptic neurons underlie different actions of PTPσ and PTPδ at excitatory and inhibitory synapses, respectively. α-Nrxns might negatively modulate the interaction affinity of PTPσ with its respective postsynaptic ligands (e.g., TrkC or Slitrk2) by increasing local HS concentrations to orchestrate postsynaptic assembly (B). Abl, Abelson tyrosine kinase; β-Cat, β-catenin; CASK, calcium/calmodulin-dependent serine protein kinase; CASKIN, CASK interacting protein; ELKS, glutamine, leucine, lysine, and serine-rich protein; Ena, enabled; MIM-B, missing-in-metastasis B; N-cad, N-cadherin; RIM1, Rab3-interacting molecule 1; RIM-BP, RIM-binding protein; Slitrk, Slit- and Trk-like protein; SYDE1, synapse-defective Rho GTPase homolog 1; TrkC, tropomyosin receptor kinase C.
Second, HS glycan chains diversify synaptic adhesion pathways involving Nrxns and LAR-RPTPs, which interact with each other in a manner that depends on HS availability at the extracellular synaptic cleft and on alternative splicing (in the case of PTPσ) (Fig. 9). Notably, HS leads to multimeric states of PTPσ and instructs PTPσ to select its binding partners; specifically, it promotes binding to glypicans while decreasing binding to TrkC or Slitrks, thereby contributing to modulation of synaptic strength, a process that is further regulated by neurotrophins (Ammendrup-Johnsen et al., 2015; Ko et al., 2015; Han et al., 2016; Won et al., 2017). Multimerized PTPσ (induced by HS) interacts with glypicans and is indirectly linked to other membrane proteins, such as LRRTM4 or GPR158 (Ko et al., 2015; Condomitti and de Wit, 2018; Condomitti et al., 2018). HS also binds to Nrxns to regulate their synaptic functions, but it does not inhibit binding to other Nrxn ligands (Zhang et al., 2018; Roppongi et al., 2020). Intriguingly, loss of hippocampal glypicans does not influence LAR-RPTP- or Nrxn-mediated postsynaptic differentiation. Thus, it is plausible that HS-attached Nrxns act as a key platform, potentially in the form of nanoclusters (Trotter et al., 2019): to diversify trans-synaptic signals, possibly by intertwining nonoverlapping ligands in postsynaptic neurons. Although the current study used KD-based analyses, addressing the significance of these interactions (see our account of performing analyses in Drosophila NMJs, below) will require future investigations that analyze alterations in postsynaptic differentiation using genetic knock-in mice deficient for HS binding to all Nrxns are warranted, despite the reported severe phenotypes in Nrxn1 HS binding knock-in mice (Zhang et al., 2018). Another pressing issue is addressing why α-Nrxns exhibit higher binding affinity for PTPσ than β-Nrxns. During preparation of this manuscript, it was also reported that PTPσ binds to β-Nrxns with a similar Kd value (Roppongi et al., 2020). One clue is that α-Nrxn-unique extracellular sequences in the LNS3 domain constitute a second binding region for PTPσ (Fig. 10); alternatively, there may be other HS binding residues within α-Nrxn-unique sequences.
Third, alternative splicing of PTPσ specifies activation of specific synaptic adhesion pathways by modulating interactions not only with postsynaptic ligands, but also with presynaptic Nrxns. The HS concentration further dictates the identity of PTPσ-mediated synaptic adhesion pathways by weighting interactions toward PTPσ-HS glypicans (i.e., glypicans and Nrxns). This interpretation is also consistent with our demonstration that coexpressed Nrxn1α might inhibit the interaction of PTPσ with known postsynaptic ligands (e.g., TrkC and Slitrks) by increasing local HS concentrations at synaptic junctions (Coles et al., 2014; Won et al., 2017), thereby resulting in decreased SHANK clustering (Fig. 12). HS inhibits the trans interactions of PTPδ with IL1RAPL1 or IL-1RAcP (Won et al., 2017), suggesting that distinct postsynaptic clustering could be activated similarly. It would be interesting if other known ligands for LAR-RPTPs (i.e., synaptic adhesion-like molecules and netrin-G ligand 3) could be engaged with similar HS-dependent mechanisms, although netrin-G ligand 3 is unlikely to be involved because of its binding to the first two fibronectin Type III repeats that do not overlap with the HS binding immunoglobulin-like domains of LAR-RPTPs (Kwon et al., 2010). In particular, a number of postsynaptic ligands for Nrxns and LAR-RPTPs possess PDZ domain-binding sequences, providing a direct route to key postsynaptic machineries (e.g., PSD-95/SAPAP/SHANK complex) for trans-synaptic regulation. Given that Nrxn1α instructs PTPσ to induce activation of glypican/LRRTM4 complexes (Ko et al., 2015), and is also further capable of recruiting PSD-95/SAPAP/SHANK complexes, it is tempting to propose that PTPσ/Nrxn1α complexes might trans-synaptically tune molecular crowding in postsynaptic neurons by influencing the limited sets of postsynaptic slots (Fig. 15). Nevertheless, how PTPσ and PTPδ direct the activity of Nrxns to specific types of presynaptic and postsynaptic assembly is still obscure. In particular, the diversity of postsynaptic ligands that contribute to nucleation of the protein interaction network downstream of specific Nrxn/LAR-RPTP complex remains to be determined. More importantly, whether this mechanism occurs in specific cell types, specific subcellular compartment of neurons, or specific synapse types should be systematically investigated to round out our understanding of synapse organization. It will also be interesting to determine whether functional crosstalk between nonoverlapping postsynaptic ligands for Nrxns and LAR-RPTPs occurs in postsynaptic neurons, independently of activation of Nrxn/LAR-RPTP complexes in presynaptic neurons.
Last, presynaptic Nrxns and LAR-RPTPs act in a common downstream pathway in vivo. Instead of mouse genetics, we turned to the Drosophila systems because studies in mammalian neurons require manipulation of up to 9 genes: 3 α-Nrxns, 3 β-Nrxns, PTPσ, PTPδ, and LAR. Apart from these technical challenges, the complexity and heterogeneity of regulatory mechanisms, such as the requirement for differential alternative splicing events in LAR-RPTPs and HS binding activities of both LAR-RPTPs and Nrxns, have hindered our ability to specifically design clear-cut genetic model(s) in vertebrates for investigating the physiological significance of these molecular interactions. We found that Dlar and Dnrx genetically interact to maintain presynaptic bouton formation and synaptic transmission (Fig. 14). However, Dlar and Dnrx specify NMJ growth independently of this genetic interaction (Fig. 14). A series of phenotypes observed in Dlar5.5/+; DnrxΔ83/+ transheterozygotes warrant further in-depth ultrastructural analyses to address the precise action of these genes in various aspects of NMJ development. Remarkably, Dlar requires other HSPGs (Dally-like and syndecan) and a subset of intracellular signaling proteins to control synaptic growth (Johnson et al., 2006), suggesting the possibility that Dlar-dependent synaptic growth is mediated by a specific set of signaling interactions that are separated from Dnrx-mediated signaling pathways. A variety of presynaptic components studied here have orthologs, and their significance has been extensively described in invertebrate model organisms. In contrast, many, if not all, postsynaptic ligands for Nrxns and LAR-RPTPs are not evolutionarily conserved, and their roles during various aspects of synapse development in vertebrate neurons are unclear. Thus, a comprehensive analysis that explores which molecular complexes can substitute as functional equivalents for vertebrate-specific molecular counterparts in Drosophila systems is essential for building generic principles underlying synapse organization. Particularly, whether the functional impact of HS-modified Dnrx on synapse development involves direct interactions with Dlar should be further rigorously investigated. More specifically, it should be determined whether alternative splicing in Dlar and/or HS modifications of both Dnrx and Dlar is similarly involved in the functional interplay in Drosophila NMJs (Johnson et al., 2006; Zhang et al., 2018). In summary, the current study proposes a key molecular principle underlying bidirectional organization of trans-synaptic signals in neurons.
Footnotes
This work was supported by Korea Healthcare Technology R & D Project, funded by the Ministry for Health and Welfare Affairs, Republic of Korea HI17C0080 to J.K. We thank Jinha Kim (Daegu Gyeongbuk Institute of Science and Technology) for technical assistance.
The authors declare no competing financial interests.
References
- Ammendrup-Johnsen I, Naito Y, Craig AM, Takahashi H (2015) Neurotrophin-3 enhances the synaptic organizing function of TrkC-protein tyrosine phosphatase sigma in rat hippocampal neurons. J Neurosci 35:12425–12431. 10.1523/JNEUROSCI.1330-15.2015 [DOI] [PMC free article] [PubMed] [Google Scholar]
- Anholt RR, Mackay TF (2004) Quantitative genetic analyses of complex behaviours in Drosophila. Nat Rev Genet 5:838–849. 10.1038/nrg1472 [DOI] [PubMed] [Google Scholar]
- Choi TY, Lee SH, Kim YJ, Bae JR, Lee KM, Jo Y, Kim SJ, Lee AR, Choi S, Choi LM, Bang S, Song MR, Chung J, Lee KJ, Kim SH, Park CS, Choi SY (2018) Cereblon maintains synaptic and cognitive function by regulating BK channel. J Neurosci 38:3571–3583. 10.1523/JNEUROSCI.2081-17.2018 [DOI] [PMC free article] [PubMed] [Google Scholar]
- Coles CH, Mitakidis N, Zhang P, Elegheert J, Lu W, Stoker AW, Nakagawa T, Craig AM, Jones EY, Aricescu AR (2014) Structural basis for extracellular cis and trans RPTPsigma signal competition in synaptogenesis. Nat Commun 5:5209. 10.1038/ncomms6209 [DOI] [PMC free article] [PubMed] [Google Scholar]
- Condomitti G, de Wit J (2018) Heparan sulfate proteoglycans as emerging players in synaptic specificity. Front Mol Neurosci 11:14. 10.3389/fnmol.2018.00014 [DOI] [PMC free article] [PubMed] [Google Scholar]
- Condomitti G, Wierda KD, Schroeder A, Rubio SE, Vennekens KM, Orlandi C, Martemyanov KA, Gounko NV, Savas JN, de Wit J (2018) An input-specific orphan receptor GPR158-HSPG interaction organizes hippocampal mossy fiber-CA3 synapses. Neuron 100:201–215. 10.1016/j.neuron.2018.08.038 [DOI] [PMC free article] [PubMed] [Google Scholar]
- de Wit J, Ghosh A (2014) Control of neural circuit formation by leucine-rich repeat proteins. Trends Neurosci 37:539–550. 10.1016/j.tins.2014.07.004 [DOI] [PMC free article] [PubMed] [Google Scholar]
- de Wit J, Ghosh A (2016) Specification of synaptic connectivity by cell surface interactions. Nat Rev Neurosci 17:22–35. 10.1038/nrn.2015.3 [DOI] [PubMed] [Google Scholar]
- Fairless R, Masius H, Rohlmann A, Heupel K, Ahmad M, Reissner C, Dresbach T, Missler M (2008) Polarized targeting of neurexins to synapses is regulated by their C-terminal sequences. J Neurosci 28:12969–12981. 10.1523/JNEUROSCI.5294-07.2008 [DOI] [PMC free article] [PubMed] [Google Scholar]
- Gokce O, Südhof TC (2013) Membrane-tethered monomeric neurexin LNS domain triggers synapse formation. J Neurosci 33:14617–14628. 10.1523/JNEUROSCI.1232-13.2013 [DOI] [PMC free article] [PubMed] [Google Scholar]
- Graf ER, Zhang X, Jin SX, Linhoff MW, Craig AM (2004) Neurexins induce differentiation of GABA and glutamate postsynaptic specializations via neuroligins. Cell 119:1013–1026. 10.1016/j.cell.2004.11.035 [DOI] [PMC free article] [PubMed] [Google Scholar]
- Han KA, Um JW, Ko J (2019) Intracellular protein complexes involved in synapse assembly in presynaptic neurons. Adv Protein Chem Struct Biol 116:347–373. 10.1016/bs.apcsb.2018.11.008 [DOI] [PubMed] [Google Scholar]
- Han KA, Ko JS, Pramanik G, Kim JY, Tabuchi K, Um JW, Ko J (2018) PTPsigma drives excitatory presynaptic assembly via various extracellular and intracellular mechanisms. J Neurosci 38:6700–6721. 10.1523/JNEUROSCI.0672-18.2018 [DOI] [PMC free article] [PubMed] [Google Scholar]
- Han KA, Woo D, Kim S, Choii G, Jeon S, Won SY, Kim HM, Heo WD, Um JW, Ko J (2016) Neurotrophin-3 regulates synapse development by modulating TrkC-PTPsigma synaptic adhesion and intracellular signaling pathways. J Neurosci 36:4816–4831. 10.1523/JNEUROSCI.4024-15.2016 [DOI] [PMC free article] [PubMed] [Google Scholar]
- Han KA, Lee HY, Lim D, Shin J, Yoon TH, Lee C, Rhee JS, Liu X, Um JW, Choi SY, Ko J (2020) PTPsigma controls presynaptic organization of neurotransmitter release machinery at excitatory synapses. iScience 23:101203. 10.1016/j.isci.2020.101203 [DOI] [PMC free article] [PubMed] [Google Scholar]
- Jang S, Lee H, Kim E (2017) Synaptic adhesion molecules and excitatory synaptic transmission. Curr Opin Neurobiol 45:45–50. 10.1016/j.conb.2017.03.005 [DOI] [PubMed] [Google Scholar]
- Johnson KG, Tenney AP, Ghose A, Duckworth AM, Higashi ME, Parfitt K, Marcu O, Heslip TR, Marsh JL, Schwarz TL, Flanagan JG, Van Vactor D (2006) The HSPGs Syndecan and Dallylike bind the receptor phosphatase LAR and exert distinct effects on synaptic development. Neuron 49:517–531. 10.1016/j.neuron.2006.01.026 [DOI] [PubMed] [Google Scholar]
- Kang Y, Zhang X, Dobie F, Wu H, Craig AM (2008) Induction of GABAergic postsynaptic differentiation by alpha-neurexins. J Biol Chem 283:2323–2334. 10.1074/jbc.M703957200 [DOI] [PMC free article] [PubMed] [Google Scholar]
- Kaufmann N, DeProto J, Ranjan R, Wan H, Van Vactor D (2002) Drosophila liprin-alpha and the receptor phosphatase Dlar control synapse morphogenesis. Neuron 34:27–38. 10.1016/s0896-6273(02)00643-8 [DOI] [PubMed] [Google Scholar]
- Ko J, Na M, Kim S, Lee JR, Kim E (2003) Interaction of the ERC family of RIM-binding proteins with the liprin-alpha family of multidomain proteins. J Biol Chem 278:42377–42385. 10.1074/jbc.M307561200 [DOI] [PubMed] [Google Scholar]
- Ko J, Yoon C, Piccoli G, Chung HS, Kim K, Lee JR, Lee HW, Kim H, Sala C, Kim E (2006) Organization of the presynaptic active zone by ERC2/CAST1-dependent clustering of the tandem PDZ protein syntenin-1. J Neurosci 26:963–970. 10.1523/JNEUROSCI.4475-05.2006 [DOI] [PMC free article] [PubMed] [Google Scholar]
- Ko J, Soler-Llavina GJ, Fuccillo MV, Malenka RC, Südhof TC (2011) Neuroligins/LRRTMs prevent activity- and Ca2+/calmodulin-dependent synapse elimination in cultured neurons. J Cell Biol 194:323–334. 10.1083/jcb.201101072 [DOI] [PMC free article] [PubMed] [Google Scholar]
- Ko JS, Pramanik G, Um JW, Shim JS, Lee D, Kim KH, Chung GY, Condomitti G, Kim HM, Kim H, de Wit J, Park KS, Tabuchi K, Ko J (2015) PTPsigma functions as a presynaptic receptor for the glypican-4/LRRTM4 complex and is essential for excitatory synaptic transmission. Proc Natl Acad Sci USA 112:1874–1879. 10.1073/pnas.1410138112 [DOI] [PMC free article] [PubMed] [Google Scholar]
- Krueger DD, Tuffy LP, Papadopoulos T, Brose N (2012) The role of neurexins and neuroligins in the formation, maturation, and function of vertebrate synapses. Curr Opin Neurobiol 22:412–422. 10.1016/j.conb.2012.02.012 [DOI] [PubMed] [Google Scholar]
- Krueger NX, Van Vactor D, Wan HI, Gelbart WM, Goodman CS, Saito H (1996) The transmembrane tyrosine phosphatase DLAR controls motor axon guidance in Drosophila. Cell 84:611–622. 10.1016/s0092-8674(00)81036-3 [DOI] [PubMed] [Google Scholar]
- Kwon SK, Woo J, Kim SY, Kim H, Kim E (2010) Trans-synaptic adhesions between netrin-G ligand-3 (NGL-3) and receptor tyrosine phosphatases LAR, protein-tyrosine phosphatase delta (PTPdelta), and PTPsigma via specific domains regulate excitatory synapse formation. J Biol Chem 285:13966–13978. 10.1074/jbc.M109.061127 [DOI] [PMC free article] [PubMed] [Google Scholar]
- LaConte LE, Chavan V, Liang C, Willis J, Schonhense EM, Schoch S, Mukherjee K (2016) CASK stabilizes neurexin and links it to liprin-alpha in a neuronal activity-dependent manner. Cell Mol Life Sci 73:3599–3621. 10.1007/s00018-016-2183-4 [DOI] [PMC free article] [PubMed] [Google Scholar]
- Lee K, Kim Y, Lee SJ, Qiang Y, Lee D, Lee HW, Kim H, Je HS, Südhof TC, Ko J (2013) MDGAs interact selectively with neuroligin-2 but not other neuroligins to regulate inhibitory synapse development. Proc Natl Acad Sci USA 110:336–341. 10.1073/pnas.1219987110 [DOI] [PMC free article] [PubMed] [Google Scholar]
- Matsuda K, Yuzaki M (2011) Cbln family proteins promote synapse formation by regulating distinct neurexin signaling pathways in various brain regions. Eur J Neurosci 33:1447–1461. 10.1111/j.1460-9568.2011.07638.x [DOI] [PubMed] [Google Scholar]
- Neupert C, Schneider R, Klatt O, Reissner C, Repetto D, Biermann B, Niesmann K, Missler M, Heine M (2015) Regulated dynamic trafficking of neurexins inside and outside of synaptic terminals. J Neurosci 35:13629–13647. 10.1523/JNEUROSCI.4041-14.2015 [DOI] [PMC free article] [PubMed] [Google Scholar]
- Park D, Bae S, Yoon TH, Ko J (2018) Molecular mechanisms of synaptic specificity: spotlight on hippocampal and cerebellar synapse organizers. Mol Cells 41:373–380. 10.14348/molcells.2018.0081 [DOI] [PMC free article] [PubMed] [Google Scholar]
- Pettem KL, Yokomaku D, Takahashi H, Ge Y, Craig AM (2013) Interaction between autism-linked MDGAs and neuroligins suppresses inhibitory synapse development. J Cell Biol 200:321–336. 10.1083/jcb.201206028 [DOI] [PMC free article] [PubMed] [Google Scholar]
- Roppongi RT, Dhume SH, Padmanabhan N, Silwal P, Zahra N, Karimi B, Bomkamp C, Patil CS, Champagne-Jorgensen K, Twilley RE, Zhang P, Jackson MF, Siddiqui TJ (2020) LRRTMs organize synapses through differential engagement of neurexin and PTPsigma. Neuron 106:108–125. 10.1016/j.neuron.2020.01.003 [DOI] [PubMed] [Google Scholar]
- Spangler SA, Schmitz SK, Kevenaar JT, de Graaff E, de Wit H, Demmers J, Toonen RF, Hoogenraad CC (2013) Liprin-alpha2 promotes the presynaptic recruitment and turnover of RIM1/CASK to facilitate synaptic transmission. J Cell Biol 201:915–928. 10.1083/jcb.201301011 [DOI] [PMC free article] [PubMed] [Google Scholar]
- Südhof TC. (2017) Synaptic neurexin complexes: a molecular code for the logic of neural circuits. Cell 171:745–769. 10.1016/j.cell.2017.10.024 [DOI] [PMC free article] [PubMed] [Google Scholar]
- Südhof TC. (2018) Towards an understanding of synapse formation. Neuron 100:276–293. 10.1016/j.neuron.2018.09.040 [DOI] [PMC free article] [PubMed] [Google Scholar]
- Sun M, Xie W (2012) Cell adhesion molecules in Drosophila synapse development and function. Sci China Life Sci 55:20–26. 10.1007/s11427-012-4273-3 [DOI] [PubMed] [Google Scholar]
- Takahashi H, Craig AM (2013) Protein tyrosine phosphatases PTPdelta, PTPsigma, and LAR: presynaptic hubs for synapse organization. Trends Neurosci 36:522–534. 10.1016/j.tins.2013.06.002 [DOI] [PMC free article] [PubMed] [Google Scholar]
- Takamori S, Riedel D, Jahn R (2000) Immunoisolation of GABA-specific synaptic vesicles defines a functionally distinct subset of synaptic vesicles. J Neurosci 20:4904–4911. [DOI] [PMC free article] [PubMed] [Google Scholar]
- Tang AH, Chen H, Li TP, Metzbower SR, MacGillavry HD, Blanpied TA (2016) A trans-synaptic nanocolumn aligns neurotransmitter release to receptors. Nature 536:210–214. 10.1038/nature19058 [DOI] [PMC free article] [PubMed] [Google Scholar]
- Trotter JH, Hao J, Maxeiner S, Tsetsenis T, Liu Z, Zhuang X, Südhof TC (2019) Synaptic neurexin-1 assembles into dynamically regulated active zone nanoclusters. J Cell Biol 218:2677–2698. 10.1083/jcb.201812076 [DOI] [PMC free article] [PubMed] [Google Scholar]
- Um JW, Ko J (2013) LAR-RPTPs: synaptic adhesion molecules that shape synapse development. Trends Cell Biol 23:465–475. 10.1016/j.tcb.2013.07.004 [DOI] [PubMed] [Google Scholar]
- Um JW, Ko J (2017) Neural glycosylphosphatidylinositol-anchored proteins in synaptic specification. Trends Cell Biol 27:931–945. 10.1016/j.tcb.2017.06.007 [DOI] [PubMed] [Google Scholar]
- Um JW, Pramanik G, Ko JS, Song MY, Lee D, Kim H, Park KS, Südhof TC, Tabuchi K, Ko J (2014) Calsyntenins function as synaptogenic adhesion molecules in concert with neurexins. Cell Rep 6:1096–1109. 10.1016/j.celrep.2014.02.010 [DOI] [PMC free article] [PubMed] [Google Scholar]
- Um JW, Choi TY, Kang H, Cho YS, Choii G, Uvarov P, Park D, Jeong D, Jeon S, Lee D, Kim H, Lee SH, Bae YC, Choi SY, Airaksinen MS, Ko J (2016) LRRTM3 regulates excitatory synapse development through alternative splicing and neurexin binding. Cell Rep 14:808–822. 10.1016/j.celrep.2015.12.081 [DOI] [PubMed] [Google Scholar]
- Um JW, Han KA, Choi SY, Ko J (2020) Protocol for Quantitative Analysis of Synaptic Vesicle Clustering in Axons of Cultured Neurons. Star Protocols 1:100095. [DOI] [PMC free article] [PubMed] [Google Scholar]
- Won SY, Kim CY, Kim D, Ko J, Um JW, Lee SB, Buck M, Kim E, Heo WD, Lee JO, Kim HM (2017) LAR-RPTP clustering is modulated by competitive binding between synaptic adhesion partners and heparan sulfate. Front Mol Neurosci 10:327. 10.3389/fnmol.2017.00327 [DOI] [PMC free article] [PubMed] [Google Scholar]
- Yim YS, Kwon Y, Nam J, Yoon HI, Lee K, Kim DG, Kim E, Kim CH, Ko J (2013) Slitrks control excitatory and inhibitory synapse formation with LAR receptor protein tyrosine phosphatases. Proc Natl Acad Sci USA 110:4057–4062. 10.1073/pnas.1209881110 [DOI] [PMC free article] [PubMed] [Google Scholar]
- Zeng X, Sun M, Liu L, Chen F, Wei L, Xie W (2007) Neurexin-1 is required for synapse formation and larvae associative learning in Drosophila. FEBS Lett 581:2509–2516. 10.1016/j.febslet.2007.04.068 [DOI] [PubMed] [Google Scholar]
- Zhang P, Lu H, Peixoto RT, Pines MK, Ge Y, Oku S, Siddiqui TJ, Xie Y, Wu W, Archer-Hartmann S, Yoshida K, Tanaka KF, Aricescu AR, Azadi P, Gordon MD, Sabatini BL, Wong RO, Craig AM (2018) Heparan sulfate organizes neuronal synapses through neurexin partnerships. Cell 174:1450–1464. 10.1016/j.cell.2018.07.002 [DOI] [PMC free article] [PubMed] [Google Scholar]
Associated Data
This section collects any data citations, data availability statements, or supplementary materials included in this article.
Supplementary Materials
PTPσ loss does not influence surface expression or presynaptic localization of Nrxn1α. A, B, Representative immunoblot images (A) and summary bar graphs (B) quantifying the surface expression levels of endogenous Nrxn1α in PTPσf/f neurons infected with lentiviruses expressing ΔCre (control) or Cre recombinase. Individual band intensities were normalized to input lanes. Data are mean ± SEM. n = 3 independent experiments). C, Representative images of cultured neurons (DIV10) derived from PTPσf/f mice infected with lentiviruses expressing ΔCre or Cre at DIV3 and transfected with FLAG-tagged Nrxn1α (red) at DIV8. Anti-synapsin (green) was used to mark the presynaptic vesicles. Scale bar, 10 μm. D, Quantification of Nrxn1α puncta enrichment at presynaptic vesicles for the images in (C). Data are mean ± SEMs (n denotes the number of analyzed neurons; ΔCre, n = 15; Cre, n = 11; Mann–Whitney U test). Download Figure 1-1, TIF file (3.7MB, tif) .
PTPσ is not required for the late phase of presynaptic differentiation. A, Representative images of the results of heterologous synapse-formation assays. Cultured hippocampal neurons were infected with the indicated lentiviruses at DIV4, starting at DIV12, cocultured with mVenus-fused Nlgn1-expressing HEK293T cells for 12, 24, 48 or 72 hr. Synaptogenic activities were analyzed by double-immunostaining for EGFP (blue) and VGLUT1 (red). Scale bar, 10 μm. B, Quantification of the synapse-formation activities of the images in panel A by measuring the ratio of VGLUT1 staining intensity (red) to EGFP intensity (blue). Data are mean ± SEMs (*p < 0.05; **p < 0.01; ***p < 0.001; ANOVA with nonparametric Kruskal–Wallis tests). n indicates the number of neurons as follows: sh-Control/Nlgn1 (12 h), n = 12; sh-PTPσ/Nlgn1 (12 h), n = 15; sh-PTPδ/Nlgn1 (12 h), n = 12; sh-Nrxns/Nlgn1 (12 h), n = 12; sh-Control/Nlgn1 (24 h), n = 11; sh-PTPσ/Nlgn1 (24 h), n = 13; sh-PTPδ/Nlgn1 (24 h), n = 12; sh-Nrxns/Nlgn1 (24 h), n = 13; sh-Control/Nlgn1 (48 h), n = 19; sh-PTPσ/Nlgn1 (48 h), n = 15; sh-PTPδ/Nlgn1 (48 h), n = 14; sh-Nrxns/Nlgn1 (48 h), n = 18; sh-Control/Nlgn1 (72 h), n = 13; sh-PTPσ/Nlgn1 (72 h), n = 14; sh-PTPδ/Nlgn1 (72 h), n = 12; sh-Nrxns/Nlgn1 (72 h), n = 10; sh-Control/Control (48 h), n = 13; sh-PTPσ/Control (48 h), n = 13; sh-PTPδ/Control (48 h), n = 11; and sh-Nrxns/Control (48 h), n = 12. p values for individual comparisons are as follows: sh-Control versus sh-PTPσ/Nlgn1 (12 h), p = 0.0012; sh-Control versus sh-PTPδ/Nlgn1 (12 h), p > 0.9999; sh-Control versus sh-Nrxns/Nlgn1 (12 h), p = 0.0410; sh-Control versus sh-PTPσ/Nlgn1 (24 h), p > 0.9999; sh-Control versus sh-PTPδ/Nlgn1 (24 h), p = 0.9950; sh-Control versus sh-Nrxns/Nlgn1 (24 h), p = 0.0004; sh-Control versus sh-PTPσ/Nlgn1 (48 h), p > 0.9999; sh-Control versus sh-PTPδ/Nlgn1 (48 h), p > 0.9999; sh-Control versus sh-Nrxns/Nlgn1 (48 h), p = 0.0021; sh-Control versus sh-PTPσ/Nlgn1 (72 h), p > 0.9999; sh-Control versus sh-PTPδ/Nlgn1 (72 h), p > 0.9999; and sh-Control versus sh-Nrxns/Nlgn1 (72 h), p = 0.0025. Download Figure 2-1, TIF file (12.3MB, tif) .
Validation of KD efficiencies for the shRNA vectors targeting a subset of presynaptic scaffold proteins using antibodies in cultured cortical neurons. A, B, Representative semiquantitative immunoblot images (A) and quantitative summary (B) of the expression levels of the indicated synaptic proteins in cultured cortical neurons infected with lentiviruses expressing sh-Control or the indicated shRNAs. These findings show the KD efficiencies of the shRNA vectors that exhibit biological effects in Figure 3. Data are mean ± SEM. n = number of samples as follows: sh-Cont. [ELKS1], n = 4; sh-ELKS1 [ELKS1], n = 4; sh-Cont.[ELKS2], n = 4; sh-ELKS2 [ELKS2], n = 4; sh-Cont. [RIM-BP1], n = 4; sh-RBP1 [RIM-BP1], n = 4; sh-Cont. [RIM-BP2], n = 4; sh-RBP2 [RIM-BP2], n = 4; sh-Cont. [CASK], n = 5; sh-CASK [CASK], n = 5; sh-Cont. [MIM-B], n = 5; sh-MIM-B [MIM-B], n = 5; sh-Cont. [Abl1], n = 4; sh-Abl [Abl1], n = 4; sh-Cont. [Ena], n = 4; sh-Ena [Ena], n = 4; sh-Cont. [Caskin-1], n = 4; sh-CSK1 [Caskin-1], n = 4; sh-Cont. [SYD1A], n = 4; and sh-SYD1A [SYD1A], n = 4). CSK1, CASKIN-1; RBP1, RIM-BP1; and RBP2, RIM-BP2. Download Figure 3-1, TIF file (13.4MB, tif) .
Expression levels of the shRNA-resistant vectors, revealed by immunoblot analysis of HEK293T cell lysates. Representative immunoblot images from HEK293T cells transfected with the indicated expression plasmids (related to data in Fig. 5). Samples were resolved by SDS-PAGE and immunoblotted using the indicated antibodies. CSK1, CASKIN-1; and RBP2, RIM-BP2. Download Figure 5-1, TIF file (5.8MB, tif) .