

Relapse to drug use can be initiated by drug-associated cues. The intensity of cue-induced drug seeking in rodent models correlates with the induction of transient synaptic potentiation (t-SP) at glutamatergic synapses in the nucleus accumbens core (NAcore). Matrix metalloproteinases (MMPs) are inducible endopeptidases that degrade extracellular matrix (ECM) proteins, and reveal tripeptide Arginine-Glycine-Aspartate (RGD) domains that bind and signal through integrins.
Keywords: cocaine, cofilin, cued relapse, focal adhesion kinase, integrins, medium spine neurons
Abstract
Relapse to drug use can be initiated by drug-associated cues. The intensity of cue-induced drug seeking in rodent models correlates with the induction of transient synaptic potentiation (t-SP) at glutamatergic synapses in the nucleus accumbens core (NAcore). Matrix metalloproteinases (MMPs) are inducible endopeptidases that degrade extracellular matrix (ECM) proteins, and reveal tripeptide Arginine-Glycine-Aspartate (RGD) domains that bind and signal through integrins. Integrins are heterodimeric receptors composed of αβ subunits, and a primary signaling kinase is focal adhesion kinase (FAK). We previously showed that MMP activation is necessary for and potentiates cued reinstatement of cocaine seeking, and MMP-induced catalysis stimulates β3-integrins to induce t-SP. Here, we determined whether β3-integrin signaling through FAK and cofilin (actin depolymerization factor) is necessary to promote synaptic growth during t-SP. Using a small molecule inhibitor to prevent FAK activation, we blocked cued-induced cocaine reinstatement and increased spine head diameter (dh). Immunohistochemistry on NAcore labeled spines with ChR2-EYFP virus, showed increased immunoreactivity of phosphorylation of FAK (p-FAK) and p-cofilin in dendrites of reinstated animals compared with extinguished and yoked saline, and the p-FAK and cofilin depended on β3-integrin signaling. Next, male and female transgenic rats were used to selectively label D1 or D2 neurons with ChR2-mCherry. We found that p-FAK was increased during drug seeking in both D1 and D2-medium spiny neurons (MSNs), but increased p-cofilin was observed only in D1-MSNs. These data indicate that β3-integrin, FAK and cofilin constitute a signaling pathway downstream of MMP activation that is involved in promoting the transient synaptic enlargement in D1-MSNs induced during reinstated cocaine by drug-paired cues.
SIGNIFICANCE STATEMENT Drug-associated cues precipitate relapse, which is correlated with transient synaptic enlargement in the accumbens core. We showed that cocaine cue-induced synaptic enlargement depends on matrix metalloprotease signaling in the extracellular matrix (ECM) through β3-integrin to activate focal adhesion kinase (FAK) and phosphorylate the actin binding protein cofilin. The nucleus accumbens core (NAcore) contains two predominate neuronal subtypes selectively expressing either D1-dopamine or D2-dopamine receptors. We used transgenic rats to study each cell type and found that cue-induced signaling through cofilin phosphorylation occurred only in D1-expressing neurons. Thus, cocaine-paired cues initiate cocaine reinstatement and synaptic enlargement through a signaling cascade selectively in D1-expressing neurons requiring ECM stimulation of β3-integrin-mediated phosphorylation of FAK (p-FAK) and cofilin.
Introduction
Environmental cues that become associated with the use of addictive drugs initiate highly motivated drug seeking that can lead to relapse to drug use (Li et al., 2015). Cue reactivity is an endophenotype of substance use disorders (SUDs) that neuroimaging studies show to be associated with activation of the glutamatergic projections from the prelimbic cortex and amygdala to the nucleus accumbens (Goldstein and Volkow, 2011; Kalivas and Kalivas, 2016). Cue reactivity is modeled in animals by associating self-administered drug delivery with a light or tone cue, then restoring the cue in the absence of drug to initiate motivated drug seeking (Epstein et al., 2006; Belin-Rauscent et al., 2016). Substantial progress has been made using this model in understanding the neurobiology of drug cue reactivity, including discovering mechanisms of drug cue-induced synaptic plasticity at glutamatergic synapses in nucleus accumbens, in particular the core subcompartment (NAcore; Lüscher and Malenka, 2011; Scofield et al., 2016; Dong et al., 2017).
Early studies into accumbens mechanisms of cue reactivity focused on classic measures of synaptic plasticity, such as electrophysiological and morphologic evidence of the induction of synaptic potentiation and depression, and found that cue-induced seeking for most classes of addictive drug produces transient synaptic potentiation (t-SP) that is correlated with the intensity of drug seeking (Scofield et al., 2016). Deeper investigation shows that the cellular mechanisms mediating t-SP involve not only the canonical presynapse and postsynapse but also astroglial perisynpatic processes and the extracellular matrix (ECM), a proteinaceous signaling domain surrounding the synapse (Mulholland et al., 2016; Kruyer et al., 2019).
Matrix metalloproteinase (MMP)-mediated degradation of the ECM liberates ligands that bind to and activate integrin receptors (Tsilibary et al., 2014; Wehrle-Haller and Bastmeyer, 2014). Further, integrin signaling is known to regulate synaptic plasticity that engages morphologic and electrophysiological adaptations similar to what is observed with t-SP (Shi and Ethell, 2006; Cingolani et al., 2008). Based on these facts, we recently used a RNA interference-based strategy in the NAcore to show that β3-integrin, and not β1-integrin, subunits are required for cue-induced t-SP and reinstatement of cocaine seeking (Garcia-Keller et al., 2019). In addition, β3-integrin signals into the postsynapse through activating a number of kinases, including focal adhesion kinase (FAK), and we found that inhibiting FAK, but not integrin-linked kinase, prevented cued reinstatement of cocaine seeking, but did not alter cued sucrose reinstatement.
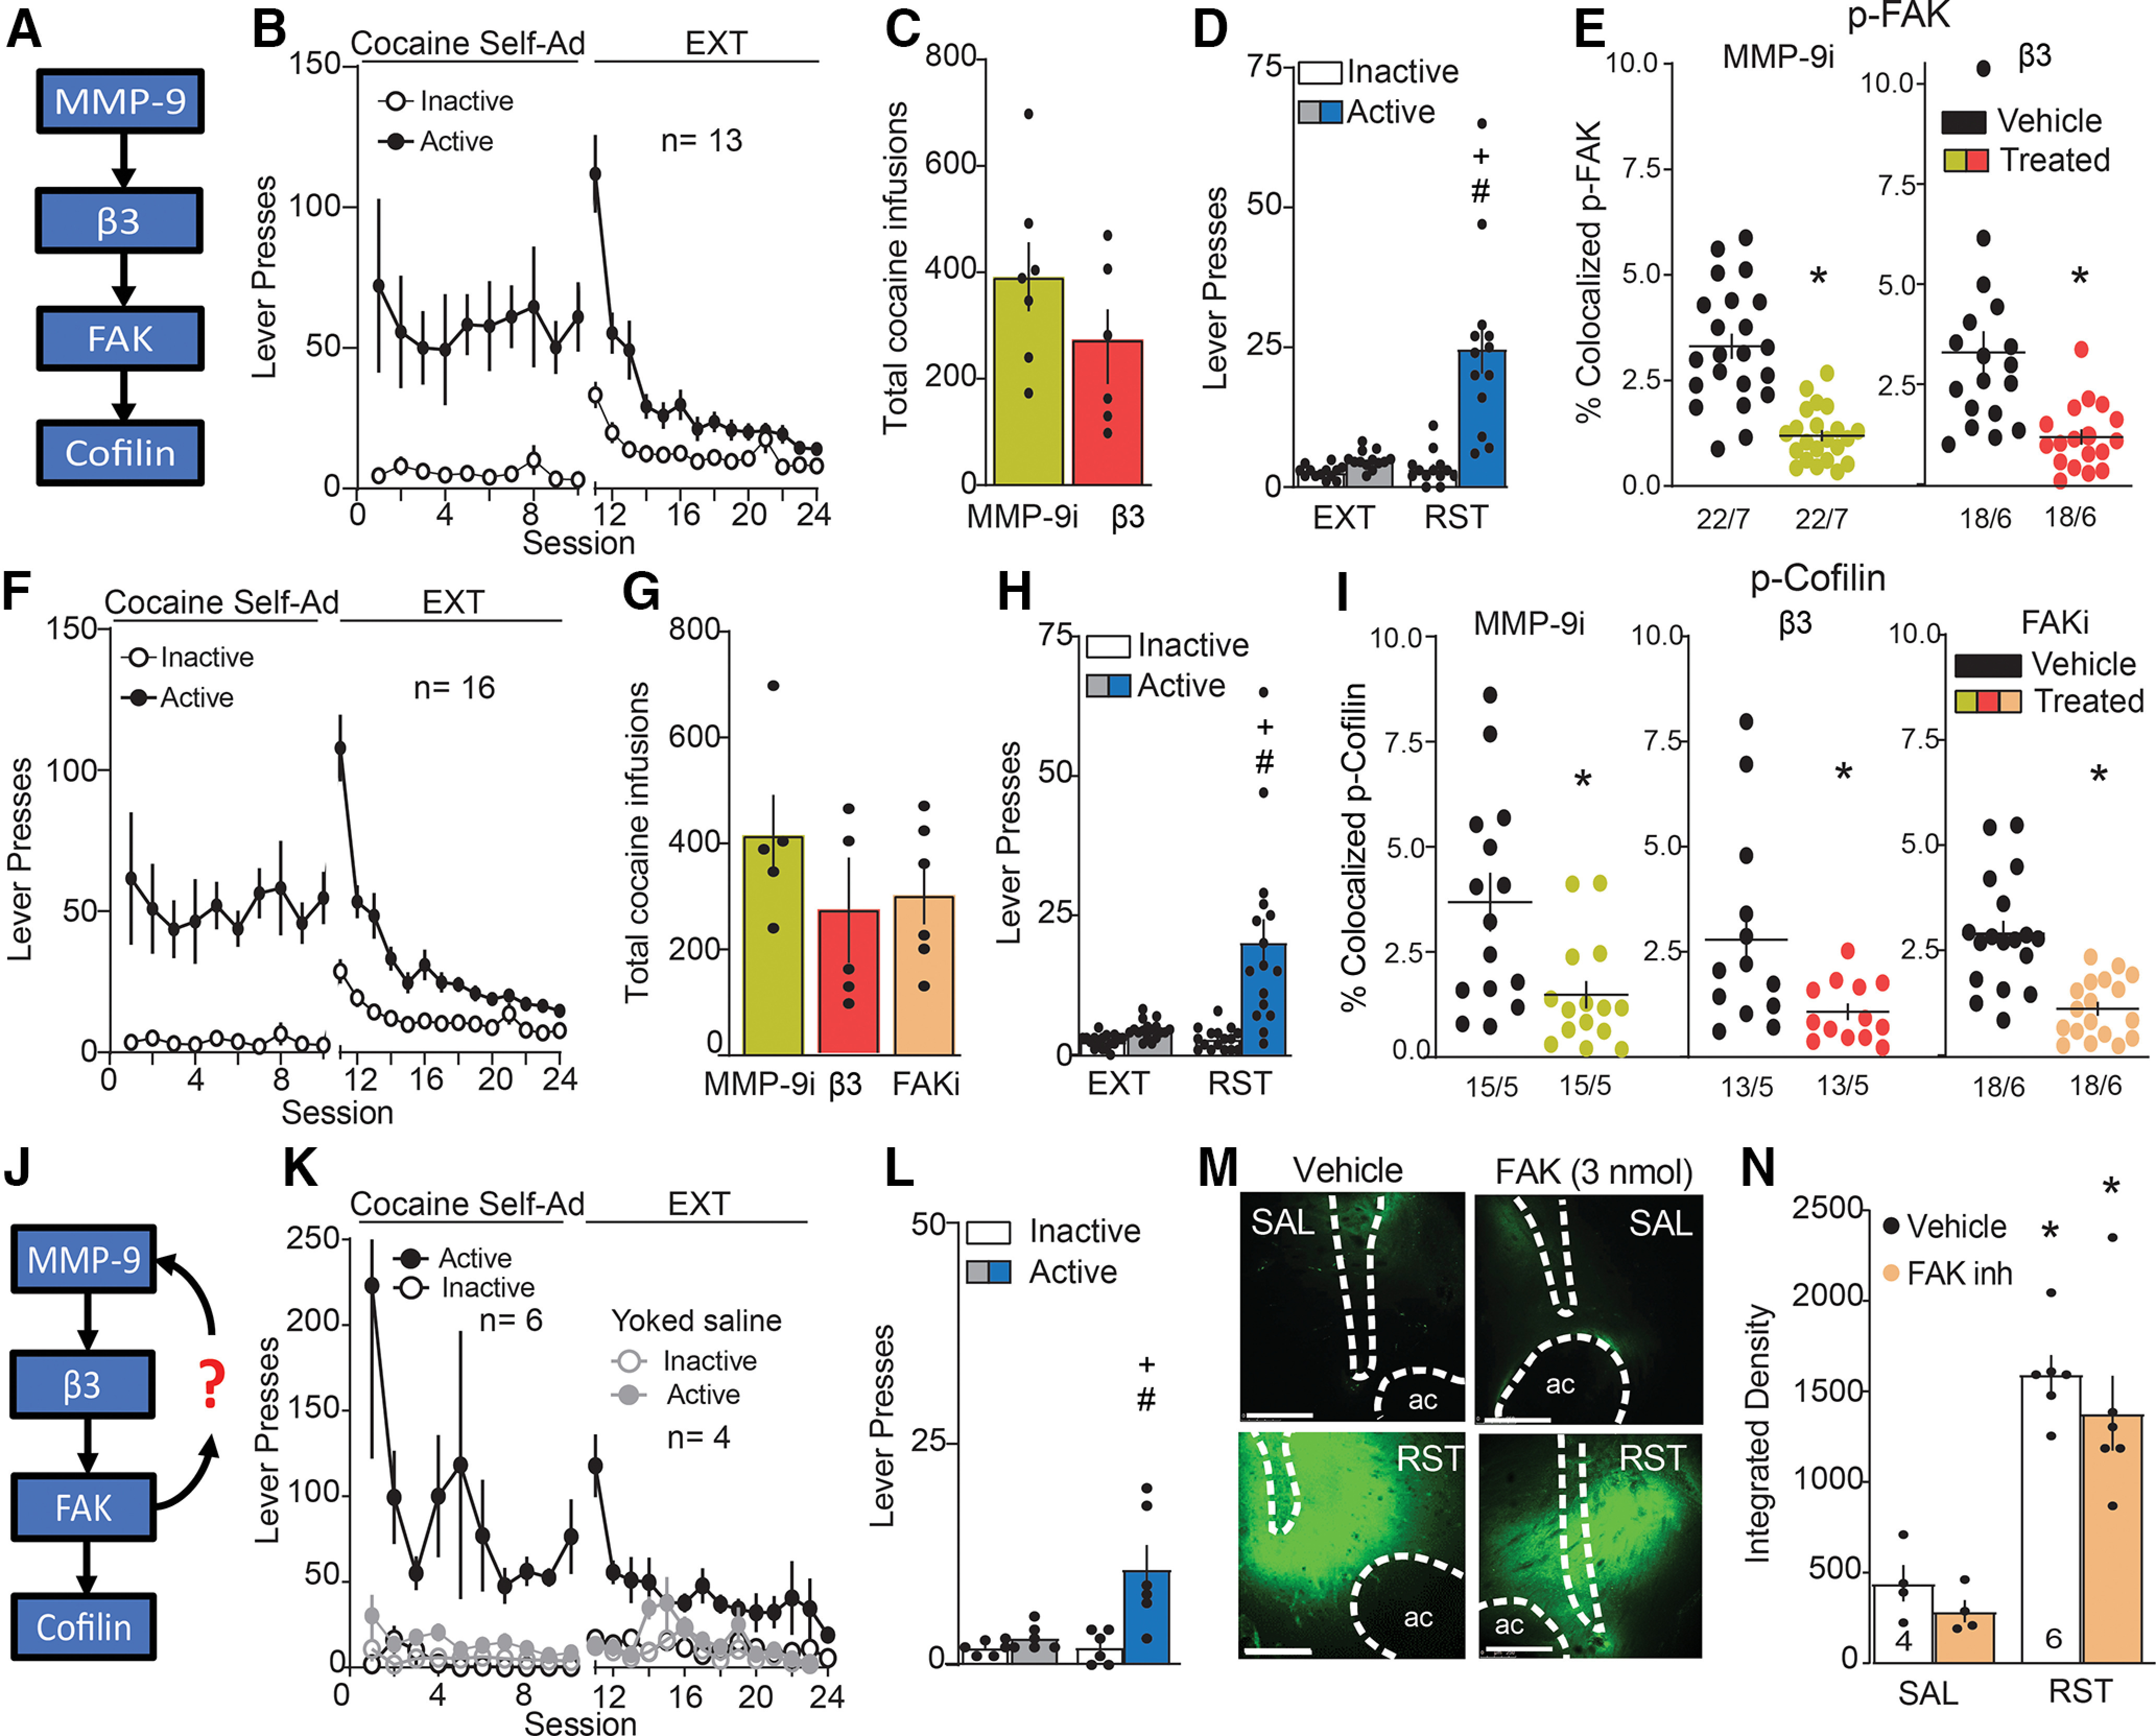
In the present study, we set out to determine the linkage between the ECM and FAK activation, and the role of FAK in the cue-induced enlargement of NAcore synaptic spines underlying cued cocaine seeking. Using the rat model of cocaine self-administration, extinction and cue-induced reinstatement, we show that phosphorylation of FAK (p-FAK) and the actin binding protein cofilin (p-cofilin) is enhanced in medium spiny neurons (MSNs) dendrites in parallel with cue-induced spine head enlargement, and that this signaling required activation of MMP-9 and stimulation of β3-integrin. MSNs in the NAcore are commonly divided into two subpopulations, usually by virtue of D1 or D2 dopamine receptor expression (Gerfen and Surmeier, 2011). Using transgenic rats expressing Cre recombinase in either D1-MSN or D2-MSN, and Cre-dependent viral labeling of MSN dendritic segments, we show that both p-FAK and p-cofilin are selectively induced in D1-MSNs following exposure to cocaine cues. While p-FAK was also induced in D2-MSNs, only the induction of p-FAK immunoreactivity in D1-MSNs was correlated with the intensity of cue-induced cocaine seeking. Together, these experiments demonstrate that the following signaling cascade mediates both cue-induced dendritic spine enlargement in D1-MSNs and cocaine seeking: Cue → MMP-9 → β3-integrin → FAK → cofilin → D1-MSN spine head enlargement.
Materials and Methods
Animal housing and surgery
Sixty-three male Sprague Dawley rats (250 g; Charles River Laboratories) and 32 male and female D1-Cre and D2-Cre transgenic rats backcrossed at least six generations on Long–Evans (generated as part of the National Institute of Drug Abuse Transgenic Rat Project) were individually housed using a 12/12 h light/dark cycle with ad libitum food and water in a temperature and humidity-controlled environment. The transgenic rats express cre recombinase under control of the rat dopamine receptor D1 and D2 promoters. All experimentation occurred during the dark phase, and animals were allowed to acclimate to the vivarium environment for a week before surgery. Rats were ∼70 d old when they were anesthetized with a combination of ketamine HCl and xylazine before implanting indwelling jugular catheters (surgical details have been described previously (LaLumiere and Kalivas, 2008; Knackstedt et al., 2010), and received ketorolac as a preoperative analgesic. All procedures were in accordance with the National Institutes of Health Guide for the Care and Use of Laboratory Animals and the Assessment and Accreditation of Laboratory Animal Care.
Transgenic rats
Drd1a-iCre transgenic rats n(D1-Cre)
These rats were generated as previously described (Pardo-Garcia et al., 2019). The line (LE-Tg(Drd1a-iCre)3Ottc) is registered at the Rat Genome Database (RGD; 10412325) and deposited at the Rat Resource and Research Center (RRRC #767; University of Missouri, Columbia, MO).
Drd2-iCre transgenic rats (D2-Cre)
To create D2-Cre rats a bacterial artificial chromosome (BAC) containing the rat Drd2 gene (CH230-11B15) was obtained from CHORI, and recombined to replace the start codon of Drd2 with a 1.3 kb cassette containing iCre (improved Cre recombinase) and the polyadenylation signal from the gene for bovine growth hormone (Warming et al., 2005). This BAC was injected into the pronuclei of fertilized Long–Evans rat embryos by NIMH Transgenic Core, which were transferred to pseudo-pregnant Sprague Dawley females and carried to term, ultimately resulted in two independent, phenotypically positive Drd2-iCre lines. The line (LE-Tg(Drd2-iCre)1Ottc) has four copies of the transgene per haploid genome as determined by droplet digital PCR and is registered at the RGD (10412327) and deposited at the Rat Resource and Research Center (RRRC #768; University of Missouri, Columbia, MO).
Drugs and reagents used
Cocaine hydrochloride was supplied by the National Institute of Drug Abuse. Morpholinos were purchased from Gene Tools, LLC (Summerton Way). The antisense sequence used for β3 integrin morpholino was 5′-TCTCTGCCTCAGAACTCGCCCCGCT-3′, and for scrambled control was 5′-CCTCTTACCTCAgTTACAATTTATA-3′. MMP-9 inhibitor was purchased from EMD Bioscience (#444278; Ki = 5 nm). The FAK inhibitor (FAKi) prevents autophosphorylation at Y397 and was microinjected at 3 nmol/0.5 µl/side (FAK inhibitor 14; Tocris, #3414, Ki = 1 μm). This dose was previously shown to inhibit cue-induced cocaine reinstatement without altering exploratory locomotor activity (Garcia-Keller et al., 2019). All the reagents were dissolved in sterile saline, except for MMP-9 inhibitor that was dissolved in 1% dimethylsulfoxide.
Self-administration, extinction, and reinstatement
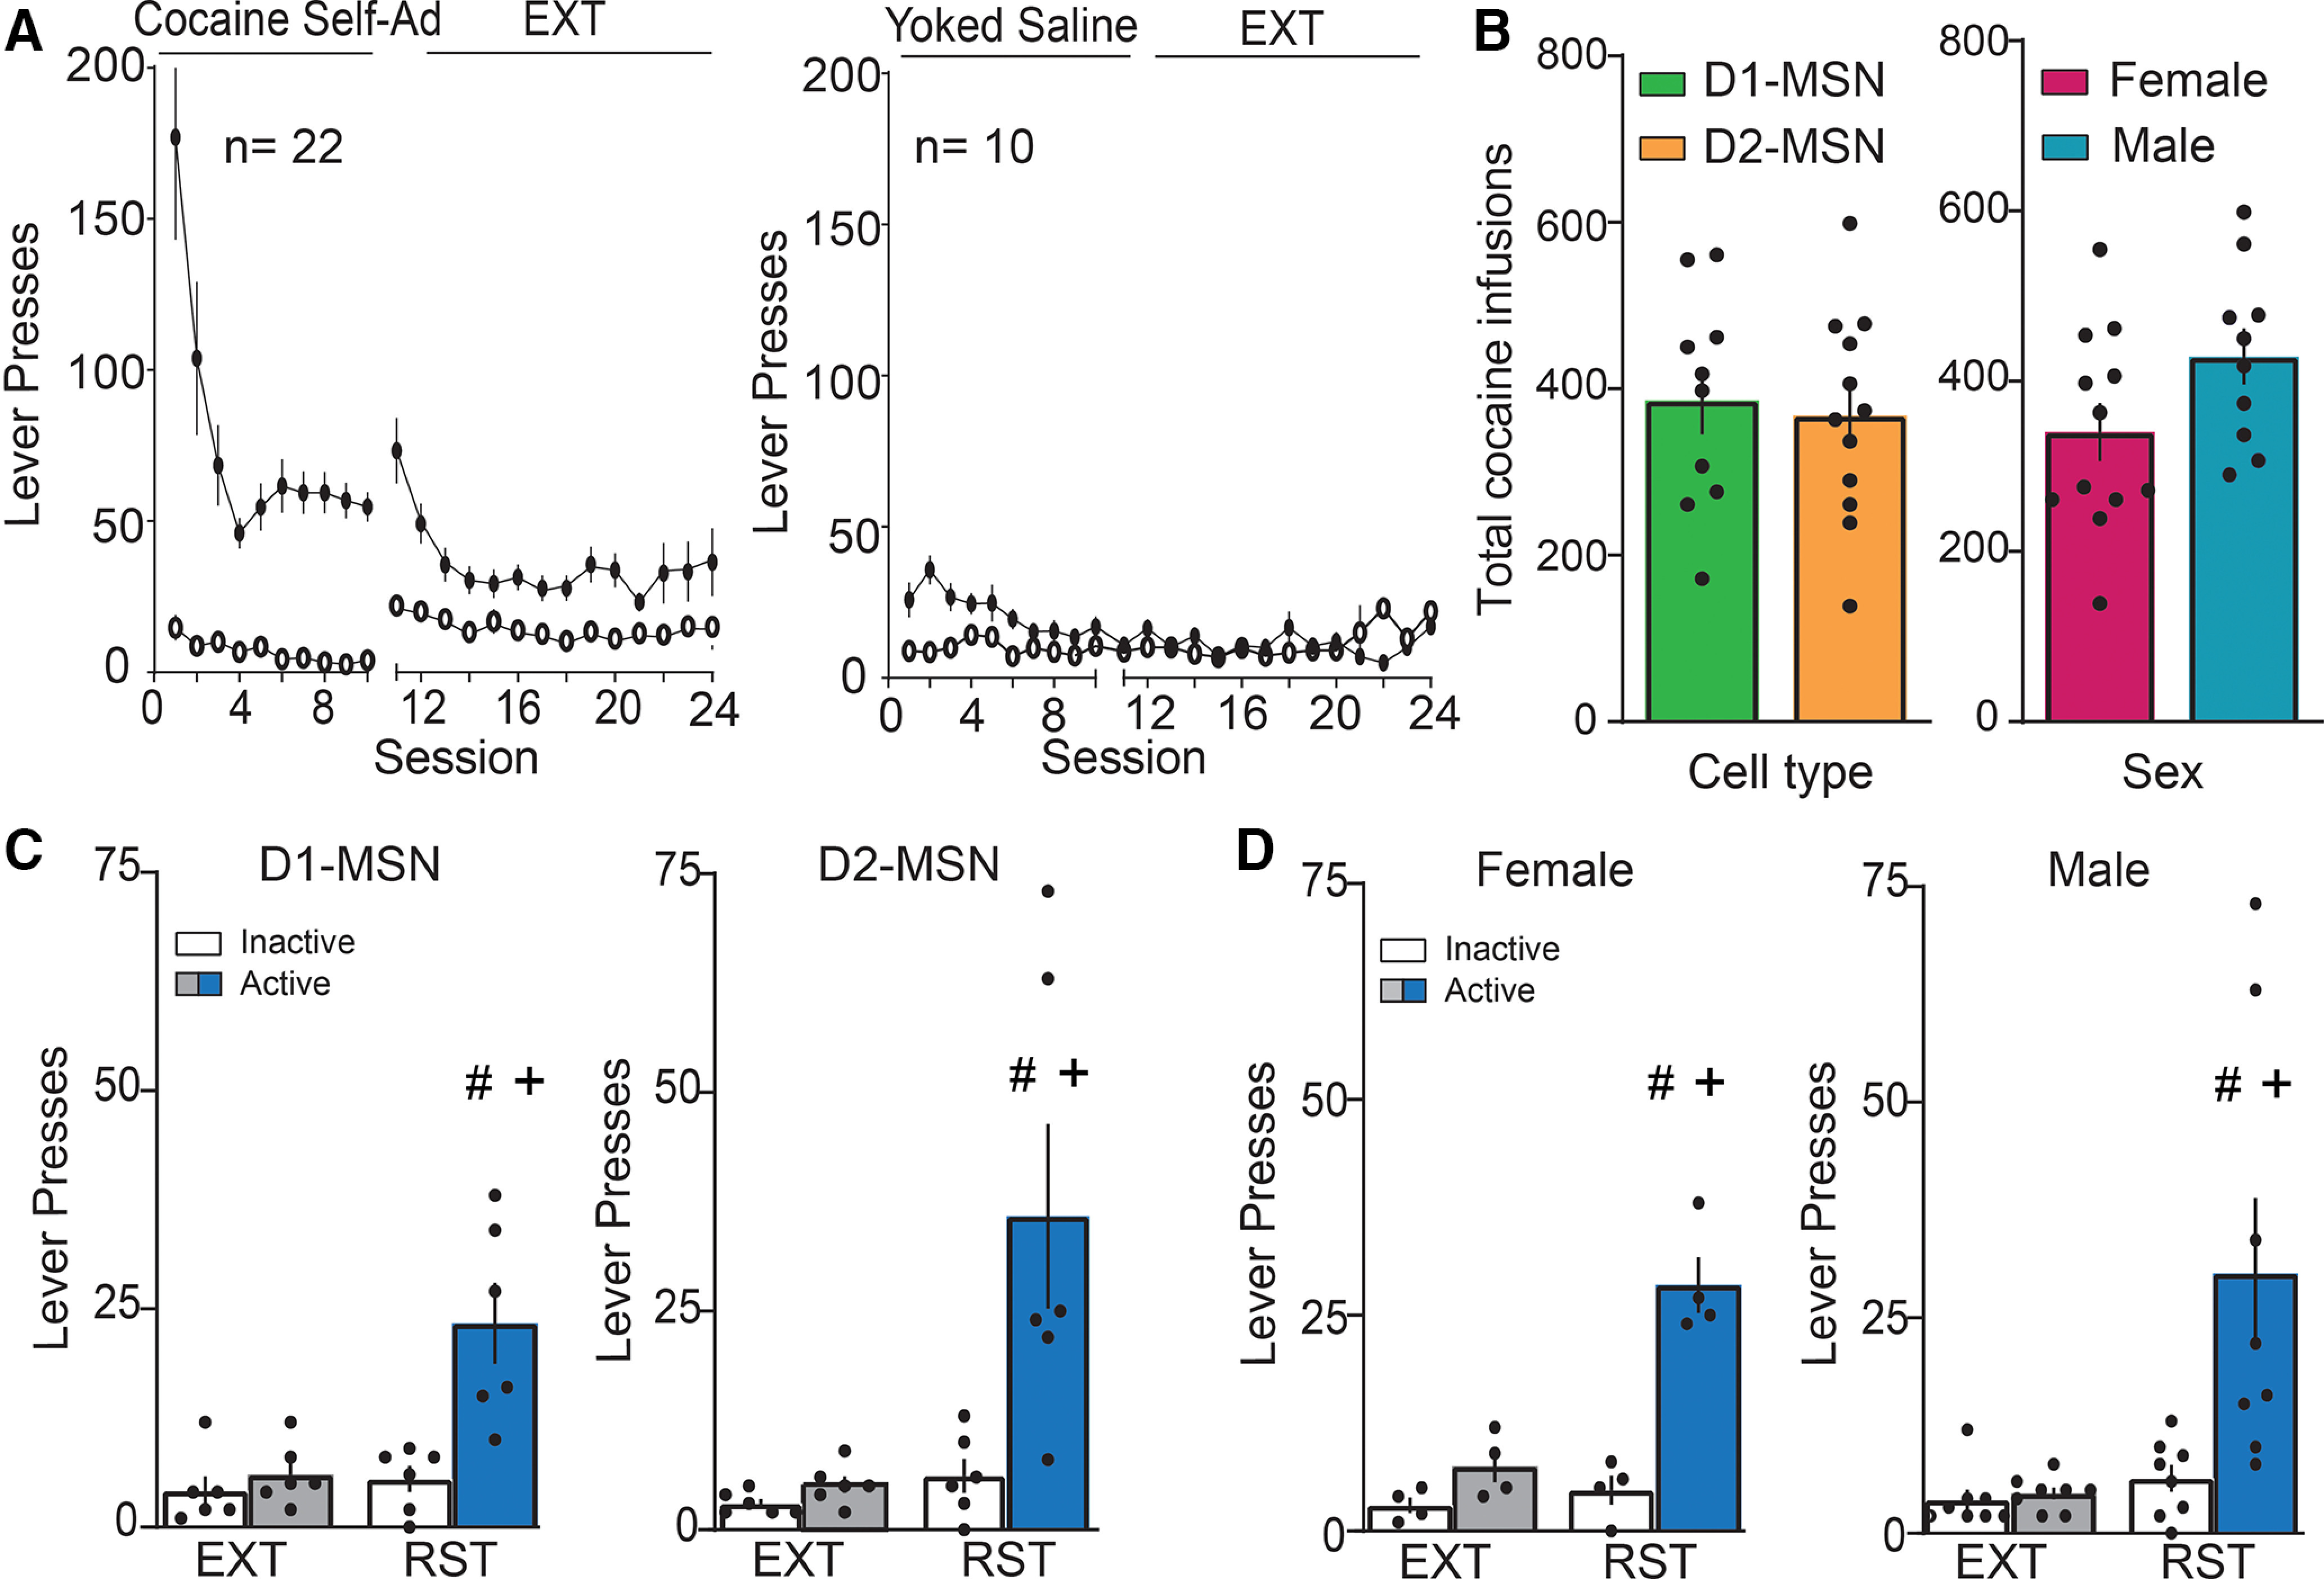
All procedures occurred in standard operant chambers equipped with two retractable levers, a house light, cue light, and 2900-Hz tone generator (Med Associates). Sixty-eight cocaine-treated (46 Sprague Dawley and 22 Long–Evans) and twenty-seven yoked saline (17 Sprague Dawley and 10 Long–Evans) were used in this study. Before cocaine self-administration training, animals were food deprived for 48 h, and then underwent a single 2-h food training session in which presses on the active lever resulted in the delivery of a single food pellet (45 mg, Noyes) on a fixed-ratio 1 (FR1) schedule of reinforcement. Following food training, animals were left with food ad libitum for the remainder of the experiments. One day later, animals began 2-h sessions cocaine self-administration on an FR1 schedule with a 20-s time out. Each active lever press resulted in cocaine (cocaine hydrochloride; 0.25 mg/infusion) infusion and simultaneously resulted in presentation of a compound light (above the active lever) and tone (2900 Hz) conditioning stimulus. An inactive lever was also provided to control for non-motivated responding. Active lever presses made during the time out were counted but did not result in drug delivery. Rats underwent self-administration for a minimum of 10–12 d, until they met maintenance criteria of ≥10 infusions of cocaine over 10 d, as well as discrimination between active and inactive levers (>75% lever presses on active lever). A subset of animals served as yoked saline controls.
Following successful acquisition and maintenance of cocaine self-administration, extinction training (2 h/d) began. During extinction, presses on the previously active lever were recorded but no longer produced drug or presentation of the drug-paired cues. All rats underwent at least 12 d of extinction, or until two consecutive days revealed ≤25 active lever presses.
During the reinstatement sessions, an FR1 schedule with a 20-s time out was used, where each active lever press produced the light/tone drug-paired cues that had been presented during self-administration. The cued-reinstatement session was initiated by one free cue. All animals used for dendritic spine, immunohistochemistry on dendrite surface and zymography experiments were removed from the boxes and promptly killed after 15 min of the reinstatement session. In Figures 4D,I, 9B,E,H,J, 10B,D,F,H brain tissue of saline, extinguished, or reinstated animals was divided and used for both p-FAK and p-cofilin immunoreactivity quantification. In Figure 5E,I, brain tissue from MMP-9 and β3-treated reinstated rats was shared for quantifying p-FAK and p-cofilin immunoreactivity.
Figure 4.

Increased p-FAK and p-cofilin expression in MSN ChR2-EYFP labeled dendrites during cue-induced cocaine seeking. p-FAK colocalization: A, Time course of active and inactive lever pressing of self-administration and extinction in cocaine-treated and yoked saline rats used for p-FAK colocalization on dendrites. B, Cue-induced reinstatement of cocaine seeking increased lever presses over 15 min before euthanizing rats for morphologic measurements. C, Dendritic segments in NAcore labeled with ChR2-EYFP (green) and p-FAK (red) in each treatment group [saline (SAL), extinguished (EXT), reinstated (RST)]. Three micrographs of each segment depict the confocal imaging showing p-FAK puncta and labeled dendrites (left), an isolated dendrite (middle), and p-FAK puncta within the dendrite expressed as % colocalized (right). Scale bar = 5 µm. D, Increased dendritic p-FAK immunoreactivity within dendrites in extinguished and reinstated group compared with saline animals. E, Positive correlation between induction of p-FAK signal within the dendrite and active lever presses during 15-min cue-induced reinstatement. p-cofilin colocalization: F, Time course of active and inactive lever pressing of self-administration and extinction in cocaine-treated and yoked saline rats used for p-cofilin colocalization on dendrites. G, Cue-induced reinstatement of cocaine seeking increased lever presses over 15 min before euthanizing rats for morphologic measurements. H, Dendritic segments in NAcore labeled with ChR2-EYFP (green) and p-Cofilin (red) in each treatment group (SAL, EXT, RST). Three micrographs of each segment depict the confocal imaging showing p-cofilin puncta and labeled dendrites (left), an isolated dendritic region of interest (middle), and p-cofilin puncta within the dendrite expressed as % colocalized (right). Scale bar = 5 µm. I, Increased dendritic p-cofilin immunoreactivity within dendrites in reinstated group compared with saline and extinguished animals. J, No correlation between p-cofilin puncta signal within the dendrite and active lever presses during 15-min cue-induced reinstatement. Data are shown as mean ± SEM; N represents number of neurons quantified over number of animals in each condition; *p < 0.05 comparing EXT or RST to SAL; #p < 0.05 compared RST to EXT; +p < 0.05 compared active to inactive lever presses using Bonferroni post hoc.
Figure 9.

Increased p-FAK expression in D1-MSN and D2-MSN, but p-cofilin only showed increased expression in D1-MSN during cue-induced cocaine seeking. p-FAK colocalization: A, D, Dendritic segments in NAcore labeled with mCherry-ChR2 (green, pseudo-colored images) in D1-MSN and D2-MSN and p-FAK (red) in each treatment group [saline (SAL), extinguished (EXT), reinstated (RST)]. Micrograph pairs of each segment depict the confocal imaging showing p-FAK puncta and labeled dendrites (left), and p-FAK puncta within the dendrite (right). Scale bar = 5 µm. B, Increased dendritic p-FAK immunoreactivity within D1-MSN dendrites in reinstated group compared with saline and extinguished animals. C, Positive correlation between p-FAK puncta expression within D1-MSN dendrite and active lever presses during 15-min cue-induced reinstatement. E, Increased dendritic p-FAK immunoreactivity within D2-MSN dendrites in reinstated group compared with saline and extinguished animals. F, No correlation between p-FAK puncta expression within the D2-MSN dendrite and active lever presses during cued reinstatement. p-cofilin colocalization: G, I, Dendritic segments in NAcore labeled with mCherry-ChR2 (green, pseudo-colored images) in D1-MSN and D2-MSN and p-cofilin (red) in each treatment group (SAL, EXT, RST). Micrograph pairs of each segment depict the confocal imaging showing p-cofilin puncta and labeled dendrites (left), and p-coflin puncta within the dendrite (right). Scale bar = 5 µm. H, Increased dendritic p-cofilin immunoreactivity within D1-MSN dendrites in reinstated group compared with saline and extinguished animals. J, No significant difference observed in p-cofilin puncta expression in D2-MSN dendrites. Data are shown as mean ± SEM N represents number of neurons quantified over number of animals in each condition; *p < 0.05 comparing RST to SAL; #p < 0.05 compared RST to EXT using Bonferroni post hoc.
Figure 10.

Increased p-FAK expression in both D1-MSN and D2-MSN cell bodies, while p-cofilin showed increased expression only in D1-MSN cell bodies during cue-induced cocaine seeking. p-FAK colocalization: A, C, Cell bodies in NAcore labeled with mCherry-ChR2 (green, pseudo-colored images) in D1-MSN and D2-MSN and p-FAK (red) in each treatment group [saline (SAL), extinguished (EXT), reinstated (RST)]. Micrographs of each cell body depict the confocal images of p-FAK puncta and labeled cell bodies (left), and p-FAK puncta within the cell body (right). Scale bar = 30 µm. B, Increased cell body p-FAK immunoreactivity within D1-MSN in extinguished and reinstated group compared with saline animals. D, Increased cell body p-FAK immunoreactivity within D1-MSN in reinstated group compared with saline and extinguished animals. p-cofilin colocalization: E, G, Cell bodies in NAcore labeled with mCherry-ChR2 (green, pseudo-colored images) in D1-MSN and D2-MSN and p-cofilin (red) in each treatment group (SAL, EXT, RST). Micrographs of each cell body depict the confocal images of p-cofilin puncta and labeled cell bodies (left), and p-cofilin puncta within the cell body expressed as % colocalized (right). Scale bar = 30 µm. F, Increased cell body p-cofilin immunoreactivity within D1-MSN in reinstated group compared with saline and extinguished animals. H, No significant difference observed in p-cofilin puncta expression in D2-MSN cell body. Data are shown as mean ± SEM; N represents number of cell bodies quantified over number of animals in each condition; *p < 0.05 comparing RST or EXT to SAL; #p < 0.05 compared RST to EXT using Bonferroni post hoc.
Figure 5.
Signaling cascade downstream MMP9 in MSN ChR2-EYFP labeled dendrites during cue-induced cocaine seeking. A, Schematic illustration of the experiment in panels B–I testing for the signaling cascade downstream signaling from MMP-9 activation during cued cocaine seeking. B, Time course of active and inactive lever pressing of self-administration and extinction in cocaine-treated rats used for p-FAK immunoreactivity measurement. C, Equivalent number of infusions taken by each treatment group. D, Cue-induced reinstatement of cocaine seeking increased lever presses over 15 min before euthanizing rats for p-FAK immunoreactivity measurements. E, Increased dendritic p-FAK immunoreactivity during reinstatement was prevented by pretreatment with MMP-9i (0.1 nmol) or β3 morpholino (25 pmol over 5 d). Rats were pretreated in one hemisphere with active drug, and with control in the contralateral hemisphere allowing for paired t test analysis. F, Time course of active and inactive lever pressing during self-administration and extinction in cocaine-treated rats used for p-cofilin expression. G, Equivalent number of infusions taken by each treatment group. H, Cue-induced reinstatement of cocaine seeking increased lever presses over 15 min before euthanizing rats for p-cofilin immunoreactivity measurements. I, Increased dendritic p-cofilin immunoreactivity during reinstatement was prevented by pretreatment with MMP-9i (0.1 nmol), β3 morpholino (125 pmol over 5 d), or FAKi (3 nmol). Rats were pretreated in one hemisphere with active drug, and with control in the contralateral hemisphere allowing for paired t test analysis. J, Schematic illustration of the experiment in panels K–N testing for inside-out signaling between p-FAK and MMP-9 activity. K, Time course of active and inactive lever pressing of self-administration and extinction in yoked saline and cocaine-treated rats used for MMP-9 activity measurements. L, Cue-induced reinstatement of cocaine seeking increased lever presses over 15 min before euthanizing rats for MMP-9 activity measurements. M, Examples of FITC-gelatin fluorescence in NAcore of yoked saline and cue-reinstated rats. Dashed line outlines the anterior commissure (ac) and injection site that were masked for quantification. Scale bar = 250 μm. N, The increase in fluorescence observed during cue-induced cocaine seeking was not affected by FAKi microinjection in NAcore. N is the average of 3–4 NAcore slices/rat. Data are shown as mean ± SEM; N represents number of neurons quantified over number of animals in each condition; *p < 0.05 comparing treated to vehicle or SAL; #p < 0.05 compared RST to EXT; +p < 0.05 compared active to inactive lever presses using Bonferroni post hoc.
Microinjection procedures and virus used
During catheter implantation, rats were implanted with chronic guide cannulae above the NAcore (AP: 1.6, ML: 1.7, DV: −7) held into place by dental acrylic and jeweler screws anchored in the skull. For experiments shown in Figure 2, animals were not catheterized but were microinjected with virus. NAcore MSNs were labeled with two different viruses (0.75 µl/hemisphere at a rate of 0.15 ml/min) that drove expression of membrane targeted EYFP under control of the synapsin promoter (AAV2-hSyn-hChR2-EYFP; Addgene 26 973-AAV1; titer 5.7 × 10¹² GC/ml) or cre-dependent expression of membrane targeted mCherry (AAV1-ef1-dflox-mCherry-hChR2; Addgene catalog 20297-AAV1; titer 8 × 10¹² GC/ml). hSyn-hChR2-EYFP virus was used in the experiments shown in Figures 2A, 4, 5, and dflox-mCherry-hChR2 EYFP was used in the experiments shown in Figures 2, 3, 7, 9, 10.
Figure 2.

Examples of AAV2-hSyn-hChR2-EYFP or AAV1-ef1-dflox-mCherry-hChR2 transfection in NAcore and method for quantifying dendritic protein immunoreactivity labeled neurons. A, Coronal slice showing representative ChR2-EYFP transfected wild-type rat. The higher magnification inset shows that EYFP is fully expressed in neurons, and box indicates a typical dendritic segment to be quantified. B, Coronal slice showing representative DIO mCherry-ChR2 transfected D1-MSNs in the NAcore of a D1-Cre rat. The higher magnification inset shows that mCherry is fully expressed in neurons, and box indicates a typical dendritic segment to be quantified. Dotted lines outline the anterior commissure (ac). Left scale bar = 100 µm. Right scale bar = 30 µm. C, Micrograph sequence of the method used to quantify p-cofilin (green) or p-FAK expression in NAcore dendritic segments labeled with DIO mCherry-ChR2 (red). (1) Micrograph of segment in the merged confocal imaging showing p-cofilin puncta and Cre-dependent labeling of D1 dendrites. (2) Isolation of the dendritic segment using IMARIS software. (3) Masked dendrite and surrounding p-cofilin signal. (4) Isolated dendritic segment (red) and p-cofilin puncta within the dendrite (white). (5) Quantified colocalization between dendrite and p-cofilin puncta. Scale bar = 5µm.
Figure 3.
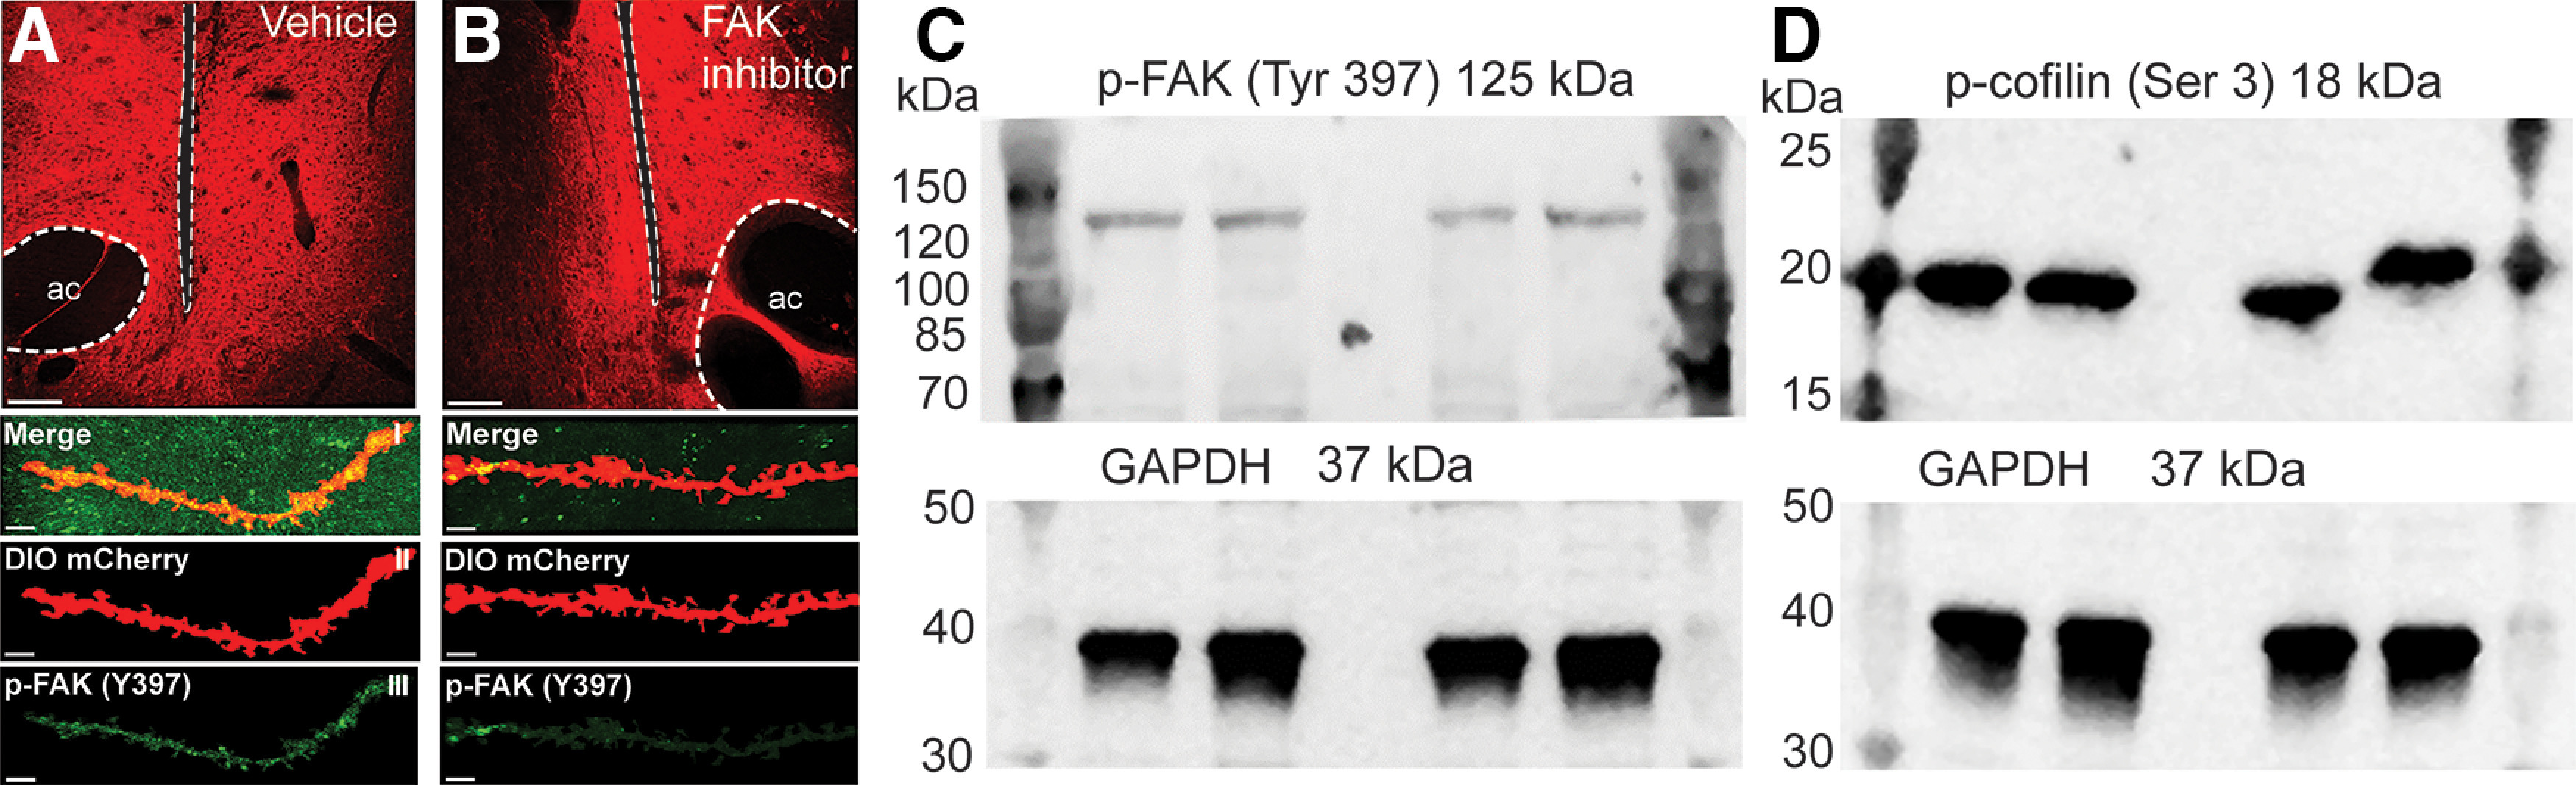
Validation of the p-FAK and p-cofilin antibodies used for the immunohistochemistry in experiments shown in Figures 4, 5, 9, 10. A, B, Rat coronal slice showing representative mCherry transfected D1-MSNs in the NAcore with unilateral microinjection of Vehicle (panel A) or FAKi (panel B) in the NAcore. Scale bar = 100 µm, dotted lines indicate microinjection site and anterior commissure (ac). Higher magnification top-down sequence of images show p-FAK (green) expression on dendritic segments in NAcore labeled with DIO mCherry-ChR2 (red). (I) Confocal imaging showing p-FAK puncta (green) and Cre-dependent viral labeling in D1-MSN (red). (II) Isolation of the dendritic segment using IMARIS software. (III) Masked p-FAK signal. Scale bars = 5 µm. C, Representative Western blotting of phosphorylated FAK (125 kDa) at tyrosine 397 and GAPDH used as load control (37 kDa). D, Representative Western blotting of phosphorylated cofilin (18 kDa) at serine 3 and GAPDH used as load control (37 kDa).
Figure 7.
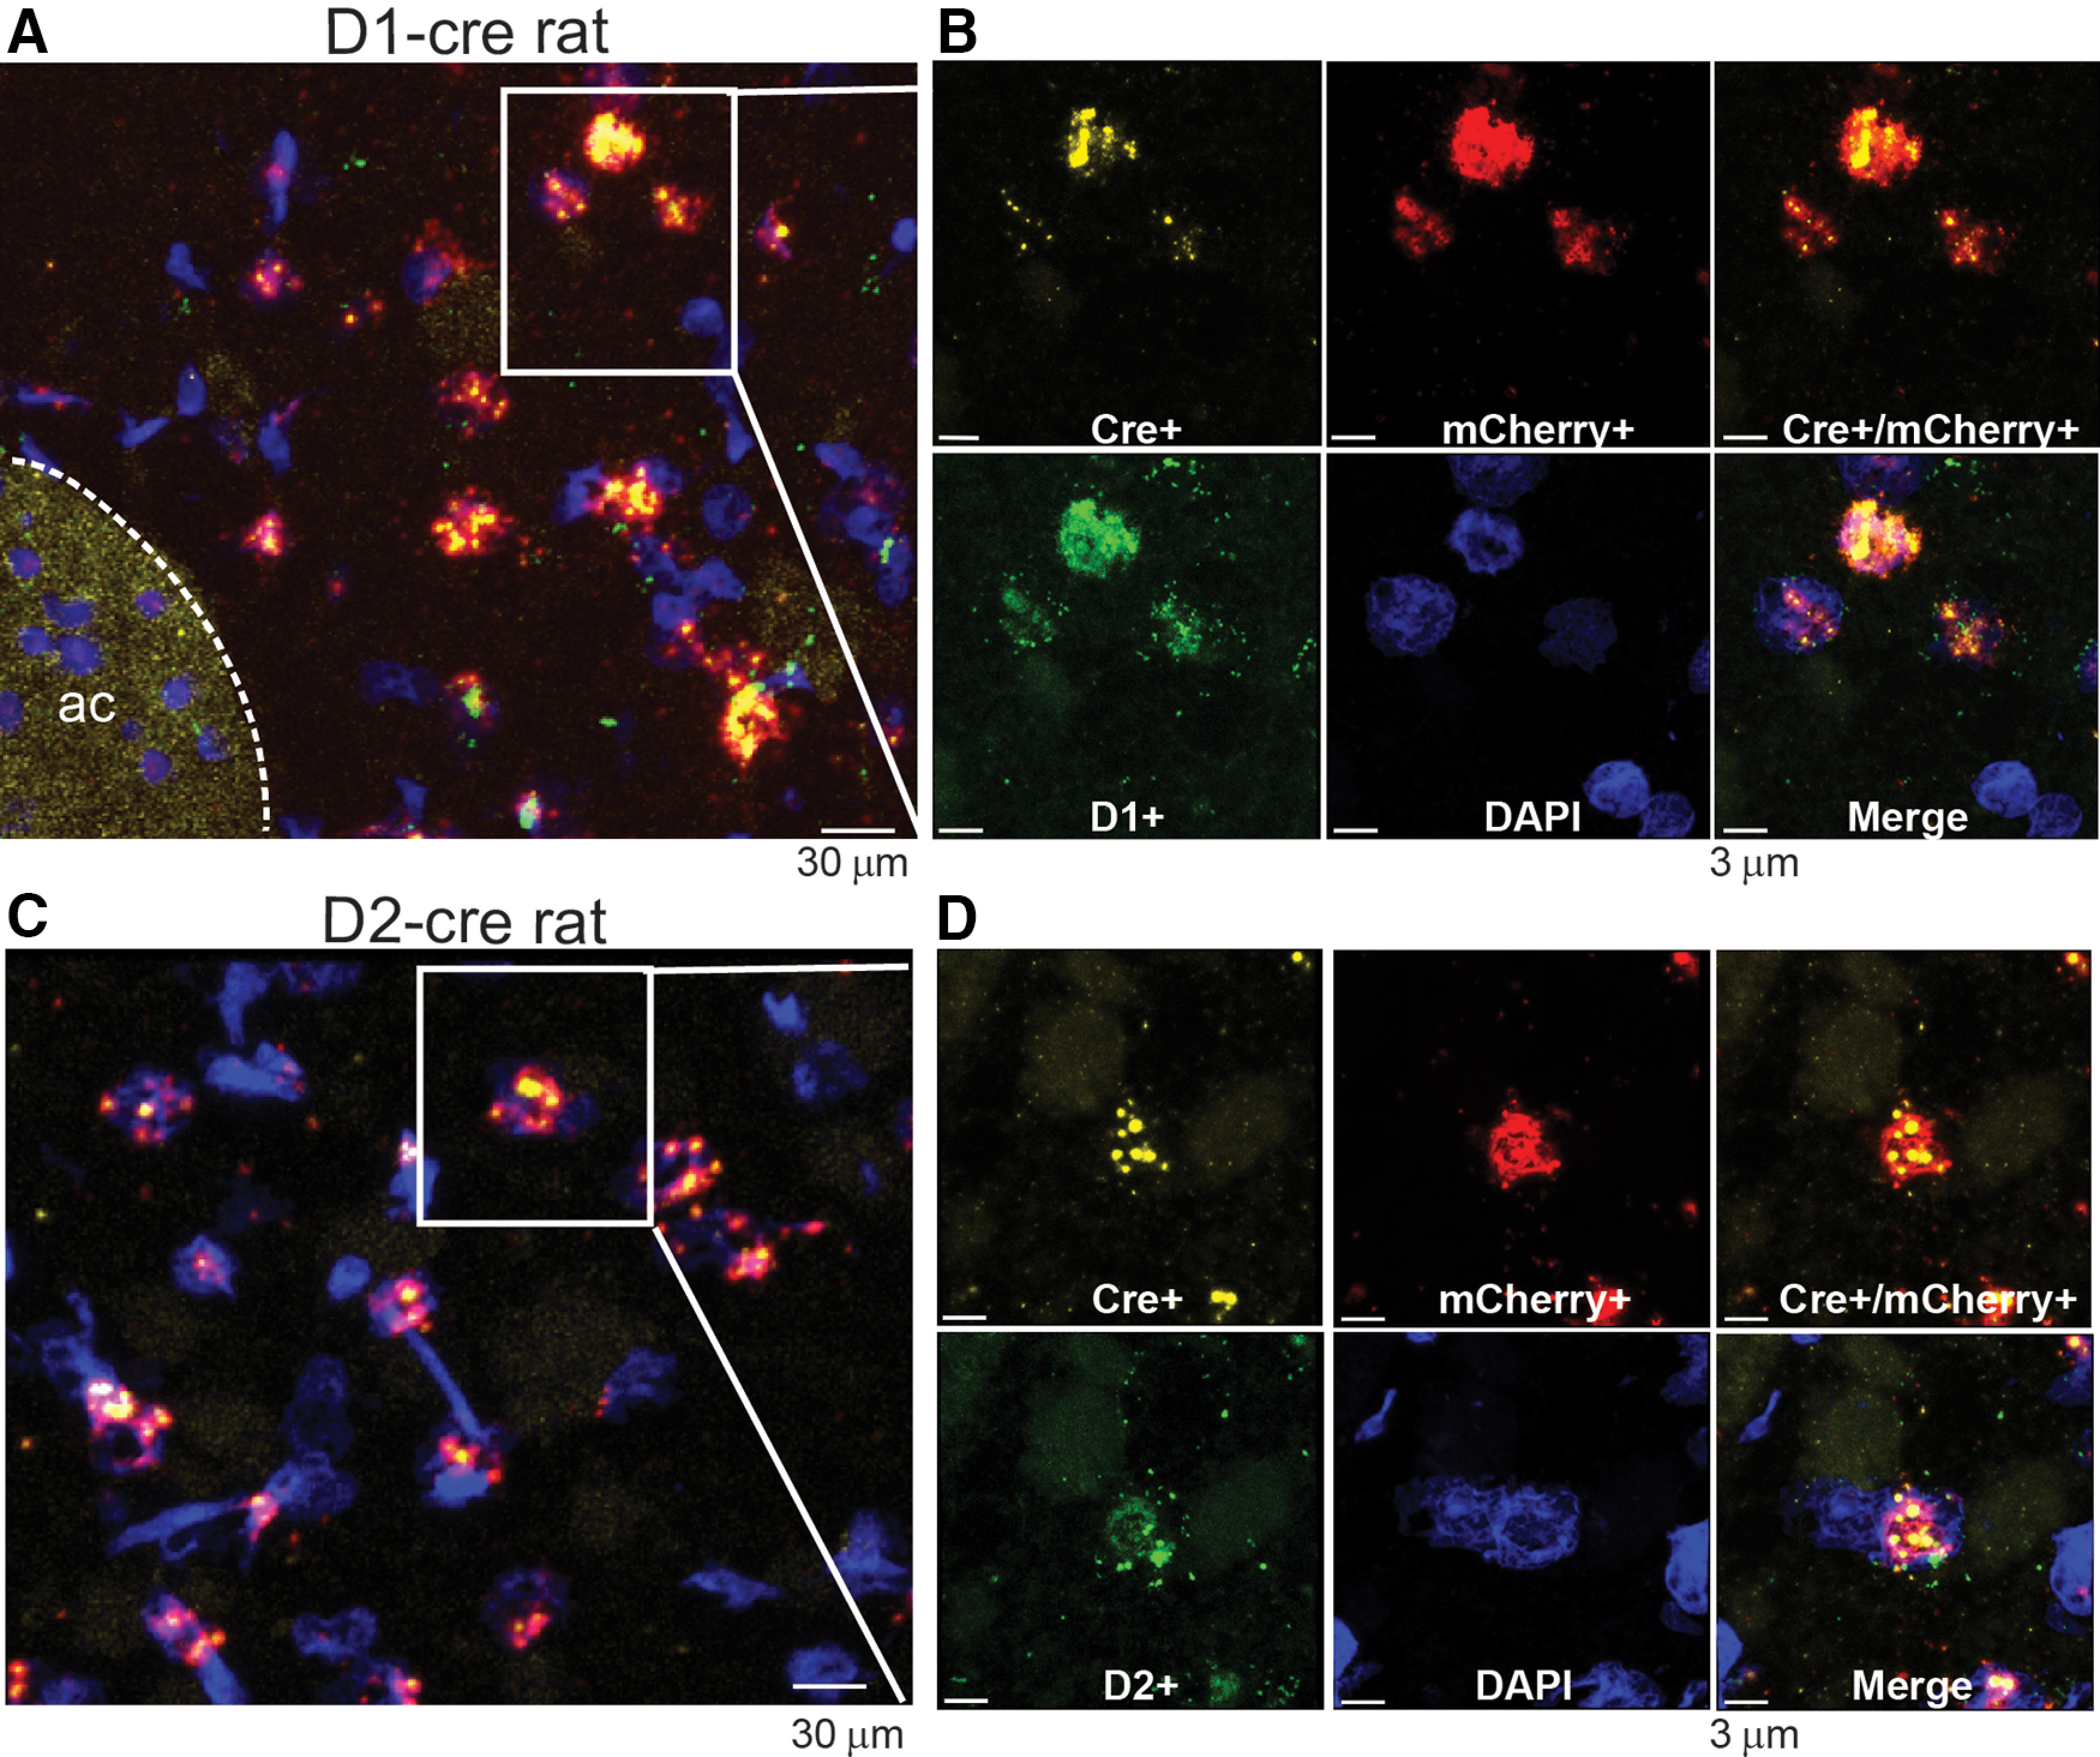
mCherry mRNA expressed in Cre recombinase mRNA in NAc, colocalizes with D1 and D2 mRNA in the D1-Cre and D2-Cre rats, respectively. A, C, Low magnification in situ hybridization staining in NAcore sections from D1-Cre and D2-Cre rats showing that Cre mRNA (yellow) and mCherry (red) co-localizes exclusively with dopamine D1 receptor mRNA (green) in D1-Cre rats (top), and with dopamine D2 receptor mRNA (green) in D2-Cre rats (bottom). Scale bar = 30 µm. B, D, High magnification of section showing Cre and mCherry mRNA puncta co-localize with D1 and D2 receptor mRNA in D1-cre and D2-cre rats respectively. Scale bar = 3 µm.
Cannulae (Plastics One) were fitted with dummy injectors to prevent debris from entering the cannulae. 10 min before testing, rats received bilateral (Fig. 1) or unilateral (Figs. 3, 5) intracranial injections into NAcore of 0.5 μl of FAKi (3.0 nmol/side), MMP-9i (0.1 nmol/side), or β3 integrin subunit antisense or scrambled oligonucleotide (25 pmol × 5 d during extinction training; see Garcia-Keller et al., 2019) over 2 min using 33-gauge microinjector needles (Plastics One) that extended 2 mm from the tip of the cannulae. Following the microinfusion, microinjector needles were left in place for two additional minutes to allow for drug diffusion.
Figure 1.
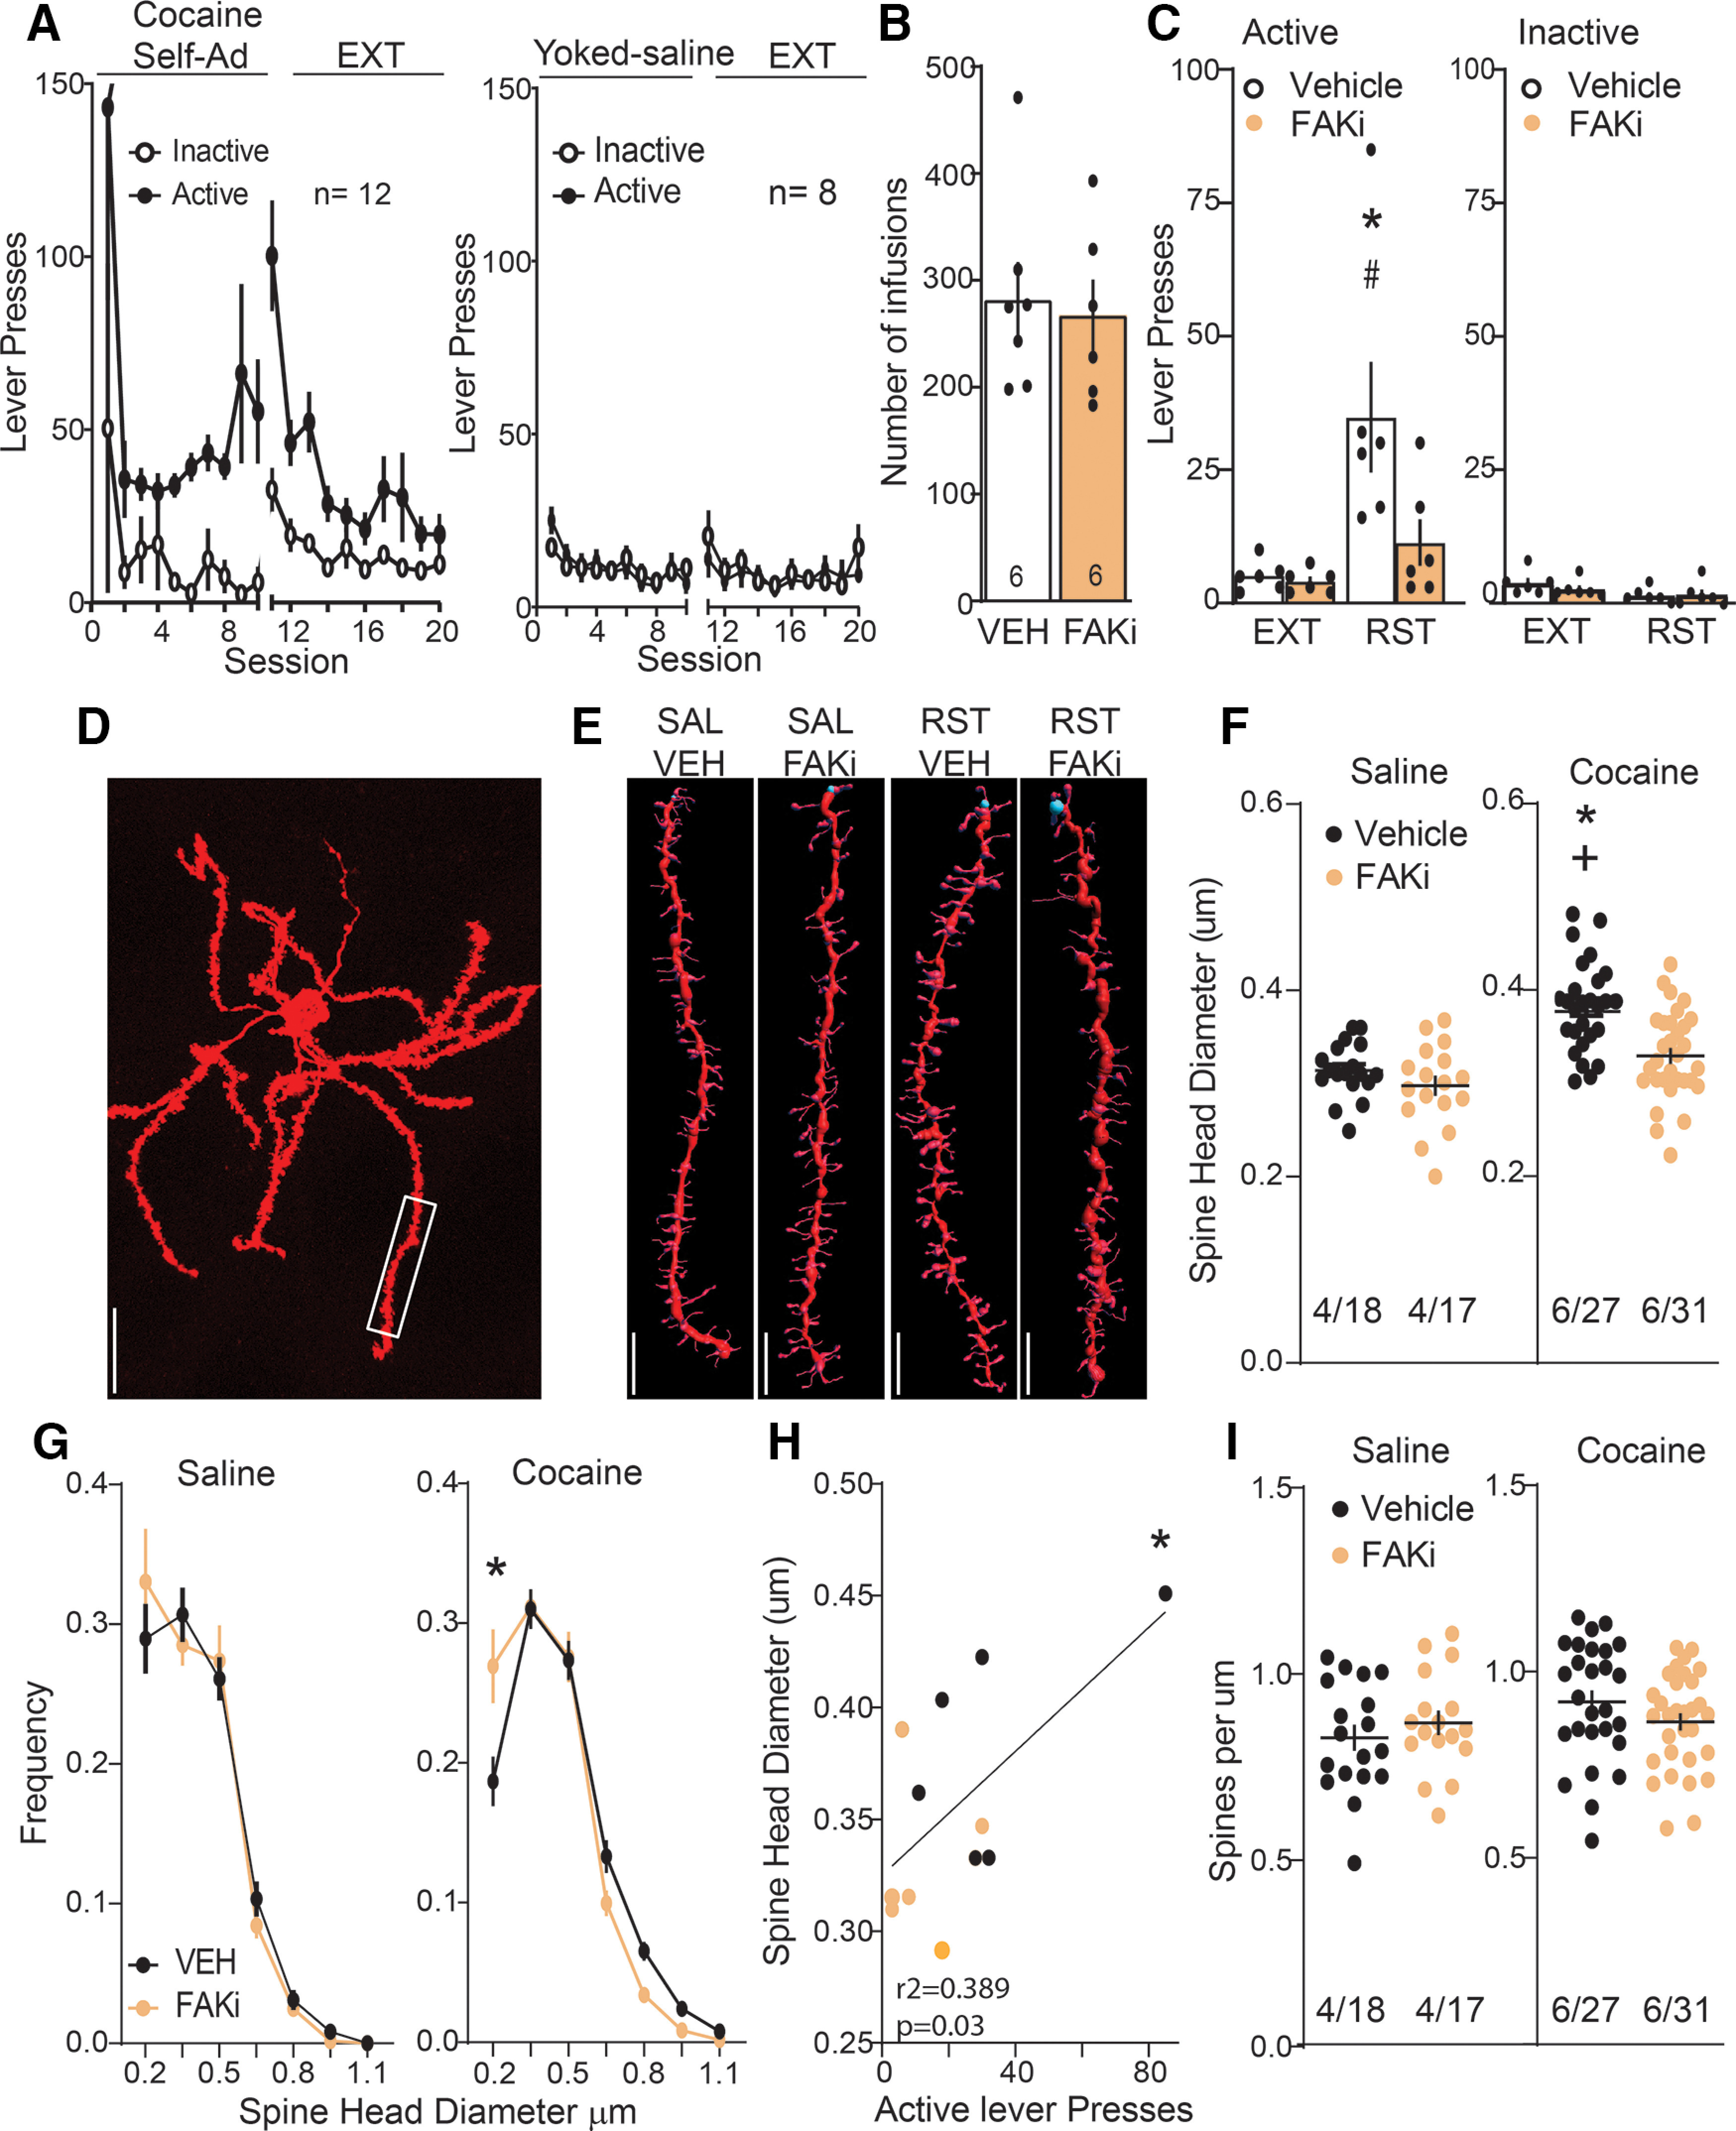
FAKi blocked cocaine seeking initiated by drug paired cues and prevented increases in dendritic spine head diameter. A, Time course of active and inactive lever pressing during self-administration and extinction in cocaine-treated and yoked saline rats used for spines morphology measurement. B, Equivalent number of infusions taken by each treatment group. C, Cue-induced reinstatement of cocaine seeking increased active lever presses over the 15 min before euthanizing rats for morphologic measurements, and this was reduced by FAKi. Four to six dendrite segments from separate neurons were analyzed from each animal. D, Representative DiI filled MSN. Box shows area sampled from this neuron for spine analysis. Scale bar = 30 μm. E, Representative dendritic segments from each treatment group. Scale bar = 2 μm. F, Spine head diameter that was increased during 15-min reinstatement was blocked by FAKi. G, The decreased spine head diameter after FAKi treatment was associated with a shift in the frequency distribution compared with VEH treatment only in reinstated animals. H, Correlation between spine head diameter and active lever presses during 15-min cue-induced reinstatement. I, No change was measured in spine density between any of the treatment groups. Data are shown as mean ± SEM; N shown as number of neurons quantified over number of animals in each condition; *p < 0.05 comparing VEH/RST to FAKi/RST; #p < 0.05 compared VEH/RST to VEH/EXT; +p < 0.05 compared VEH/Coc to VEH/Sal using Bonferroni post hoc.
Membrane fractionation and Western blotting
Drug naive rats were rapidly decapitated and NAcore tissue was dissected and homogenized in ice-cold 0.2 ml buffer containing Na+ HEPES and sucrose (pH 7.4). All buffers were supplemented with 1:100 protease and phosphatase inhibitor mixtures (Thermo Scientific). Homogenates were centrifuged at 1000 × g for 10 min at 4°C, and the pellet was homogenized with an additional 0.2 ml homogenization buffer and centrifuged again. Supernatants were centrifuged at 12,000 × g for 20 min. The resultant pellet was resuspended in 30-μl radioimmunoprecipitation assay (RIPA) buffer (Thermo Scientific) supplemented with 1.0% SDS, as well as protease and phosphatase inhibitors. A final centrifugation step at 10,000 × g for 5 min was performed to remove insoluble material. Protein concentration was determined using the bicinchoninic acid (BCA) method (Thermo Scientific), and equal 15 µg quantities of protein were loaded per lane. Western blotting was performed onto PVDF membranes, using standard techniques as described previously (Toda et al., 2006). Sections were incubated with a mouse or rabbit monoclonal primary antibodies against p-FAK on Tyr397 (ab24781 Abcam, 1:500) or p-cofilin on Ser3 (ab47281 Abcam, 1: 500) and GAPDH (14C10 Cell Signaling, 1:1000), for 12 h at 4°C with gentle agitation (Kim et al., 2014; Pucciarelli et al., 2016; Dombert et al., 2017) Secondary antibodies Millipore anti-mouse (12–349) and anti-rabbit (12–348) for chemiluminescent Western blotting using KODAK Image Station 4000MM Digital Imaging System (Molecular Imaging Systems). To maximize use of tissue, gels were used to probe multiple proteins of different molecular weights. GAPDH was used as an unchanged loading control.
Fluorescent in situ hybridization
Rats were rapidly decapitated, then the brains were extracted and flash frozen in isopentane solution on dry ice. Brains were sliced at 20 µm in a cryostat (−20°C), and sections were air-dried to the slides at −20°C and stored at −80°C. For the detection of D1 receptor (Drd1a), D2 receptor (Drd2), or Cre recombinase mRNA, the RNAscope Fluorescent Multiplex kit (320293; Advanced Cell Diagnostics) was used with slight modification of manufacturer instructions and using commercially available probes [iCre (C2, #423321), Drd1a (C1, #317031), and D2 (C1, #315641)]. Briefly, sections were fixed for 20 min in neutral buffered 10% formalin, followed by ethanol dehydration series on 50%, 70%, 95%, and 100%, 5 min each. Section were stored overnight at −20°C in 100% ethanol. Before hybridization sections were treated with protease IV (322340, Advanced Cell Diagnostics). Section were hybridized for 2 h at 40°C, and probes were amplified using RNAScope fluorescent amplifiers as directed by manufacture. The C1 probe was conjugated to Alexa Flour 488, and C2 probes to Atto-550. Sections were then coverslipped using DAPI fluoromount-G mounting medium (17984-24, Electron Microscopy Science), allowed to dry.
Quantification of mRNA expression
Fluorescent in situ hybridization was imaged at 20× in an Olympus VS120 microscope. Images of coronal sections of NAcore from +2.2 to +0.7 mm form Bregma. Randomly square fields of 200 × 200 µm were placed within the NAcore. Individual cells were identified by their nucleus stained with DAPI, and D2 or D1 mRNAs were imaged using a TexasRed filter, and iCre mRNA was imaged using a FICT filter. Cell were counted on each field (15–20 fields across three to four brain sections for two animals per genotype) and summed for each subject.
Quantification of dendritic spine head morphology
Rats were deeply anesthetized with ketamine HCl (87.5 mg/kg, i.p.) and xylazine (5 mg/kg, i.p.). Transcardial perfusions with PBS followed by 1.5% paraformaldehyde (PFA) in PBS. Brains were removed and postfixed in the same fixative for 60 min, then coronally sectioned at 100 μm in PBS on a vibratome. Tungsten particles (1.3 μm in diameter, Bio-Rad) were coated with the lipophilic carbocyanine dye DiI (Invitrogen). DiI-coated particles were delivered diolistically into the tissue at 80 PSI using a Helios Gene Gun system (Bio-Rad) fitted with a polycarbonate filter with a 3.0-μm pore size (BD Biosciences). DiI was allowed to diffuse along neuron axons and dendrites in PBS for 24 h at 4°C, and then fixed again in a 4% PFA for 1 h at room temperature. After a brief PBS wash, tissue was mounted onto slides in aqueous medium mounting with ProLong Diamond Antifade (Life Technologies) to preserve fluorescence intensity over time.
Spine morphology was quantified as described in detail previously (Shen et al., 2008). Briefly, images of DiI-labeled sections were taken on a confocal microscope (Leica SP5) using a Helium/Neon 543-nm laser line. Images of dendrites were taken through a 63× oil immersion objective with a numerical aperture of 1.4, using a 3.5× digital zoom. Images were deconvolved via Autoquant before analysis (Media Cybernetics), and a 3-D perspective was rendered by the Surpass module of Imaris software package version 8 (Bitplane). Final data set voxel dimensions were of 0.068 μm in the xy plane and 0.126 μm in the z. The smallest quantifiable diameter spine head was set to 0.15 μm. Only spines on dendrites beginning >75 μm and ending <200 μm distal to the soma and after the first branch point were quantified on cells localized to the NAcore. The length of quantified segments was 45–55 μm. Imaging and analysis of dendrites were performed in an unbiased manner, blind to the groups.
Immunohistochemistry within dendrites and cell bodies
Rats were deeply anesthetized with ketamine HCl (87.5 mg/kg, i.p.) and xylazine (5 mg/kg, i.p.). Transcardial perfusions with PBS were followed by 4.0% PFA in PBS. Brains were removed, then coronally sectioned (100 μm thick) in PBS using a vibratome. For immunohistochemical detection of p-FAK or p-cofilin, sections were incubated with a mouse or rabbit monoclonal primary antibodies against p-FAK on Tyr397 (ab24781 Abcam, 1:500) or p-cofilin on Ser3 (ab47281 Abcam, 1:500) for 48 h at 4°C with gentle agitation (Babayan et al., 2012). For experiments in Figure 3, since the rats were drug naive a higher concentration of p-FAK on Tyr397 antibody was used (ab24781 Abcam, 1:250). Amplification of the viral reporter was performed at the same time using GFP antibody (ab13970) for EYFP-ChR2 transfected rats (Figs. 2A, 4C,H) or an antibody directed against dsRed/mCherry (anti-dsRed, Clontech 632496, 1: 500 or anti-mCHerry LSBio 204825, 1: 500) for D1 and D2-cre rats (Figs. 2B,C, 3A,B, 9A,D,G,I, 10A,C,E,G). Following incubation with primary antibodies, sections were washed and followed by overnight at 4°C secondary incubation with the appropriate species-specific Alexa Fluor-conjugated secondary antibody (1:1000, Life Technologies).
Confocal Z-series datasets of immunohistochemistry on dendrites were acquired using a Leica SP5 laser-scanning confocal microscope using Argon (Ar 488 nm), Helium-Neon (He-Ne 543 nm), or Helium-Neon (He-Ne 633 nm) laser lines. All images were acquired using a 63× oil immersion objective with a numerical aperture of 1.4 using a 3.5× digital zoom. Acquisition settings were as follows: 1024 × 256 frame size, frame average of 4, and a 0.21-µm z step size. Care was taken to ensure that selected dendrites were complete through the xy, and z planes. Following acquisition, Z-stacks were exported to BitPlane Autoquant (Media Cybernetics) for deconvolution. Final dataset voxel dimensions were 0.068 µm xy and 0.210 µm z. Following deconvolution, individual dendrites were isolated using the Imaris version 8 surface module. Colocalization was calculated by taking the volume (µm3) of the total colocalized p-cofilin or p-FAK signal and then dividing it by the volume (µm3) of the dendrite itself to obtain a normalized index of p-cofilin or p-FAK signal within the isolated dendrite or region of interest. Importantly, all image acquisition, cropping, and colocalization analysis was performed by an investigator blind to treatment groups.
In vivo zymography
Because MMPs are secreted as inactive proforms and catalytically activated within the ECM, activity assays are preferable to immunoblotting for protein content for assessing changes in MMP function (Kupai et al., 2010). We used an in vivo zymography assay to measure MMP activity directly as described previously (Smith et al., 2014). Rats were microinjected in the NAcore (1.5 μl/hemisphere at a rate of 0.5 μl/min) with intramolecularly dye-quenched fluorescein conjugated gelatin (Life Technologies) reconstituted in PBS to 1 mg/ml (pH 7.2–7.4) with a 20-min incubation time in the home cage or the operant environment depending on the experimental group. Dye-quenched gelatin is an MMP-2/MMP-9 substrate containing intramolecularly quenched FITC fluorophores that cannot fluoresce until they are proteolytically processed by MMP-2 or MMP-9 (Bozdagi et al., 2007). Proteolytic cleavage by the gelatinases results in an activity-dependent increase in green fluorescence that increases linearly with time. After gelatin incubation, rats were overdosed with sodium pentobarbital (100 mg/kg, i.p.) before being transcardially perfused with PBS followed by 4.0% PFA in PBS. Brains were removed and postfixed for 1 h, then coronally sectioned at 100 μm on a vibratome in PBS. Sections were mounted in Prolong Gold medium and stored at 4°C until imaged. Images were obtained on Leica SP5 laser-scanning confocal microscope, using a 488-nm Argon laser line, emissions filtered to 515–535 nm through a 10× objective with 0.3 numerical aperture. Only slices in which the injection site and anterior commissure could be visualized in the same frame were used for quantification. ImageJ was used to quantify images. The anterior commissure provided a landmark for the NAcore but was masked during quantification. In addition, the microinjector tract was masked from the quantification as MMP activity is induced as part of an acute inflammatory response to tissue damage by the injector. Fluorescence was quantified as integrated density from four to six sections per rat. Importantly, all image acquisition and analysis was performed by an investigator blind to treatment groups.
Statistics
All statistics were done using GraphPad Prism version 8. Behavioral and zymography data were analyzed by two-way ANOVA followed by Bonferroni post hoc tests for multiple comparisons. Number of infusions and immunohistochemistry with unilateral microinjections (Fig. 5C,E,I) were compared using paired Student's t test or one-way ANOVA (Fig. 5G). Correlations and lineal regressions were calculated on GraphPad. All spine density, dh and immunohistochemistry data were statistically analyzed with nested ANOVA, and post hoc comparisons conducted using a Bonferroni post hoc. All data except behavior was obtained and quantified by individuals unaware of the treatment groups.
Results
Inhibiting FAK blocked cue-induced spine head enlargement
Twelve rats were trained to self-administer cocaine and underwent 12 d of extinction training. Eight control yoked saline rats were also trained (cocaine: two-way ANOVA repeated measures over time, time F(19,418) = 4.49, p < 0.001; active vs inactive F(1,22) = 13.45, p = 0.001; interaction F(19,418) = 1.44, p = 0.104; saline: two-way ANOVA repeated measures over time, time F(19,266) = 3.04, p < 0.001; active vs inactive F(1,14) = 0.064, p = 0.803; interaction F(19,266) = 0.78, p = 0.726; Fig. 1A). After self-administration, each rat was assigned to a vehicle (VEH) or FAKi (3 nmol) group, and balanced such that each group had consumed the same total amount of cocaine during self-administration (Student's t test(11) = 0.299, p = 0.77; Fig. 1B). This small molecule inhibitor prevents FAK phosphorylation at Tyr397 autophosphorylation site (Mitra et al., 2005; Golubovskaya et al., 2008), and the FAKi 3 nmol dose was based on the dose response curve established in our previous publication (Garcia-Keller et al., 2019) showing 3 nmol FAKi inhibited cued cocaine seeking without affecting sucrose-seeking or locomotor activity. Following extinction, rats were microinjected with either VEH or FAKi into NAcore 10 min before initiating cue-induced reinstatement of lever pressing. FAKi pretreatment abolished the capacity of cues to reinstate active lever pressing (active: two-way ANOVA repeated measures over time, EXT vs RST F(1,10) = 13.64, p = 0.004; VEH vs FAKi F(1,10) = 3.83, p = 0.079; interaction F(1,21) = 5.03, p = 0.048; Fig. 1C, left) without altering inactive lever pressing (inactive: two-way ANOVA repeated measures over time, EXT vs RST F(1,10) = 3.79, p = 0.080; VEH vs FAKi F(1,10) = 0.50, p = 0.493, interaction F(1,10) = 0.61, p = 0.454; Fig. 1C, right). Rat brains were removed 15 min after initiating cued reinstatement for the RST group, or after 10 d of extinction training for EXT and SAL groups, and MSNs in NAcore brain slices were injected with DiI to fill the cells and quantify dendritic spine morphology in NAcore MSNs (Fig. 1D). Inhibiting FAK phosphorylation also abolished the capacity of cues to increase spine head diameter (nested ANOVA revealed an overall interaction between groups, F(3,16) = 6.08, p = 0.006; Fig. 1E,F). In contrast, in yoked saline rats there was no cued reinstatement, and no change in spine morphology between VEH and FAKi-treated groups (Fig. 1E,F). Inhibition of FAK resulted in increased numbers of small diameter spines (≤0.2 µm in diameter; saline, two-way ANOVA with repeated measures over dh, VEH/FAKi F(1,34) = 0.01, p = 0.919; dh F(1,59) = 129.1, p < 0.001; interaction F(6,204) = 0.73, p = 0.628; cocaine: two-way ANOVA with repeated measures over dh, VEH/FAKi F(1,57) = 0.96, p = 0.33; dh F(6,342) = 176.3, p < 0.001; interaction F(6,342) = 4.15, p < 0.001; Fig. 1G left and right, respectively), a potential consequence of preventing cue-induced spine head enlargement. Further, we found that the intensity of active lever pressing was positively correlated with spine head diameter, supporting a possible causal association between cue-induced spine head enlargement and cocaine seeking (r2 = 0.39 and p = 0.03; Fig. 1H). Neither cocaine cues nor FAKi treatment altered dendritic spine density (nested ANOVA revealed no interaction between groups, F(3,16) = 0.65, p = 0.596; Fig. 1I).
Validation of immunoreactivity and antibodies
Rats were microinjected in NAcore with an AAV containing either a membrane integral transgene, AAV2-hSyn-ChR2-EYFP to label neurons (see Figs. 4, 5), or AAV1-ef1-dflox-mCherry to selectively transfect D1-MSN or D2-MSN dendritic segments and cell bodies (see Figs. 9, 10). Figure 2A,B shows a representative AAV2-hSyn-ChR2-EYFP or AAV1-ef1-dflox-mCherry expression in NAcore, and a ChR2-EYFP or mCherry-labeled neuron, respectively. A representative sequence of analysis of neuronal spine segments for p-cofilin is shown in Figure 2C.
Subsequently, antibodies were tested to validate that they only recognize the protein of interest, either FAK or cofilin, in their phosphorylated states. First, we show that the antibody p-FAK recognized the phosphorylation site at tyrosine 397 (mayor phosphorylation site; Chen et al., 1996). Microinjection of a FAKi (Fig. 3B) or vehicle (saline; Fig. 3A) into the NAcore in opposite hemispheres of a D1-cre naive rat that was previously bilaterally transfected with mCherry by AAV1-ef1-dflox-mCherry-ChR2. Decreased p-FAK immunoreactive puncta in dendrites of the NAcore microinjected with FAKi compared with vehicle. Second, Western blotting using drug naive NAcore tissue samples showed that the standard molecular weight band coincides with the molecular weight of the protein studied and that a single band was observed for p-FAK (Fig. 3C) and p-cofilin (Fig. 3D). Finally, standard immunohistochemistry controls where the primary and secondary antibody incubation were performed in reverse order prevented the appearance either p-FAK or p-cofilin puncta in NAcore tissue (data not shown).
Spine head enlargement is associated with increased levels of dendritic p-FAK and p-cofilin
Rats were trained to self-administer cocaine along with yoked saline controls [cocaine: two-way ANOVA repeated measures over time, time F(22,465) = 2.33, p < 0.001; active vs inactive F(1,22) = 11.92, p = 0.002; interaction F(22,465) = 2.36, p < 0.001; saline: two-way ANOVA repeated measures over time, time F(20,152) = 1.53, p = 0.079; active vs inactive F(1,8) = 2.48, p = 0.154; interaction F(20,152) = 0.96, p = 0.506 (Fig. 4A); cocaine: two-way ANOVA repeated measures time, time F(22,383) = 2.58, p < 0.001; active vs inactive F(1,18) = 10.11, p = 0.005; interaction F(22,383) = 2.75, p < 0.001; saline: two-way ANOVA repeated measures time, time F(20,116) = 1.31, p = 0.18; active vs inactive F(1,6) = 2.44, p = 0.168; interaction F(20,116) = 0.95, p = 0.523 (Fig. 4F)]. During implantation of an intravenous catheter to allow self-administration of cocaine, rats were microinjected with AAV2-hSyn-ChR2-EYFP to label dendrites for later morphologic analysis. After animals completed extinction training, reinstated cocaine seeking was induced for 15 min by restoring cocaine-paired cues [two-way ANOVA, EXT/RST F(1,10) = 13.00, p = 0.004; active vs inactive F(1,10) = 24.83, p < 0.001; interaction F(1,10) = 14.14, p = 0.004 (Fig. 4B); two-way ANOVA, EXT/RST F(1,8) = 6.95, p = 0.029; active vs inactive F(1,8) = 14.91, p = 0.004; interaction F(1,8) = 9.62, p = 0.015 (Fig. 4G)]. Brain slices were prepared of NAcore and one group of rats stained for FAK phosphorylated at Tyr397 (Fig. 4C–E), while the other group was stained for cofilin phosphorylated at Ser3 (Fig. 4H–J). We found accumulation of p-FAK immunoreactive puncta within NAcore dendrites after 15 min of cue-induced reinstatement, compared with levels of immunoreactive p-FAK in dendrites from yoked saline rats. Additionally, p-FAK was elevated in rats 24 h after the last extinction trial compared with yoked saline (nested ANOVA revealed an overall significant difference in p-FAK puncta expression within dendrites between all groups F(2,14) = 6.63, p = 0.009; Fig. 4D). Supporting a possible causal relationship, the amount of p-FAK immunoreactivity was positively correlated with the intensity of cue-induced active lever pressing (r2 = 0.725 and p = 0.032; Fig. 4E). Immunoreactivity corresponding to p-cofilin was also elevated by cocaine paired cues compared with saline rats (nested ANOVA revealed an overall significant difference in p-cofilin immunoreactivity within dendrites between all groups F(2,12) = 6.52, p = 0.012; Fig. 4I). However, unlike p-FAK, the extent of p-cofilin signal was not elevated after extinction training, nor was the amount of p-cofilin labeling correlated with cue-induced active lever pressing (Fig. 4J).
Spine head enlargement is regulated by signaling from MMP-9 to p-cofilin
MMP-9 and β3-integrin have been shown necessary for cued reinstatement and t-SP (Smith et al., 2014; Garcia-Keller et al., 2019). We next determined whether the increases in dendritic p-FAK and p-cofilin were in series the MMP-9 and β3-integrin signaling cascade (Fig. 5A). Rats were trained to self-administer cocaine and extinguished (Fig. 5B, two-way ANOVA repeated measures over time, time F(23,492) = 5.51, p < 0.001; active vs inactive F(1,24) = 16.54, p < 0.001; interaction F(23,492) = 4.00, p < 0.001; Fig. 5F, two-way ANOVA repeated measures over time, time F(23,643) = 7.55, p < 0.001; active vs inactive F(1,31) = 24.27, p < 0.001; interaction F(23,643) = 5.34, p < 0.001), and were then pretreated unilaterally into the NAcore with one of three treatments: (1) five daily microinfusions of β3-integrin morpholinos, previously shown to reduce β3-integrin levels in NAcore by >50% compared with scrambled morpholino control (Garcia-Keller et al., 2019); (2) acute microinjection of MMP-9i; or (3) acute microinjection of FAKi. Simultaneous with microinjecting inhibitor or morpholino, the corresponding control microinfusion was made into the contralateral hemisphere. NAcore tissue slices were prepared 15 min after cued reinstatement. The three treatment groups were balanced for cocaine intake (Fig. 5C,G). As expected, rats demonstrated reinstated active lever pressing when exposed to 15 min of cocaine paired cues compared with either extinction responding or inactive lever pressing [two-way ANOVA repeated measures EXT/RST F(1,24) = 24.89, p < 0.001; active vs inactive F(1,24) = 20.81, p < 0.001; interaction F(1,24) = 16.56, p < 0.001 (Fig. 5D); two-way ANOVA repeated measures EXT/RST F(1,31) = 26.13, p < 0.001; active vs inactive F(1,31) = 13.39, p < 0.001; interaction F(1,31) = 16.78, p < 0.001 (Fig. 5H)]. The capacity of cocaine cues to elevate dendritic p-FAK expression was abolished by inhibiting MMP-9 or by knocking down β3-integrin (Student's t test revealed MMP-9i: t(21) = 7.98, p < 0.001; β3 morpholino: t(17) = 3.61, p = 0.002; Fig. 5E). Further, cue-induced increases in dendritic p-cofilin immunoreactivity were reduced not only by inhibiting MMP-9 or knocking down β3-integrin, but also by inhibiting FAK (Student's t test revealed MMP-9i: t(14) = 3.67, p = 0.002; β3 morpholino: t(12) = 3.16, p = 0.008; FAKi: t(17) = 6.03, p < 0.001; Fig. 5I).
Together, these experiments support the outside-in signaling pathway outlined in Figure 5A from MMP-9 activation to p-cofilin. However, it is also possible that reverse, inside-out signaling occurred whereby p-FAK regulated MMP-9 activity (Fig. 5J; Luo et al., 2007). To test the inside-out hypothesis, we trained rats to self-administer cocaine followed by extinction training, yoked saline rats were used as control, and we employed in vivo zymography to quantify MMP-9 activity (cocaine: two-way ANOVA repeated measures over time, time F(23,226) = 1.87, p = 0.011; active vs inactive F(1,10) = 56.81, p < 0.001; interaction F(23,226) = 2.17, p = 0.002; saline: two-way ANOVA repeated measures over time, time F(22,120) = 3.48, p = 0.011; active vs inactive F(1,6) = 6.35, p = 0.04; interaction F(22,120) = 1.14, p = 0.312; Fig. 5K). Ten minutes before beginning a 15-min cued reinstatement session, rats were bilaterally microinjected into the NAcore with gelatin MMP-9 substrate mixed with FAKi in one hemisphere and with vehicle in the other hemisphere. Rats reinstated active lever pressing (two-way ANOVA repeated measures EXT/RST F(1,10) = 8.29, p = 0.016; active vs inactive F(1,10) = 10.83, p = 0.009; interaction F(1,10) = 8.15, p = 0.017; Fig. 5L) and MMP-9 activity was equivalent in both hemispheres, regardless of whether FAKi or vehicle was administered [two-way ANOVA with repeated measure between vehicle and FAKi (vehicle and FAKi were administered unilaterally into opposite hemispheres of the same rat) revealed no effect of vehicle/FAKi or interaction, but an effect of SAL/RST F(1,8) = 52.61, p < 0.001; Fig. 5M,N]. These data are consistent with a lack of inside-out signaling since changes in FAK activity did not alter MMP-9 activity.
Increases in p-FAK and p-cofilin show treatment and cell specificity
MSNs constitute ∼95% of the neurons in NAcore and are chemically coded as two subtypes that selectively express either D1 or D2 dopamine receptors (Lobo et al., 2006; Gerfen and Surmeier, 2011). D1-MSN and D2-MSN are generally characterized as serving distinct functions in regulating motivated behavior in mice (Lobo and Nestler, 2011; Smith et al., 2013). Especially pertinent to the data presented here, cue-induced cocaine seeking is promoted by activating D1-MSNs or inhibiting D2-MSNs (Heinsbroek et al., 2017). To determine whether the increase in p-FAK and p-cofilin immunoreactivity produced in MSNs during cue-induced reinstatement was specific for D1-MSN or D2-MSN, D1-Cre and D2-Cre rats were microinjected with AAV1-ef1-dflox-mCherry-hChR2 to selectively visualize the different MSNs dendritic segments. Before these analyses, we sought to validate the D1-Cre and D2-Cre transgenic rat model system in the NAcore. Figure 6A–C shows in situ hybridization for Cre recombinase mRNA, and D1 and D2 dopamine receptor mRNA selectively expressing Cre in either D1-MSN or D2-MSN in the NAcore of transgenic rats. As shown in Figure 6D, the overlapping percentage of Cre mRNA expression in D1-Cre and D2-Cre rats was in range for previously studied BAC transgenics animals (Sharpe et al., 2017; Bäck et al., 2019) with 85% overlap in D1-Cre and 82% in D2-Cre rats. Furthermore, in Figure 7A–D, we verify that the AAV1-ef1-dflox-mCherry-hChR2 we used to visualize D1 and D2 dendritic segments and cell bodies in Figures 9, 10 colocalized only with Cre+ cells (Fig. 7B,D, top right panel).
Figure 6.
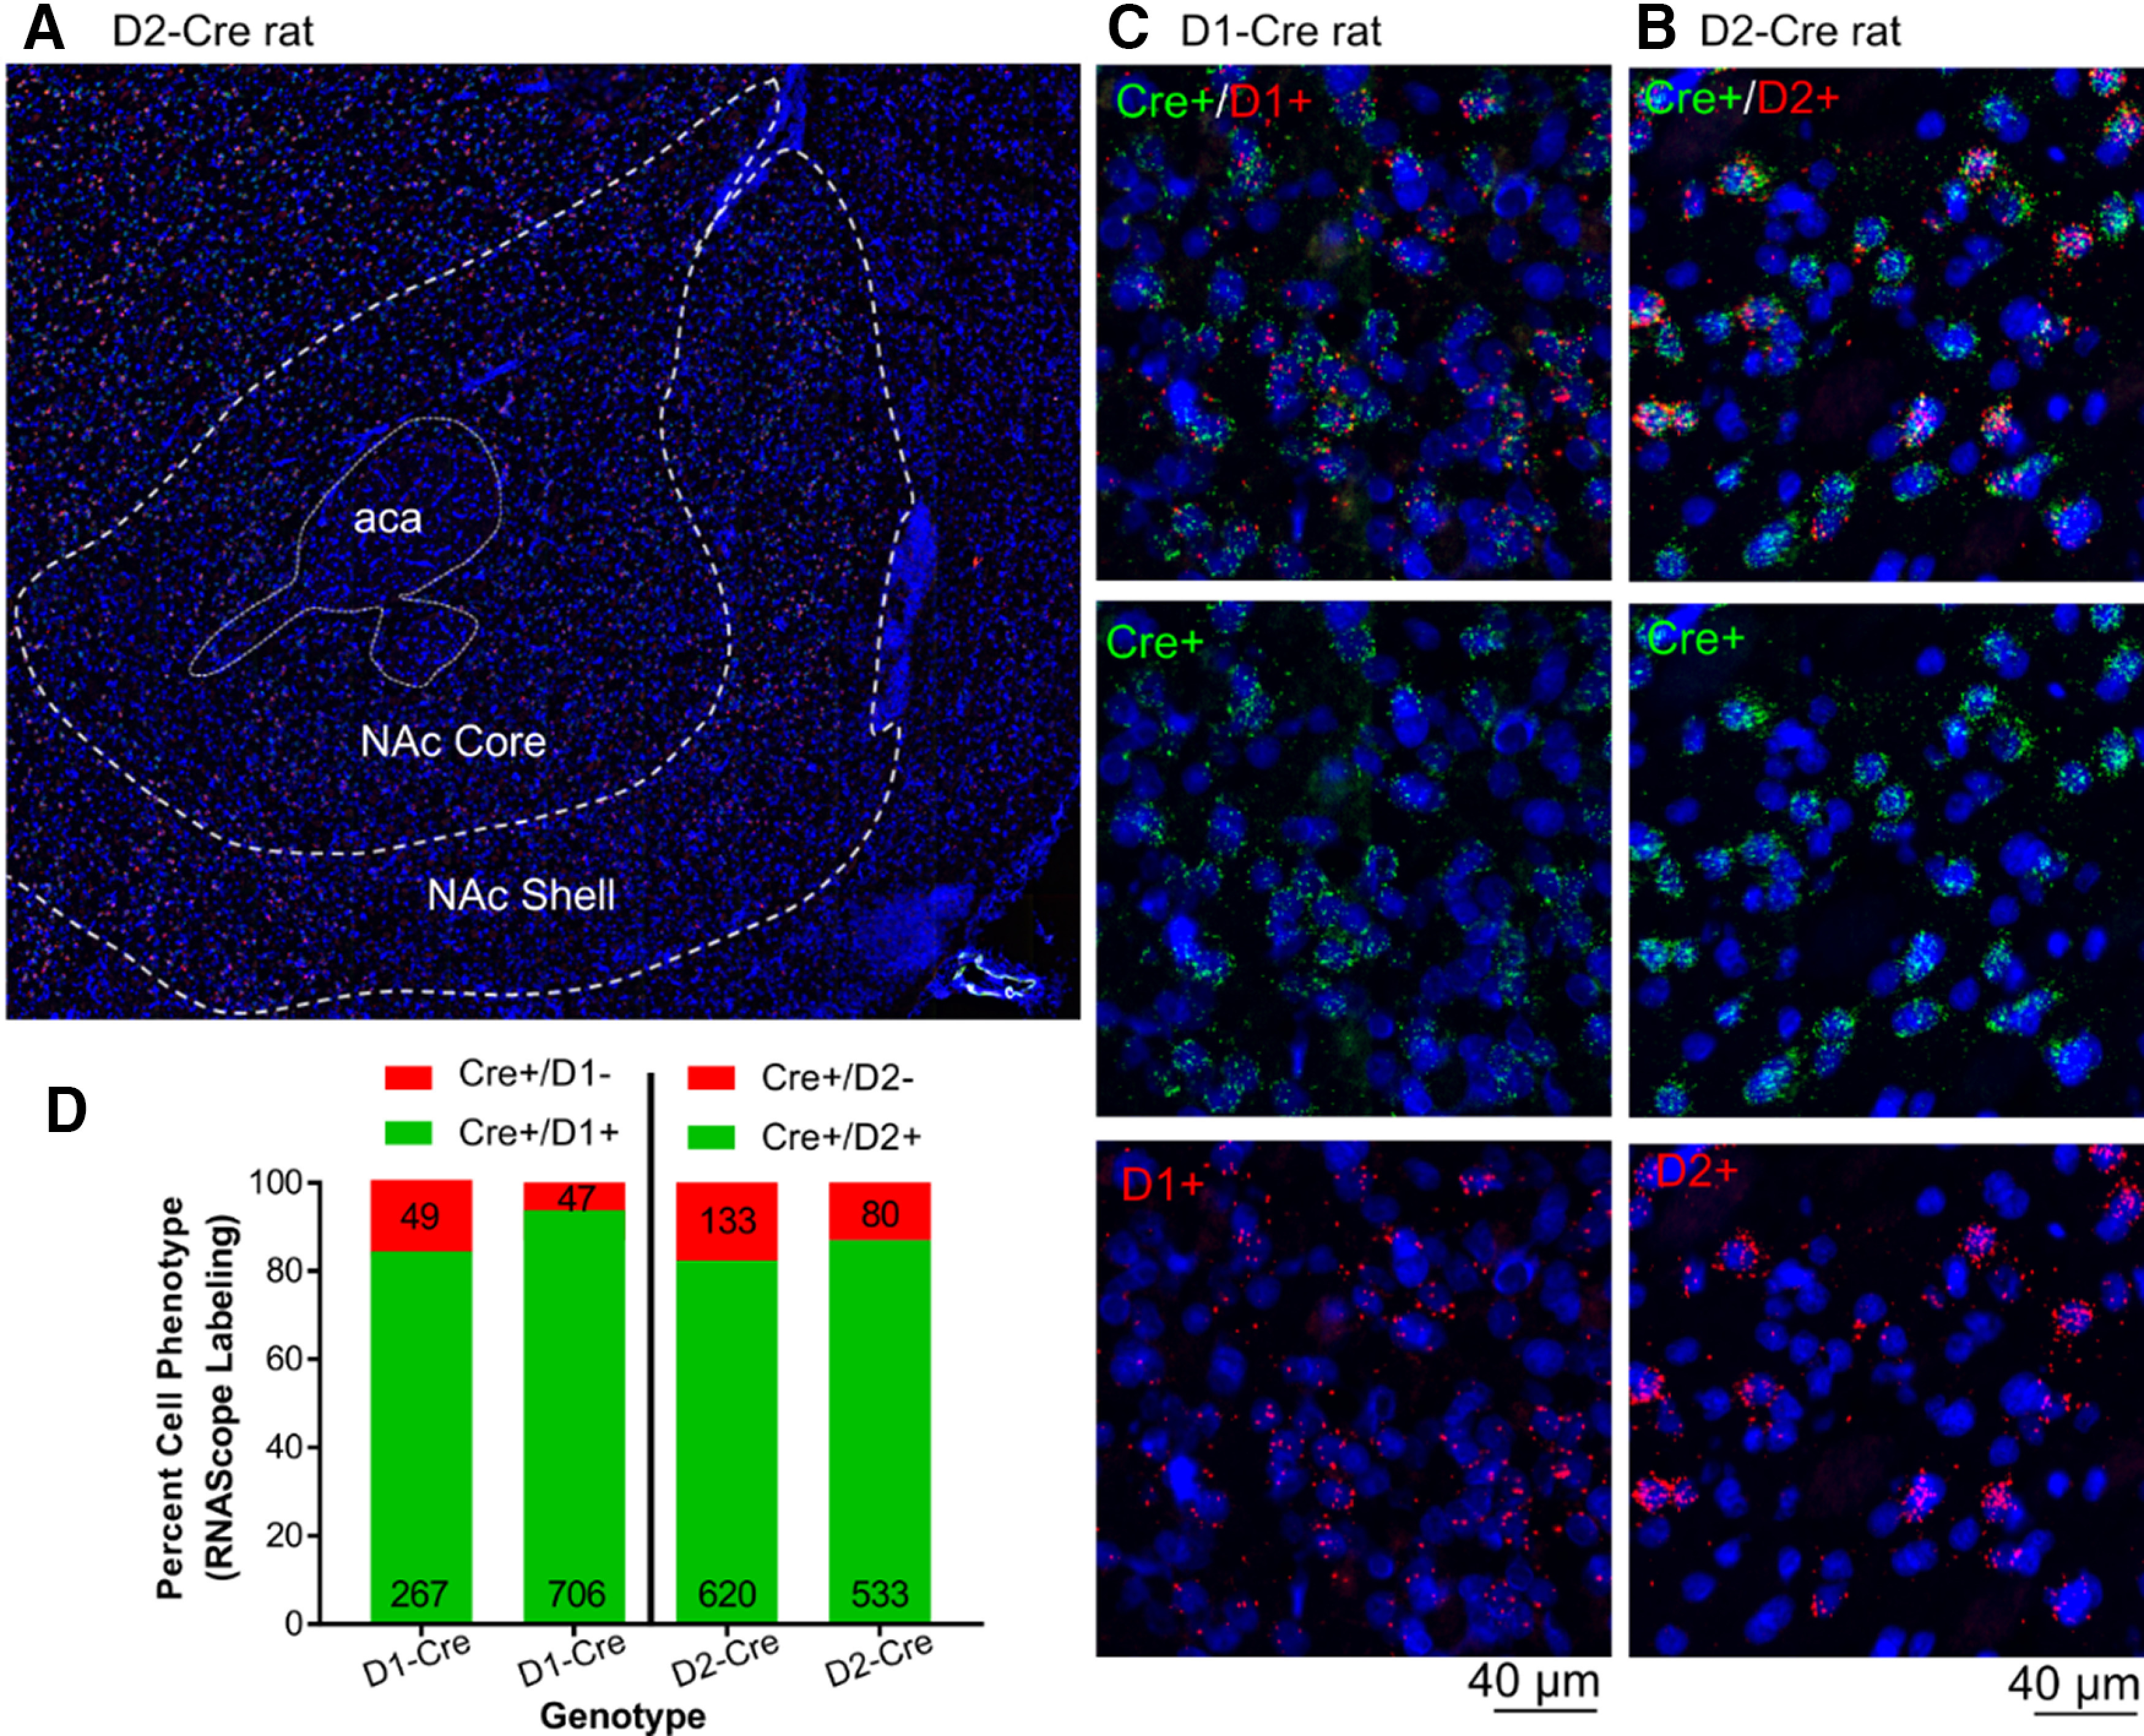
Cre recombinase mRNA expressed in the accumbens colocalizes with D1 and D2 mRNA in the D1-Cre and D2-Cre rats, respectively. A, Representative section of the NAcore from a D2-Cre rat. B, C, Example counting windows of 200 × 200 µm used to quantify cell expressing mRNA for Cre, D1 or D2 dopamine receptor. Scale bar = 40 µm. D, Quantification of two rats for each genotype.
Twenty-two D1-Cre and D2-Cre transgenic female and male rats were trained to self-administer cocaine and extinguished (cocaine: two-way ANOVA repeated measures over time, time F(23,873) = 8.72, p < 0.001; active vs inactive F(1,42) = 87.85, p < 0.001; interaction F(23,873) = 8.93, p < 0.001; Fig. 8A, left), and 10 yoked saline transgenic rats were used as control (saline: two-way ANOVA repeated measures over time, time F(23,376) = 3.48, p < 0.001; active vs inactive F(1,20) = 8.85, p = 0.008; interaction F(23,376) = 2.51, p < 0.001; Fig. 8A, right). There was no difference in total cocaine self-administered between D1-Cre and D2-Cre rats, nor was there a difference between males and females (D1 vs D2-Cre: Student's t test(20) = 0.33, p = 0.743; male vs female Student's t test(20) = 1.84, p = 0.08; Fig. 8B). When a portion of rats underwent 15 min of cocaine cue exposure, there was also no difference in reinstated active lever pressing between transgenic lines (D1-cre: two-way ANOVA repeated measures EXT/RST F(1,10) = 19.26, p = 0.001; active vs inactive F(1,10) = 9.96, p < 0.01; interaction F(1,10) = 14.15, p < 0.004; D2-cre: two-way ANOVA repeated measures EXT/RST F(1,10) = 9.82, p = 0.01; active vs inactive F(1,10) = 8.74, p = 0.014; interaction F(1,10) = 6.49, p = 0.029; Fig. 8C) or between sexes (female: two-way ANOVA repeated measures EXT/RST F(1,6) = 65.66, p < 0.001; active vs inactive F(1,6) = 29.31, p = 0.002; interaction F(1,6) = 46.93, p < 0.001; male: two-way ANOVA repeated measures EXT/RST F(1,14) = 9.09, p = 0.007; active vs inactive F(1,10) = 7.14, p = 0.018; interaction F(1,10) = 6.68, p = 0.022; Fig. 8D). Following extinction, 15-min reinstatement or yoked saline, tissue slices were made, and dendrites in transgenic rats were isolated and counter-stained for p-FAK or p-cofilin as shown in Figure 2B,C. p-FAK immunoreactivity in the total volume of dendritic segments from D1 and D2-MSNs was elevated after 15 min of cue-induced reinstatement compared with yoked saline or extinguished rats [nested ANOVA revealed an overall difference in p-FAK puncta in D1-MSN dendrites between all groups, F(2,12) = 17.08, p < 0.001 (Fig. 9A,B); nested ANOVA revealed an overall difference in p-FAK puncta in D2-MSN dendrites between all groups, F(2,14) = 6.8, p = 0.008 (Fig. 9D,E)]. Interestingly, p-FAK immunoreactivity in D1-MSNs, but not D2-MSNs exhibited a positive correlation with active lever pressing during drug seeking [r2 = 0.819 and p = 0.013 (Fig. 9C); r2 = 0.2 and p = 0.6 (Fig. 9F)]. The positive correlation between immunoreactivity in D1-MSNs and responding during drug seeking is consistent with studies indicating that activation of D1-MSNs is associated with cue or context-induced cocaine seeking (Calipari et al., 2016; Heinsbroek et al., 2017). Increased p-cofilin immunoreactivity was also observed in D1-MSN dendrites after cued reinstatement (nested ANOVA revealed an overall difference in p-cofilin puncta in D1-MSN dendrites between all groups F(2,12) = 7.95, p = 0.006; Fig. 9G,H). Unlike p-FAK, p-cofilin immunoreactivity was not elevated in D2-MSNs (nested ANOVA revealed no statistical difference across groups F(2,14) = 0.97, p = 0.40; Fig. 9I,J). In neither neuronal subtype was the level of p-cofilin correlated with cue-induced active lever pressing (D1-MSN, r2 = 0.2837; D2-MSN, r2 = 0.006).
Figure 8.
Behavior in D1 and D2-Cre rats shown in Figures 9, 10. A, Time course of active and inactive lever pressing for self-administration and extinction in all cocaine-treated and yoked saline D1-Cre and D2-Cre transgenic rats whose dendrite and soma quantification is shown in Figures 9, 10, respectively. B, Total cocaine infusions comparison between D1 versus D2-Cre cocaine-trained rats and male versus female cocaine-trained rats. C, Cue-induced reinstatement of cocaine-seeking increased active lever presses over 15 min before euthanizing in D1 and D2-cre rats. No statistical difference was observed across groups. D, Cue-induced reinstatement of cocaine-seeking increased active lever presses over 15 min before euthanizing in female and male. No statistical difference was observed across groups; #p < 0.05 compared RST to EXT; +p < 0.05 compared active to inactive lever presses using Bonferroni post hoc.
We also determined whether the increase in p-FAK and p-cofilin immunoreactivity in reinstated rats was confined to dendrites or also observed in the cell body. Using the same tissue from the previous experiment, we quantified the immunoreactivity in the soma of D1 versus D2-MSNs. Similar to dendrites, we observed increased p-FAK immunoreactivity in D1 and D2-MSN of the reinstated compared with saline rats. Also, augmented p-FAK immunoreactivity was observed in the D1-MSN soma of extinguished compared with saline rats [nested ANOVA revealed an overall difference in p-FAK puncta in D1-MSN dendrites between all groups, F(2,6) = 13.88, p < 0.01 (Fig. 10A,B); nested ANOVA revealed an overall difference in p-FAK puncta in D2-MSN dendrites between all groups, F(2,6) = 5.63, p < 0.05 (Fig. 10C,D)]. Elevated p-cofilin immunoreactivity was measured in D1-MSN soma of reinstated compared with extinguished and saline rats (nested ANOVA revealed an overall difference in p-cofilin puncta in D1-MSN dendrites between all groups, F(2,6) = 15.93, p < 0.01; Fig. 10E,F), and no changes were observed in D2-MSN soma between treatment groups (no significant difference observed in p-cofilin puncta expression in D2-MSN dendrites, F(2,6) = 2.87, p = 0.13; Fig. 10G,H)
Discussion
A principal component of addiction is the capacity of discrete cues, associated with drug use, to induce drug seeking after abstinence (Volkow et al., 2012). Cued drug seeking in animal models of relapse causes t-SP in NAcore MSNs that is correlated with the intensity of behavioral responding for the cue (Gipson et al., 2013; Smith et al., 2014), and is observed only with addictive drug-associated cues, not sucrose cues (Scofield et al., 2016). These findings underline the significance of understanding how signaling in the NAcore initiated by cues is translated into t-SP. Our previous work showed that activation of the extracellular enzyme MMP-9 is initiated by synaptic glutamate spillover during cued cocaine seeking and is necessary for t-SP (Smith et al., 2014, 2017). Here, we show that MMP-9 signaling through β3 integrin to increase p-FAK and p-cofilin is required for both cue-induced cocaine seeking and at least one measure of t-SP, cue-induced dendritic spine head enlargement. Moreover, we show that this signaling cascade through p-cofilin occurred only in D1-MSNs, consistent with cocaine cue-induced spine head enlargement occurring only in this MSN subtype (Bobadilla et al., 2017).
MMP-9 liberates ligands that bind β3 and signal through FAK and cofilin to regulate t-SP
MMP-9 is a gelatinase that degrades the ECM and produces extracellular tripeptide Arg-Gly-Asp motif (RGD) products that signal through integrins (Tsilibary et al., 2014). Heterodimeric integrins are mediators of MMP-catalyzed signaling in the ECM, and integrin binding induces both morphologic and electrophysiological plasticity at excitatory synapses (Park and Goda, 2016). The β3 integrin subunit exclusively pairs with the αV subunit (Webb et al., 2007), and activated MMP-9 catalytically creates RGD-containing peptide ligands that are highly selective for integrins containing this αV subunit (Wright and Harding, 2009). We recently demonstrated a critical role for β3- but not β1-integrin in mediating cue-induced reinstatement of cocaine-seeking and cue-induced t-SP (Garcia-Keller et al., 2019). We also found that FAK was necessary for both cued cocaine and heroin-seeking, and that activation of FAK is a crucial component of the intracellular signaling pathway induced by activation of β3-integrin via MMP-9 catalysis. Consistent with a key role for FAK in this signaling cascade, we reported that activating MMP gelatinases with tissue plasminogen activator potentiated cue-induced reinstatement, and this was prevented by β3-integrin knock-down and FAK inhibition. Finally, we previously demonstrated that integrin receptor stimulation with an RGD ligand potentiated cued cocaine seeking.
Here, we used genetic and small molecule inhibitors to link MMP-9 activity and β3-dependent activation of p-FAK with the cue-induced induction of spine head enlargement. A similar strategy was used to analyze and link activation of FAK with increased immunoreactivity for p-cofilin. Stabilizing dendritic spines relies in part on the ability of p-FAK to phosphorylate a Rho-associated kinase that phosphorylates LIMK-1, which phosphorylates cofilin at Ser3, and thereby inhibits actin binding and cofilin-mediated depolymerization of F-actin (Meng et al., 2003; Sarmiere and Bamburg, 2004; Shi et al., 2009), suggesting a functional association between activation of FAK, phosphorylation of cofilin, and spine head expansion. Spine structural plasticity, including spine enlargement associated with long-term potentiation, requires remodeling of actin scaffolds. Thus, accumulation of p-cofilin stabilizes the F-actin filaments to allow t-SP (Chen et al., 2007; Wang et al., 2008; Noguchi et al., 2016), similar to what has been described during drug cue-induced t-SP (Mulholland et al., 2016; Kruyer et al., 2019).
p-FAK and p-cofilin expression in D1-MSN versus D2-MSN
By using D1-Cre and D2-Cre rats, we were able to determine that the accumulation of p-FAK immunoreactivity following exposure to cocaine-associated cues occurred in both D1-MSN and D2-MSN. In contrast, the induction of p-cofilin immunoreactivity occurred selectively in D1-MSNs. Given the role of cofilin in regulating spine morphology (Ono, 2003) and that p-cofilin accumulation is a key regulator of spine head expansion (Noguchi et al., 2016), the selective induction of p-cofilin signal in D1-MSNs is consistent with the recent report showing increased spine head diameter produced during cue-induced cocaine seeking occurs in D1-MSNs, not D2-MSNs (Bobadilla et al., 2017). The differential induction of p-cofilin versus p-FAK raises interesting questions regarding the roles played by D1-MSN and D2-MSN in t-SP and reinstated cocaine seeking. Selective chemogenetic activation of D1-MSNs or inhibition of D2-MSNs in NAcore potentiates cue-induced cocaine reinstatement (Heinsbroek et al., 2017). While the role for D1-MSNs to promote cued drug seeking is consistent with t-SP in this cell type being mediated in part by elevated p-cofilin signal, the increase in p-FAK in both cell types is potentially confounding. However, it is possible that p-FAK is differentially signaling in each cell type. For example, cocaine cues induce and increase in the AMPA/NMDA ratio in D1-MSN and D2-MSN in mice that have undergone extinction training akin to the current protocol (Roberts-Wolfe et al., 2018), and increased AMPA/NMDA ratio by cocaine-paired cues requires signaling through integrins (Garcia-Keller et al., 2019). Thus, it is possible that the cue-induced increase in pFAK in both cell types may mediate the increase in AMPA/NMDA ratio, although this linkage remains to be experimentally evaluated.
Conclusions
We found that the phosphorylation of FAK was a required signaling event for cocaine cue-mediated dendritic spine enlargement during t-SP and relapse. While p-FAK was induced in both D1 and D2-MSNs, the induction of p-cofilin immunoreactivity only occurred in D1-MSNs. Since only D1-MSNs show increased spine head diameter during cue-induced t-SP, and cofilin phosphorylation regulates actin cycling and filament elongation, it seems likely that the t-SP associated changes in spine morphology produced selectively in D1-MSNs by cocaine cue presentation result from p-FAK signaling through cofilin. Drug associated cues can precipitate relapse. We have identified necessary components of a signaling cascade that mediates cue-induced relapse and structural plasticity, which provides new potential targets for pharmacological discovery to treat addiction.
Footnotes
This work was supported by National Institutes of Health (NIH) Grants DA003906, DA012513, and DA046373 (to P.W.K.) and K99DA047426-01A1 (to C.G.-K.); the National Science Foundation Grant OIA-1539034 (to P.W.K.); the Veteran Affairs Grant BX004727 (to P.W.K.); and the Intramural Research Programs at the National Institute on Drug Abuse and the National Institute of Mental Health. The Carl Zeiss LSM 880 confocal microscope was acquired through the NIH/OD Grant 1S10OD021532. We thank Eric Dereschewitz and Ahlem Assali for advice and technical assistance; the National Institute of Drug Abuse (NIDA) Drug Supply Program for providing cocaine hydrochloride; and Yajun Zhang, Heather Baldwin, Julie Necarsulmer, and Pyry Koivula of the NIDA Optogenetics and Transgenic Technology Core for their technical assistance with the production of the D1 and D2-Cre rats.
The authors declare no competing financial interests.
References
- Babayan AH, Kramar EA, Barrett RM, Jafari M, Haettig J, Chen LY, Rex CS, Lauterborn JC, Wood MA, Gall CM, Lynch G (2012) Integrin dynamics produce a delayed stage of long-term potentiation and memory consolidation. J Neurosci 32:12854–12861. 10.1523/JNEUROSCI.2024-12.2012 [DOI] [PMC free article] [PubMed] [Google Scholar]
- Bäck S, Necarsulmer J, Whitaker LR, Coke LM, Koivula P, Heathward EJ, Fortuno LV, Zhang Y, Yeh CG, Baldwin HA, Spencer MD, Mejias-Aponte CA, Pickel J, Hoffman AF, Spivak CE, Lupica CR, Underhill SM, Amara SG, Domanskyi A, Anttila JE, et al. (2019) Neuron-specific genome modification in the adult rat brain using CRISPR-Cas9 transgenic rats. Neuron 102:105–119.8. 10.1016/j.neuron.2019.01.035 [DOI] [PMC free article] [PubMed] [Google Scholar]
- Belin-Rauscent A, Fouyssac M, Bonci A, Belin D (2016) How preclinical models evolved to resemble the diagnostic criteria of drug addiction. Biol Psychiatry 79:39–46. 10.1016/j.biopsych.2015.01.004 [DOI] [PMC free article] [PubMed] [Google Scholar]
- Bobadilla AC, Heinsbroek JA, Gipson CD, Griffin WC, Fowler CD, Kenny PJ, Kalivas PW (2017) Corticostriatal plasticity, neuronal ensembles and regulation of drug-seeking behavior. Prog Brain Res 235:93–112. [DOI] [PMC free article] [PubMed] [Google Scholar]
- Bozdagi O, Nagy V, Kwei KT, Huntley GW (2007) In vivo roles for matrix metalloproteinase-9 in mature hippocampal synaptic physiology and plasticity. J Neurophysiol 98:334–344. 10.1152/jn.00202.2007 [DOI] [PMC free article] [PubMed] [Google Scholar]
- Calipari ES, Bagot RC, Purushothaman I, Davidson TJ, Yorgason JT, Pena CJ, Walker DM, Pirpinias ST, Guise KG, Ramakrishnan C, Deisseroth K, Nestler EJ (2016) In vivo imaging identifies temporal signature of D1 and D2 medium spiny neurons in cocaine reward. Proc Natl Acad Sci USA 113:2726–2731. [DOI] [PMC free article] [PubMed] [Google Scholar]
- Chen HC, Appeddu PA, Isoda H, Guan JL (1996) Phosphorylation of tyrosine 397 in focal adhesion kinase is required for binding phosphatidylinositol 3-kinase. J Biol Chem 271:26329–26334. 10.1074/jbc.271.42.26329 [DOI] [PubMed] [Google Scholar]
- Chen LY, Rex CS, Casale MS, Gall CM, Lynch G (2007) Changes in synaptic morphology accompany actin signaling during LTP. J Neurosci 27:5363–5372. 10.1523/JNEUROSCI.0164-07.2007 [DOI] [PMC free article] [PubMed] [Google Scholar]
- Cingolani LA, Thalhammer A, Yu LM, Catalano M, Ramos T, Colicos MA, Goda Y (2008) Activity-dependent regulation of synaptic AMPA receptor composition and abundance by beta3 integrins. Neuron 58:749–762. 10.1016/j.neuron.2008.04.011 [DOI] [PMC free article] [PubMed] [Google Scholar]
- Dombert B, Balk S, Luningschror P, Moradi M, Sivadasan R, Saal-Bauernschubert L, Jablonka S (2017) BDNF/trkB induction of calcium transients through Cav2.2 calcium channels in motoneurons corresponds to F-actin assembly and growth cone formation on β2-chain laminin (221). Front Mol Neurosci 10:346. [DOI] [PMC free article] [PubMed] [Google Scholar]
- Dong Y, Taylor JR, Wolf ME, Shaham Y (2017) Circuit and synaptic plasticity mechanisms of drug relapse. J Neurosci 37:10867–10876. 10.1523/JNEUROSCI.1821-17.2017 [DOI] [PMC free article] [PubMed] [Google Scholar]
- Epstein DH, Preston KL, Stewart J, Shaham Y (2006) Toward a model of drug relapse: an assessment of the validity of the reinstatement procedure. Psychopharmacology (Berl) 189:1–16. 10.1007/s00213-006-0529-6 [DOI] [PMC free article] [PubMed] [Google Scholar]
- Garcia-Keller C, Neuhofer D, Bobadilla AC, Spencer S, Chioma VC, Monforton C, Kalivas PW (2019) Extracellular matrix signaling through β3 integrin mediates cocaine cue-induced transient synaptic plasticity and relapse. Biol Psychiatry 86:377–387. 10.1016/j.biopsych.2019.03.982 [DOI] [PMC free article] [PubMed] [Google Scholar]
- Gerfen CR, Surmeier DJ (2011) Modulation of striatal projection systems by dopamine. Annu Rev Neurosci 34:441–466. 10.1146/annurev-neuro-061010-113641 [DOI] [PMC free article] [PubMed] [Google Scholar]
- Gipson CD, Kupchik YM, Shen H, Reissner KJ, Thomas CA, Kalivas PW (2013) Relapse induced by cues predicting cocaine depends on rapid, transient synaptic potentiation. Neuron 77:867–872. 10.1016/j.neuron.2013.01.005 [DOI] [PMC free article] [PubMed] [Google Scholar]
- Goldstein RZ, Volkow ND (2011) Dysfunction of the prefrontal cortex in addiction: neuroimaging findings and clinical implications. Nat Rev Neurosci 12:652–669. 10.1038/nrn3119 [DOI] [PMC free article] [PubMed] [Google Scholar]
- Golubovskaya VM, Nyberg C, Zheng M, Kweh F, Magis A, Ostrov D, Cance WG (2008) A small molecule inhibitor, 1,2,4,5-benzenetetraamine tetrahydrochloride, targeting the y397 site of focal adhesion kinase decreases tumor growth. J Med Chem 51:7405–7416. 10.1021/jm800483v [DOI] [PMC free article] [PubMed] [Google Scholar]
- Heinsbroek JA, Neuhofer DN, Griffin WC 3rd, Siegel GS, Bobadilla AC, Kupchik YM, Kalivas PW (2017) Loss of plasticity in the D2-accumbens pallidal pathway promotes cocaine seeking. J Neurosci 37:757–767. 10.1523/JNEUROSCI.2659-16.2017 [DOI] [PMC free article] [PubMed] [Google Scholar]
- Kalivas BC, Kalivas PW (2016) Corticostriatal circuitry in regulating diseases characterized by intrusive thinking. Dialogues Clin Neurosci 18:65–76. [DOI] [PMC free article] [PubMed] [Google Scholar]
- Kim JE, Ryu HJ, Kim MJ, Kang TC (2014) LIM kinase-2 induces programmed necrotic neuronal death via dysfunction of DRP1-mediated mitochondrial fission. Cell Death Differ 21:1036–1049. 10.1038/cdd.2014.17 [DOI] [PMC free article] [PubMed] [Google Scholar]
- Knackstedt LA, Melendez RI, Kalivas PW (2010) Ceftriaxone restores glutamate homeostasis and prevents relapse to cocaine seeking. Biol Psychiatry 67:81–84. 10.1016/j.biopsych.2009.07.018 [DOI] [PMC free article] [PubMed] [Google Scholar]
- Kruyer AMD, Scofield D, Wood KJ, Reissner PW Kalivas (2019) Heroin cue-evoked astrocyte structural plasticity at nucleus accumbens synapses reduces heroin seeking. Biol Psychiatry 86:811–819. [DOI] [PMC free article] [PubMed] [Google Scholar]
- Kupai K, Szucs G, Cseh S, Hajdu I, Csonka C, Csont T, Ferdinandy P (2010) Matrix metalloproteinase activity assays: importance of zymography. J Pharmacol Toxicol Methods 61:205–209. 10.1016/j.vascn.2010.02.011 [DOI] [PubMed] [Google Scholar]
- LaLumiere RT, Kalivas PW (2008) Glutamate release in the nucleus accumbens core is necessary for heroin seeking. J Neurosci 28:3170–3177. 10.1523/JNEUROSCI.5129-07.2008 [DOI] [PMC free article] [PubMed] [Google Scholar]
- Li Q, Li W, Wang H, Wang Y, Zhang Y, Zhu J, Zheng Y, Zhang D, Wang L, Li Y, Yan X, Chang H, Fan M, Li Z, Tian J, Gold MS, Wang W, Liu Y (2015) Predicting subsequent relapse by drug-related cue-induced brain activation in heroin addiction: an event-related functional magnetic resonance imaging study. Addict Biol 20:968–978. 10.1111/adb.12182 [DOI] [PubMed] [Google Scholar]
- Lobo MK, Nestler EJ (2011) The striatal balancing act in drug addiction: distinct roles of direct and indirect pathway medium spiny neurons. Front Neuroanat 5:41. 10.3389/fnana.2011.00041 [DOI] [PMC free article] [PubMed] [Google Scholar]
- Lobo MK, Karsten SL, Gray M, Geschwind DH, Yang XW (2006) FACS-array profiling of striatal projection neuron subtypes in juvenile and adult mouse brains. Nat Neurosci 9:443–452. 10.1038/nn1654 [DOI] [PubMed] [Google Scholar]
- Luo BH, Carman CV, Springer TA (2007) Structural basis of integrin regulation and signaling. Annu Rev Immunol 25:619–647. 10.1146/annurev.immunol.25.022106.141618 [DOI] [PMC free article] [PubMed] [Google Scholar]
- Lüscher C, Malenka RC (2011) Drug-evoked synaptic plasticity in addiction: from molecular changes to circuit remodeling. Neuron 69:650–663. 10.1016/j.neuron.2011.01.017 [DOI] [PMC free article] [PubMed] [Google Scholar]
- Meng Y, Zhang Y, Tregoubov V, Falls DL, Jia Z (2003) Regulation of spine morphology and synaptic function by LIMK and the actin cytoskeleton. Rev Neurosci 14:233–240. [DOI] [PubMed] [Google Scholar]
- Mitra SK, Hanson DA, Schlaepfer DD (2005) Focal adhesion kinase: in command and control of cell motility. Nat Rev Mol Cell Biol 6:56–68. 10.1038/nrm1549 [DOI] [PubMed] [Google Scholar]
- Mulholland PJ, Chandler LJ, Kalivas PW (2016) Signals from the fourth dimension regulate drug relapse. Trends Neurosci 39:472–485. 10.1016/j.tins.2016.04.007 [DOI] [PMC free article] [PubMed] [Google Scholar]
- Noguchi J, Hayama T, Watanabe S, Ucar H, Yagishita S, Takahashi N, Kasai H (2016) State-dependent diffusion of actin-depolymerizing factor/cofilin underlies the enlargement and shrinkage of dendritic spines. Sci Rep 6:32897. 10.1038/srep32897 [DOI] [PMC free article] [PubMed] [Google Scholar]
- Ono S. (2003) Regulation of actin filament dynamics by actin depolymerizing factor/cofilin and actin-interacting protein 1: new blades for twisted filaments. Biochemistry 42:13363–13370. 10.1021/bi034600x [DOI] [PubMed] [Google Scholar]
- Pardo-Garcia TR, Garcia-Keller C, Penaloza T, Richie CT, Pickel J, Hope BT, Harvey BK, Kalivas PW, Heinsbroek JA (2019) Ventral pallidum is the primary target for accumbens D1 projections driving cocaine seeking. J Neurosci 39:2041–2051. 10.1523/JNEUROSCI.2822-18.2018 [DOI] [PMC free article] [PubMed] [Google Scholar]
- Park YK, Goda Y (2016) Integrins in synapse regulation. Nat Rev Neurosci 17:745–756. 10.1038/nrn.2016.138 [DOI] [PubMed] [Google Scholar]
- Pucciarelli D, Lengger N, Takáčová M, Csaderova L, Bartosova M, Breiteneder H, Pastorekova S, Hafner C (2016) Hypoxia increases the heterogeneity of melanoma cell populations and affects the response to vemurafenib. Mol Med Rep 13:3281–3288. 10.3892/mmr.2016.4888 [DOI] [PubMed] [Google Scholar]
- Roberts-Wolfe D, Clara Bobadilla A, Heinsbroek J, Neuhofer D, Kalivas PW (2018) Drug refraining and seeking potentiate synapses on distinct populations of accumbens medium spiny neurons. J Neurosci 38:7100–7107. [DOI] [PMC free article] [PubMed] [Google Scholar]
- Sarmiere PD, Bamburg JR (2004) Regulation of the neuronal actin cytoskeleton by ADF/cofilin. J Neurobiol 58:103–117. 10.1002/neu.10267 [DOI] [PubMed] [Google Scholar]
- Scofield MD, Heinsbroek JA, Gipson CD, Kupchik YM, Spencer S, Smith AC, Roberts-Wolfe D, Kalivas PW (2016) The nucleus accumbens: mechanisms of addiction across drug classes reflect the importance of glutamate homeostasis. Pharmacol Rev 68:816–871. 10.1124/pr.116.012484 [DOI] [PMC free article] [PubMed] [Google Scholar]
- Sharpe MJ, Marchant NJ, Whitaker LR, Richie CT, Zhang YJ, Campbell EJ, Koivula PP, Necarsulmer JC, Mejias-Aponte C, Morales M, Pickel J, Smith JC, Niv Y, Shaham Y, Harvey BK, Schoenbaum G (2017) Lateral hypothalamic GABAergic neurons encode reward predictions that are relayed to the ventral tegmental area to regulate learning. Curr Biol 27:2089–2100.e5. 10.1016/j.cub.2017.06.024 [DOI] [PMC free article] [PubMed] [Google Scholar]
- Shen H, Sesack SR, Toda S, Kalivas PW (2008) Automated quantification of dendritic spine density and spine head diameter in medium spiny neurons of the nucleus accumbens. Brain Struct Funct 213:149–158. 10.1007/s00429-008-0184-2 [DOI] [PubMed] [Google Scholar]
- Shi Y, Ethell IM (2006) Integrins control dendritic spine plasticity in hippocampal neurons through NMDA receptor and Ca2+/calmodulin-dependent protein kinase II-mediated actin reorganization. J Neurosci 26:1813–1822. 10.1523/JNEUROSCI.4091-05.2006 [DOI] [PMC free article] [PubMed] [Google Scholar]
- Shi Y, Pontrello CG, DeFea KA, Reichardt LF, Ethell IM (2009) Focal adhesion kinase acts downstream of EphB receptors to maintain mature dendritic spines by regulating cofilin activity. J Neurosci 29:8129–8142. 10.1523/JNEUROSCI.4681-08.2009 [DOI] [PMC free article] [PubMed] [Google Scholar]
- Smith AC, Kupchik YM, Scofield MD, Gipson CD, Wiggins A, Thomas CA, Kalivas PW (2014) Synaptic plasticity mediating cocaine relapse requires matrix metalloproteinases. Nat Neurosci 17:1655–1657. 10.1038/nn.3846 [DOI] [PMC free article] [PubMed] [Google Scholar]
- Smith ACW, Scofield MD, Heinsbroek JA, Gipson CD, Neuhofer D, Roberts-Wolfe DJ, Spencer S, Garcia-Keller C, Stankeviciute NM, Smith RJ, Allen NP, Lorang MR, Griffin WC 3rd, Boger HA, Kalivas PW (2017) Accumbens nNOS interneurons regulate cocaine relapse. J Neurosci 37:742–756. 10.1523/JNEUROSCI.2673-16.2017 [DOI] [PMC free article] [PubMed] [Google Scholar]
- Smith RJ, Lobo MK, Spencer S, Kalivas PW (2013) Cocaine-induced adaptations in D1 and D2 accumbens projection neurons (a dichotomy not necessarily synonymous with direct and indirect pathways). Curr Opin Neurobiol 23:546–552. 10.1016/j.conb.2013.01.026 [DOI] [PMC free article] [PubMed] [Google Scholar]
- Toda S, Shen HW, Peters J, Cagle S, Kalivas PW (2006) Cocaine increases actin cycling: effects in the reinstatement model of drug seeking. J Neurosci 26:1579–1587. 10.1523/JNEUROSCI.4132-05.2006 [DOI] [PMC free article] [PubMed] [Google Scholar]
- Tsilibary E, Tzinia A, Radenovic L, Stamenkovic V, Lebitko T, Mucha M, Pawlak R, Frischknecht R, Kaczmarek L (2014) Neural ECM proteases in learning and synaptic plasticity. Prog Brain Res 214:135–157. [DOI] [PubMed] [Google Scholar]
- Volkow ND, Wang GJ, Fowler JS, Tomasi D (2012) Addiction circuitry in the human brain. Annu Rev Pharmacol Toxicol 52:321–336. 10.1146/annurev-pharmtox-010611-134625 [DOI] [PMC free article] [PubMed] [Google Scholar]
- Wang XB, Bozdagi O, Nikitczuk JS, Zhai ZW, Zhou Q, Huntley GW (2008) Extracellular proteolysis by matrix metalloproteinase-9 drives dendritic spine enlargement and long-term potentiation coordinately. Proc Natl Acad Sci USA 105:19520–19525. 10.1073/pnas.0807248105 [DOI] [PMC free article] [PubMed] [Google Scholar]
- Warming S, Costantino N, Court DL, Jenkins NA, Copeland NG (2005) Simple and highly efficient BAC recombineering using galK selection. Nucleic Acids Res 33:e36 10.1093/nar/gni035 [DOI] [PMC free article] [PubMed] [Google Scholar]
- Webb DJ, Zhang H, Majumdar D, Horwitz AF (2007) alpha5 integrin signaling regulates the formation of spines and synapses in hippocampal neurons. J Biol Chem 282:6929–6935. 10.1074/jbc.M610981200 [DOI] [PMC free article] [PubMed] [Google Scholar]
- Wehrle-Haller B, Bastmeyer M (2014) Intracellular signaling and perception of neuronal scaffold through integrins and their adapter proteins. Prog Brain Res 214:443–460. [DOI] [PubMed] [Google Scholar]
- Wright JW, Harding JW (2009) Contributions of matrix metalloproteinases to neural plasticity, habituation, associative learning and drug addiction. Neural Plast 2009:579382. 10.1155/2009/579382 [DOI] [PMC free article] [PubMed] [Google Scholar]