

Natural conversation is multisensory: when we can see the speaker's face, visual speech cues improve our comprehension. The neuronal mechanisms underlying this phenomenon remain unclear. The two main alternatives are visually mediated phase modulation of neuronal oscillations (excitability fluctuations) in auditory neurons and visual input-evoked responses in auditory neurons.
Keywords: audiovisual speech, broadband high-frequency activity, crossmodal stimuli, intracranial electroencephalography, neuronal oscillations, phase–amplitude coupling
Abstract
Natural conversation is multisensory: when we can see the speaker's face, visual speech cues improve our comprehension. The neuronal mechanisms underlying this phenomenon remain unclear. The two main alternatives are visually mediated phase modulation of neuronal oscillations (excitability fluctuations) in auditory neurons and visual input-evoked responses in auditory neurons. Investigating this question using naturalistic audiovisual speech with intracranial recordings in humans of both sexes, we find evidence for both mechanisms. Remarkably, auditory cortical neurons track the temporal dynamics of purely visual speech using the phase of their slow oscillations and phase-related modulations in broadband high-frequency activity. Consistent with known perceptual enhancement effects, the visual phase reset amplifies the cortical representation of concomitant auditory speech. In contrast to this, and in line with earlier reports, visual input reduces the amplitude of evoked responses to concomitant auditory input. We interpret the combination of improved phase tracking and reduced response amplitude as evidence for more efficient and reliable stimulus processing in the presence of congruent auditory and visual speech inputs.
SIGNIFICANCE STATEMENT Watching the speaker can facilitate our understanding of what is being said. The mechanisms responsible for this influence of visual cues on the processing of speech remain incompletely understood. We studied these mechanisms by recording the electrical activity of the human brain through electrodes implanted surgically inside the brain. We found that visual inputs can operate by directly activating auditory cortical areas, and also indirectly by modulating the strength of cortical responses to auditory input. Our results help to understand the mechanisms by which the brain merges auditory and visual speech into a unitary perception.
Introduction
Viewing one's interlocutor significantly improves intelligibility under noisy conditions (Sumby and Pollack, 1954). Moreover, mismatched auditory (A) and visual (V) speech cues can create striking illusions (McGurk and Macdonald, 1976). Despite the ubiquity and power of visual influences on speech perception, the underlying neuronal mechanisms remain unclear. The cerebral processing of auditory and visual speech converges in multisensory cortical areas, especially the superior temporal cortex (Miller and D'Esposito, 2005; Beauchamp et al., 2010). Crossmodal influences are also found in cortical areas that are traditionally considered to be unisensory; in particular, visual speech modulates the activity of auditory cortex (Calvert et al., 1997; Besle et al., 2008; Kayser et al., 2008).
The articulatory movements that constitute visual speech strongly correlate with the corresponding speech sounds (Chandrasekaran et al., 2009; Schwartz and Savariaux, 2014) and predict them to some extent (Arnal et al., 2009), suggesting that visual speech might serve as an alerting cue to auditory cortex, preparing the neural circuits to process the incoming speech sounds more efficiently. Earlier, we raised the hypothesis that this preparation occurs in part through a resetting of the phase of neuronal oscillations in auditory cortex: through this phase reset, visual speech cues influence the temporal pattern of neuronal excitability fluctuations in auditory cortex (Schroeder et al., 2008). This hypothesis is formulated by considering four lines of evidence. First, auditory speech has predictable rhythms, with syllables arriving at a relatively rapid rate (4–7 Hz) nested within the slower rates (1–3 Hz) of phrase and word production. These rhythmic features of speech are critical for it to be intelligible (Shannon et al., 1995; Greenberg et al., 2003). Second, auditory cortex synchronizes its oscillations to the rhythm of heard speech, and the magnitude of this synchronization correlates with the intelligibility of speech (Ahissar et al., 2001; Luo and Poeppel, 2007; Ding and Simon, 2014; Vander Ghinst et al., 2016). Third, neuronal oscillations correspond to momentary changes in neuronal excitability, so that, independent of modality, the response of sensory cortex depends on the phase of its oscillations on stimulus arrival (Lakatos et al., 2008). Fourth, even at the level of primary sensory cortex, oscillations can be phase reset by stimuli from other modalities, and this crossmodal reset influences the processing of incoming stimuli from the preferred modality (Lakatos et al., 2007; Kayser et al., 2008).
Human electroencephalographic (EEG) and magnetoencephalographic (MEG) studies of cerebral responses to continuous, naturalistic audiovisual (AV) speech have established that oscillations are influenced by the visual as well as the auditory component of speech (Luo et al., 2010; Crosse et al., 2015, 2016; O'Sullivan et al., 2016; Park et al., 2016, 2018; Giordano et al., 2017). While these observations are compatible with the phase reset hypothesis, they do not rule out the possibility that the apparent phase alignment simply reflects a succession of crossmodal sensory-evoked responses; in fact, some favor this interpretation (Crosse et al., 2015, 2016). Our perspective is that phase reset and evoked response mechanisms ordinarily operate in complementary fashion (Schroeder and Lakatos, 2009). Thus, in the present context, we expect that both will mediate visual influences on auditory speech processing. To dissect these influences, one must be able to resolve the local activity of a given cortical area well enough to dissociate a momentary increase in phase alignment from any coincident increase in oscillatory power (Makeig et al., 2004; Shah et al., 2004). No noninvasive neurophysiological study to date meets that standard, but invasive techniques are better suited for that level of granularity.
Here, we used intracranial EEG (iEEG) to probe the mechanistic basis for the effect of visual speech on auditory processing. We find that (1) unisensory visual speech resets the phase of low-frequency neuronal oscillations in auditory cortex; and (2), consistent with known perceptual effects, the visual input-mediated phase reset amplifies cortical responses to concomitant auditory input. These results strongly support crossmodal phase reset as one of the neuronal mechanisms underlying multisensory enhancement in audiovisual speech processing. We also observe a complementary effect, visual input-evoked reduction of response amplitude to concomitant auditory input. Together with the improved phase tracking, we interpret this as evidence for more efficient and reliable stimulus processing in the presence of congruent audiovisual speech inputs (Kayser et al., 2010).
Materials and Methods
Experimental design
Participants
Nine patients (5 women; age range, 21–52 years) with drug-resistant focal epilepsy who were undergoing video-iEEG monitoring at North Shore University Hospital (Manhasset, NY) participated in the experiments. All participants were fluent English speakers. The participants provided written informed consent under the guidelines of the Declaration of Helsinki, as monitored by the Feinstein Institutes for Medical Research institutional review board.
Stimuli and task
Stimuli (Zion Golumbic et al., 2013b) were presented at the bedside using a laptop computer and Presentation software (version 17.2; Neurobehavioral Systems; RRID:SCR_002521; http://www.neurobs.com). Trials started with a 1 s baseline period consisting of a fixation cross on a black screen. The participants then viewed or heard video clips (7–12 s) of a speaker telling a short story. The clips were cut off to leave out the last word. A written word was then presented on the screen, and the participants had to select whether that word ended the story appropriately or not. There was no time limit for participants to indicate their answer; reaction time was not monitored. There were two speakers (one woman) telling four stories each (eight distinct stories); each story was presented once with one of eight different ending words (four appropriate), for a total of 64 trials. These were presented once in each of three sensory modalities: audiovisual (movie with audio track), auditory (soundtrack with a fixation cross on a black screen), and visual (silent movie). Trial order was randomized, with the constraint that the same story could not be presented twice in a row, regardless of modality. Precise timing of stimulus presentation with respect to iEEG data acquisition was verified using an oscilloscope, a microphone, and a photodiode.
The task was intended to ensure that participants were attending the stimuli. Performance was on average 85% (range, 59–95%) in the audiovisual modality, 84% (61–95%) in the auditory modality, and 68% (44–88%) in the visual modality. Performance was significantly above chance in each modality [paired t tests; AV: t(8) = 8.37, p = 4.74 * 10−5; A: t(8) = 8.81, p = 4.74 * 10−5; V: t(8) = 3.44, p = 0.0088 [p values were corrected for multiple comparisons using the false discovery rate (FDR) procedure; Benjamini and Hochberg, 1995].
Data acquisition
iEEG electrode localization
The placement of iEEG electrodes (subdural and depth electrodes; Ad-Tech Medical; and Integra LifeSciences) was determined on clinical grounds, without reference to this study. The localization and display of iEEG electrodes was performed using iELVis (RRID:SCR_016109 (http://ielvis.pbworks.com); Groppe et al., 2017). For each participant, a postimplantation high-resolution computed tomography (CT) scan was coregistered with a postimplantation 3D T1 1.5 tesla MRI scan and then with a preimplantation 3D T1 3 tesla MRI scan via affine transforms with 6 df using the FMRIB Linear Image Registration Tool included in the FMRIB Software Library [RRID:SCR_002823 (https://fsl.fmrib.ox.ac.uk/fsl/fslwiki); Jenkinson et al., 2012] or the bbregister tool included in FreeSurfer (RRID:SCR_001847 [https://surfer.nmr.mgh.harvard.edu/fswiki/FreeSurferWiki); Fischl, 2012]. Electrodes were localized manually on the CT scan using BioImage Suite [RRID:SCR_002986 (https://medicine.yale.edu/bioimaging/suite/); Joshi et al., 2011]. The preimplantation 3D T1 MRI scan was processed using FreeSurfer to segment the white matter, deep gray matter structures, and cortex; to reconstruct the pial surface; approximate the leptomeningeal surface (Schaer et al., 2008); and parcellate the neocortex according to gyral anatomy (Desikan et al., 2006). To compensate for the brain shift that accompanies the insertion of subdural electrodes through a large craniotomy, subdural electrodes were projected back to the preimplantation leptomeningeal surface (Dykstra et al., 2012). For depth electrodes, only contacts that were located in gray matter were retained for further analysis (Mercier et al., 2017). Each iEEG electrode was attributed to a cortical region according to automated parcellation in FreeSurfer (for a similar approach, see Mégevand et al., 2017; Arnal et al., 2019).
iEEG recording and preprocessing
Intracranial EEG signals were referenced to a vertex subdermal electrode, filtered and digitized (0.1 Hz high-pass filter; 200 Hz low-pass filter; 500–512 samples/s; XLTEK EMU128FS or Natus Neurolink IP 256 systems, Natus Medical). Analysis was performed offline using the FieldTrip toolbox [RRID:SCR_004849 (http://www.fieldtriptoolbox.org/); Oostenveld et al., 2011] and custom-made programs for MATLAB [MathWorks; RRID:SCR_001622 (https://www.mathworks.com/products/matlab.html)]. The 60 Hz line noise and its harmonics were filtered out using a discrete Fourier transform filter. iEEG electrodes contaminated with noise or abundant epileptiform activity were identified visually and rejected. iEEG electrodes that lay in white matter were also rejected (Mercier et al., 2017). The remaining iEEG signals were rereferenced to average reference.
The absolute phase and power of an iEEG signal are quantities that depend on the reference; consequently, the quantification of synchronization between electrodes is strongly influenced by the choice of the reference (Guevara et al., 2005; Mercier et al., 2017). Here, however, we strictly focus on the relative relationship between a continuous sensory stimulus and the phase or power response at a given electrode; therefore, at no point is the phase or power of an iEEG signal measured at a given electrode compared with those at another. Furthermore, all statistical testing is performed at the single-electrode level through permutation testing; thus, any influence of the reference on the observed data is also present in the surrogate data generated by the permutation test (see below). For these reasons, the analyses presented here are immune to the choice of a particular referencing scheme.
Intracerebral recordings are not immune to volume conduction: laminar electrodes in monkey auditory cortex could record responses from a nearby visually responsive area situated ∼1 cm away (Kajikawa and Schroeder, 2011). However, the amplitude of volume-conducted LFP decreases steadily as the measuring electrode is more distant from the source, meaning that each iEEG electrode remains more influenced by locally occurring activity (Dubey and Ray, 2019). Furthermore, bipolar montages in iEEG have their own issues, including the risk of mixing signals from disparate generators, which would negate the spatial precision of iEEG (Zaveri et al., 2006). Based on these considerations, we selected referential over bipolar recordings for our analyses.
Data analysis
Time courses of auditory and visual speech stimuli
The envelope of auditory speech stimuli was computed by filtering the audio track of the video clips through a gammatone filter bank approximating a cochlear filter, with 128 center frequencies equally spaced on the equivalent rectangle bandwidth–rate scale and ranging from 80 and 5000 Hz (Carney and Yin, 1988), computing the Hilbert transform to obtain power in each frequency band, and averaging again over frequencies (MATLAB Toolbox, Institute of Sound Recording, University of Surrey; https://github.com/IoSR-Surrey/MatlabToolbox). The time course of visual speech stimuli was estimated by manually measuring the vertical opening of the mouth on each still frame of the video clips (Park et al., 2016). Auditory and visual speech stimulus time courses were then resampled to 200 Hz at the same time points as the iEEG signals.
Time–frequency analysis of iEEG signals
To obtain instantaneous low-frequency power and phase, the iEEG signal was filtered between 0.5 and 9 Hz (−3 dB cutoff points, sixth-order Butterworth filters), downsampled to 200 Hz, and Hilbert transformed. Instantaneous power and phase in the delta band (−3 dB cutoff points at 0.5–3.5 Hz) and the theta band (−3 dB cutoff points at 4–7.5 Hz) was computed in similar fashion. The intertrial coherence (ITC), a measure of phase alignment across repetitions of the same sensory stimulus, was computed as the mean resultant vector length using the CircStat toolbox (https://github.com/circstat/circstat-matlab; Berens, 2009). Broadband high-frequency activity (BHA), which reflects local neuronal activity (Crone et al., 1998; Ray et al., 2008), was computed by filtering the iEEG signal in 10 Hz bands between 75 and 175 Hz (fourth-order Butterworth filters), computing the Hilbert transform to obtain instantaneous power, dividing instantaneous power in each band by its own mean over time to compensate for the 1/f power drop, and then averaging again over bands (Golan et al., 2016). BHA was then downsampled to 200 Hz.
Stimulus–response cross-correlation
The relationship between speech stimuli and brain responses was quantified by computing their cross-correlation. For each iEEG electrode, data from all trials in each sensory modality were concatenated and were then cross-correlated with the corresponding concatenated stimulus time courses. For low-frequency power and BHA, Pearson correlation was computed; for the low-frequency phase, linear-to-circular correlation was computed (Berens, 2009). To account for the fact that brain responses to sensory stimuli occur with some delay, lags of −200 to +200 ms between stimuli and responses were allowed. The maximum of the absolute value of the correlation coefficient over this time period was considered. Because the above analysis included lag values where brain responses could theoretically precede the corresponding sensory stimulus, we repeated the entire analysis while allowing only physiologically plausible lags (i.e., from −200 to 0 ms). This reanalysis yielded essentially identical results.
Statistical testing
To assess the statistical significance of observed cross-correlation coefficients, their distribution under the null hypothesis was estimated using a permutation test. In each iteration, trial labels were shuffled to disrupt the temporal relationship between stimuli and responses, and one value of the correlation coefficient was computed. The procedure was repeated 1000 times. Observed values of correlation coefficients were then expressed as z scores of the null distribution. For an illustration of the procedure, see Figure 2A–E.
Figure 2.
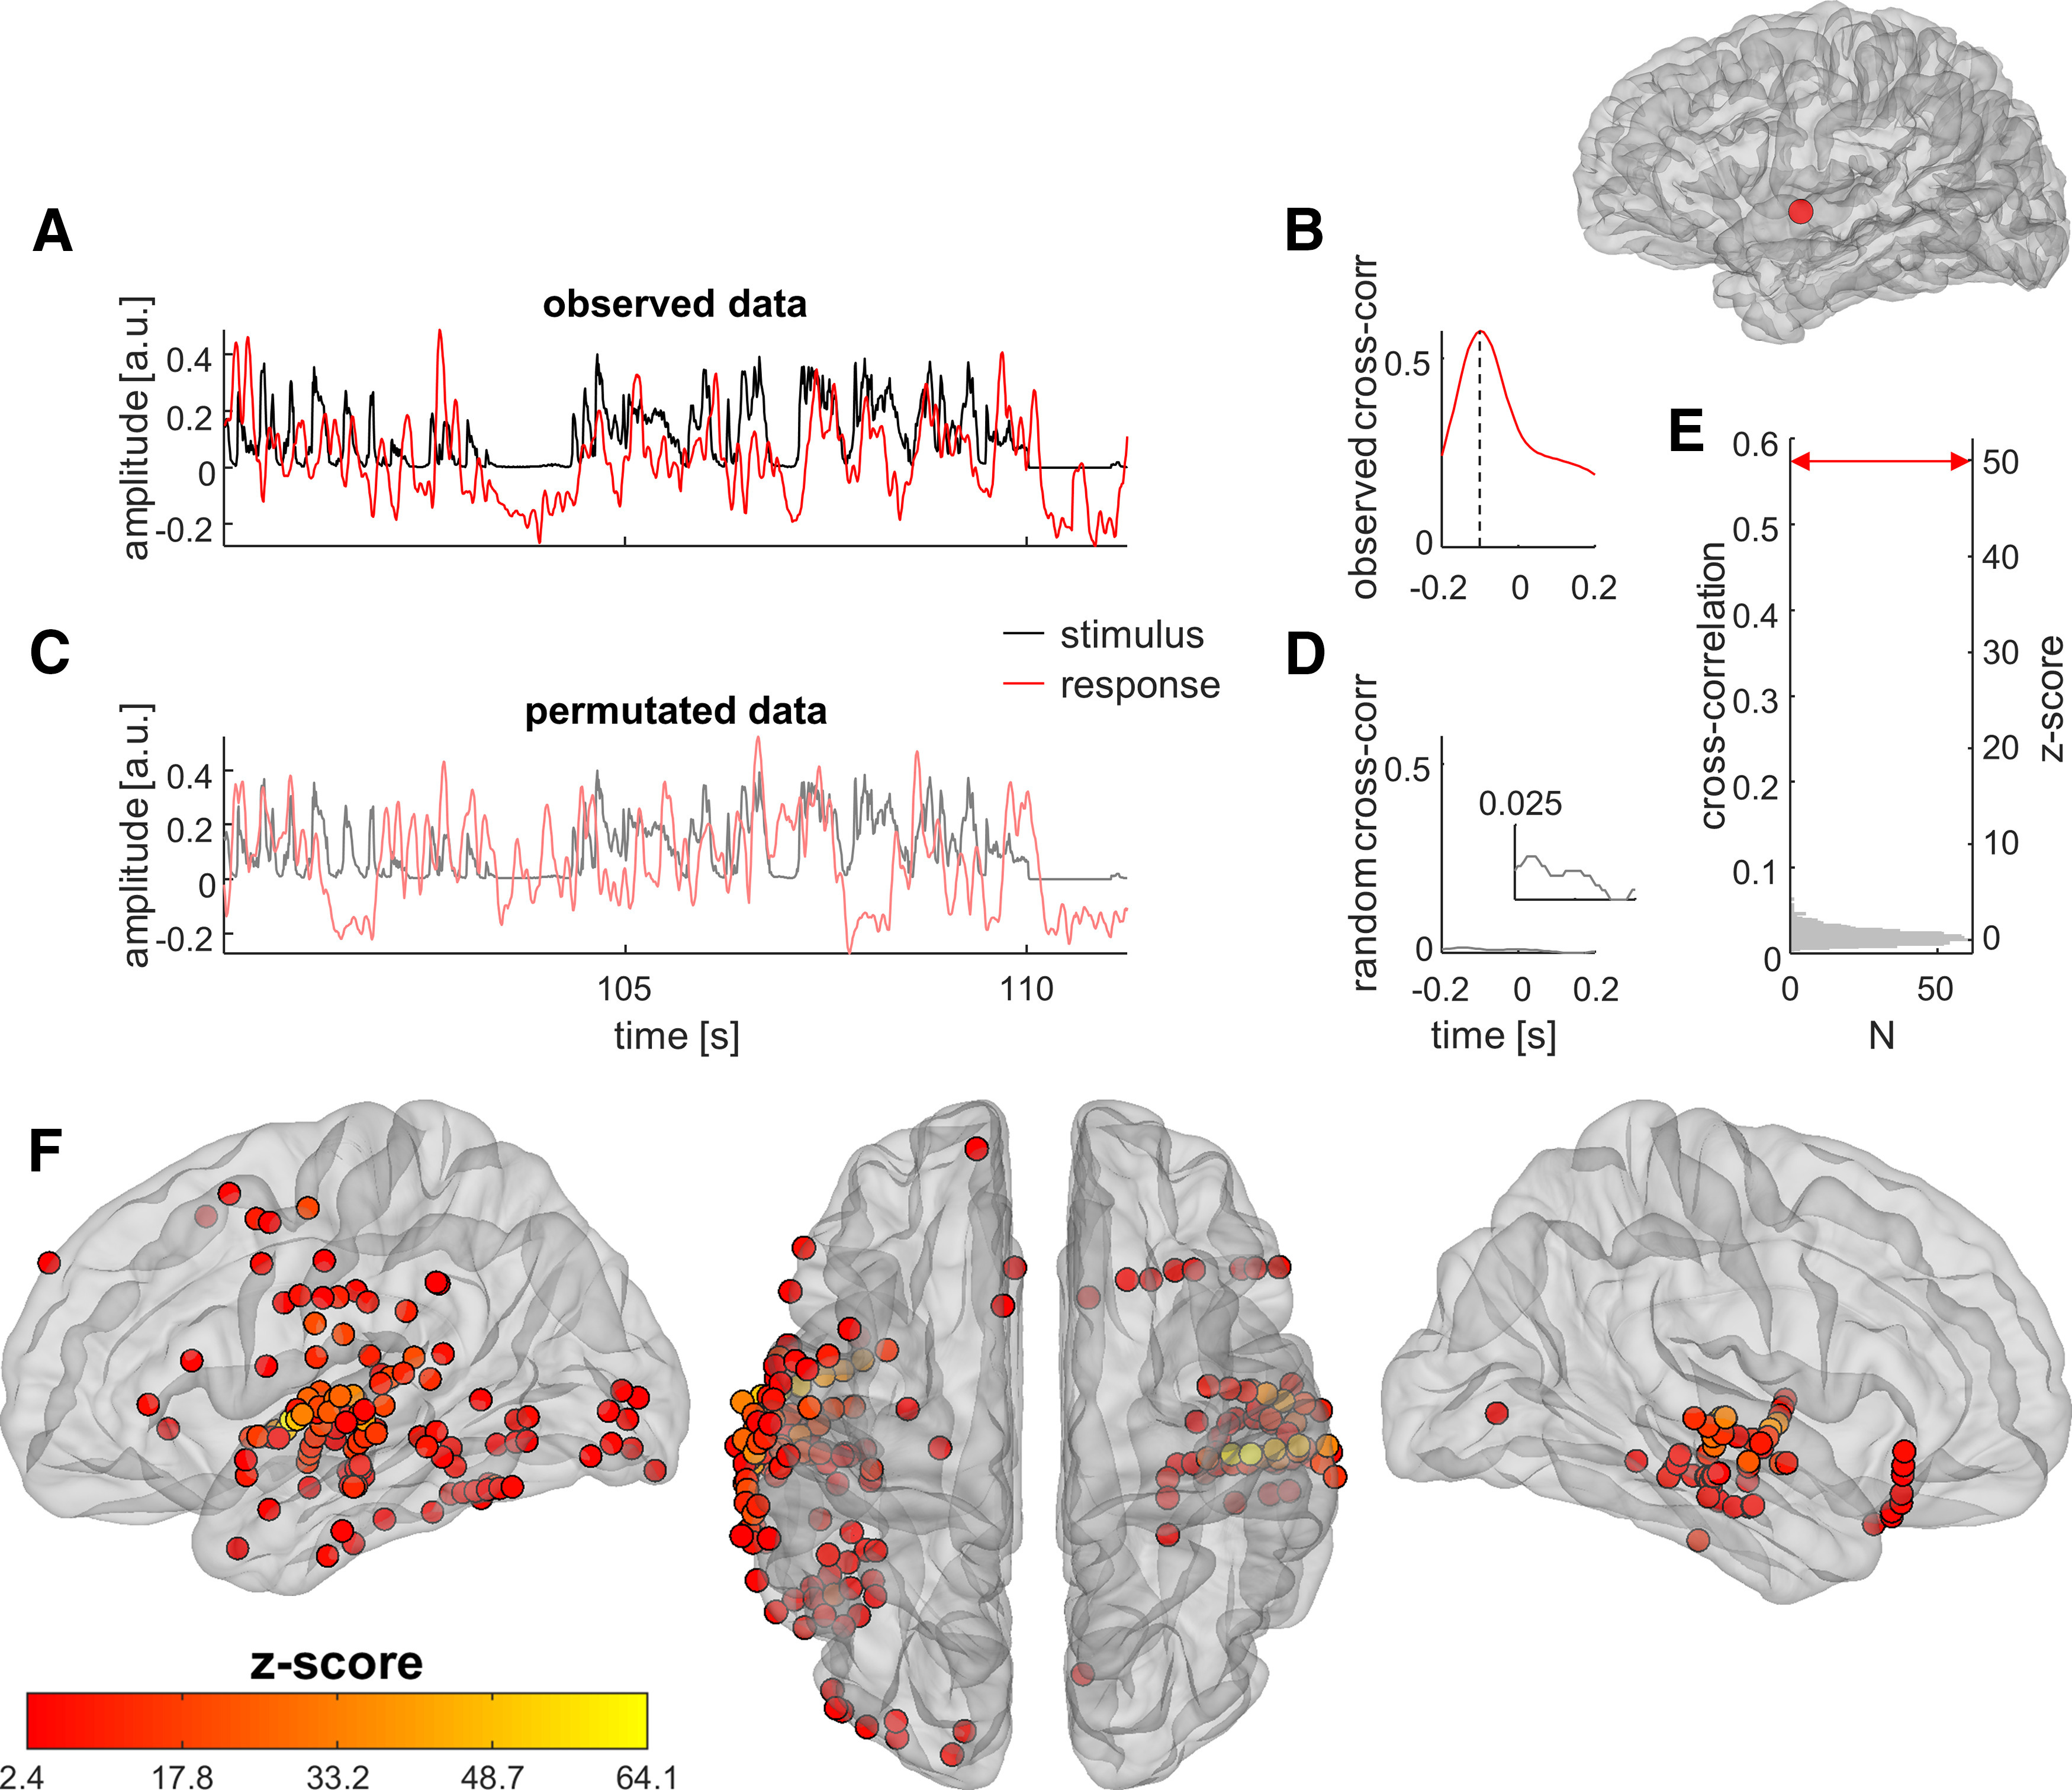
Establishing correlations between speech stimuli and cortical responses. A, In this example cortical site, located in the left superior temporal gyrus (inset at top right), BHA (red trace) closely tracks the sound envelope of speech (black trace). B, Cortical tracking of speech is quantified by computing the maximum cross-correlation between stimulus and response. Here, cross-correlation reaches a maximum at −100 ms, the negative value indicating that the brain response lags behind the sensory stimulus. C, To assess to what extent the observed cortical tracking of speech departs from the null hypothesis, the trial labels of responses are permutated at random so that they are no longer aligned with the corresponding stimuli. D, A random cross-correlation is computed in the same fashion as the observed one. Inset, Zoom on the y-axis. E, The permutation procedure is repeated 1000 times, yielding a distribution of cross-correlation values under the null hypothesis (gray histogram). The observed cross-correlation value (red arrow) is expressed as a z score of that null distribution (here z = 49.5, p < 2.22e−16). F, Applying this procedure to the entire dataset, 186 of 1012 (18%) cortical sites display significant tracking of the sound envelope of speech with their BHA at the p ≤ 0.05 level, FDR corrected over all sites. These sites are selected as auditory-responsive cortex.
Correlations between cross-correlations over sites were assessed with Spearman's rank correlation to account for the non-normal distribution of cross-correlation coefficients. Differences in cross-correlations across conditions were assessed either with paired t tests, when distributions were approximately normal, or with permutation testing, when they were not. Differences in power or ITC from baseline to the stimulus period were assessed with permutation testing.
Correction for multiple comparisons
The p values were corrected for multiple comparisons over electrodes using an FDR procedure (Benjamini and Hochberg, 1995) with the familywise error rate set at 0.05 and implemented in the Mass Univariate ERP toolbox [RRID:SCR_016108 (https://github.com/dmgroppe/Mass_Univariate_ERP_Toolbox); Groppe et al., 2011a]. The Benjamini–Hochberg FDR procedure also maintains adequate control of the familywise error rate in the case of positive dependencies between the observed variables.
Rationale for the iEEG analysis strategy
The question of how best to analyze iEEG data over multiple participants is not straightforward, because the coverage and density of iEEG material typically vary widely from one patient to the next. Selecting electrodes that sample from one or a handful of predefined anatomic regions of interest is a common approach. When sufficiently dense sampling is available from large patient cohorts performing the same task, whole-brain activity maps and statistics can be generated (Kadipasaoglu et al., 2015; Grossman et al., 2019a,b). In our case, we did not want to restrict our analysis to anatomically defined regions of interest. The approach we took was to analyze all data at the single-electrode level, and then to apply strong correction for multiple comparisons through the Benjamini–Hochberg FDR procedure (Benjamini and Hochberg, 1995) performed over all electrodes in the dataset (N = 1012). Studies using simulated EEG and event-related potential data showed that this procedure provides adequate correction for multiple comparisons (i.e., adequate control of the FDR) in the case of neurophysiological data (Groppe et al., 2011a,b).
For each variable of interest, statistical testing was systematically performed independently for each electrode in the dataset (N = 1012) and then corrected for multiple comparisons on the entire electrode set. Thus, the auditory-responsive cortical sites were the sites (N = 186) that displayed significant BHA tracking of the speech envelope, after FDR correction over all 1012 sites. Separately, sites were deemed to significantly track visual speech through their low-frequency phase or power if statistical testing survived FDR correction over all 1012 sites (independent of whether they were auditory responsive or not). It is only after this first, stringent correction that we combined the sites that were both auditory responsive and tracked visual speech through low-frequency activity. This conjunction analysis is not circular, because the order in which the selection criteria are applied has no importance and does not artificially preordain its results.
To compute cross-correlations, stimuli from all trials were concatenated into a single minutes-long time course. Cortical responses at each electrode were concatenated over trials in similar fashion. The permutation procedure simply altered the order in which the responses were concatenated to break down the temporal relationship between stimuli and responses. The procedure did not introduce any unnatural interruption of either stimuli or responses. It also fully respected any existing dependencies between variables, like response properties at neighboring electrodes.
Overall, 159 cortical sites tracked mouth movements through their high-frequency activity; of those, 37 also tracked the speech envelope. We intentionally did not analyze visually responsive cortical sites further or focus on the smaller contingent of dual tracking sites, for the following two reasons: (1) the phase reset hypothesis is directional and makes predictions about the influence of visual speech on auditory cortex, but not the reverse; and (2) the hypothesis suggests that the crossmodal influence of visual speech on auditory cortex could be largely subthreshold—that is, manifesting as changes in oscillatory phase, but not neuronal firing (Schroeder et al., 2008). Hence, we focused on investigating how visual speech cues influenced oscillatory activity in auditory-responsive cortex.
The superadditive approach has been abundantly used to demonstrate multisensory effects with linear variables like the amplitude of event-related potentials: a cortical site exhibits a superadditive effect if its response to a multisensory stimulus is larger than the sum of its responses to unisensory stimuli. Nonlinear approaches to examine superadditive multisensory effects on oscillatory power (Senkowski et al., 2007) or intertrial coherence (Mercier et al., 2015) have been described as well. Circular variables like phase angles, however, do not sum easily, especially in our case where there is a variable lag between the continuous auditory and visual stimulus streams. For this reason, we limited our analysis to the relatively simple comparison of responses to audiovisual versus auditory-alone stimuli in auditory cortex, similar to previous work (Kayser et al., 2008).
Data and software availability
Data and custom-made software are available on request from Pierre Mégevand (pierre.megevand@unige.ch).
Results
Cortical tracking of auditory and audiovisual speech
We recorded iEEG signals from electrodes implanted in the brain of nine human participants undergoing invasive electrophysiological monitoring for epilepsy (Fig. 1C). Patients attended to clips of a speaker telling a short story, presented in the auditory (soundtrack with black screen), visual (silent movie), and audiovisual modalities (Fig. 1A). Cortical sites were considered to be auditory responsive if the time course of their local neuronal activity, assessed by BHA (also known as “high-gamma power”; Crone et al., 1998), correlated significantly with that of auditory speech (indexed by the amplitude of the speech envelope). We quantified the magnitude of speech–brain correlations through cross-correlation and tested for significance using permutation testing, as illustrated in Figure 2A–E. After FDR correction for multiple comparisons, 186 cortical sites, centered mostly on the superior and middle temporal gyri of both cerebral hemispheres, displayed significant BHA tracking of auditory speech (Fig. 2F). These sites were analyzed further as auditory-responsive cortex.
Figure 1.
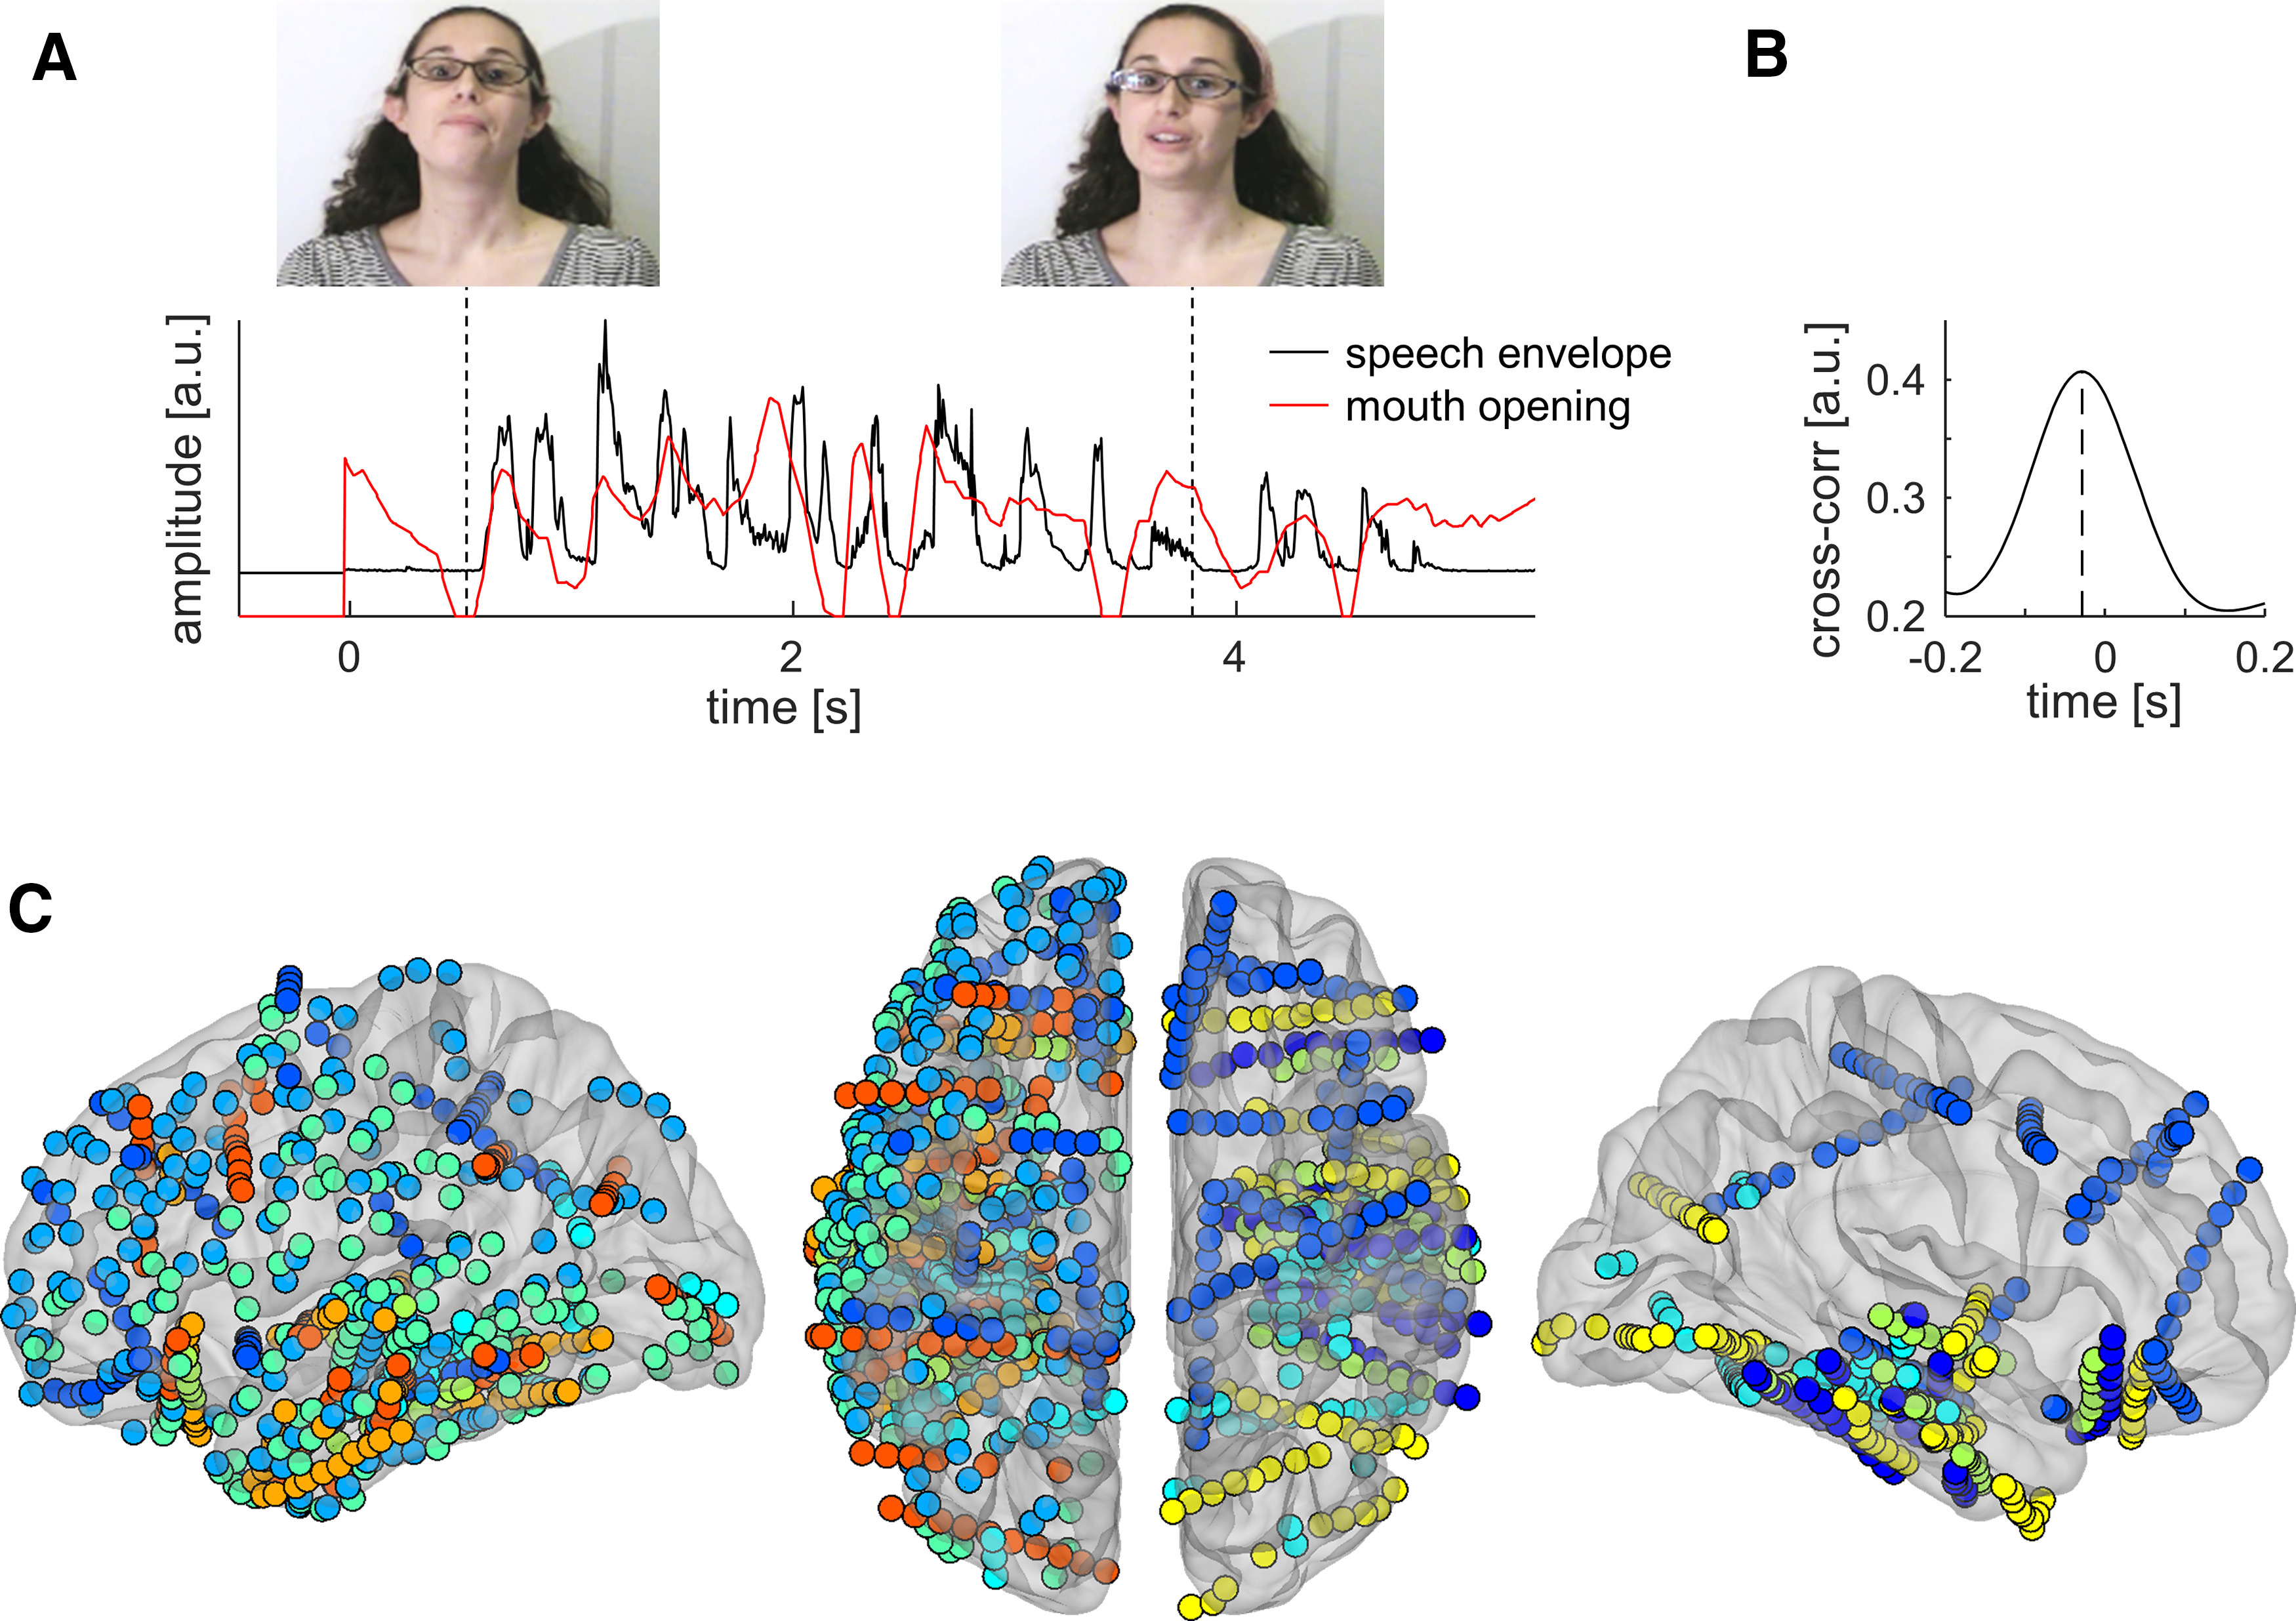
Speech stimuli and iEEG electrode coverage. A, Speech stimuli are ∼10-s-long stories presented either in both auditory and visual, auditory-only, or visual-only modalities. The sound envelope of speech and the extent of vertical mouth opening are plotted for one story fragment. B, Over all stories, there is a 30 ms lead of mouth movements over the speech envelope. C, All cortical sites included in the study (N = 1012) are plotted on a semitransparent template brain, color coded for each of the nine patients. Left, Lateral view of the left hemisphere. Middle, Superior view of both hemispheres (left hemisphere on the left, frontal pole at the top, occipital pole at the bottom). Right, Lateral view of the right hemisphere.
We also examined how low-frequency oscillatory activity in auditory-responsive cortex tracks auditory speech. As expected, we found strong tracking through both low-frequency phase and power, the intensity of which clearly correlated with BHA tracking (Fig. 3A,B). Next, we asked whether the tracking of the speech envelope differed in response to audiovisual speech compared with unisensory auditory speech. On average, tracking through the phase of low-frequency activity was stronger for audiovisual speech than for purely auditory speech, whereas tracking through low-frequency power was weaker for audiovisual than for auditory speech (Fig. 3C,D). A depiction of the anatomic localization of auditory-responsive sites revealed that cortical areas related to auditory and language processing in the superior temporal gyrus (and the middle temporal gyrus to a lesser extent), mostly showed increased phase tracking, but reduced power tracking, to audiovisual versus auditory speech (Fig. 3E,F). The improvement in phase tracking to audiovisual speech suggests that visual speech cues provide an additional influence to auditory cortex, which improves the phase alignment of its low-frequency activity to the speech envelope. The observation of the opposite phenomenon in low-frequency power tracking is inconsistent with the idea that this improvement is simply an artifact of increased evoked response power.
Figure 3.
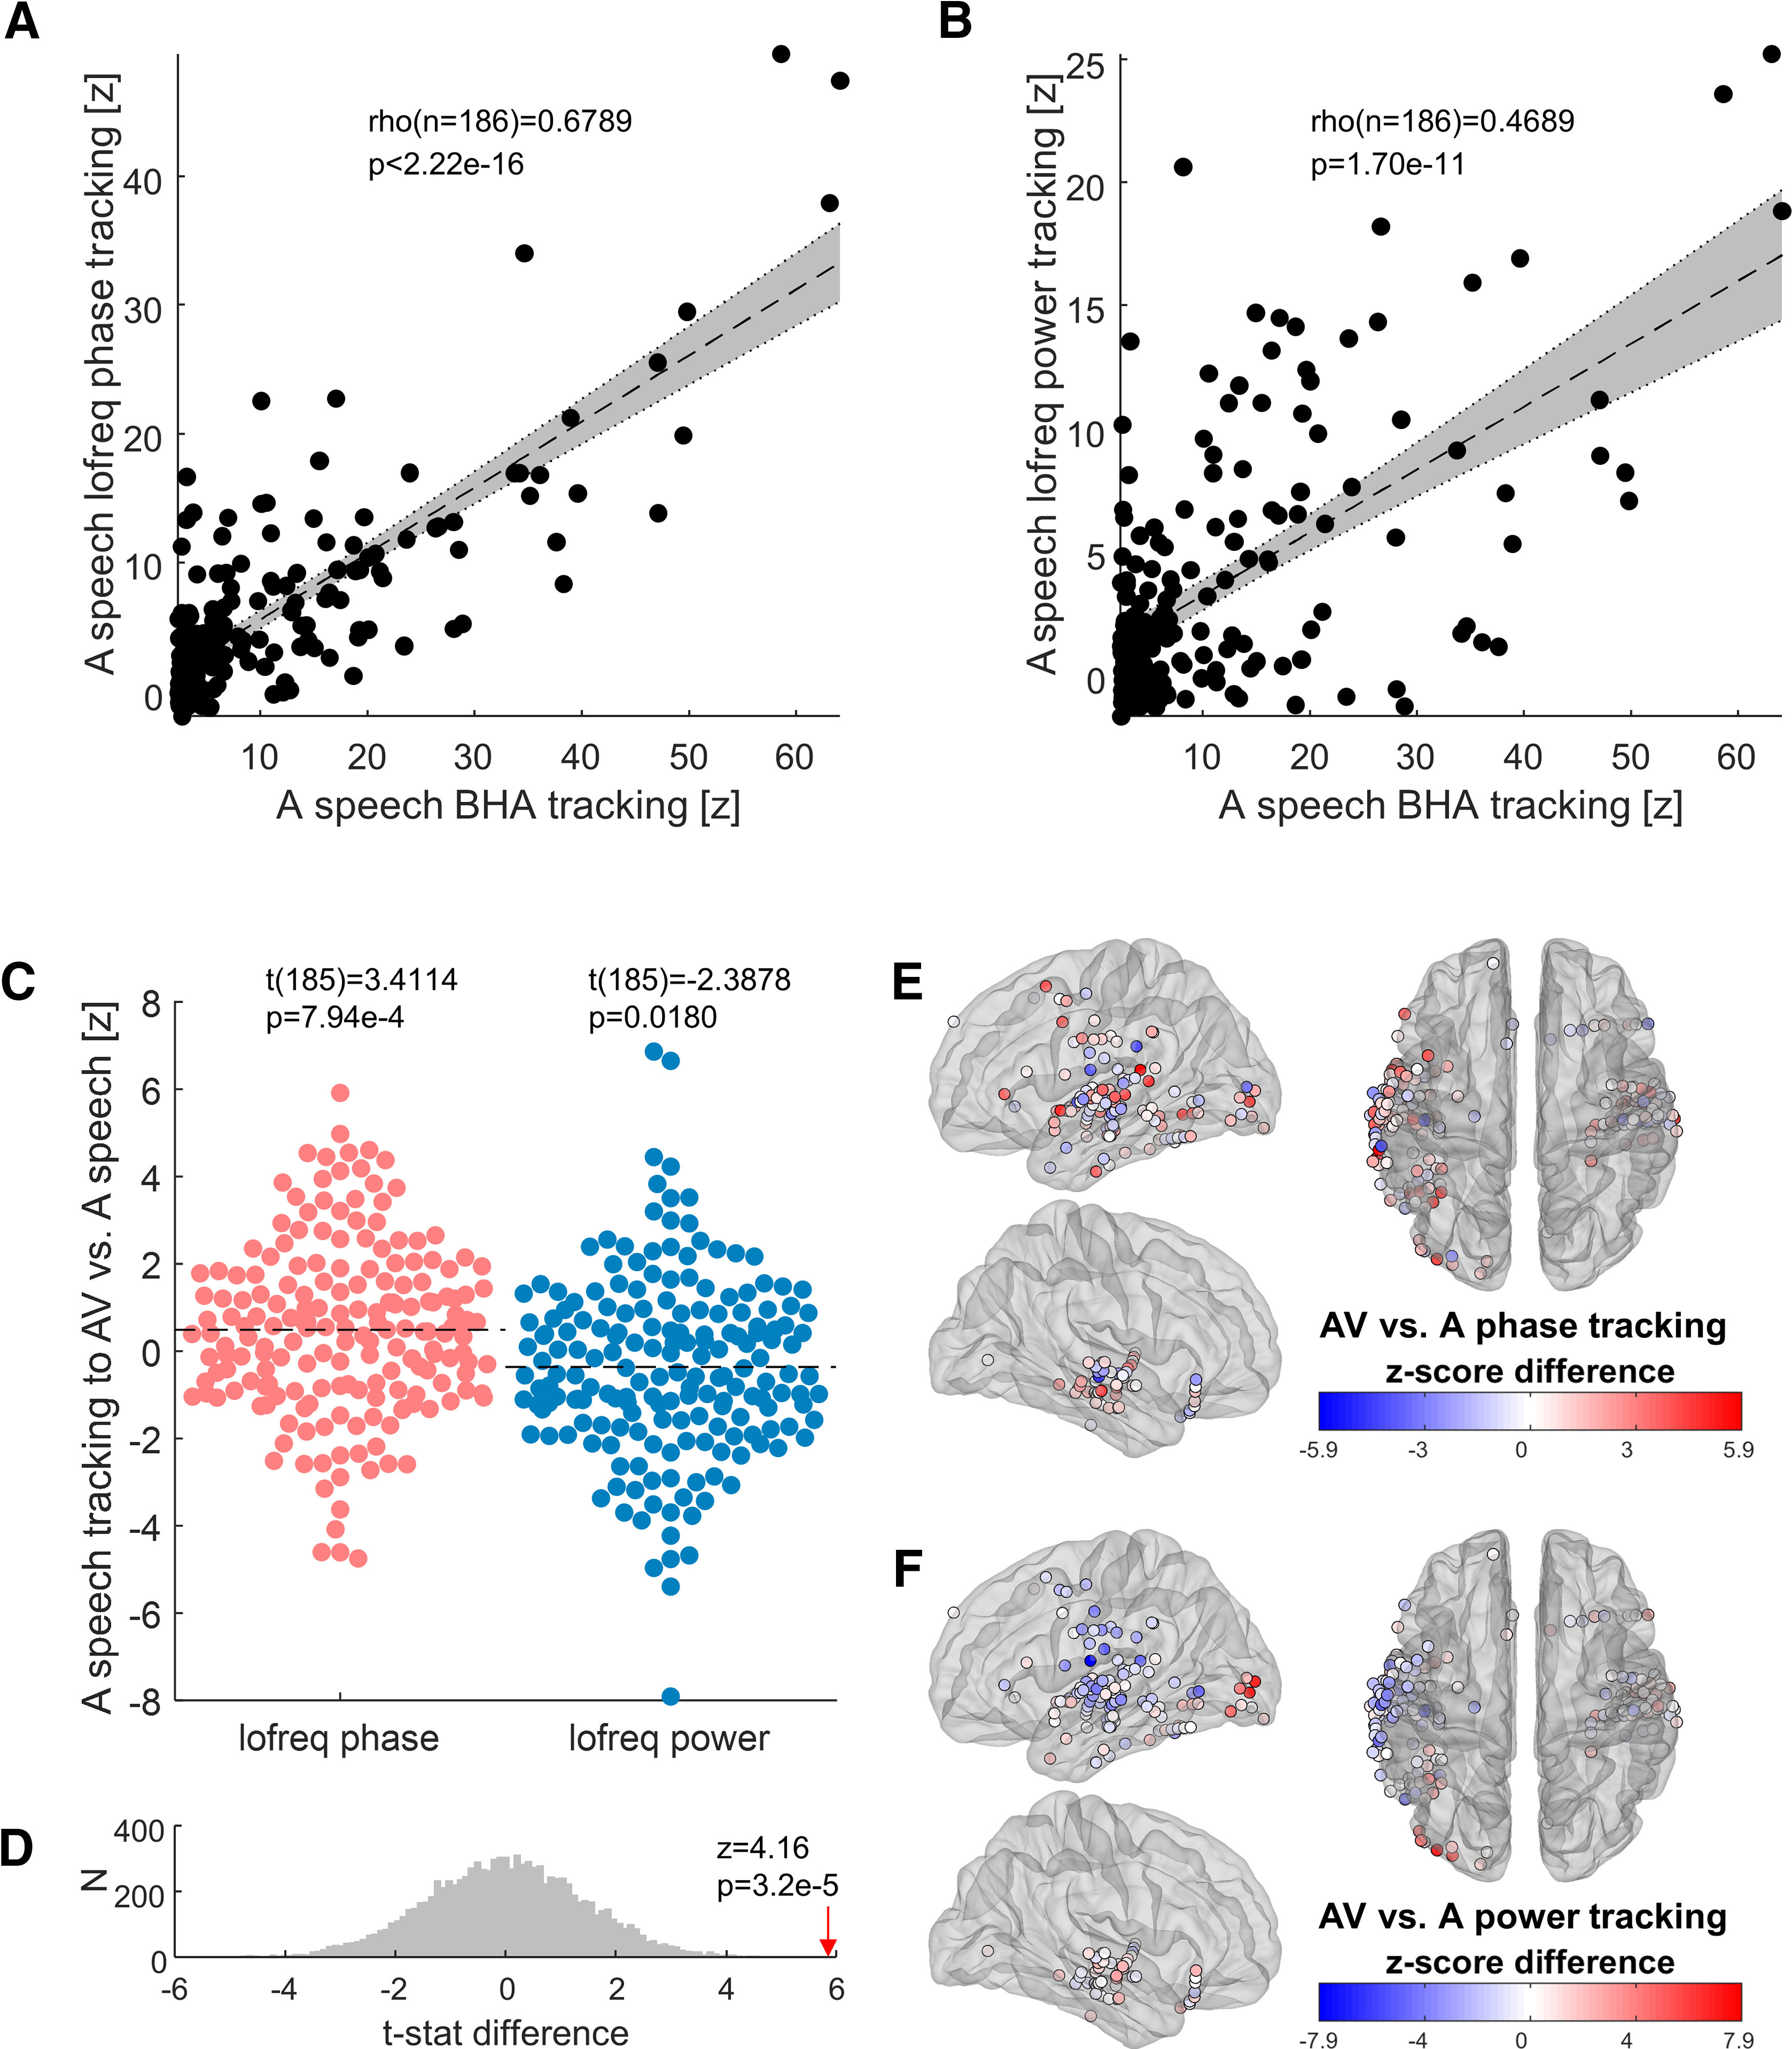
Low-frequency cortical tracking of auditory and audiovisual speech. A, Auditory-responsive cortex tracks the speech envelope through both its BHA and the phase of its low-frequency (0.5–9 Hz) EEG activity, and the two metrics are strongly correlated (Spearman's rank correlation). B, Auditory-responsive cortex also tracks the speech envelope through the power of its low-frequency oscillations (Spearman's rank correlation). C, The intensity of speech tracking by low-frequency phase (red) is greater in response to AV than unisensory A speech (paired t test). Conversely, the intensity of speech tracking by low-frequency power (blue) is reduced in response to AV compared with A speech. D, The difference between the t statistics for phase versus power shown in C is tested for statistical significance using a permutation test (N = 10 000). The histogram shows the distribution of t statistic differences under the null hypothesis that they do not differ. The observed t statistic difference (red arrow) is expressed as a z score of that null distribution. E, The difference in the magnitude of speech tracking by low-frequency phase in response to AV versus A speech is plotted for each auditory-responsive cortical site. F, The difference in the magnitude of speech tracking by low-frequency power in response to AV versus A speech is plotted for each auditory-responsive cortical site.
Speech resets the phase of ongoing oscillations in auditory-responsive cortex
A phase-resetting mechanism presupposes the existence of ongoing oscillations outside periods of sensory processing. To examine this, we measured the instantaneous power and phase of low-frequency EEG activity at baseline 0.5 s before stimulus onset, and 1.5 s after stimulus onset. We picked this later time point to avoid the stimulus onset-evoked response. For this analysis, our choice of a task design where the same stimulus was presented multiple times becomes clear (Fig. 4A): we found that oscillatory power decreased relative to baseline during the presentation of a continuous stimulus (Fig. 4B), while at the same time phase alignment across repeated presentations of the same stimulus (quantified as the ITC) increased (Fig. 4C). This analysis makes it clear that oscillatory activity is already present before stimulus onset. During stimulus presentation, the observation of a decrease in power coincident with the increase in phase alignment argues that the latter reflects a pattern of phase resetting rather than a succession of evoked responses. While there are alternative possibilities (e.g., prestimulus oscillations are suppressed and replaced with a completely new set of cortical oscillatory dynamics), we think that our interpretation of these events is the most parsimonious.
Figure 4.

Auditory-responsive cortex aligns its low-frequency oscillations, and reduces their power, to continuous speech stimuli. A, In this example cortical site (inset at top right, the same as in Figure 2A–E), low-frequency EEG activity (0.5–9 Hz) in response to eight repetitions of the same auditory stimulus is plotted in shades of red (indicating individual trials). The polar plots at −0.5 and +1.5 s relative to stimulus onset indicate the instantaneous power (in square microvolts) and phase angle (in radians) of ongoing oscillations at these time points. B, Low-frequency power for all auditory-responsive cortical sites (N = 186) at −0.5 and +1.5 s relative to stimulus onset. Power decreases slightly during the stimulus compared with baseline (permutation testing, 10,000 iterations). C, Across all auditory-responsive sites, low-frequency phase concentration, expressed as the ITC, increases significantly during the stimulus compared with baseline (permutation testing).
Tracking of visual speech by auditory-responsive cortex
We then asked how unisensory visual speech influences low-frequency activity in auditory-responsive cortex. To index the time course of visual speech, we measured the vertical opening of the mouth, a metric that correlates with the area of mouth opening and with the speech envelope (Fig. 1B). We quantified the intensity of the tracking of mouth opening by either low-frequency phase or power in auditory-responsive cortex, using the same approach as for the tracking of the speech envelope. We found that a subset of auditory-responsive cortical sites displayed phase tracking of visual speech (Fig. 5A,C). These sites were clustered in the superior and middle temporal gyri, for the most part. We also found power tracking of visual speech in another subset of auditory-responsive cortical sites (Fig. 5A,D). Importantly, these sites were generally different from those that displayed phase tracking, and their anatomic localization was more diffuse, including temporal cortex but also spreading to the occipital, parietal, and frontal cortices (Fig. 5B). This segregation of phase and power tracking sites is consistent with the idea that phase reset and evoked responses provide complementary mechanisms for the influence of visual speech in auditory cortex.
Figure 5.

Low-frequency tracking of visual speech in auditory-responsive cortex. A, Tracking of visual speech (the temporal pattern of vertical mouth opening) by low-frequency (0.5–9 Hz) iEEG activity at auditory-responsive cortical sites. Sites that display phase tracking (n = 20) are plotted in red, sites that display power tracking (n = 22) in blue, and sites that display both (n = 6) in yellow. Significance is determined at the pFDR ≤ 0.05 level, corrected over all 1012 sites. The number of sites that display both phase and power tracking is not higher than expected by chance, given the number of sites displaying either and the total number of sites (z = 1.24, p = 0.11, permutation test). B, Count of auditory-responsive cortical sites tracking visual speech through the phase of their low-frequency oscillations, low-frequency power, or both. Sites are grouped by lobe or sublobar region. Tsup, Superior temporal cortex; Tinf, inferior and lateral temporal cortex; Tmed, medial temporal cortex; O, occipital cortex; P, parietal cortex; F, frontal cortex; I, insular cortex. C, The intensity of low-frequency phase tracking of visual speech by auditory-responsive sites is color coded. D, The intensity of low-frequency power tracking of visual speech by auditory-responsive sites is color coded. E, In the sites that track visual speech with low-frequency phase, there is a correlation between that tracking and tracking with BHA (Spearman's rank correlation). F, By contrast, there is no correlation between low-frequency power tracking and BHA tracking of visual speech.
Next, we examined the influence of phase reset on local neuronal activation as indexed by BHA. The intensity of BHA tracking correlated with that of tracking through the low-frequency phase (Fig. 5E), indicating coupling between the low-frequency phase and the amplitude of neuronal activation (Canolty et al., 2006). By contrast, there was no detectable correlation between BHA tracking and low-frequency power tracking (Fig. 5F). These observations are consistent with the hypothesis that phase reset to visual speech augments local neuronal activation in auditory cortex.
Since the placement of iEEG electrodes was determined solely by clinical circumstances, anatomic coverage varied significantly across participants. Figure 6 shows the tracking of visual speech by auditory-responsive cortex in individual patients. The patients with denser sampling of temporal regions (patients 1, 3, 4, 5, and 8) tended to be the ones in whom we observed tracking of visual speech by auditory-responsive cortex.
Figure 6.

Visual speech tracking by auditory-responsive cortex in individual patients. For each individual patient, all iEEG electrodes are plotted on lateral views of the implanted hemispheres, complemented by superior views when necessary. Auditory-responsive electrodes that track visual speech through the phase or power of low-frequency oscillations are color coded as in Figure 5A. Insets show electrode counts per anatomic region as in Figure 5B; the y-axis for bars is the same as in that figure.
Speech is a mixture of rhythms: syllables, which occur at a frequency well approximated by the theta band of cerebral oscillations, are nested within the slower rates of word and phrase production, which themselves correspond to the delta band. To assess whether auditory-responsive cortex was differently sensitive to these two dimensions of speech in the visual modality, we repeated our analysis of speech tracking by EEG phase and power in the delta- and theta-frequency bands. This analysis showed a clear dissociation between phase and power tracking, which contributes to the evidence that these two phenomena are distinct. Thirty auditory-responsive cortical sites tracked visual speech with the phase of their delta oscillations, whereas 17 sites showed delta power tracking and 4 sites displayed both (Fig. 7A). There was a significant correlation between delta phase and BHA tracking of visual speech (Spearman's ρ(n = 34) = 0.4273, p = 0.0123), whereas the correlation between delta power and BHA tracking was not significant (ρ(n = 21) = 0.2065, p = 0.3675). For the most part, delta-phase tracking sites were clustered in the superior and middle temporal gyri, similar to what we observed for low frequency. In the theta band, by contrast, a single electrode displayed phase tracking, whereas 23 showed power tracking. The correlation between theta power and BHA tracking did not reach significance (ρ(n = 23) = 0.3192, p = 0.1377). These results suggest that, at least in our experimental conditions, visual speech cues provide mostly suprasyllabic information to auditory cortex (words and phrases) in the form of ongoing delta-phase reset.
Figure 7.

Delta- and theta-band tracking of visual speech by auditory-responsive cortex. A, Thirty auditory-responsive cortical sites tracked visual speech through the phase of their delta oscillations, whereas 17 sites showed delta power tracking, and 4 sites displayed both. B, A single site tracked visual speech through theta phase, whereas 23 sites showed theta power tracking.
Because our experiment by design entailed repeated presentations of the same speech stimuli, we performed a split-halves analysis to ensure that the effects that we observed were not caused by the participants' increased familiarity with the material. We found no difference in the magnitude of speech tracking (quantified by the stimulus–response cross-correlation) between early and late trials for the BHA tracking of auditory speech at auditory-responsive sites (paired t test: t(185) = −0.1985, p = 0.9628) or for the tracking of visual speech by either low-frequency phase (t(25) = 0.8403, p = 0.4087) or low-frequency power (t(27) = −0.2581, p = 0.7983). We also did not find any difference in behavioral performance for the early versus late trials (A: t(8) = 1.0000, p = 0.3466; AV: t(8) = 0.2294, p = 0.8243; V: t(8) = −1.8521, p = 0.1012). This suggests that increased familiarity with the speech stimuli did not significantly affect their cortical tracking.
Discussion
Both phase-entrained low-frequency activity and fluctuations in broadband high-frequency activity in auditory cortex track the temporal dynamics of auditory speech (Ding and Simon, 2014). Previous neurophysiological studies have shown that the visual component of audiovisual speech influences cerebral activity, mostly in visual areas, but also in the cortical network that processes auditory speech, which includes superior temporal, inferior frontal, and sensorimotor areas (Luo et al., 2010; Zion Golumbic et al., 2013b; Crosse et al., 2015, 2016; O'Sullivan et al., 2016; Park et al., 2016, 2018; Giordano et al., 2017; Ozker et al., 2018; Micheli et al., 2020). Collectively, these studies have demonstrated that auditory cortical dynamics are sensitive to visual speech but were not able to identify the underlying mechanisms.
Here, we used iEEG recordings for a more direct examination of these mechanisms. Within the cortical network that responds to auditory speech, tracking by low-frequency phase was enhanced by audiovisual compared with auditory stimulation, while the opposite was true for tracking by low-frequency power fluctuations. This dissociation is incompatible with the notion that the enhancement of phase tracking in the audiovisual condition is simply an artifact of increased evoked response power. Rather, it suggests that two complementary mechanisms may be operating. The first, visual phase reset-induced enhancement of cortical responses to auditory speech, seems to best account for the well known perceptual enhancement of auditory speech by concomitant visual cues (Sumby and Pollack, 1954), since both phase tracking and intelligibility are improved in response to audiovisual speech over auditory speech alone. The second mechanism, a visual speech-mediated reduction of evoked responses in auditory cortices, is in line with previous observations that neurophysiological responses to audiovisual stimuli in both auditory and visual cortex are generally smaller than those to the preferred modality stimulus alone (Besle et al., 2008; Mercier et al., 2013, 2015; Schepers et al., 2015). The paradox that a reduction in response amplitude accompanies the perceptual enhancement afforded by audiovisual speech can be reconciled when one considers that the audiovisual stimuli used here and in the above-mentioned studies were well above threshold as well as congruent. Work in monkeys revealed that the information gain from congruent audiovisual input, compared with auditory input alone, resulted in an increase in the temporal precision of firing by auditory neurons, together with a reduction in the total number of action potentials fired (Kayser et al., 2010). Similarly, we interpret our observation of improved phase tracking and reduced response amplitude as evidence for more efficient and reliable cortical processing of congruent audiovisual speech.
We observed dissociations between the sites that display phase versus power tracking of visual speech: the phase tracking sites concentrated in the auditory- and language-related superior, lateral and inferior temporal cortices, while the power tracking sites also involved temporal cortex but were more widely distributed in frontal, parietal, and occipital regions. Further, phase tracking was evident at lower frequencies (in the delta band), whereas power tracking extended to the theta band. These anatomic and physiological distinctions are consistent with the idea that phase reset and evoked responses provide complementary mechanisms for the influence of visual speech in auditory cortex. The magnitude of visual speech tracking by BHA correlated significantly with that of phase tracking, but not with power tracking. This pattern of effects suggests that phase reset by visual speech augments the neuronal representation of auditory speech in auditory cortex (Schroeder et al., 2008). The same phase reset would also provide a reference frame for spike-phase coding of information (Kayser et al., 2009, 2010), but unit recordings would be necessary to evaluate that idea. The proposal that evoked response reductions to audiovisual speech in power tracking sites might represent more efficient cortical processing when both sensory streams bring congruent information could be tested by varying the congruence and information content of each sensory input, as has been explored for visual cortex (Schepers et al., 2015).
Not all auditory cortical sites tracked visual speech. One possible explanation is that the influence of visual speech cues on auditory cortex in general is relatively subtle. Alternatively, cortical patches of auditory-responsive cortex that are also sensitive to visual speech cues could be interspersed within regions that only respond to one or the other modality, as was shown in the superior temporal sulcus of humans and monkeys (Beauchamp et al., 2004; Dahl et al., 2009). Further studies with denser iEEG electrodes and better coverage of Heschl's gyrus, planum temporale, and superior temporal sulcus will provide a finer-grained picture of visual speech tracking by auditory cortex.
The pattern of rapid quasi-rhythmic phase resetting that we observe has strong implications for the mechanistic understanding of speech processing in general. Indeed, this phase resetting aligns the ambient excitability fluctuations in auditory cortex with the incoming sensory stimuli, potentially helping to parse the continuous speech stream into linguistically relevant processing units such as syllables (Schroeder et al., 2008; Giraud and Poeppel, 2012; Zion Golumbic et al., 2012). As attention strongly reinforces the tracking of a specific speech stream (Mesgarani and Chang, 2012; Zion Golumbic et al., 2013b; O'Sullivan et al., 2015), phase resetting will tend to amplify an attended speech stream above background noise, increasing its perceptual salience.
We focused on the impact of visual speech cues on auditory cortex, and not the reverse, because the auditory component of speech is the more relevant one for intelligibility. Furthermore, although there is some variability between the relative timing of individual visual speech cues and the corresponding speech sounds, on average, the visual cues precede the auditory ones (Chandrasekaran et al., 2009; Schwartz and Savariaux, 2014). Accordingly, the phase reset hypothesis (Schroeder et al., 2008) posits that visual cues influence the processing of incoming speech sounds through phase reset, but does not make any prediction regarding the influence of speech sounds on the processing of visual speech. Speech sounds have been shown to modulate the responses of visual cortex to visual speech cues (Schepers et al., 2015); further work will need to examine the nature of that modulatory effect (crossmodal evoked responses vs phase reset).
The statistical relationship between auditory speech and the preceding visual speech gestures permits the brain to predictively bias auditory cortical excitability toward an optimal dynamic excitability state. Oscillatory enhancement of local neuronal excitability operates over a relatively large range of phase angles (Buzsáki and Draguhn, 2004; Lakatos et al., 2005); for delta and theta oscillations, this implies a relatively wide temporal window. At least three anatomic and functional routes could subtend the influence of visual cues on auditory speech processing (Schroeder et al., 2008), as follows: (1) feedback from higher-order, multisensory, speech- or language-related cortex; (2) lateral projections from visual to auditory cortical areas; and (3) feedforward projections from visual thalamic nuclei. Given the progressively increasing response latencies to visual stimuli (Schroeder et al., 1998), including visual speech cues (Nishitani and Hari, 2002), in higher-order visual areas, and the relatively short audiovisual asynchronies in natural speech, the feedback route is unlikely to be the sole or even the major driver of crossmodal phase reset. Projections from visual thalamic nuclei and visual cortical areas to auditory cortex are documented in nonhuman primates (Smiley and Falchier, 2009; Falchier et al., 2010) and might allow the short-latency responses of early auditory regions to crossmodal sensory input, which are modulatory rather than excitatory, in contrast to the feedforward thalamocortical projections of the preferred sensory modality (Schroeder et al., 2001; Lakatos et al., 2007, 2009). In sum, the range of available crossmodal circuitry, in combination with the time range over which excitability enhancement can operate, can easily support the temporal parameters of predictive phase reset as outlined in our hypothesis, though nailing down the manner in which the different components contribute will require additional research.
The importance of the lag between the visual and auditory components of vocalization stimuli was highlighted in a monkey study of a voice-sensitive area in the anterior temporal lobe: that lag determined whether neurons increased or decreased their firing rate in response to the auditory cue (Perrodin et al., 2015). The generalization of these observations to naturalistic audiovisual speech is hampered by the fact that only onset responses to short vocalizations were studied, making it impossible to differentiate phase reset from evoked responses. It would be revealing to study cortical tracking of continuous audiovisual speech while manipulating the lag between the auditory and visual streams. Alternatively, the variable lags that naturally occur between articulatory gestures and speech sounds could be leveraged to similar effect.
Could auditory speech imagery explain the influence of visual speech cues on auditory cortex? Efforts to track the neuronal correlates of speech imagery have struggled with the temporal alignment between cortical activity and the presumed (physically absent) speech, even for single words (Martin et al., 2016). In our experiment, the comparatively longer duration of the speech stimuli (7–11 s) makes it unlikely that participants could have learned the stories well enough to generate auditory imagery with perfect timing relative to the visual speech cues. If that had been the case, the split-halves analysis would presumably have disclosed better performance for the late trials versus the early ones. That we found no such improvement argues against speech imagery as the major explanation for the tracking of visual speech by auditory cortex in our data. A recent MEG study showed that auditory cortex tracked low-frequency (<0.5 Hz) features of the absent speech sounds in response to watching silent speech (Bourguignon et al., 2020). In that study as well, auditory imagery was deemed unlikely to explain auditory cortical entrainment.
To disentangle the contributions of low-frequency phase versus power in auditory cortical responses to visual speech, we examined linear-to-linear (for power) and linear-to-circular (for phase) cross-correlations separately. Few sites exhibited both phase and power tracking, in fact no more than expected by chance. This suggests that, although we did not address the issues of stimulus autocorrelation and correlation between auditory and visual stimuli, we were still able to delineate two sets of auditory-responsive cortical sites that tracked visual speech using distinct fundamental neuronal mechanisms. Other approaches were previously applied to characterize cortical responses to speech, like the spectrotemporal/temporal response function, which linearly models the cortical response based on the spectrotemporal characteristics of the stimulus (Zion Golumbic et al., 2013a,b). We are not aware of previous attempts to use such methods to describe the relationship between a linearly varying stimulus and a circularly varying response like oscillatory phase. Eventually, methods based on linear-to-circular spectrotemporal response functions, or partial correlation accounting for both circular and linear variables, might prove superior to the first step that we took here.
The intelligibility of the speech cues themselves was not at the center of our preoccupations, which is why we gave little emphasis to the participants' behavioral performance. Furthermore, we did not control for the participants' deployment of attention to a particular component of the stimuli. Thus, we cannot distinguish whether the differences in cortical tracking of audiovisual versus auditory speech are because of automatic crossmodal stimulus processing or to the attentional effects of multisensory versus unisensory stimuli (Macaluso et al., 2000; Johnson and Zatorre, 2006). Future work will reveal how cortical tracking is influenced by manipulating the participants' comprehension of audiovisual speech stimuli, as well as the way they focus their attention on them.
Visual enhancement of speech takes place within the context of strong top-down influences from frontal and parietal regions that support the processing of distinct linguistic features (Park et al., 2016, 2018; Di Liberto et al., 2018; Keitel et al., 2018). Further, low-frequency oscillations relevant to speech perception can themselves be modulated by transcranial electrical stimulation (Riecke et al., 2018; Zoefel et al., 2018). Our findings highlight the need to consider oscillatory phase in targeting potential neuromodulation therapy to enhance communication.
Footnotes
This work was supported by the Swiss National Science Foundation (Grants 139829, 145563, 148388, and 167836 to P.M.), the National Institute of Neurological Disorders and Stroke (Grant NS-098976 to M.S.B., C.E.S., and A.D.M.), and the Page and Otto Marx Jr Foundation to A.D.M. We thank the patients for their participation; and Erin Yeagle, Willie Walker Jr., the physicians and other professionals of the Neurosurgery Department and Neurology Department of North Shore University Hospital; and Itzik Norman and Bahar Khalighinejad for their assistance. Part of the computations for this work were performed at the University of Geneva on the Baobab cluster.
The authors declare no competing financial interests.
References
- Ahissar E, Nagarajan S, Ahissar M, Protopapas A, Mahncke H, Merzenich MM (2001) Speech comprehension is correlated with temporal response patterns recorded from auditory cortex. Proc Natl Acad Sci U S A 98:13367–13372. 10.1073/pnas.201400998 [DOI] [PMC free article] [PubMed] [Google Scholar]
- Arnal LH, Morillon B, Kell CA, Giraud A-L (2009) Dual neural routing of visual facilitation in speech processing. J Neurosci 29:13445–13453. 10.1523/JNEUROSCI.3194-09.2009 [DOI] [PMC free article] [PubMed] [Google Scholar]
- Arnal LH, Kleinschmidt A, Spinelli L, Giraud AL, Mégevand P (2019) The rough sound of salience enhances aversion through neural synchronisation. Nat Commun 10:3671. 10.1038/s41467-019-11626-7 [DOI] [PMC free article] [PubMed] [Google Scholar]
- Beauchamp MS, Argall BD, Bodurka J, Duyn JH, Martin A (2004) Unraveling multisensory integration: patchy organization within human STS multisensory cortex. Nat Neurosci 7:1190–1192. 10.1038/nn1333 [DOI] [PubMed] [Google Scholar]
- Beauchamp MS, Nath AR, Pasalar S (2010) fMRI-guided transcranial magnetic stimulation reveals that the superior temporal sulcus is a cortical locus of the McGurk effect. J Neurosci 30:2414–2417. 10.1523/JNEUROSCI.4865-09.2010 [DOI] [PMC free article] [PubMed] [Google Scholar]
- Benjamini Y, Hochberg Y (1995) Controlling the false discovery rate: a practical and powerful approach to multiple testing. J R Stat Soc 57:289–300. 10.1111/j.2517-6161.1995.tb02031.x [DOI] [Google Scholar]
- Berens P. (2009) CircStat: a MATLAB toolbox for circular statistics. J Stat Softw 31:1–21. [Google Scholar]
- Besle J, Fischer C, Bidet-Caulet A, Lecaignard F, Bertrand O, Giard M-H (2008) Visual activation and audiovisual interactions in the auditory cortex during speech perception: intracranial recordings in humans. J Neurosci 28:14301–14310. 10.1523/JNEUROSCI.2875-08.2008 [DOI] [PMC free article] [PubMed] [Google Scholar]
- Bourguignon M, Baart M, Kapnoula EC, Molinaro N (2020) Lip-reading enables the brain to synthesize auditory features of unknown silent speech. J Neurosci 40:1053–1065. 10.1523/JNEUROSCI.1101-19.2019 [DOI] [PMC free article] [PubMed] [Google Scholar]
- Buzsáki G, Draguhn A (2004) Neuronal oscillations in cortical networks. Science 304:1926–1929. 10.1126/science.1099745 [DOI] [PubMed] [Google Scholar]
- Calvert GA, Bullmore ET, Brammer MJ, Campbell R, Williams SC, McGuire PK, Woodruff PW, Iversen SD, David AS (1997) Activation of auditory cortex during silent lipreading. Science 276:593–596. 10.1126/science.276.5312.593 [DOI] [PubMed] [Google Scholar]
- Canolty RT, Edwards E, Dalal SS, Soltani M, Nagarajan SS, Kirsch HE, Berger MS, Barbaro NM, Knight RT (2006) High gamma power is phase-locked to theta oscillations in human neocortex. Science 313:1626–1628. 10.1126/science.1128115 [DOI] [PMC free article] [PubMed] [Google Scholar]
- Carney LH, Yin TCT (1988) Temporal coding of resonances by low-frequency auditory nerve fibers: single-fiber responses and a population model. J Neurophysiol 60:1653–1677. 10.1152/jn.1988.60.5.1653 [DOI] [PubMed] [Google Scholar]
- Chandrasekaran C, Trubanova A, Stillittano S, Caplier A, Ghazanfar AA (2009) The natural statistics of audiovisual speech. PLoS Comput Biol 5:e1000436 10.1371/journal.pcbi.1000436 [DOI] [PMC free article] [PubMed] [Google Scholar]
- Crone NE, Miglioretti DL, Gordon B, Lesser RP (1998) Functional mapping of human sensorimotor cortex with electrocorticographic spectral analysis. II. Event-related synchronization in the gamma band. Brain 121:2301–2315. 10.1093/brain/121.12.2301 [DOI] [PubMed] [Google Scholar]
- Crosse MJ, Butler JS, Lalor EC (2015) Congruent visual speech enhances cortical entrainment to continuous auditory speech in noise-free conditions. J Neurosci 35:14195–14204. 10.1523/JNEUROSCI.1829-15.2015 [DOI] [PMC free article] [PubMed] [Google Scholar]
- Crosse MJ, Di Liberto GM, Lalor EC (2016) Eye can hear clearly now: inverse effectiveness in natural audiovisual speech processing relies on long-term crossmodal temporal integration. J Neurosci 36:9888–9895. 10.1523/JNEUROSCI.1396-16.2016 [DOI] [PMC free article] [PubMed] [Google Scholar]
- Dahl CD, Logothetis NK, Kayser C (2009) Spatial organization of multisensory responses in temporal association cortex. J Neurosci 29:11924–11932. 10.1523/JNEUROSCI.3437-09.2009 [DOI] [PMC free article] [PubMed] [Google Scholar]
- Desikan RS, Ségonne F, Fischl B, Quinn BT, Dickerson BC, Blacker D, Buckner RL, Dale AM, Maguire RP, Hyman BT, Albert MS, Killiany RJ (2006) An automated labeling system for subdividing the human cerebral cortex on MRI scans into gyral based regions of interest. Neuroimage 31:968–980. 10.1016/j.neuroimage.2006.01.021 [DOI] [PubMed] [Google Scholar]
- Di Liberto GM, Peter V, Kalashnikova M, Goswami U, Burnham D, Lalor EC (2018) Atypical cortical entrainment to speech in the right hemisphere underpins phonemic deficits in dyslexia. Neuroimage 175:70–79. 10.1016/j.neuroimage.2018.03.072 [DOI] [PubMed] [Google Scholar]
- Ding N, Simon JZ (2014) Cortical entrainment to continuous speech: functional roles and interpretations. Front Hum Neurosci 8:311. 10.3389/fnhum.2014.00311 [DOI] [PMC free article] [PubMed] [Google Scholar]
- Dubey A, Ray S (2019) Cortical electrocorticogram (ECoG) is a local signal. J Neurosci 39:4299–4311. 10.1523/JNEUROSCI.2917-18.2019 [DOI] [PMC free article] [PubMed] [Google Scholar]
- Dykstra AR, Chan AM, Quinn BT, Zepeda R, Keller CJ, Cormier J, Madsen JR, Eskandar EN, Cash SS (2012) Individualized localization and cortical surface-based registration of intracranial electrodes. Neuroimage 59:3563–3570. 10.1016/j.neuroimage.2011.11.046 [DOI] [PMC free article] [PubMed] [Google Scholar]
- Falchier A, Schroeder CE, Hackett TA, Lakatos P, Nascimento-Silva S, Ulbert I, Karmos G, Smiley JF (2010) Projection from visual areas V2 and prostriata to caudal auditory cortex in the monkey. Cereb Cortex 20:1529–1538. 10.1093/cercor/bhp213 [DOI] [PMC free article] [PubMed] [Google Scholar]
- Fischl B. (2012) FreeSurfer. Neuroimage 62:774–781. 10.1016/j.neuroimage.2012.01.021 [DOI] [PMC free article] [PubMed] [Google Scholar]
- Giordano BL, Ince RAA, Gross J, Schyns PG, Panzeri S, Kayser C (2017) Contributions of local speech encoding and functional connectivity to audio-visual speech perception. Elife 6:e24763 10.7554/eLife.24763 [DOI] [PMC free article] [PubMed] [Google Scholar]
- Giraud A-L, Poeppel D (2012) Cortical oscillations and speech processing: emerging computational principles and operations. Nat Neurosci 15:511–517. 10.1038/nn.3063 [DOI] [PMC free article] [PubMed] [Google Scholar]
- Golan T, Davidesco I, Meshulam M, Groppe DM, Mégevand P, Yeagle EM, Goldfinger MS, Harel M, Melloni L, Schroeder CE, Deouell LY, Mehta AD, Malach R (2016) Human intracranial recordings link suppressed transients rather than “filling-in” to perceptual continuity across blinks. Elife 5:e17243 10.7554/eLife.17243 [DOI] [PMC free article] [PubMed] [Google Scholar]
- Greenberg S, Carvey H, Hitchcock L, Chang S (2003) Temporal properties of spontaneous speech—a syllable-centric perspective. J Phon 31:465–485. 10.1016/j.wocn.2003.09.005 [DOI] [Google Scholar]
- Groppe DM, Urbach TP, Kutas M (2011a) Mass univariate analysis of event-related brain potentials/fields I: a critical tutorial review. Psychophysiology 48:1711–1725. 10.1111/j.1469-8986.2011.01273.x [DOI] [PMC free article] [PubMed] [Google Scholar]
- Groppe DM, Urbach TP, Kutas M (2011b) Mass univariate analysis of event-related brain potentials/fields II: simulation studies. Psychophysiology 48:1726–1737. 10.1111/j.1469-8986.2011.01272.x [DOI] [PMC free article] [PubMed] [Google Scholar]
- Groppe DM, Bickel S, Dykstra AR, Wang X, Mégevand P, Mercier MR, Lado FA, Mehta AD, Honey CJ (2017) iELVis: an open source MATLAB toolbox for localizing and visualizing human intracranial electrode data. J Neurosci Methods 281:40–48. 10.1016/j.jneumeth.2017.01.022 [DOI] [PubMed] [Google Scholar]
- Grossman S, Gaziv G, Yeagle EM, Harel M, Mégevand P, Groppe DM, Khuvis S, Herrero JL, Irani M, Mehta AD, Malach R (2019a) Convergent evolution of face spaces across human face-selective neuronal groups and deep convolutional networks. Nat Commun 10:1. 10.1038/s41467-019-12623-6 [DOI] [PMC free article] [PubMed] [Google Scholar]
- Grossman S, Yeagle EM, Harel M, Espinal E, Harpaz R, Noy N, Mégevand P, Groppe DM, Mehta AD, Malach R (2019b) The noisy brain: power of resting-state fluctuations predicts individual recognition performance. Cell Rep 29:3775–3784.e4. 10.1016/j.celrep.2019.11.081 [DOI] [PubMed] [Google Scholar]
- Guevara R, Velazquez JLP, Nenadovic V, Wennberg R, Senjanović G, Dominguez LG (2005) Phase synchronization measurements using electroencephalographic recordings: what can we really say about neuronal synchrony? Neuroinformatics 3:301–313. 10.1385/NI:3:4:301 [DOI] [PubMed] [Google Scholar]
- Jenkinson M, Beckmann CF, Behrens TEJ, Woolrich MW, Smith SM (2012) FSL. Neuroimage 62:782–790. 10.1016/j.neuroimage.2011.09.015 [DOI] [PubMed] [Google Scholar]
- Johnson JA, Zatorre RJ (2006) Neural substrates for dividing and focusing attention between simultaneous auditory and visual events. Neuroimage 31:1673–1681. 10.1016/j.neuroimage.2006.02.026 [DOI] [PubMed] [Google Scholar]
- Joshi A, Scheinost D, Okuda H, Belhachemi D, Murphy I, Staib LH, Papademetris X (2011) Unified framework for development, deployment and robust testing of neuroimaging algorithms. Neuroinformatics 9:69–84. 10.1007/s12021-010-9092-8 [DOI] [PMC free article] [PubMed] [Google Scholar]
- Kadipasaoglu CM, Forseth K, Whaley M, Conner CR, Rollo MJ, Baboyan VG, Tandon N (2015) Development of grouped icEEG for the study of cognitive processing. Front Psychol 6:1008. [DOI] [PMC free article] [PubMed] [Google Scholar]
- Kajikawa Y, Schroeder CE (2011) How local is the local field potential? Neuron 72:847–858. 10.1016/j.neuron.2011.09.029 [DOI] [PMC free article] [PubMed] [Google Scholar]
- Kayser C, Petkov CI, Logothetis NK (2008) Visual modulation of neurons in auditory cortex. Cereb Cortex 18:1560–1574. 10.1093/cercor/bhm187 [DOI] [PubMed] [Google Scholar]
- Kayser C, Montemurro MA, Logothetis NK, Panzeri S (2009) Spike-phase coding boosts and stabilizes information carried by spatial and temporal spike patterns. Neuron 61:597–608. 10.1016/j.neuron.2009.01.008 [DOI] [PubMed] [Google Scholar]
- Kayser C, Logothetis NK, Panzeri S (2010) Visual enhancement of the information representation in auditory cortex. Curr Biol 20:19–24. 10.1016/j.cub.2009.10.068 [DOI] [PubMed] [Google Scholar]
- Keitel A, Gross J, Kayser C (2018) Perceptually relevant speech tracking in auditory and motor cortex reflects distinct linguistic features. PLoS Biol 16:e2004473 10.1371/journal.pbio.2004473 [DOI] [PMC free article] [PubMed] [Google Scholar]
- Lakatos P, Shah AS, Knuth KH, Ulbert I, Karmos G, Schroeder CE (2005) An oscillatory hierarchy controlling neuronal excitability and stimulus processing in the auditory cortex. J Neurophysiol 94:1904–1911. 10.1152/jn.00263.2005 [DOI] [PubMed] [Google Scholar]
- Lakatos P, Chen C-M, O'Connell MN, Mills A, Schroeder CE (2007) Neuronal oscillations and multisensory interaction in primary auditory cortex. Neuron 53:279–292. 10.1016/j.neuron.2006.12.011 [DOI] [PMC free article] [PubMed] [Google Scholar]
- Lakatos P, Karmos G, Mehta AD, Ulbert I, Schroeder CE (2008) Entrainment of neuronal oscillations as a mechanism of attentional selection. Science 320:110–113. 10.1126/science.1154735 [DOI] [PubMed] [Google Scholar]
- Lakatos P, O'Connell MN, Barczak A, Mills A, Javitt DC, Schroeder CE (2009) The Leading Sense: supramodal control of neurophysiological context by attention. Neuron 64:419–430. 10.1016/j.neuron.2009.10.014 [DOI] [PMC free article] [PubMed] [Google Scholar]
- Luo H, Poeppel D (2007) Phase patterns of neuronal responses reliably discriminate speech in human auditory cortex. Neuron 54:1001–1010. 10.1016/j.neuron.2007.06.004 [DOI] [PMC free article] [PubMed] [Google Scholar]
- Luo H, Liu Z, Poeppel D (2010) Auditory cortex tracks both auditory and visual stimulus dynamics using low-frequency neuronal phase modulation. PLoS Biol 8:e1000445 10.1371/journal.pbio.1000445 [DOI] [PMC free article] [PubMed] [Google Scholar]
- Macaluso E, Frith CD, Driver J (2000) Modulation of human visual cortex by crossmodal spatial attention. Science 289:1206–1208. 10.1126/science.289.5482.1206 [DOI] [PubMed] [Google Scholar]
- Makeig S, Debener S, Onton J, Delorme A (2004) Mining event-related brain dynamics. Trends Cogn Sci 8:204–210. 10.1016/j.tics.2004.03.008 [DOI] [PubMed] [Google Scholar]
- Martin S, Brunner P, Iturrate I, Millán J, del R, Schalk G, Knight RT, Pasley BN (2016) Word pair classification during imagined speech using direct brain recordings. Sci Rep 6:25803. 10.1038/srep25803 [DOI] [PMC free article] [PubMed] [Google Scholar]
- McGurk H, Macdonald J (1976) Hearing lips and seeing voices. Nature 264:746–811. 10.1038/264746a0 [DOI] [PubMed] [Google Scholar]
- Mégevand P, Groppe DM, Bickel S, Mercier MR, Goldfinger MS, Keller CJ, Entz L, Mehta AD (2017) The hippocampus and amygdala are integrators of neocortical influence: a corticocortical evoked potential study. Brain Connect 7:648–660. 10.1089/brain.2017.0527 [DOI] [PMC free article] [PubMed] [Google Scholar]
- Mercier MR, Foxe JJ, Fiebelkorn IC, Butler JS, Schwartz TH, Molholm S (2013) Auditory-driven phase reset in visual cortex: human electrocorticography reveals mechanisms of early multisensory integration. Neuroimage 79:19–29. 10.1016/j.neuroimage.2013.04.060 [DOI] [PMC free article] [PubMed] [Google Scholar]
- Mercier MR, Molholm S, Fiebelkorn IC, Butler JS, Schwartz TH, Foxe JJ (2015) Neuro-oscillatory phase alignment drives speeded multisensory response times: an electro-corticographic investigation. J Neurosci 35:8546–8557. 10.1523/JNEUROSCI.4527-14.2015 [DOI] [PMC free article] [PubMed] [Google Scholar]
- Mercier MR, Bickel S, Megevand P, Groppe DM, Schroeder CE, Mehta AD, Lado FA (2017) Evaluation of cortical local field potential diffusion in stereotactic electro-encephalography recordings: a glimpse on white matter signal. Neuroimage 147:219–232. 10.1016/j.neuroimage.2016.08.037 [DOI] [PubMed] [Google Scholar]
- Mesgarani N, Chang EF (2012) Selective cortical representation of attended speaker in multi-talker speech perception. Nature 485:233–236. 10.1038/nature11020 [DOI] [PMC free article] [PubMed] [Google Scholar]
- Micheli C, Schepers IM, Ozker M, Yoshor D, Beauchamp MS, Rieger JW (2020) Electrocorticography reveals continuous auditory and visual speech tracking in temporal and occipital cortex. Eur J Neurosci 51:1364–1376. 10.1111/ejn.13992 [DOI] [PMC free article] [PubMed] [Google Scholar]
- Miller LM, D'Esposito M (2005) Perceptual fusion and stimulus coincidence in the cross-modal integration of speech. J Neurosci 25:5884–5893. 10.1523/JNEUROSCI.0896-05.2005 [DOI] [PMC free article] [PubMed] [Google Scholar]
- Nishitani N, Hari R (2002) Viewing lip forms: cortical dynamics. Neuron 36:1211–1220. 10.1016/s0896-6273(02)01089-9 [DOI] [PubMed] [Google Scholar]
- O'Sullivan AE, Crosse MJ, Di Liberto GM, Lalor EC (2016) Visual cortical entrainment to motion and categorical speech features during silent lipreading. Front Hum Neurosci 10:679. [DOI] [PMC free article] [PubMed] [Google Scholar]
- O'Sullivan JA, Power AJ, Mesgarani N, Rajaram S, Foxe JJ, Shinn-Cunningham BG, Slaney M, Shamma SA, Lalor EC (2015) Attentional selection in a cocktail party environment can be decoded from single-trial EEG. Cereb Cortex 25:1697–1706. 10.1093/cercor/bht355 [DOI] [PMC free article] [PubMed] [Google Scholar]
- Oostenveld R, Fries P, Maris E, Schoffelen J-M (2011) FieldTrip: open source software for advanced analysis of MEG EEG, and invasive electrophysiological data. Comput Intell Neurosci 2011:156869. 10.1155/2011/156869 [DOI] [PMC free article] [PubMed] [Google Scholar]
- Ozker M, Yoshor D, Beauchamp MS (2018) Frontal cortex selects representations of the talker's mouth to aid in speech perception. Elife 7:e30387 10.7554/eLife.30387 [DOI] [PMC free article] [PubMed] [Google Scholar]
- Park H, Kayser C, Thut G, Gross J (2016) Lip movements entrain the observers' low-frequency brain oscillations to facilitate speech intelligibility. Elife 5:e14521. 10.7554/eLife.14521 [DOI] [PMC free article] [PubMed] [Google Scholar]
- Park H, Ince RAA, Schyns PG, Thut G, Gross J (2018) Representational interactions during audiovisual speech entrainment: redundancy in left posterior superior temporal gyrus and synergy in left motor cortex. PLoS Biol 16:e2006558. 10.1371/journal.pbio.2006558 [DOI] [PMC free article] [PubMed] [Google Scholar]
- Perrodin C, Kayser C, Logothetis NK, Petkov CI (2015) Natural asynchronies in audiovisual communication signals regulate neuronal multisensory interactions in voice-sensitive cortex. Proc Natl Acad Sci U S A 112:273–278. 10.1073/pnas.1412817112 [DOI] [PMC free article] [PubMed] [Google Scholar]
- Ray S, Crone NE, Niebur E, Franaszczuk PJ, Hsiao SS (2008) Neural correlates of high-gamma oscillations (60-200 Hz) in macaque local field potentials and their potential implications in electrocorticography. J Neurosci 28:11526–11536. 10.1523/JNEUROSCI.2848-08.2008 [DOI] [PMC free article] [PubMed] [Google Scholar]
- Riecke L, Formisano E, Sorger B, Başkent D, Gaudrain E (2018) Neural entrainment to speech modulates speech intelligibility. Curr Biol 28:161–169.e5. 10.1016/j.cub.2017.11.033 [DOI] [PubMed] [Google Scholar]
- Schaer M, Bach Cuadra M, Tamarit L, Lazeyras F, Eliez S, Thiran JP (2008) A Surface-based approach to quantify local cortical gyrification. IEEE Trans Med Imaging 27:161–170. 10.1109/TMI.2007.903576 [DOI] [PubMed] [Google Scholar]
- Schepers IM, Yoshor D, Beauchamp MS (2015) Electrocorticography reveals enhanced visual cortex responses to visual speech. Cereb Cortex 25:4103–4110. 10.1093/cercor/bhu127 [DOI] [PMC free article] [PubMed] [Google Scholar]
- Schroeder CE, Lakatos P (2009) Low-frequency neuronal oscillations as instruments of sensory selection. Trends Neurosci 32:9–18. 10.1016/j.tins.2008.09.012 [DOI] [PMC free article] [PubMed] [Google Scholar]
- Schroeder CE, Mehta AD, Givre SJ (1998) A spatiotemporal profile of visual system activation revealed by current source density analysis in the awake macaque. Cereb Cortex 8:575–592. 10.1093/cercor/8.7.575 [DOI] [PubMed] [Google Scholar]
- Schroeder CE, Lindsley RW, Specht C, Marcovici A, Smiley JF, Javitt DC (2001) Somatosensory input to auditory association cortex in the macaque monkey. J Neurophysiol 85:1322–1327. 10.1152/jn.2001.85.3.1322 [DOI] [PubMed] [Google Scholar]
- Schroeder CE, Lakatos P, Kajikawa Y, Partan S, Puce A (2008) Neuronal oscillations and visual amplification of speech. Trends Cogn Sci 12:106–113. 10.1016/j.tics.2008.01.002 [DOI] [PMC free article] [PubMed] [Google Scholar]
- Schwartz J-L, Savariaux C (2014) No, there is no 150 ms lead of visual speech on auditory speech, but a range of audiovisual asynchronies varying from small audio lead to large audio lag. PLoS Comput Biol 10:e1003743. 10.1371/journal.pcbi.1003743 [DOI] [PMC free article] [PubMed] [Google Scholar]
- Senkowski D, Gomez-Ramirez M, Lakatos P, Wylie GR, Molholm S, Schroeder CE, Foxe JJ (2007) Multisensory processing and oscillatory activity: analyzing non-linear electrophysiological measures in humans and simians. Exp Brain Res 177:184–195. 10.1007/s00221-006-0664-7 [DOI] [PubMed] [Google Scholar]
- Shah AS, Bressler SL, Knuth KH, Ding M, Mehta AD, Ulbert I, Schroeder CE (2004) Neural dynamics and the fundamental mechanisms of event-related brain potentials. Cereb Cortex 14:476–483. 10.1093/cercor/bhh009 [DOI] [PubMed] [Google Scholar]
- Shannon RV, Zeng FG, Kamath V, Wygonski J, Ekelid M (1995) Speech recognition with primarily temporal cues. Science 270:303–304. 10.1126/science.270.5234.303 [DOI] [PubMed] [Google Scholar]
- Smiley JF, Falchier A (2009) Multisensory connections of monkey auditory cerebral cortex. Hear Res 258:37–46. 10.1016/j.heares.2009.06.019 [DOI] [PMC free article] [PubMed] [Google Scholar]
- Sumby WH, Pollack I (1954) Visual contribution to speech intelligibility in noise. J Acoust Soc Am 26:212–215. 10.1121/1.1907309 [DOI] [Google Scholar]
- Vander Ghinst M, Bourguignon M, Op de Beeck M, Wens V, Marty B, Hassid S, Choufani G, Jousmäki V, Hari R, Van Bogaert P, Goldman S, De Tiège X (2016) Left superior temporal gyrus is coupled to attended speech in a cocktail-party auditory scene. J Neurosci 36:1596–1606. 10.1523/JNEUROSCI.1730-15.2016 [DOI] [PMC free article] [PubMed] [Google Scholar]
- Zaveri HP, Duckrow RB, Spencer SS (2006) On the use of bipolar montages for time-series analysis of intracranial electroencephalograms. Clin Neurophysiol 117:2102–2108. 10.1016/j.clinph.2006.05.032 [DOI] [PubMed] [Google Scholar]
- Zion Golumbic EM, Poeppel D, Schroeder CE (2012) Temporal context in speech processing and attentional stream selection: a behavioral and neural perspective. Brain Lang 122:151–161. 10.1016/j.bandl.2011.12.010 [DOI] [PMC free article] [PubMed] [Google Scholar]
- Zion Golumbic E, Cogan GB, Schroeder CE, Poeppel D (2013a) Visual input enhances selective speech envelope tracking in auditory cortex at a “cocktail party. J Neurosci 33:1417–1426. 10.1523/JNEUROSCI.3675-12.2013 [DOI] [PMC free article] [PubMed] [Google Scholar]
- Zion Golumbic EM, Ding N, Bickel S, Lakatos P, Schevon CA, McKhann GM, Goodman RR, Emerson R, Mehta AD, Simon JZ, Poeppel D, Schroeder CE (2013b) Mechanisms underlying selective neuronal tracking of attended speech at a “cocktail party. Neuron 77:980–991. 10.1016/j.neuron.2012.12.037 [DOI] [PMC free article] [PubMed] [Google Scholar]
- Zoefel B, Archer-Boyd A, Davis MH (2018) Phase entrainment of brain oscillations causally modulates neural responses to intelligible speech. Curr Biol 28:401–408.e5. 10.1016/j.cub.2017.11.071 [DOI] [PMC free article] [PubMed] [Google Scholar]
Associated Data
This section collects any data citations, data availability statements, or supplementary materials included in this article.
Data Availability Statement
Data and custom-made software are available on request from Pierre Mégevand (pierre.megevand@unige.ch).