

Abstract
Organelle crosstalk is vital for cellular functions. The propinquity of mitochondria, ER, and plasma membrane promote regulation of multiple functions, which include intracellular Ca2+ flux, and cellular biogenesis. Although the purposes of apposing mitochondria and ER have been described, an understanding of altered organelle connectomics related to disease states is emerging. Since inner ear outer hair cell (OHC) degeneration is a common trait of age-related hearing loss, the objective of this study was to investigate whether the structural and functional coupling of mitochondria with subsurface cisternae (SSC) was affected by aging. We applied functional and structural probes to equal numbers of male and female mice with a hearing phenotype akin to human aging. We discovered the polarization of cristae and crista junctions in mitochondria tethered to the SSC in OHCs. Aging was associated with SSC stress and decoupling of mitochondria with the SSC, mitochondrial fission/fusion imbalance, a remarkable reduction in mitochondrial and cytoplasmic Ca2+ levels, reduced K+-induced Ca2+ uptake, and marked plasticity of cristae membranes. A model of structure-based ATP production predicts profound energy stress in older OHCs. This report provides data suggesting that altered membrane organelle connectomics may result in progressive hearing loss.
Keywords: calcium homeostasis, deafness, hearing loss, inner ear, mitochondria, outer hair cells
Significance Statement
We address the question, “Do aged OHCs exhibit detectable changes in organelle connectomics that would help us better understand human hearing loss in a relevant mouse model?” Because of the close association of mitochondria SSC over much of the outer hair cell (OHC) inner surface, mitochondria-subsurface cisternae (SSC) connectomics appears to play a central role in hearing. In polarized cells such as OHCs, where there is functional segregation of apical versus basal regions, the relationship between altered organelle connectomics and hearing loss is unknown. We propose a mechanism of mitochondria-SSC dysregulation related to aging and OHC degeneration, showing distinct altered mitochondrial and cytoplasmic Ca2+ regulation, mitochondrial polarization, and fission/fusion imbalance, mitochondrial-SSC decoupling, and SSC and cellular energy stress.
Introduction
Age-related hearing loss (ARHL) is prevalent in mammalian aging and is the most common sensory disorder in the elderly (Gates and Mills, 2005; Ohlemiller, 2006; Keithley, 2020). The outer hair cell (OHC), the cochlear amplifier, is one of the most vulnerable cells that degenerate in hearing loss (HL) (Schuknecht and Gacek, 1993). OHC metabolism is primarily aerobic (Puschner and Schacht, 1997); thus, its fate is dependent on mitochondrial function. OHCs also require mitochondria to facilitate ion transport contributing to mechanoelectrical transduction (Spicer et al., 1998; Keithley, 2020). Several ARHL syndromes result from defects in mitochondria (Someya and Prolla, 2010). Aged human cochleae have mitochondrial (mt) DNA damage (Bai et al., 1997; Fischel-Ghodsian et al., 1997; Markaryan et al., 2009). In mouse models of ARHL, specific mutations in mtDNA or nuclear-encoded DNA for mitochondrial proteins increased oxidative damage, resulting in cochlear hair cell loss during aging, causing HL (Yamasoba et al., 2007; Someya et al., 2008, 2009; Someya and Prolla, 2010; Han and Someya, 2013; Chen and Tang, 2014; Fujimoto and Yamasoba, 2014). Yet, the role of mitochondria in ARHL may be more complicated than DNA mutations or deletions or excess ROS generated by mitochondria (Bottger and Schacht, 2013; Tavanai and Mohammadkhani, 2017).
The OHC lateral wall is more structurally rich than previously appreciated (Triffo et al., 2019). In addition to playing a role in Ca2+ homeostasis (Fuchs et al., 2014; Raffaello et al., 2016), the subsurface cisternae (SSC) facilitates the rapid delivery of voltage excitation to the molecular motors, including prestin, within the lateral wall (Song et al., 2013). The unusually high SSC conductivity is expected to depend on locally available energy. The mechanical connections between the plasma membrane, SSC, and the cytoskeleton provide a membrane-cytoskeletal framework to aid energy flux, facilitating electromotility (Triffo et al., 2019). We surmise that the distinct propinquity between OHC mitochondria and the SSC has functional relevance that, when disrupted, will lead to OHC dysfunction.
In the OHC, a distinct class of mitochondria is positioned next to the SSC, and within these mitochondria are cristae whose number and shape are integral to mitochondrial respiratory capacity and whose structural dynamics are influenced by the energetic demands of the cell (Cogliati et al., 2013). At the peripheral end of a crista is the crista junction, a fine, neck-like structure that partitions vital mitochondrial reactions and its dynamic nature is precisely regulated by diverse signals impinging on mitochondria (Perkins et al., 2009; Zerbes et al., 2012; Rampelt et al., 2017a; Schorr and van der Laan, 2018; Tsai et al., 2018). The maintenance and plasticity of crista junctions are essential for cellular homeostasis in vivo. Crista junction dysfunction leads to defects in mtDNA organization and transcription and altered respiratory activity. The effect has been reported in frontotemporal dementia, amyotrophic lateral sclerosis, Type 1 diabetes mellitus, and diabetic cardiomyopathy (van der Laan et al., 2016; Wollweber et al., 2017). Moreover, the structural and functional coupling between mitochondrial cristae and crista junctions and the adjacent SSC has been unexplored.
Critical functional assays supported by three-dimensional electron microscopy (3DEM) were used to study CBA/CaJ mice, whose age of onset of ARHL can be correlated to an equivalent human age (Zheng et al., 1999). Aging increased thresholds of both the auditory brainstem response (ABR) and distortion product otoacoustic emissions (DPOAE), indicating OHC malfunction, which correlated to pathologic markers and reduced mitochondrial and cytoplasmic Ca2+ levels and responsiveness. Older (24 month) mitochondria were depolarized, and the number of dynamin-related protein (Drp1) RNA, but not optic atrophy 1 (Opa1) RNA was significantly reduced compared with young OHCs, indicating a downregulation of mitochondrial fission. Cristae and crista junctions were polarized toward the SSC. SSC stress and lowered modeled mitochondrial energy production in aged OHCs may contribute to functional cellular stress and the observed death of OHCs in CBA/CaJ mice.
Materials and Methods
ABR and DPOAE measurements
ABR experiments were performed as previously published by our group (Reijntjes et al., 2019). All animal experimentation was conducted following SfN’s Policies on the Use of Animals in Neuroscience Research. Equal numbers of males and females were used in the experiments. In cases where odd numbers are reported, females outnumbered male samples. Briefly, mice were anesthetized with tribromoethanol (Avertin; Sigma Millipore), using 0.5 mg/g body weight, injected intraperitoneally. The mice were then placed in a sound-attenuated chamber on a custom holder. Body temperature was maintained at 36.5 ± 0.5°C using a homeothermic blanket control unit (Harvard Apparatus) and rectal probe feedback. Ground and recording electrodes were placed subcutaneously in the scalp, and a calibrated transducer (Intelligent Hearing Systems) placed in the right pinna. At a rate of 20 Hz, with intensity from 0 to 100 dB sound pressure level (SPL; rms for click stimuli) in 10 dB increments, 0.1 ms broadband clicks, and 3 ms pure tone pips at 8, 16, and 32 kHz were presented. The ABR activity was extracted from 128 to 1024 stimuli. The hearing threshold was defined as the minimum sound intensity that elicited a characteristic ABR waveform.
For DPOAE experiments, mice were anesthetized with Avertin as for ABR measurements. After visual inspection to ensure adequate health of external and middle ear was performed, the mice were placed in a sound-attenuated chamber, and a dual acoustic probe/microphone assembly (Etymotic Research) was placed in the ear. Primary tones with an f2/f1 ratio of 1.25 were presented at equal sound pressure levels at 55, 65, and 75 dB SPL over 92 ms, and tones were routed to independent transducers and allowed to mix acoustically in the ear canal. The SPL was sampled and synchronously averaged by a digital signal processor for geometric mean frequencies <20.1 kHz. Above 20.1 kHz, the sampling input was automatically switched to the dynamic signal analyzer for frequency analysis to avoid DSP aliasing artifacts >22.1 kHz. Cubic (2f1–f2) DPOAE levels and corresponding noise floor levels were calculated. DPOAE levels were plotted as a function of the primary tones’ geometric mean frequency. DP thresholds were generated for each stimulus level and were evaluated relative to the noise floor (DPOAE > 5 dB above the noise floor).
Mitochondrial membrane potential
Semi-intact, viable epithelia were dissected from 3, 15, and 24 month mice. Any potential trauma caused by dissection was evaluated using tight-seal current- and voltage-clamp recordings of resting membrane potential, and K+ currents as well as nonlinear capacitance recordings. The 24 month cochleae were tested because this age would be the most vulnerable to dissection trauma. Bicarbonate buffered bath solution containing 3 mm glutathione and continuously perfused with 5% CO2, and 95% O2 sufficed to maintain stable resting membrane potentials in apical OHCs; 3 month = −52 ± 12 mV (n = 87 OHCs from 35 cochleae), 15 month = −48 ± 14 mV (n = 25 OHCs from 10 cochleae), and 24 month = −49 ± 10 mV (n = 49 OHCs from 14 cochleae). The resting membrane potentials were recorded after 2–3 min after whole-cell configuration. The values were comparable to previous reports from OHCs in the gerbil and guinea pig (He and Dallos, 1999a,b). Only apical OHCs had resting membrane potentials that lasted for ∼20–25 min after whole-cell patches were raptured. OHCs from the apical segments of the cochlea were used for these sets of experiments. Because OHCs at the edge of the severed epithelium may have been damaged, recordings were also only performed from OHCs with intact surrounding supporting cells.
Tetramethylrhodamine, methyl ester (TMRM), was prepared and loaded in isolated organs of Corti from CBA/CaJ mice according to the manufacturer’s protocol (Thermo Fisher Scientific). High-magnification confocal images were collected at 2.5 s time intervals using a SP8 confocal microscope (Leica Microsystems) with a 63× oil immersion lens under the control of LAS X software. The TMRM signal with an absorbance peak at 548 nm and an emission peak at 574 nm was captured with an RFP/TRITC filter. Ptrifluoromethoxycarbonyl cyanide phenyl hydrazone (FCCP) (1 mm) was added 10 min into the imaging as a pharmacologic control because there should be no detectable TMRM signal from mitochondria completely depolarized using FCCP.
Single-molecule FISH (smFISH) with RNAscope
Mice (ages 3, 15, 18, and 24 months) were anesthetized with ketamine (100 mg/kg) and xylazine (10 mg/kg) and then transcardially perfused with diethylpyrocarbonate (DEPC)-treated PBS and 4% PFA in 0.1 m phosphate buffer. Cochleae were harvested and kept in a 4% PFA solution (DEPC-treated) overnight on a shaker at 4°C. The cochleae were washed with PBS, and decalcified in 0.35 m EDTA for 5-7 d, depending on age, on a shaker at 4°C and washed with PBS. The cochleae were sequentially dehydrated in 10%, 20%, and 30% sucrose solution at 4°C for 1 h, 2 h, and overnight, respectively. The cochleae were processed as whole-mount preparation or transferred into optimal cutting temperature compound for a minimum of 1 h at 4°C and then snapped frozen, using a dry ice-ethanol mixture. Samples were cryo-sectioned to a thickness of 12 μm, placed onto Superfrost slides, and stored at −80°C until further use.
Probe hybridization closely followed the manufacturer’s instructions (Advanced Cell Diagnostics). Sections were immersed in prechilled 4% PFA for 15 min at 4°C. The sections were dehydrated at room temperature in 50%, 70%, and 100% ethanol for 5 min each and allowed to dry for 1-2 min. Fixation and dehydration were followed by protease digestion, using Protease 4 for 30 min at room temperature. The sections were then incubated at 40°C with the following solutions: (1) target probe in hybridization buffer A for 3 h; (2) preamplifier in hybridization buffer B for 30 min; (3) amplifier in hybridization buffer B at 40°C for 15 min; and (4) label probe in hybridization buffer C for 15 min. After each hybridization step, the sections were washed with wash buffer 3 times at room temperature. For fluorescent detection, the label probe was conjugated to AlexaFluor-488. Probes for Drp1 and Opa1 and a blank negative control were obtained from Advanced Cell Diagnostics. Sequences of the target probes (for the specified genes), preamplifier, amplifier, and label probe are proprietary. Detailed information about the probe sequences can be obtained by signing a nondisclosure agreement provided by the manufacturer.
For subsequent immunofluorescent staining, sections were treated with 10% blocking solution for 10 min at room temperature, incubated with anti-myosin 7A (Novus Biological, 1:300 dilution), overnight at 4°C, washed with PBS 3 times for 5 min each, incubated with the appropriate AlexaFluor secondary antibody (Thermo Fisher Scientific) diluted 1:500 for 2 h at room temperature, and again washed with PBS 3 times for 5 min each. Incubation in DAPI solution for 15 s at room temperature was performed to label cell nuclei. Sections were then mounted in Fluoromount-G and sealed under a coverslip.
Confocal imaging and image analysis
Confocal micrographs were obtained as described previously (Reijntjes et al., 2019). To determine frequency regions, low-magnification micrographs of isolated organs of Corti were obtained using a DM4000B fluorescent microscope (Leica Microsystems). If necessary, the Stitching plugin in ImageJ was used to create a single montage image. Tonotopic maps were then overlaid on the image previously described in the place-frequency map of the mouse cochlea (Muller et al., 2005). High-magnification confocal micrographs were collected using a SP8 confocal microscope (Leica Microsystems) with a 63× oil immersion lens under the control of LAS X software. z stacks of the OHCs from the 8, 16, and 32 kHz regions were collected at a scan speed of 200 Hz and zoom of 1. The step size (optical section thickness) was determined by stepping at half the distance of the theoretical z axis resolution (the Nyquist sampling frequency). Images were acquired in a 1024 × 1024 raster (x = y = 184.52 μm) at subsaturating laser intensities for each channel. Images are presented as z projections through the collected optical stack. All quantitative image analysis was performed on the raw image stacks, without deconvolution, filtering, or γ correction. Individually fluorescently labeled mRNA transcripts appeared as puncta. To quantify the number of mRNA transcripts per OHC, individually fluorescently labeled mRNAs within a given FOV were counted using the spots function in Imaris 6.4 software (Bitplane). mRNA counts were normalized to the number of Myosin 7A-labeled OHCs marked manually in the same FOV.
Ca2+ imaging
Mice (ages 3 and 24 months) were deeply anesthetized with ketamine and xylazine mixture and decapitated. The cochleae from the apical aspects of the sensory epithelia were harvested in an oxygenated external solution containing 140 mm NaCl, 2 mm KCl, 10 mm glucose, 10 mm HEPES, 1.3 mm CaCl2, pH 7.35, osmolarity ∼290 mOsmol. The tissue was incubated in the oxygenated external solution containing the Ca2+ dye, Oregon Green 488 BAPTA-1, AM, cell-permeant (OGB) (20 mm) and TMRM according to the manufacturer’s protocol (Thermo Fisher Scientific; Invitrogen) and kept in the dark for 10 min. The OGB concentration and duration of incubation sufficed for dye diffusion into cellular organelles and subsequent esterification for monitoring cytoplasmic Ca2+. The OGB dye was chosen because a previous study showed that mitochondrial Ca2+concentration is high ∼220 nm (Ivannikov and Macleod, 2013). Therefore, we predicted that a high-affinity Ca2+ indicator would be appropriate for our measurements (Paredes et al., 2008). Also, using TMRM as a mitochondrial marker precludes the use of Ca2+ indicators, such as Rhod-2/Rhod-2 AM Thus, we selected OGB, which has been used to measure OHC Ca2+ previously (Yuan et al., 2010). The use of TMRM to mark mitochondria allowed for comparing the overlap of Ca2+ and mitochondrial fluorescent intensities in ROIs in the cytoplasm.
After a thorough washout, the preparation was transferred to a recording chamber under an upright microscope. The experimental chamber was perfused continuously and slowly with an oxygenated external solution at a rate that ensured stable optical recordings for ∼10–15 min. To make a reasonable comparison between the different ages, we focused on apical OHCs. At the beginning of each experiment, the structural preservation of the apical turn was assessed with low magnification and then zoomed in to record from single OHCs. High-magnification confocal images on single OHCs were collected at 2.5 s time intervals using a SP8 confocal microscope (Leica Microsystems) with a 60× water-immersion lens under the control of LAS X software. The TMRM signal with an absorbance peak at 548 nm and an emission peak at 574 nm was captured with an RFP/TRITC filter. For OGB Ca2+ imaging, the experiments were performed using an excitation wavelength of 488 nm, and emission was detected at 510 nm. The image processing software allowed for the recording of a selection of an ROI, in this case, the outline of OHCs excluding the hair bundles. The resolution of imaging was insufficient to assess hair bundle Ca2+ accurately. Since OGB is not a ratiometric Ca2+ indicator, we could not assess the absolute, but rather the relative intracellular Ca2+ levels. The preparation was treated with either low or high Ca2+ solution in the presence of the Ca2+ ionophore A23187 (20 μm). The low Ca2+ solution contained 140 mm NaCl, 2 mm KCl, 10 mm glucose, 10 mm HEPES, 1.85 mm CaCl2, 5.5 mm EGTA, pH 7.3, osmolarity ∼290 mOsmol. The high Ca2+ solution contained 140 mm NaCl, 2 mm KCl, 10 mm glucose, 10 mm HEPES, 2.35 mm CaCl2, 2.25 mm EGTA, pH 7.3, osmolarity ∼290 mOsmol. The Maxcheletor software (https://somapp.ucdmc.ucdavis.edu/pharmacology/bers/maxchelator/CaEGTA-TS.htm) was used to estimate free Ca2+ in low and high Ca2+ solutions. The Ca2+ fluorescence intensity values for mitochondria (using TMRM signal regions) were measured at 15 s time points before and during bath perfusion of external high K+ (at t = 10 s) solution, 122 mm NaCl, 20 mm KCl, 10 mm glucose, 10 mm HEPES, 1.3 mm CaCl2, pH 7.35, osmolarity ∼290 mOsmol and after changing solution to low K+ (5 mm KCl) (at t = 75s). After washout with normal external K+ solution (5 mm KCl), ∼25% (89 of 359 OHCs) did not recover from the increased fluorescent intensity. OHCs that underwent an irreversible rise in Ca2+ were not included in the data analyses. ΔF/F0 = [F(t) − F (0)]/F(0), t is time, F(t) is fluorescence following stimulation (external K+) and F(0) is the prestimulus fluorescence computed from the mean of 5–7 images. F(t) and F(0) were corrected for background fluorescence. A 2-D median filter was used to produce 512 pseudo-color indexed images.
Transmission electron microscopy
The cochlea was isolated, and the perilymph perfused with 1% osmium tetroxide ferricyanide and1% PFA in 0.1 m cacodylate buffer, pH 7.4. They were then immersed in the fixative (30 min, 23°C) and rinsed in the buffer followed by en bloc post-staining with 1% uranyl acetate and Walton’s lead aspartate to enhance contrast. The cochleae were decalcified (120 mm EDTA, 23°C), dehydrated in an ethanol series, and embedded in epoxy resin (Embed 812, EMS). The cochleae were bisected along the modiolus and re-embedded. One-half of the cochlea was sent to National Center for Microscopy and Imaging Research for EM tomography. Mid-modiolar cochlear sections (70 nm) mounted on copper hex grids were obtained from the remaining half cochlea, stained (uranyl acetate-lead citrate), and viewed. Images from the upper basal turn (∼28–32 kHz) were collected and archived using a JEOL 1200 EX transmission electron microscope (JEOL) equipped with an AMT 8-megapixel digital camera and AMT Image Capture Engine V602 software (Advanced Microscopy Techniques). Final figures were assembled using Adobe Photoshop and Illustrator software (Adobe Systems).
Electron microscope tomography
The principles and procedures of EM tomography described previously (Perkins et al., 2015; Sastri et al., 2017) were practiced. Sections from blocks of cochleae upper basal turn sent from tissue processed at Washington University from each age group were cut at a thickness of 400 nm. For each tomographic reconstruction, a double-tilt series of images at 1 degree tilt increment was collected with an FEI titan hi-base electron microscope operated at 300 kV. Images were recorded with a Gatan 4Kx4K CCD camera. The magnification was 11,000×, and the pixel resolution was 0.81 nm. The IMOD software package (https://en.wikipedia.org/wiki/IMOD) was used for alignment, reconstruction, and volume segmentation. R-weighted back projection was used to generate the reconstructions. Samples from 6 animals were used for 3 months and 15 months, and samples from 3 animals were used for 18 months and 24 months. Nine tomographic volumes were generated for 3, 15, and 18 months. Eleven tomographic volumes were generated for 24 months. Each volume had nearly 200 x–y planes and had a size of ∼3.4 µm3. Volume segmentation of the mitochondria, SSC, and their tethers was performed by tracing of membranes in each of the 1.62-nm-thick x-y planes that they appeared to create stacks of contours with the Drawing Tools plug-in in IMOD. Because the mitochondrial membrane profiles did not vary much from plane to plane, the Interpolator plug-in in IMOD was used to accelerate the segmentation of surfaces by automatically generating interpolated contours between user-defined key contours that were manually traced. By using key contours about every 5 planes, accurate membrane segmentation was achieved by generating interpolated contours with straight lines between key contours in each in-between plane. Although the interpolator plug-in was also used to segment the SSC, more manual tracing was required because the SSC meshwork changed more from plane to plane. The mitochondrial-SSC tethers were modeled as rods with a diameter of 10 nm thick, and the crista junctions were modeled as either spheres or tubes with 14 nm diameter. The traced contours were then surface-rendered by turning contours into meshes to generate a 3D model. The mitochondrial reconstructions and surface-rendered volumes were visualized using 3DMOD. Measurements of mitochondrial outer, inner boundary, and cristae membrane surface areas and volumes were made within segmented volumes using IMODinfo. Mitochondrial profile area, volume density (defined as the volume occupied by mitochondria divided by the cytoplasmic volume), number per area, crista density, and crista junction diameter were measured using ImageJ. Crista polarization was determined for each age by using the angle measurement tool in ImageJ with one side along the long axis of a crista and the other side along the SSC chosen so that only acute angles were measured. The measurements were sorted into 10 degree bins from 0 to 90 degrees. Based on visual inspection of many OHC mitochondria, angles >70 degrees were considered as demonstrating cristae alignment facing the SSC (for measurement, see, e.g., Fig. 6A). The degree of polarity was defined as the percent of measures with angles >70 degrees divided by the percent of measurements expected in this angular range if the cristae were randomly oriented. A χ2 test was used to test the null hypothesis of random cristae orientation. Movies of the tomographic and surface-rendered volumes were made using the IMOD movie.
Figure 6.
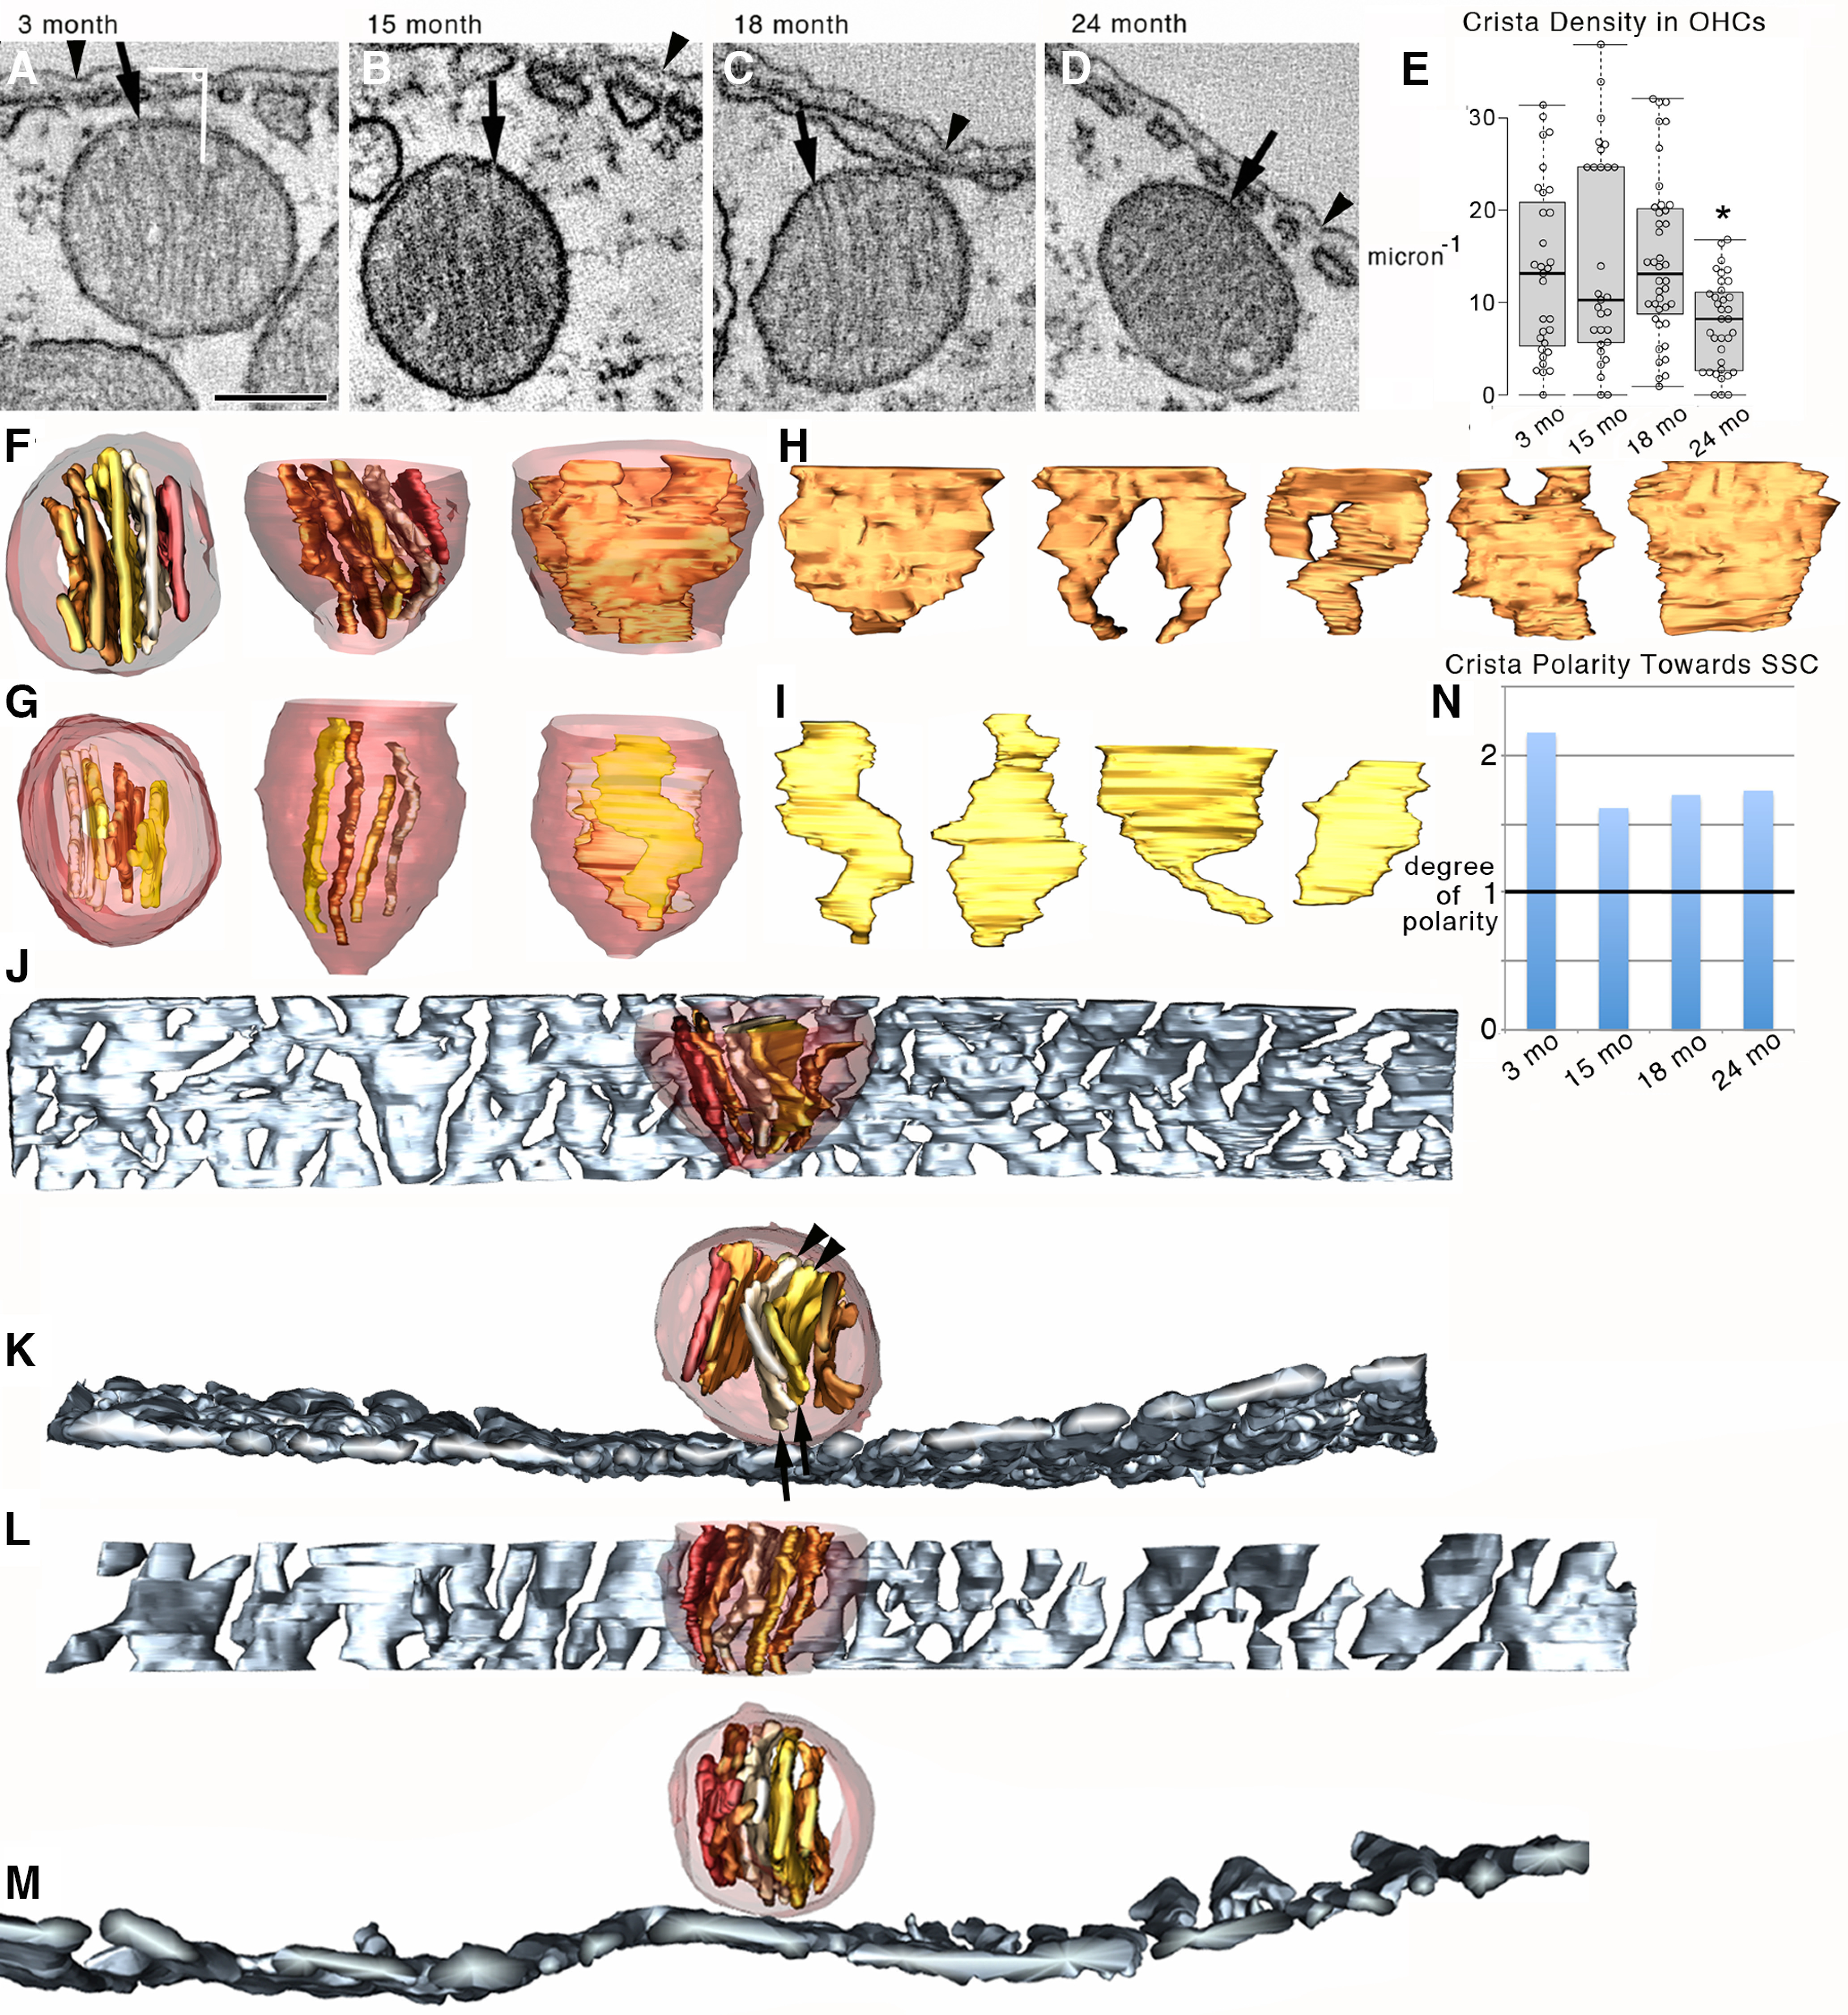
Cristae tended to be polarized toward the SSC in the OHC at all ages examined. A–D, 3DEM shows that OHC mitochondria have lamellar cristae. The density of cristae appeared similar at 3, 15, and 18 months, yet lower at 24 months. Shown are 1.6-nm-thick slices near the middle of each tomographic volume. Arrowheads indicate the lateral plasma membrane for positional reference. Arrows indicate crista junctions. White line segments and angle symbol represent the method for measuring crista polarization toward the SSC as used for N. Scale bar: A–D, 200 nm. E, The crista density was significantly lower for 24 month OHC mitochondria. n = 32, 29, 40, and 32 mitochondria for 3, 15, 18, and 24 months, respectively, from 3 mice per age group. Each data point is represented by a circle. The box-and-whisker plots show median, quartiles min and max. *p = 0.0040, 0.0035, 4.5 × 10⁻⁴ comparing 24 months with 3, 15, and 18 months, respectively. F, Orthogonal views (top → side → side perpendicular) of a surface-rendered mitochondrial volume from an 18 month OHC show the extent the cristae occupy the volume and cristae orientation. Transparent maroon represents outer membrane. Shades of brown represent cristae. G, Orthogonal views of a surface-rendered 24 month mitochondrial volume show a similar orientation, but that the cristae occupy less of the mitochondrial volume compared with the 18 month example. H, All 5 cristae from the 18 month mitochondrion displayed in the same orientation to show their shape and size. I, All 4 cristae from the 24 month mitochondrion displayed in the same orientation to demonstrate that they are smaller and fewer in number compared with the 18 month example, revealing how the crista density has been reduced at 24 months. J, Side view of a surface-rendered 3 month mitochondrial volume shown with the surface-rendered SSC closest to the mitochondrion (slate gray). K, Top view of the same volume showing that the cristae align so that one end tends to face the SSC. Sometimes, when the cristae orient in a direction pointing away from the SSC at the far end (arrowheads), they will curve back to align facing the SSC at the near end (arrows). L, M, Side and top views of a surface-rendered 18 month volume showing the near-perfect alignment of cristae facing the SSC. N, The degree of polarity (see Materials and Methods) shows significant polarization of cristae toward the SSC in mitochondria adjacent to it for all ages with the strongest value (>2) for 3 months. The black line at “1” signifies a random orientation. For reference, the degree of polarity values close to zero would indicate an opposite cristae polarization (e.g., the cristae orientation in Fig. 7C). χ2 test p = 1.1 × 10⁻⁵, 0.0013, 0.029, and 0.0014 for 3, 15, 18, and 24 months, respectively (3 mice per age group), showing a >95% confidence level of nonrandom orientation of cristae with respect to the SSC for mitochondria positioned near it.
Energy calculations
Models of mitochondrial ATP output have lacked structurally realistic input based on 3DEM. The biophysical modeling schema of Song et al. (2013) made steps to remedy this problem by using spatially accurate geometric representations of a crista, inner boundary membrane, and crista junction. From physical principles, this modeling predicted the higher proton motive force on cristae membranes, the effect of crista surface-to-volume ratio on this force, and the effect of crista membrane surface area on the rate of ATP synthesis, all integral to the current paradigm of mitochondrial structure/function relations. We applied this modeling approach to predict ATP production for SSC and PM functions at the lateral wall (graphic associated with Table 1).
Table 1.
Mitochondrial ATP and energy production in aging OHC.
| Mouse age (mo) | Crista Shape Factora | ATP/s/Mitob | Power/Mito Volc | Mito no.d | ATP/se | ATP/s/CJf |
|---|---|---|---|---|---|---|
| 3 | 0.16 ± 0.020 | 6.0 ± 0.75 × 10⁵ | 2.1 ± 0.26 × 10⁻¹² | 272 ± 75 | 1.6 × 10⁸ | 3.2 × 10⁴ |
| 15 | 0.17 ± 0.024 | 6.2 ± 0.88 × 10⁵ | 2.3 ± 0.33 × 10⁻¹² | 263 ± 51 | 1.6 × 10⁸ | 3.4 × 10⁴ |
| 18 | 0.17 ± 0.018 | 9.1 ± 1.0 × 10⁵ | 2.3 ± 0.25 × 10⁻¹² | 228 ± 46 | 2.1 × 10⁸ | 4.3 × 10⁴ |
| 24 | 0.12 ± 0.014 | 4.0 ± 0.45 × 10⁵* | 1.2 ± 0.14 × 10⁻¹²* | 171 ± 71** | 0.68 × 10⁸*** | 3.4 × 10⁴ |
Crista surface area divided by crista volume. Data are mean ± SEM. Units: nm−1. n = 31, 29, 30, and 34 mitochondria for 3, 15, 18, and 24 months, respectively, using 3 mice per age. These numbers also apply to the next 2 columns. p = 0.041 between 24 and 18 months. Other pairings were not significantly different.
Number of ATP molecules produced per second per mitochondrion. Data are mean ± SEM.
Energy per second, i.e., power (J/s = Watt) produced in the form of ATP hydrolysis per a mitochondrial volume of 1 μm3. Data are mean ± SEM. Units: J/s/μm3.
Number of mitochondria. Data are mean ± SD. n = 14, 12, 13, and 10 OHCs for 3, 15, 18, and 24 months, respectively using 3 mice per age.
Number of ATP molecules produced per second by the complement of mitochondria adjacent to the lateral SSC. Calculated by multiplying the entries in the second column with the entries in the fourth column.
Number of ATP molecules flowing through a crista junction per second calculated by dividing the values in the second column (ATP/s/Mito) by the mean value of the number of crista junctions per mitochondrion provided (mean ± SEM) as follows: 19 ± 1.5, 19 ± 1.9, 21 ± 2.7, and 12 ± 2.2. n = 10. p = 0.024, 0.043, and 0.018 comparing 24 months with 3, 15, and 18 months, respectively. Calculated ATP values are not significantly different between ages. Shown is an illustration of the mitochondrial ATP stream (Extended data Table 1-1).
*p = 0.00045, 0.0035, and 0.0040 between 24 and 18, 15, and 3 months, respectively.
**R = 0.049, 0.039 between 24 months and 3 and 15 months, respectively.
***R = 0.00018, 0.00067, and 0.00092 between 24 months and 18, 15, and 3 months, respectively.
Measurements of the crista shape factor, defined as the crista membrane surface area divided by the crista volume, were made from 3DEM mitochondrial volumes using ImageJ tools. The rate of ATP production found in column 2 of Table 1 was derived from Song et al. (2013, their Fig. 5B), which plots the rate of ATP production as a function of the crista surface area for differing values of the crista shape factor. The Gibbs free energy of ATP hydrolysis varies from −28 to −34 kJ/mol, depending on the concentration of the cation Mg2+. We took the middle value of −31 kJ/mol for our power calculation in column 3 of Table 1. The estimation of the number of mitochondria in the OHC volume of interest in column 4 of Table 1, indicated by the black bars in Figure 3A was made by first modeling that portion of the volume as a cylinder, which is also how it is described in the literature. Only EM images were chosen that appeared to be longitudinal (see Fig. 3A) or cross-sectional (see Fig. 3E) in the volume of interest. The mitochondria near the SSC were counted in these images, which accounts for >90% of the mitochondria in the volume (somewhat less in aged OHCs as described in Fig. 8). Thus, the model is a cylinder decorated on the inside with mitochondria; that is, the few mitochondria separated from the SSC were not used because we desired to model the rate of ATP production available for use by the SSC and lateral cell wall components. This constraint allows for an estimation of the number of mitochondria decorating the cylinder by multiplying the number of mitochondria in a cross-sectional EM cut by the number of mitochondria in a longitudinal EM cut. But, because the cross-sectional and longitudinal EM images were from different cells, the multiplication can be made using one cross-sectional measurement with “n” longitudinal measurements, thus producing multiple combinations. Longitudinal EM images are as follows: n = 10, 3, 10, and 4 for 3, 15, 18, and 24 months, respectively. Cross-sectional EM images are as follows: n = 4, 9, 3, and 6 for 3, 15, 18, and 24 months, respectively. Mitochondrial number measurements are as follows: n = 40, 27, 30, and 24 for 3, 15, 18, and 24 months, respectively.
Figure 3.
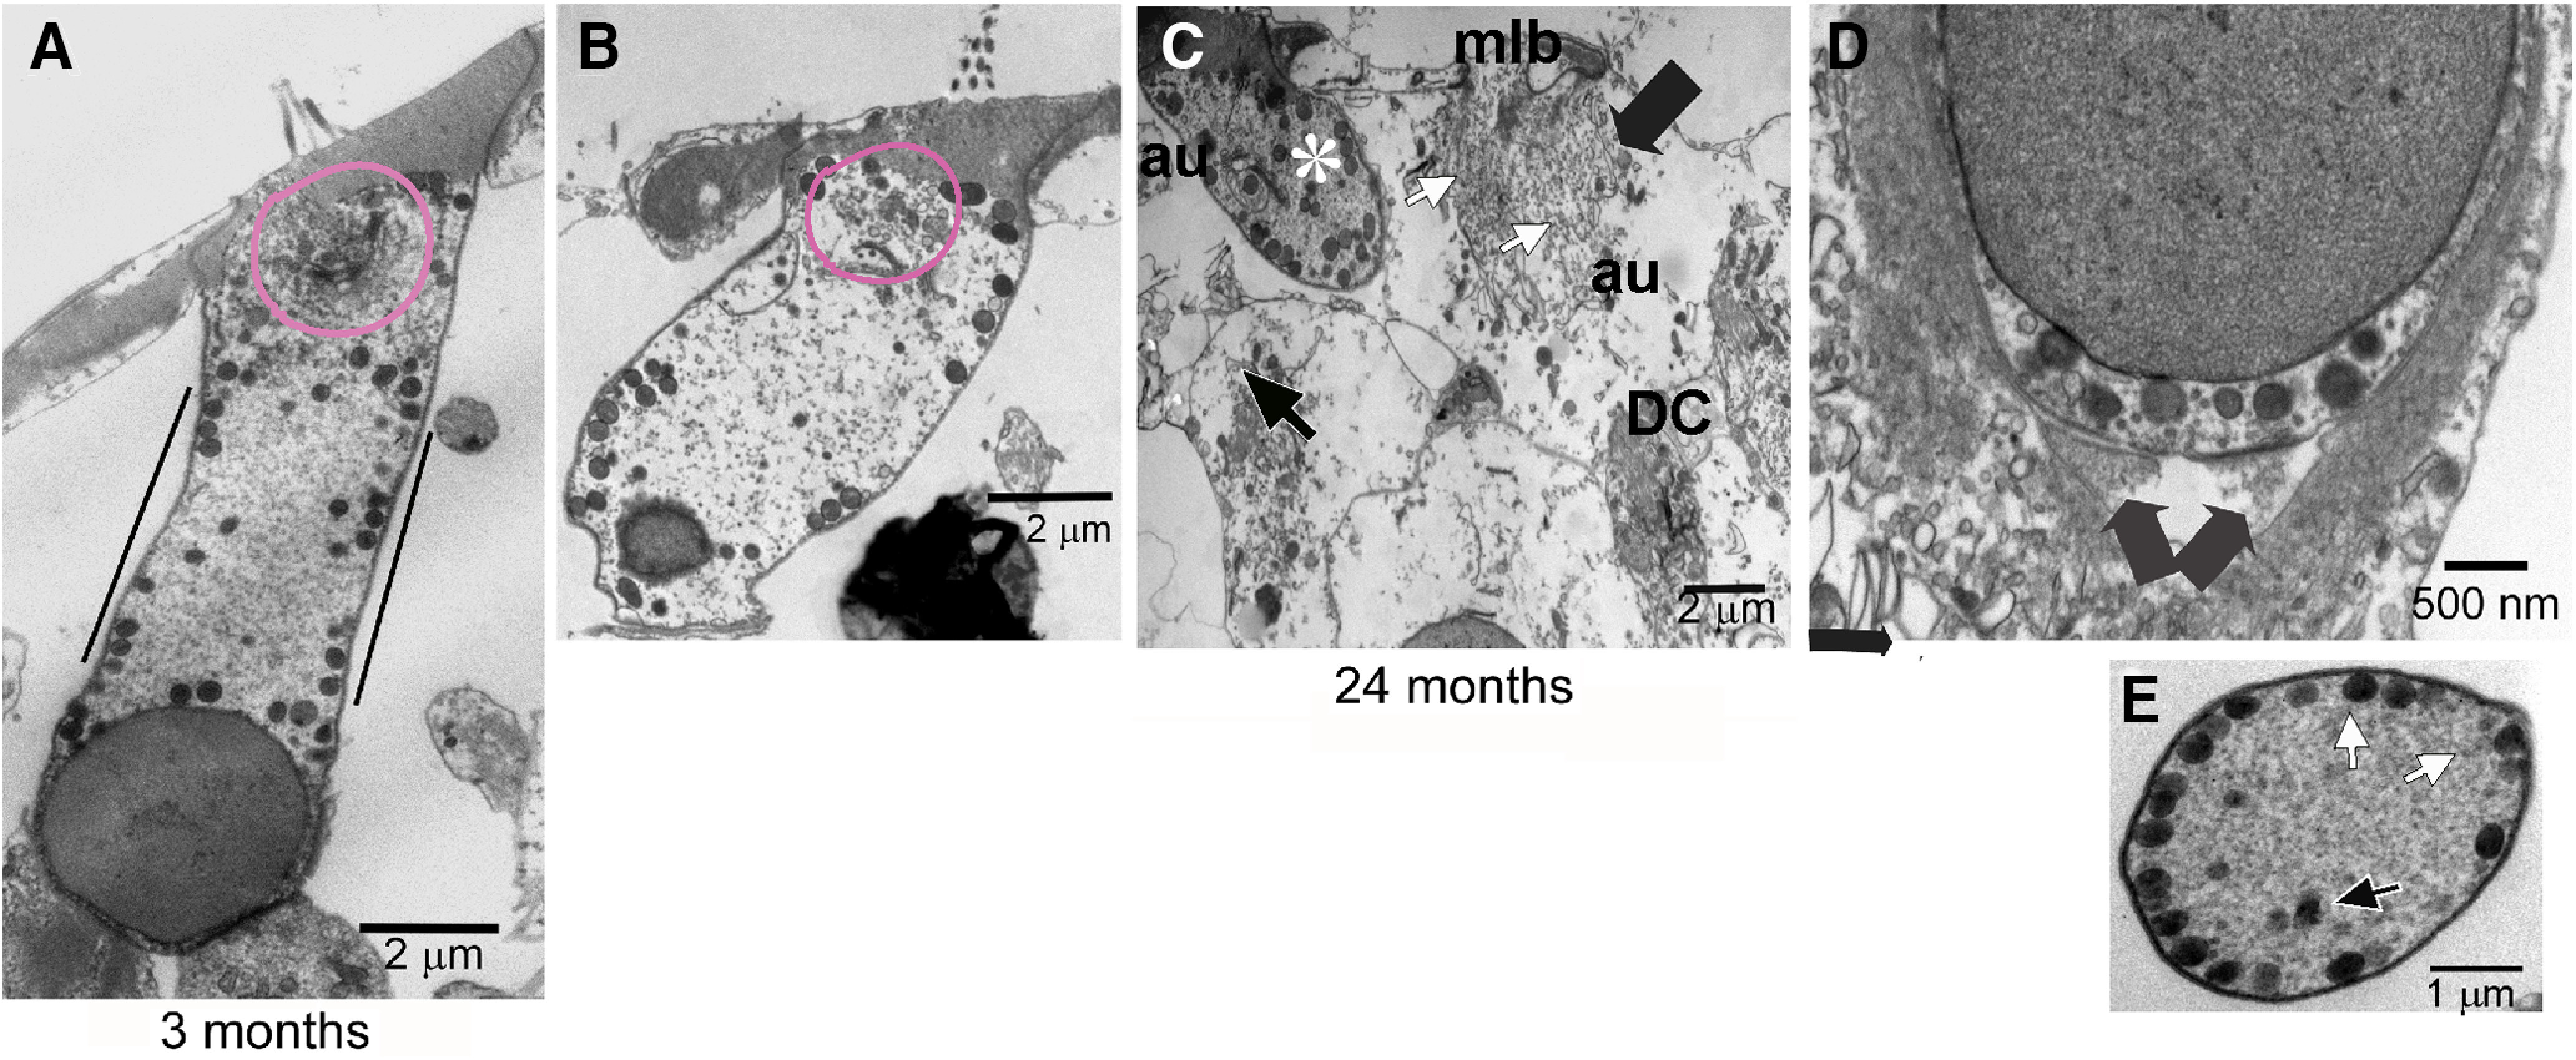
OHCs in a CBA/CaJ mouse model exhibited pathology because of aging. A, TEM image of a 3 month OHC to demonstrate normal ultrastructure. Mitochondria were prevalent, and their density was noticeably higher in three regions: (1) surrounding the nucleus, (2) nestled against the cuticular plate, and (3) adjacent to the SSC. Black lines on either side indicate the region between the nucleus and cuticular plate used for the mitochondrial and SSC analyses in Figures 5–8 and Table 1; >80% of mitochondria in this region was positioned within 0.5 µm of the lateral plasma membrane. Magenta line indicates the area occupied by the Hensen’s body. B, Aged OHC pathology. The TEM image of a 24 month OHC with loss of cytoplasmic density such that it is uniform throughout. Magenta line encircling the Hensen’s body indicates decreased complexity of this structure, including decreased size as well as density. The OHC has also detached from the Deiters’ cup and synapses. The increased thickness/width of the OHC is an observed consequence of the detachment. C, By 24 months, some OHCs still appear relatively normal (*). However, detachment from the Deiters’ cup and nerve terminals, as well as the presence of an autophagosome (au) and swollen mitochondria, is noted in this OHC. In contrast, other OHCs (Ig, black arrow) had extensive features of cell death or have disappeared. In this OHC (lg, black arrow), there is a loss of plasmalemma integrity (white arrow), autophagosome (au), and multilamellar bodies (mlb) and an overall loss of organelles, such as mitochondria. D, Further pathology was seen at 24 months with two degenerating synapses (arrows) and a loss of cytoplasmic components below the synapses in an efferent nerve terminal impinging on the basal portion of an OHC. However, synaptic membrane specializations remained in the OHC. B, From a different 24 month cochlea than C and D. E, Representative example of the OHC cut in cross-section to the length of the OHC cylindrical shape. The complement of mitochondria (white arrows) aligned along the SSC was used for the energy calculations (Table 1). In contrast, mitochondria in the interior of the OHC (black arrow) were ignored for purposes of the energy calculations. DC, Deiters’ cell. n = 4, 5, and 3 mice with 1 cochlea used per mouse for 3, 18, and 24 months, respectively; n = 29, 25, and 25 OHCs for 3, 18, and 24 months, respectively.
Figure 8.
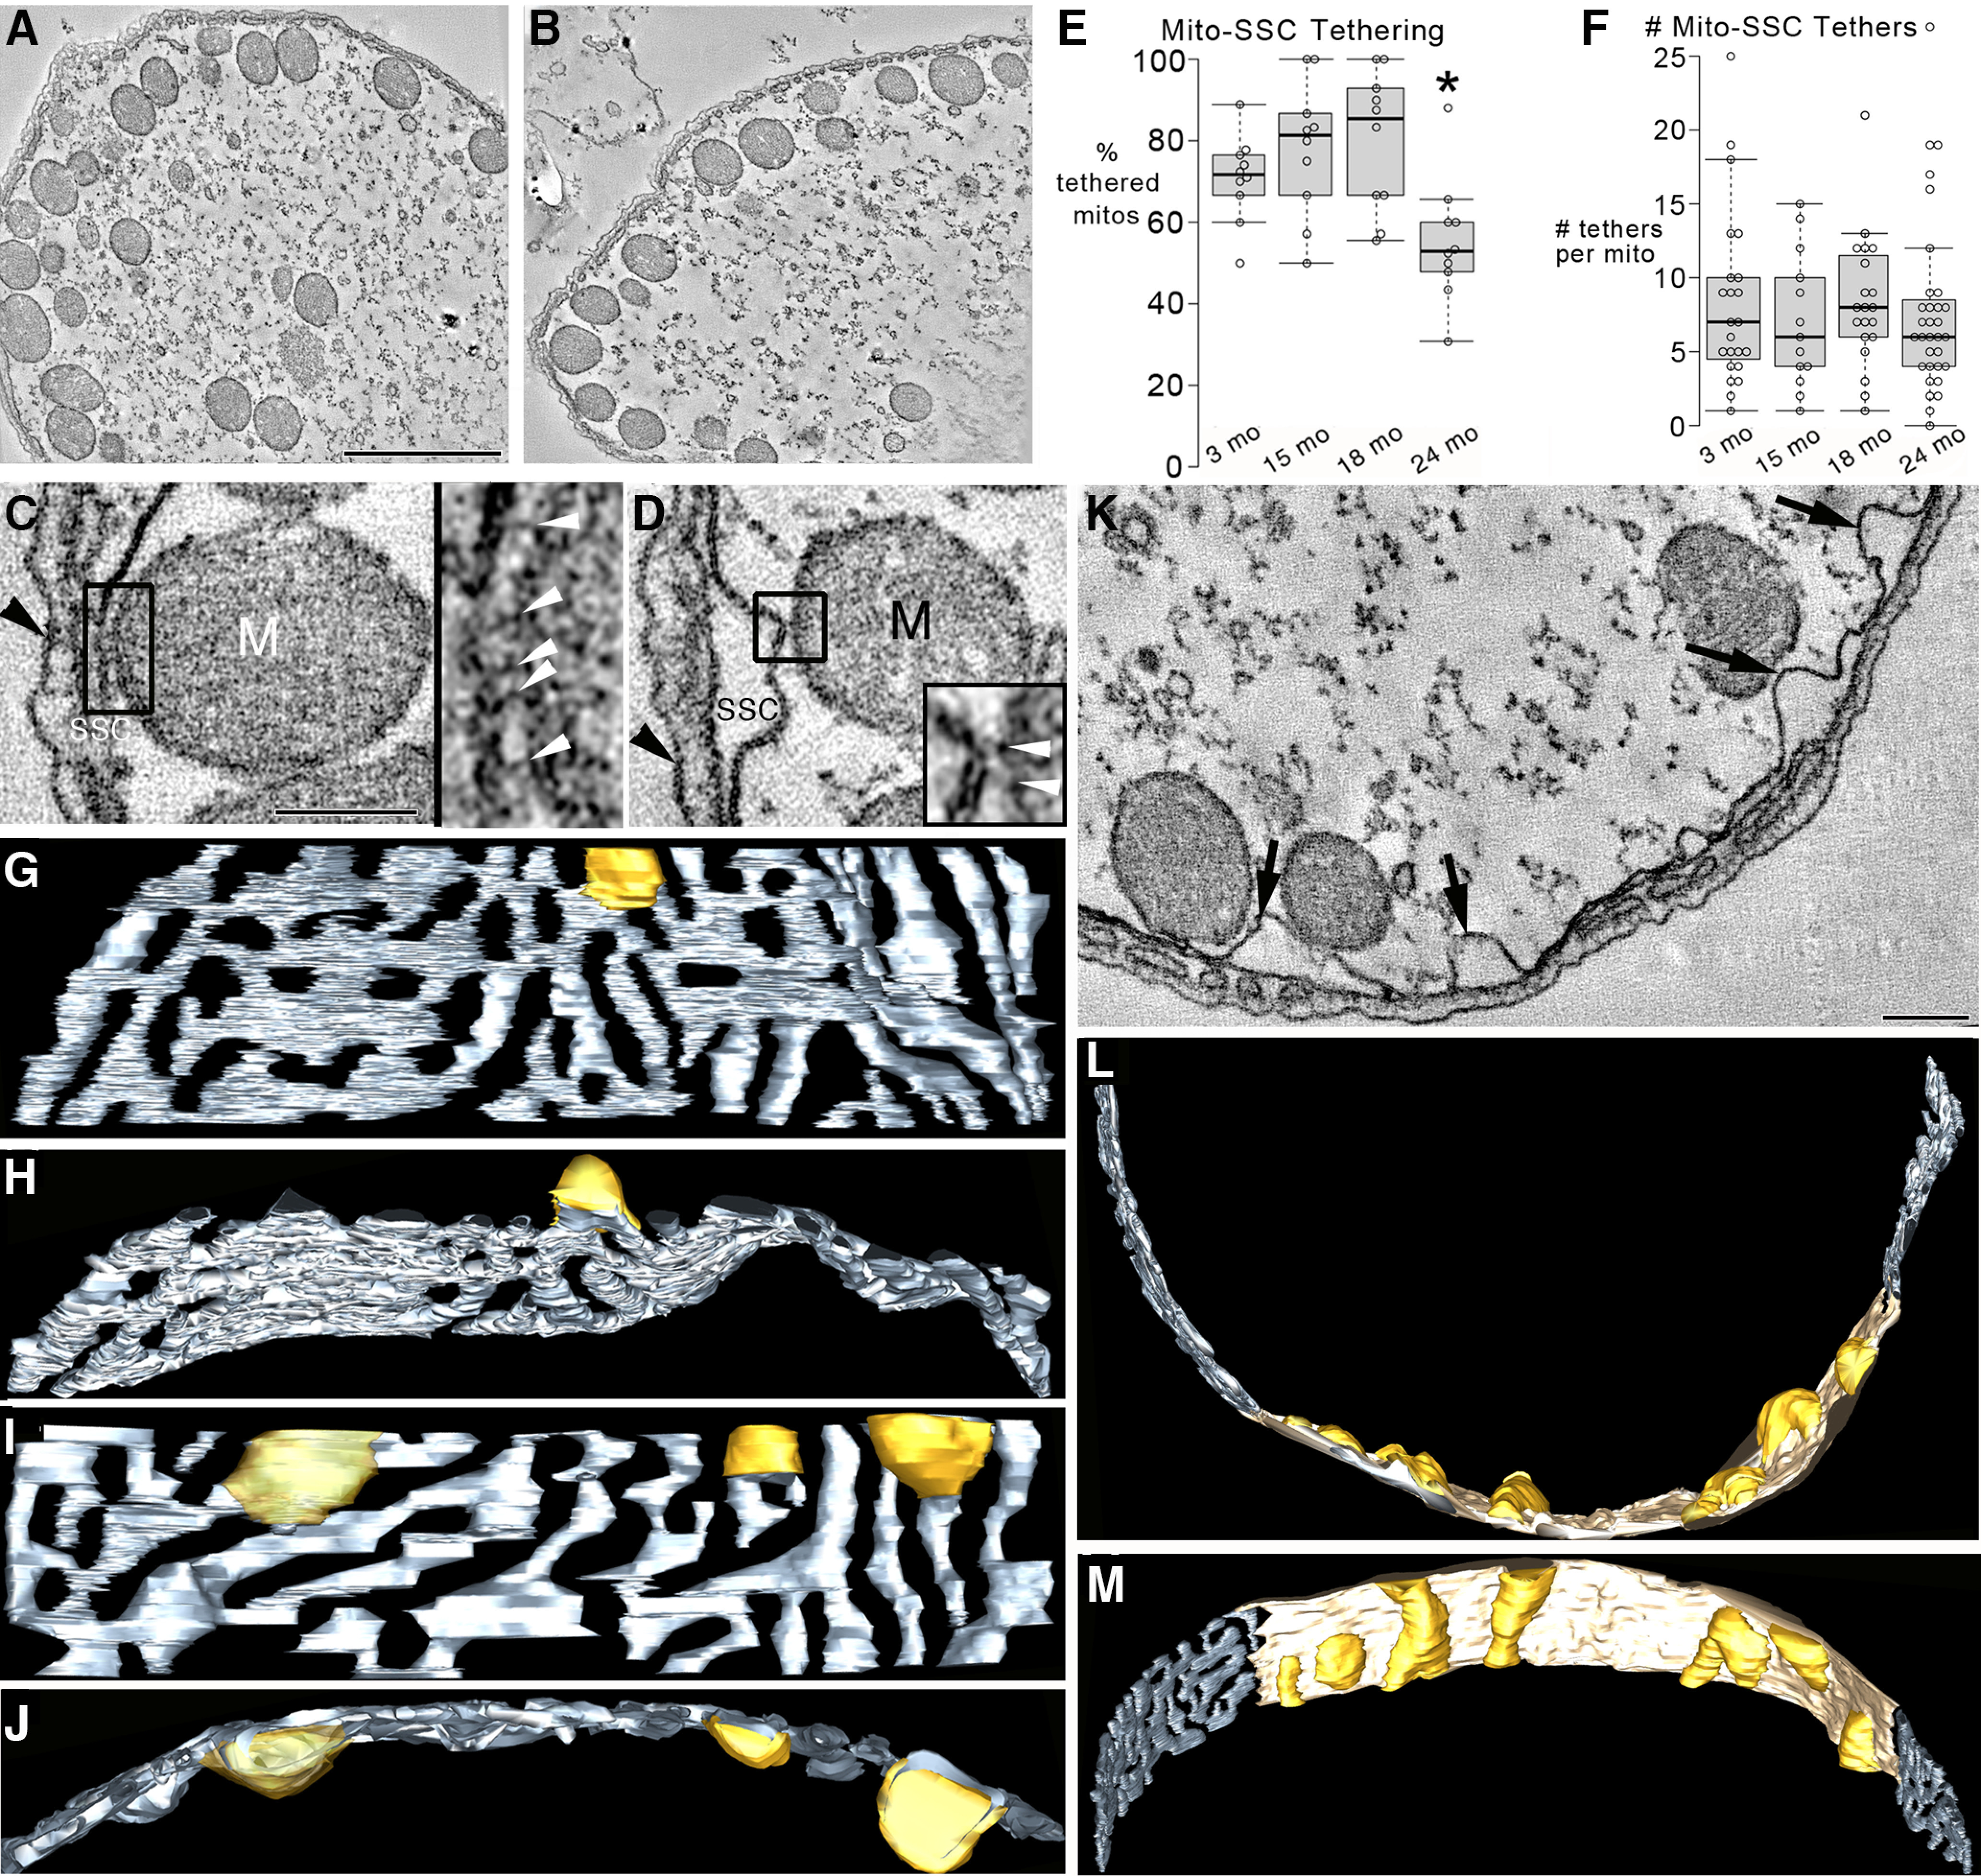
The tethering of mitochondria to the OHC SSC by thin filaments was decreased, and SSC stress was observed at 24 months. A, Fewer mitochondria were positioned adjacent to the SSC in the 24 month OHC compared with younger OHCs (B, 15 month shown). Scale bar, 1 μm. C, Nearly all mitochondria adjacent to the SSC were tethered by thin filaments ∼5-10 nm in diameter, found consistently for 3, 15, 18, and 24 month OHCs. Typically, there were multiple tethers for each mitochondrion-SSC coupling. An example is the 5 filamentous tethers shown inside the black-boxed region of a slice through the middle of a 24 month OHC volume and expanded 3× in the right inset. White arrowheads indicate filaments. M, Mitochondrion. Black arrowhead indicates the cell membrane. Scale bar, 200 nm. D, The mitochondrion-SSC tethering persisted even when the SSC was swollen. An example is the tethering by two filaments seen inside the black-boxed region and expanded 3× in the bottom right inset. White arrowheads indicate filaments. Appreciable SSC swelling was only observed at 24 months. E, The percentage of mitochondria tethered to the SSC by thin filaments in the ROI OHC cytoplasm was lower at 24 months compared with younger mice. n = 10 OHCs from 3 mice for each age for 3, 15, 18, and 24 months. *p = 0.020, 0.0053, and 0.0034 comparing 24 months with 3, 15, and 18 months, respectively. F, However, there was no difference in the number of tethers per mitochondrion positioned adjacent to the SSC across ages. n = 23, 13, 20, and 32 mitochondria each for 3, 15, 18, and 24 months, respectively (3 mice for each age). G, A range of SSC swelling was found at 24 months. The SSC mesh (slate gray) appeared normal in this surface-rendered volume except for an unusual swelling (golden rod) seen in this side view. H, A top view of the SSC mesh showing protruding of the swelling into the OHC cytoplasm. I, A second mouse shows more SSC swelling (3 swellings) with the top view (J), indicating that the swellings have different sizes. K, A slice through an OHC volume from a third mouse shows even more extensive SSC swelling (arrows). Scale bar, 200 nm. L, An unusual remodeling of the SSC has occurred, producing a continuous double-membrane sheet (lamella) for only the portion of the SSC (tan) that displays swellings (golden rod) in this top view of the surface-rendered volume. M, A side view showing the 7 extensive swellings of the SSC lamella and the normal-appearing SSC mesh to either side of the abnormal SSC.
There are two important caveats with the calculations presented in Table 1 and the Results. First, this analysis does not take into account the ATP produced by glycolysis. However, a quantitative analysis of the relative contributions of glycolysis and oxidative phosphorylation in the OHC determined that its metabolism is primarily aerobic (Puschner and Schacht, 1997). Thus, ATP production comes mostly from mitochondria; hence, OHC fate is subject to mitochondrial dysfunction as much as other cell types. Second, mitochondrial respiration can be governed by various states, the most common being State 3 (active) and State 4 (resting), and State 3 respiration can have an ATP production rate up to 4 times that of State 4 (Perkins and Ellisman, 2011). It was not clear from the work of Puschner and Schacht (1997) which state (or combination of states) their OHC mitochondria were in. Taking into consideration the estimates and uncertainties, it is important to understand that the calculations of ATP production rate and power (energy per second) availability may have “order-of-magnitude” accuracy.
Experimental design and statistical analyses
The number, ages, and sex of the mice used in this study, the number of OHCs, tomographic volumes, and mitochondria are reported in Materials and Methods, Results, or figure legends, as appropriate. The statistics package of Microsoft Excel was used for statistical comparisons. The mean, SD, SEM, median, and first and third quartiles were calculated for all reported measurements and shown in box-and-whisker plots or other plots, as appropriate. Individual data points were shown, often in “bee-swarm” configuration. The whiskers (vertical lines) extend from the ends of the box to the minimum value (bottom) or maximum value (top). A data point was considered an outlier if it exceeded 1.5 times the interquartile range below the first quartile or above the third quartile. ANOVA was used with Bonferroni’s correction post hoc using the two-tailed unpaired Student’s t test between groups. Pearson’s χ2 test was used to determine whether there was a significant difference between the null hypothesis of the random orientation of cristae to the SSC and a polarized cristae orientation. The significance from combined statistical tests, as used in Table 1, columns 4, 5, and 6, followed the procedure given by https://pdfs.semanticscholar.org/e232/ec9efda181afaeb3e99f4c9993d5c6ea79f2.pdf.
The reporting “p value” used is R2 = p1 × p2 (1 + log (1/ (p1 × p2)), where p1 is the p value from the statistical test reported for the first column (e.g., column 4), and p2 is the p value from the statistical analysis reported for the second column (e.g., column 5). p or R < 0.05 was considered to be statistically significant, and the values of all significant p or R values were reported in the figure captions or Table 1, as appropriate.
Results
Aging increased the ABR and DPOAE thresholds in a CBA/CaJ mouse model of ARHL
We recorded the ABR from CBA/CaJ mice from ages 3, 6, 12, 18, and 24 months (Fig. 1A,B). Previous work used ABR, DPOAE, and hair cell and synaptic ribbon counts in the CBA/CaJ mouse model from youth (1 months) to old age (33 months) to show that cochlear synaptic loss can be observed long before age-related changes in thresholds or hair cell counts and that nerve loss parallels the synaptic loss, but only after a delay of several months (Sergeyenko et al., 2013). We showed that ABR thresholds remained unchanged until at 18 months when a mild elevation of 5–8 dB SPL occurred at 32 kHz. At 24 months, the threshold was elevated by ∼20–25 dB SPL at all frequencies. The condition of OHC functional capacity in the aged cochlea was also monitored with DPOAEs. The DPOAE threshold at four frequencies was compared for 3, 15, and 24 month CBA/CaJ mice (Fig. 1C). The intensity thresholds at 8 and 16 kHz were significantly higher for 24 month compared with 3 month mice, indicating OHC malfunction in the middle-frequency range.
Figure 1.
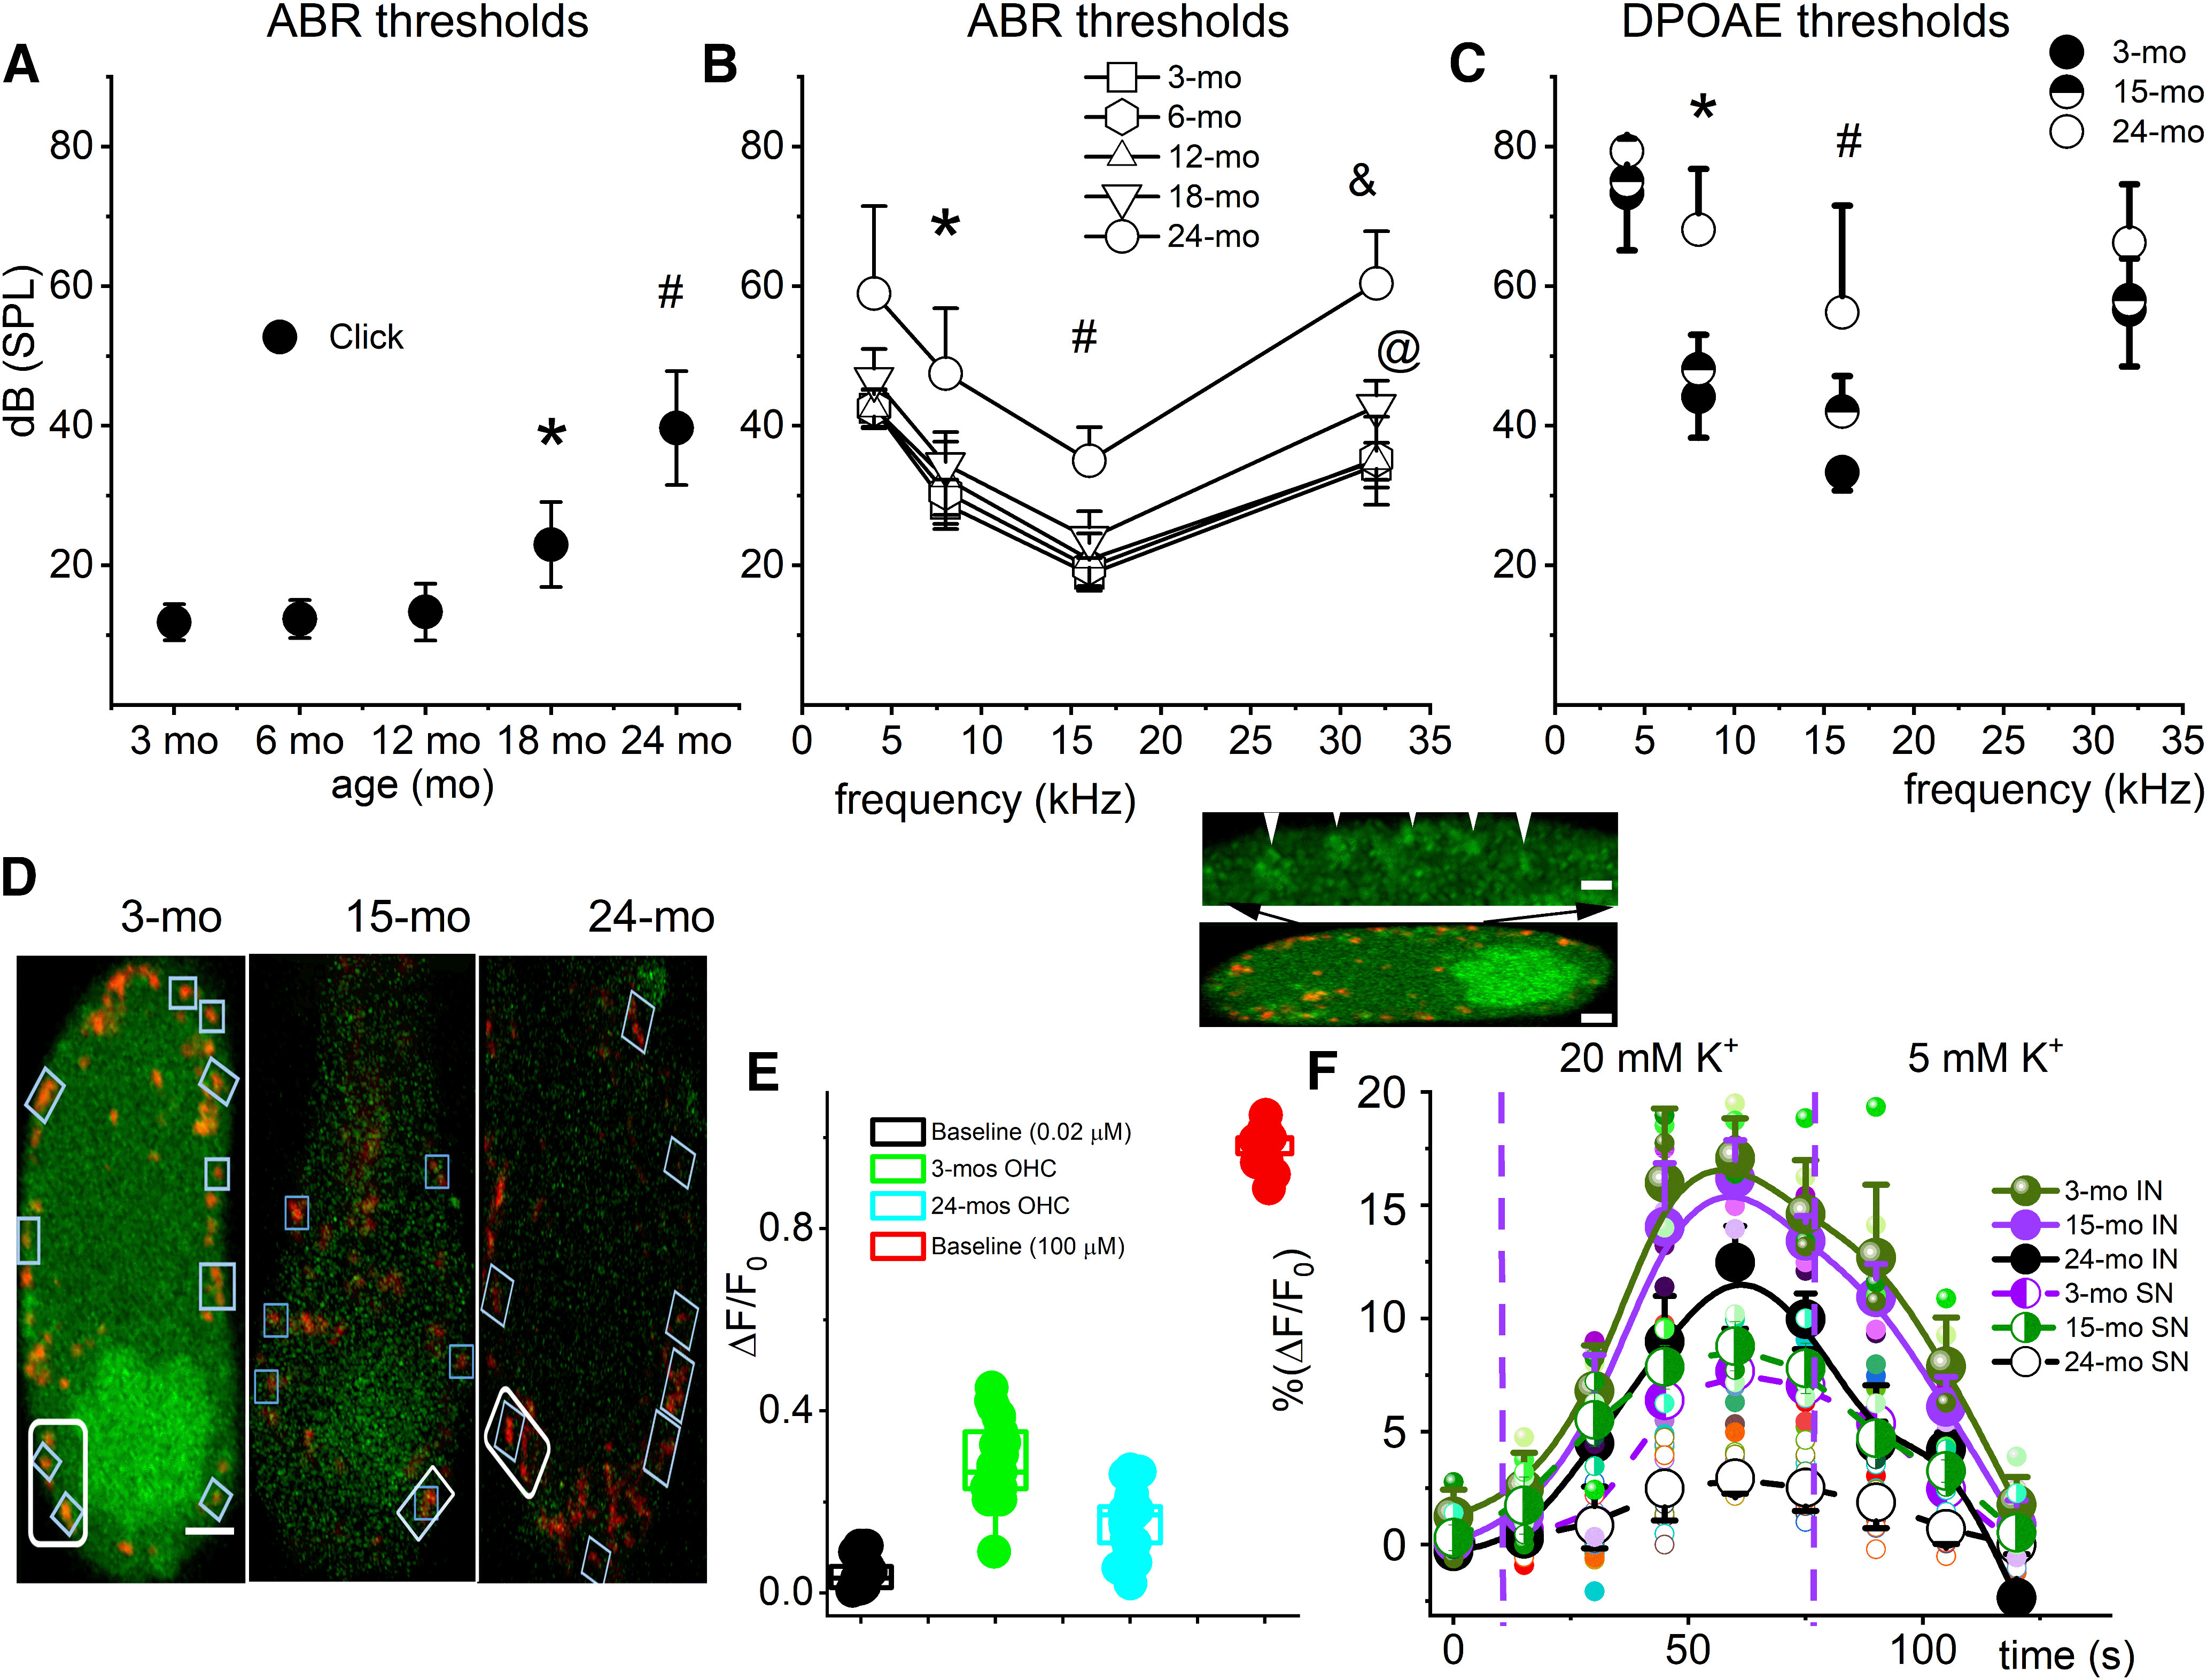
ABR and DPOAE thresholds were increased in aged CBA/CaJ mice, and mitochondrial Ca2+ levels and ability to respond to K+ stimulation were reduced in old (15-24 month) OHCs. A, Average ABR threshold for click sounds at five different ages (3-24 months; n = 17 mice). Significant threshold elevation was seen in 18 and 24 month mice. *p = 3 × 10⁻⁵ between 18 and 3 months. #p = 7 × 10⁻⁷ between 24 and 3 months. B, Average ABR thresholds using tone pips at 4, 8, 16, and 32 kHz in CBA/CaJ mice (n = 17 mice). ANOVA was used to test for differences in age populations. *p = 0.0012 between 24 and 3 months at 8 kHz. #p = 2.0 × 10⁻⁵ between 24 and 3 months at 16 kHz. @ p = 0.001 between 18 and 3 months at 32 kHz. &p = 1 × 10⁻⁵ between 24 and 3 months at 32 kHz. C, DPOAE thresholds for 3, 15, and 24 month CBA/CaJ mice. *p = 1 × 10⁻⁵ between 24 and 3 months at 8 kHz. #p = 2 × 10⁻⁴ between 24 and 3 months at 16 kHz. D, Representative fluorescence images of 3, 15, and 24 month OHCs from the apical cochlear turn loaded with the Ca2+ dye OGB 488 BAPTA-1 AM (green). Scale bar, 1 µm. Rectangular boxes represent the regions of SSC-associated mitochondria labeled with TMRM (red) from which the total fluorescence was measured (data from 16 mice with ABR and DPOAE records in A–C). E, Relative mitochondrial Ca2+ fluorescence at low (•) and high (•) baseline Ca2+ levels and in young (3 month; •) and old (24 month; •) OHCs. ΔF/F0 = [F (t) – F (0)]/F(0), t is time, F(t) is OGB fluorescence following stimulation (external K+) and F(0) is the prestimulus fluorescence. Post hoc comparisons using the Tukey HSD test indicated that the means of data from low, high, young, and old OHC mitochondria were all significantly different. The population means were significantly different. F(3,80) = 968, p = 0.0009. n = 21 OHCs from 21 cochleae. Inset, Example of sub-PM regions in which cytoplasmic and mitochondrial Ca2+ was measured (indicated with white arrows). Ca2+ levels in regions marked by TMRM (red) were intense compared with the bulk cytoplasmic Ca2+ levels. Scale bars: top, 1 µm; bottom, 2 µm. F, Effects of high external K+ (20 mm) on mitochondrial Ca2+ (OGB) fluorescence intensities and after washout with lower (5 mm) K+. Dashed blue vertical lines indicate the time point of the addition of 20 mm K+ solution (left line) and the time point of the washout with a 5 mm K+ solution (right line). Solid curve fits the 9 data points for 3, 15, and 24 month infranuclei (IN) mitochondria. Dashed curve fits the 9 data points for 3, 15, and 24 month supranuclei mitochondria. The fluorescence intensity measurements were evaluated in mitochondria that remained in focus throughout the imaging period. Error bars represent standard deviation in all panels.
Cytoplasmic and mitochondrial Ca2+ levels and responsiveness to high K+ stimulation were reduced in aged CBA/CaJ OHCs
Based on the DPOAE findings and because blocking Ca2+ entry into OHCs affects the DPOAE (Kujawa et al., 1996), we tested whether perturbed Ca2+ flux in OHCs contributes to OHC dysfunction. Overactivation of T-type Cav in OHCs plays a role in ARHL (Sang et al., 2017), and channel suppression may confer a protective effect (Yu et al., 2016). We used confocal microscopy to image cytoplasmic Ca2+ levels in OHCs in semi-intact, viable cochleae from the apical aspects of the sensory epithelia harvested from young and old (Fig. 1D) CBA/CaJ mice. We focused on mitochondrial populations and cytoplasmic regions adjacent to the SSC, which acts as a Ca2+ reservoir (Raffaello et al., 2016), and measured the Ca2+ levels every 15 s for 120 s in a recording chamber with continuous perfusion of oxygenated external solutions. To establish the baseline Ca2+ fluorescence, low and high [Ca2+] solutions were perfused through the recording chamber containing Ca2+ ionophore A23187-permeabilized OHCs. The qualitative estimates of free cytoplasmic Ca2+ in the low and high Ca2+ solutions were ∼200 nm and ∼100 μm, respectively. The relative Ca2+ levels measured in low and high Ca2+-perfused OHCs were compared with the Ca2+ levels in the young and old OHCs (Fig. 1E). Both 3 month and 24 month cytoplasmic and mitochondrial Ca2+ levels were closer to the low Ca2+ baseline, with the 24 month being significantly lower than the 3 month. The relative Ca2+ concentrations in 15 month OHCs fell between 3 and 24 month levels. Next, because high K+ mediate membrane depolarization and opens voltage-dependent Ca2+ channels, resulting in an influx of extracellular Ca2+, a part of which is taken up by mitochondria (Karaki et al., 1984; Bawa and Abbott, 2008), we asked whether the sensitivity of mitochondrial Ca2+ levels to high (20 mm) external K+ signals is compromised in aged OHCs. The Ca2+ fluorescence intensity for SSC-associated mitochondria from the 3 and 24 month OHCs was measured at 15 s time points before and after bath perfusion of high K+ solution followed by washout with typical external K+ solution (5 mm) (Fig. 1F). High K+ invariably mediated a rise in mitochondrial Ca2+ levels. However, the high external K+-mediated effect on mitochondrial Ca2+ level was diminished in 15 and 24 month versus 3 month OHCs, implying compromised mitochondria Ca2+ uptake mechanisms in older OHCs. Mitochondrial Ca2+ was analyzed and grouped according to the organelle’s location in OHCs, that is, mid-point below the nuclei (infranuclear) or mid-point above the nuclei (supranuclear). The changes in Ca2+ fluorescent intensities were relatively greater in infranuclear compared with supranuclear mitochondrial and cytoplasmic regions (Fig. 1F). Presumably, the qualitative differences may reflect the activity of synaptic versus SSC-tethered mitochondria.
Mitochondria are substantively depolarized in 24 month OHCs
Dysfunctional mitochondrial Ca2+ dynamics in aged OHCs were probed further by measuring mitochondrial membrane potential (Δψm), a critical physiologic parameter as it relates to a cell’s capacity to generate ATP by oxidative phosphorylation. The membrane potential of mitochondria in OHCs in isolated organs of Corti from 3, 15, and 24 month CBA/CaJ mice was measured with TMRM fluorescence, which is dependent on the maintenance of mitochondrial membrane potential. Substantial loss of TMRM fluorescence at 24 month was observed, indicating considerable mitochondrial membrane depolarization and OHC injury (Fig. 2). The protonophore, FCCP, which depolarizes the mitochondrial inner membrane by increasing its permeability to protons, was added as a control. The fluorescence decay time constant after the addition of the FCCP was significantly increased at 24 months (Fig. 2D). The slow decay in FCCP-mediated depolarization likely reflects the reduced activity of mitochondrial ATP generation in older (24 months) OHCs, which may be tied to degeneration of cristae structure through impairment of mitochondrial contact site and cristae organizing system (MICOS)-complex components or Opa1 (Wolf et al., 2019).
Figure 2.

Mitochondria were substantively depolarized in 24 month OHCs. A, TMRM fluorescence micrographs represent frames of fluorescence intensities in 3 month (top) and 24 month OHCs (bottom). Images were captured using identical confocal settings after background subtraction. Scale bar, 3 µm. B, Mitochondrial membrane potential (Δψm) measurements, showing a representative time course of TMRM fluorescence intensities made from 3, 15, and 24 month apical OHCs. FCCP (1 mm) was applied at the time indicated with an arrow and the time course of decay of mitochondrial potential for various aged OHCs was fitted with a single exponential decay time constant (t) for each age as shown beside the plots using color codes as represented in the graph. ΔF is arbitrary fluorescence units. C, D, Summary data (mean ± SEM) of the fluorescence intensities and the decay time constant after application of FCCP (n = 13 OHCs from 3 cochleae for each of 3, 15, and 24 month CBA/CaJ mice). C, The population means were significantly different. F(2,36) = 56.7, *p = 6.0 × 10⁻⁵ comparing 24 month with 3 month. D, The population means were significantly different. F(2,36) = 187, *p = 1.0 × 10⁻³⁵ comparing 24 month with 3 month.
OHCs in a CBA/CaJ mouse model exhibit structural pathology because of aging
Because the ABR, DPOAE, Ca2+ imaging, and mitochondrial membrane potential in aged mice all represented OHC anomalies, we examined the structural correlates in aged OHCs. Comparing TEM of 3 and 24 month OHCs in the upper basal turn, we found OHC detachment from Deiters’ cup and synapses, phagocytotic activity in OHC consistent with both necrosis and macrophagic and degenerating efferent nerve terminals impinging on the OHC (Fig. 3). Inside the OHC, we observed the loss of cytoplasmic density as well as decreased complexity of the Hensen’s body, a specialized tubulovesicular form of smooth ER located in the apical portion of the cell (Fig. 3A,B). The decreased complexity of Hensen’s body observed in aged OHCs varied. In some aged OHCs, Hensen’s body is smaller but is still a relatively compact whorled tubulovesicular cisternal entity. In other aged OHCs, Hensen’s body is more loosely compacted or lacks the laterally projecting tubules that reach the OHC plasmalemma. The latter is the case in the OHC depicted in Figure 3B. The function of Hensen’s body has been proposed to involve the turnover of proteins involved in the specialized OHC motor action and plasmalemma K+ transport (Meyer et al., 2001). Other studies suggested that Hensen’s body may serve as an InsP3-sensitive Ca2+ storage/release site (Mammano et al., 1999). The involvement of specialized ER in InsP3-sensitive Ca2+ release has been observed in excitable and nonexcitable cells, such as hepatocytes and Purkinje neurons (Pozzan et al., 1994). There are three structurally distinct types of mitochondria in the OHC: along the lateral wall associated with the SSC, those in the basal region of the cell below and around the lower aspect of the nucleus, including the subsynaptic volume, and those in the apical cytoplasm adjacent to the cuticular plate. The positioning of these types of mitochondria likely supports the different functions of the lateral wall, nucleus and synaptic terminal, and cuticular plate, respectively. The mitochondria supporting the lateral wall components are thought to be important for fueling electromotility and amplification of sound. We limited the structural work of this study to the lateral wall mitochondria and SSC indicated by the black lines in Figure 3A.
Mitochondrial size and number are altered in aged OHCs in a CBA/CaJ mouse model
Based on the finding that aged mitochondria had reduced membrane potential (Fig. 2), we used EM tomography to examine the 3D structure of 3, 15, 18, and 24 month mitochondria at high resolution in the OHC volume between the nucleus and apical end. Only OHCs in the upper basal turn were analyzed. It appeared that the mitochondria had increased size at 18 and 24 months (Fig. 4). We measured the volume of mitochondria near the SSC and found that they were significantly larger at 18 and 24 months (Fig. 4E), yet the mitochondrial volume density had not changed dramatically (Fig. 4F). However, there appeared to be a greater number of mitochondria in 3 month OHCs compared with 18 month OHCs (Fig. 4G,H). Therefore, we measured the number of mitochondria per cytoplasmic volume and found that, indeed, the number had dropped significantly by 18 months and remained low at 24 months (Fig. 4I). We interrogated whether there was evidence of mitochondrial stress in the aged OHC via crista swelling, matrix swelling, or ruptured mitochondrial outer membrane. We found no difference in these parameters in OHC volumes for 3, 15, 18, or 24 month samples.
Figure 4.

Mitochondrial size and number were altered in aged OHCs in a CBA/CaJ mouse model. A–D, Mitochondria had increased size at 18 and 24 months. A, A 1.6-nm-thick slice near the middle of a tomographic volume of 3 month OHC showing two mitochondria about the same size as (B) 15 month mitochondria. Arrowheads indicate the lateral plasma membrane for positional reference. Scale bar: A–D, 250 nm. C, In contrast, 1.6-nm-thick slices through tomographic volumes of 18 and 24 month OHCs (D) show mitochondria that appear larger. E, The volume of mitochondria was significantly larger in 18 and 24 month OHCs (n = 20 mitochondria from 3 mice at each age). *p = 1.8 × 10⁻⁵, 0.0042 comparing 3 months with 18 and 24 months, respectively. p = 1.5 × 10⁻⁷, 0.0021 comparing 15 months with 18 and 24 months, respectively. F. No significant change in mitochondrial volume density was found on aging. Data are mean ± SEM. n = 10 OHCs from 3 mice for each age. G, However, there appeared to be a greater number of mitochondria in 3 month OHCs compared with (H) 18 month OHCs in the same-size cytoplasmic area. Scale bar: G, H, 300 nm. I, The number of mitochondria per cytoplasmic volume had dropped significantly by 18 months and remained low at 24 months. n = 9 OHCs from 3 mice for each age. *p = 0.0037, 0.0053 comparing 3 months with 18 and 24 months, respectively. p = 0.012, 0.020 comparing 15 month with 18 and 24 months, respectively. For E, F and I, each data point is represented by a circle. The box-and-whisker plots show median, quartiles min and max.
The number of Drp1 RNA molecules, but not Opa1 RNA molecules, was significantly reduced in 24 month compared with 3 month OHCs
We further examined the finding of increased mitochondrial size. We investigated decreased mitochondrial number in aged OHCs (Fig. 4) by mapping the expression and localization of Drp1- and Opa1-encoding transcripts in OHCs using smFISH in excised preparations of the organ of Corti isolated from 3 and 24 month mice (Fig. 5). The Drp1 protein controls the final stage of mitochondrial fission, and the OPA1 protein plays a key role in mitochondrial fusion. The median number of Drp1 single RNA molecules detected per OHC had decreased at 24 months compared with 3 months. Yet, the median number of Opa1 single RNA molecules detected per OHC did not change between the two age groups (Fig. 5C). These results suggest that mitochondrial fission was inhibited at 24 months in OHCs and is consistent with the finding of larger and fewer mitochondria at 24 months.
Figure 5.

The number of Drp1 RNA molecules, but not Opa1 RNA molecules, was significantly reduced in 24 month compared with 3 month OHCs. Expression and localization of Drp1- and Opa1-encoding transcripts in OHCs were examined using smFISH in excised whole-mount preparations of the organ of Corti isolated from 3 and 24 month mice. A, B, Single RNA molecules encoding for Drp1 (A) and Opa1 (B) and no probe controls (bottom, inset) were detected as fluorescent puncta (red represents Drp1), and (green represents Opa1) in myosin7A-positive (yellow) OHC cell bodies. Images are presented as z projections through a stack of confocal micrographs. For easier visualization of fluorescently labeled mRNA molecules, identical views are provided without OHC labels. C, The mean number of single RNA molecules detected per OHC was calculated as described in Materials and Methods. Median quartile and extreme expression values are provided for 3, 15, and 24 month OHCs. For Drp1, the population means were significantly different. F(2,42) = 28.7, *p = 1.4 × 10⁻⁸ comparing 3 and 15 months, n = 16 (3 month), 13 (15 month), and 16 (24 month) OHCs from 8 cochleae. #p = 1.5 × 10⁻⁴ comparing 3 and 24 months. For Opa1, the population means were not significantly different. F(2,42) = 2.23, p = 0.12, n = 16 (3 month), 13 (15 month), and 16 (24 month) OHCs from 8 cochleae.
Cristae orientation toward the SSC in OHCs
3DEM provided a way to examine the structural features of mitochondrial cristae that appeared unusual or age-dependent. It showed that OHC mitochondria in the upper basal turn have only lamellar cristae (Fig. 6), regardless of age. Additionally, 3DEM showed that the density of cristae was similar at 3, 15, and 18 months, yet lower at 24 month (Fig. 6A–E), which has functional implications. There is a positive correlation between capacity for ATP production and crista density (Brandt et al., 2017). Several structural factors correlate with mitochondrial performance: (1) larger crista membrane surface can accommodate a greater amount of OXPHOS proteins, leading to higher respiration and ATP-generating capacity; (2) lamellar cristae structure is beneficial for supercomplex assembly, producing higher respiratory efficiency (Cogliati et al., 2013); and (3) increased cristae membrane surface area predicts an increased proton motive force, leading to higher ATP-producing capacity (Song et al., 2013). Thus, 24 month OHC mitochondria are predicted to have lowered ATP-generating ability. Further, fewer cristae in 24 month SSC-associated mitochondria may help to explain the observed reduced mitochondrial Ca2+ level and reduced sensitivity to K+-mediated mitochondrial Ca2+ uptake (Fig. 1).
Membrane segmentation produced surface-rendered volumes providing a view at any orientation of cristae that were displayed in various shades of color inside mitochondria. The surface-rendered volumes were extracted for individual viewing to provide perspective on the extent to which cristae occupy the mitochondrial volume as well as their orientation (Fig. 6F–I). A comparison of orthogonal views was useful to demonstrate that surface-rendered 24 month mitochondrial volumes show a similar orientation of cristae, but that the cristae occupy less of the mitochondrial volume compared with 18 month examples (Fig. 6F,G). After extracting each crista from the mitochondrial volume and lining them up in the same orientation (Fig. 6H,I), it became clear that the 24 month cristae were generally smaller, fewer in number, and narrower, although still lamellar in shape, compared with the 18 month examples. These structural differences are responsible for the lower cristae density observed at 24 months.
An unexpected feature of mitochondria that abut the SSC is a preferred orientation of the cristae with one end facing toward the SSC (Fig. 6J–M). There were even instances where the cristae orient in a direction pointing away from the SSC at the far end, nevertheless curving back to align facing the SSC at the near-end (Fig. 6K). Often, the alignment of cristae facing the SSC was near-perfect (Fig. 6L,M), which motivated us to test for the degree of cristae-SSC “polarity.” We found significant polarization of cristae toward the SSC in mitochondria adjacent to it for all ages with the most robust value (>2) for 3 months (Fig. 6N).
Crista junctions tend to be polarized toward the SSC
Because of the unexpected finding that cristae tend to be polarized in mitochondria positioned adjacent to the SSC at all ages examined (Fig. 7), we asked whether the crista junctions were also polarized. Crista junctions have been proposed to modulate key mitochondrial activities (Rampelt et al., 2017a), and their spatial positioning is likely necessary for the portioning of functionality. We discovered in mitochondria near the SSC that there was generally a higher number of crista junctions facing toward the SSC than facing away from it (Fig. 7A,B). The mitochondria from the same volumes with either the opposite cristae orientation (Fig. 7C–F) or located far from the SSC (i.e., in the OHC interior) exhibited no crista junction polarization between opposite sides of a mitochondrion. These, then, served as a control population for testing the degree of crista junction polarization for mitochondria adjacent to the SSC. A quantifiable parameter to test for polarization in mitochondria with polarized cristae is the ratio of the number of crista junctions facing toward the SSC to those facing away. ANOVA with Bonferroni correction post hoc comparing control with age groupings of polarized mitochondria indicated that the difference in the number of crista junctions facing toward and away from the SSC was statistically significant and that the 24 month crista junctions were significantly more polarized than the 3, 15, and 18 month crista junctions (Fig. 7G). This finding suggests a significant polarization of crista junctions toward the SSC in mitochondria near it. We further observed that the crista junctions in 24 month mitochondria adjacent to the SSC appeared to be fewer than those at other ages (Fig. 7H,I). Measurements showed that the number of crista junctions was significantly lower at 24 months (Fig. 7J), correlating to reduced mitochondrial Ca2+ levels and responsiveness (Fig. 1). The control (unpolarized) mitochondria also had a considerably lower number of crista junctions.
Figure 7.
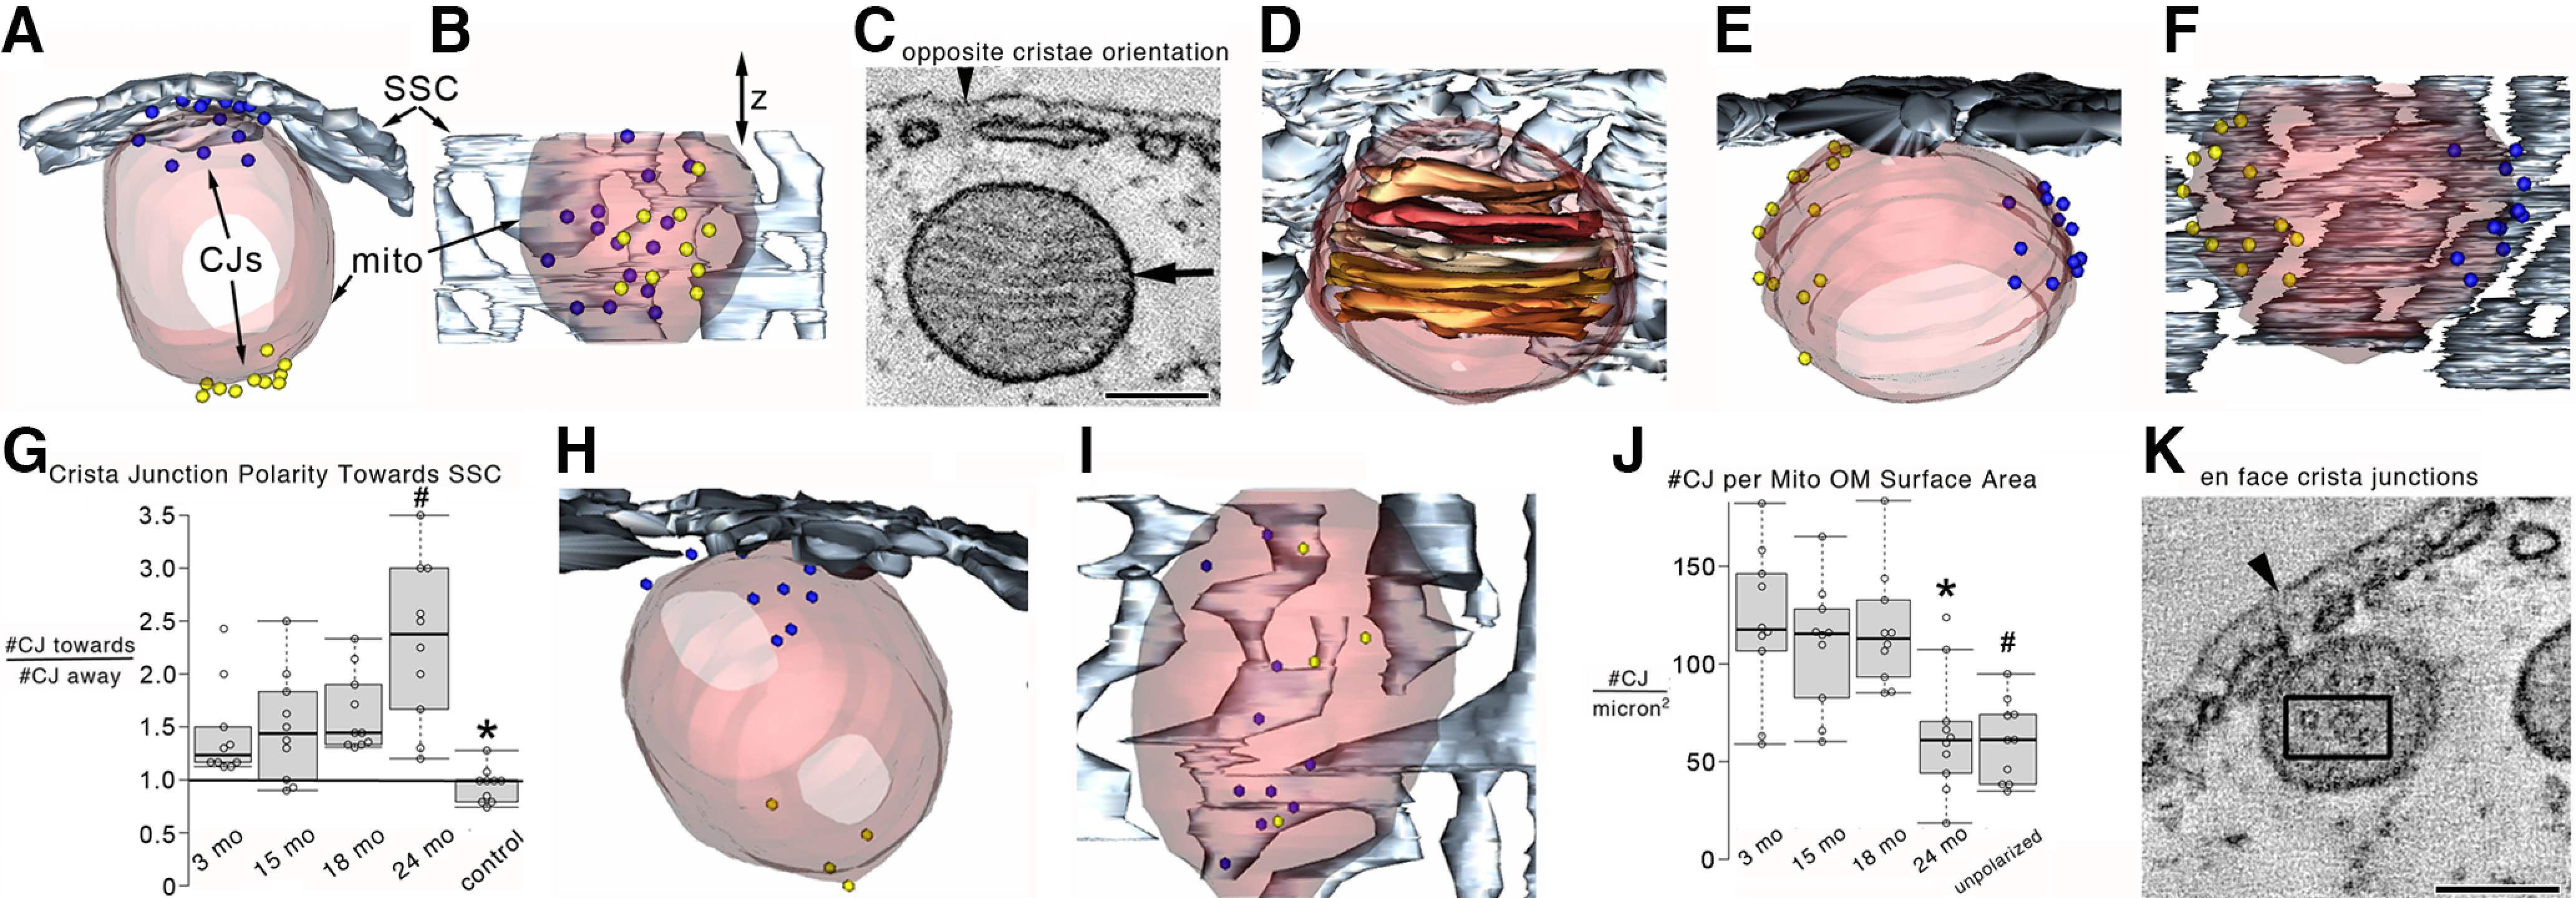
Crista junctions tended to be polarized toward the SSC for mitochondria positioned near it in the OHC at all ages examined. A, Top view of a surface-rendered mitochondrial volume from a 15 month OHC shows the positioning of a greater number (15) of crista junctions facing toward the SSC (blue spheres with a diameter the mean of the crista junction opening) than facing away (10; yellow spheres with the same diameter) from the SSC. Transparent maroon represents outer membrane. Slate gray represents SSC. B, Side view showing that there is no clustering of crista junctions in the z direction. C, A 1.6-nm-thick slice near the middle of a 15 month OHC tomographic volume showing cristae with an orientation opposite to those shown in Figure 6. Arrowhead indicates the lateral plasma membrane for positional reference. Arrow indicates a crista junction. Scale bar, 200 nm. D, The volume now surface-rendered shows the 3D orientation of the cristae (shades of brown) in relation to the SSC. E, Top view of the surface-rendered volume showing the 3D arrangement of nearly equal crista junctions on either side (13 blue, 12 yellow). F, Side view of the surface-rendered volume providing a different perspective of the 3D crista junction distribution around the mitochondrial periphery. G, The ratio of the number of crista junctions facing toward the SSC to those facing away in mitochondria with polarized cristae (see Fig. 6) shows a significant polarization toward the SSC. The black line at “1” signifies a random orientation. Control mitochondria from the same volumes were those with either the opposite cristae orientation (Fig. 7C) or mitochondria located in the ROI (Fig. 2A, black lines) far from the SSC. Because no difference was noticed between ages, they were grouped for analysis. These mitochondria exhibited no crista junction polarization between sides with little variance (0.97 ± 0.05). ANOVA with Bonferroni correction post hoc comparing control with age groupings of polarized mitochondria indicated that the crista junction polarization was statistically significant and that the 24 month crista junctions were significantly more polarized than the 3, 15, and 18 month crista junctions. n = 10 mitochondria each for 3, 15, 18, and 24 months polarized and control from 3 mice for each age. *p = 0.0097, 0.011, 2.3 × 10⁻⁴, and 3.3 × 10⁻⁴ comparing 3, 15, 18, and 24 months with control, respectively. #p = 0.0074, 0.014, and 0.027 comparing 24 months with 3, 15, and 18 months, respectively. H, Top view and (I) side view of a 24 month volume showing a mitochondrion adjacent to the SSC with its crista junctions. There appeared to be fewer and smaller crista junctions. J, The number of crista junctions normalized to the mitochondrial outer membrane surface area was significantly lower at 24 months. Moreover, the control (unpolarized) mitochondria had a significantly lower number of crista junctions. n = 10 mitochondria each for 3, 15, 18, and 24 months polarized and unpolarized from 3 mice for each age. *p = 0.0024, 0.0051, and 0.0011 comparing 24 months with 3, 15, and 18 months, respectively. #p = 7.5 × 10⁻⁴, 9.9 × 10⁻⁴, and 1.5 × 10⁻⁴ comparing 3, 15, and 18 months with unpolarized, respectively. K, Occasionally, EM tomography provides an en face view of crista junctions, as seen in this 15 month OHC mitochondrion example. Three crista junctions are seen inside the black box. Each shows a circular opening of relatively uniform size, thus confirming the expected crista junction architecture. Scale bar, 200 nm. For G and J, each data point is represented by a circle. The box-and-whisker plots show median, quartiles min and max.
However, even with this plasticity in crista junction number and polarization, there was no change in crista junction diameter across ages (mean ± SEM = 12 ± 0.8, 10 ± 0.6, 11 ± 0.7, and 10 ± 0.6 for 3, 15, 18, and 24 months, respectively; n = 20 crista junctions per age), suggesting that crista junction function was likely uncompromised by aging. These values are similar to those reported in neurons (Perkins et al., 2010). Our finding that the crista junction diameter and the number of Opa1 RNA molecules did not change with age (Fig. 5) is consistent with the role Opa1 plays in preserving a narrow crista junction width (Darshi et al., 2011; Glytsou et al., 2016; Harner et al., 2016). The deletion of Opa1 or MICOS-complex components affects the mitochondrial membrane potential and cristae structure (Wolf et al., 2019). Occasionally, EM tomography provides an en face view of crista junctions (Fig. 7K). The circular opening of relatively uniform size confirms the expected crista junction architecture in a rare view.
The tethering of mitochondria to the SSC was decreased, and SSC stress was observed at 24 months
Since typically >80% of the mitochondria in the region of the OHC studied were found to be positioned adjacent to the SSC and the mitochondria cristae and crista junctions were polarized in relation to the SSC, we probed for a structural relationship between mitochondria and SSC. We observed that typically fewer mitochondria were positioned adjacent to the SSC in the 24 month OHC (Fig. 8A) compared with younger OHCs (Fig. 8B). Because of the high 3D resolution of EM tomography, we were able to observe at the ages studied that nearly all mitochondria adjacent to the SSC were tethered by short, thin filaments ∼5–10 nm in diameter (Fig. 8C). Typically, there were multiple tethers for each mitochondrion-SSC coupling. The mitochondrion-SSC tethering persisted even when the SSC was swollen (Fig. 8D). We asked whether the shift in the position of mitochondria away from the SSC observed at 24 months could be because of a loss of mitochondria-SSC tethering. Unsurprisingly, we found that the percentage of mitochondria tethered to the SSC by thin filaments in the ROI OHC cytoplasm was lower at 24 month compared with younger mice (Fig. 8E). We then asked whether this untethering could be because of a decrease in the number of tethers. We discovered that there was no difference in the number of tethers per mitochondrion positioned adjacent to the SSC across ages (Fig. 8F), indicating that the positional shift of mitochondria away from the SSC in aged OHCs was likely, not because of weakened mitochondrial-SSC tethering. Because mitochondrial dysfunction can be associated with SSC stress in the OHC (Fujinami et al., 2012), we probed for SSC swelling; swelling is commonly associated with ER stress (Chavez-Valdez et al., 2016). SSC swelling was only significant at 24 months with a noticeable gradation of SSC swelling, both in number and size of swellings, dependent on the state of each OHC (Fig. 8G–K). Measurements of the swollen portions of the SSC volumes were made in the 24 month OHC and are provided as a percentage of the total SSC volume (mean = 16%, SD = 7%, high = 26%, low = 7%, n = 10 OHCs). Occasionally, remodeling of a portion of an SSC was observed that produced a continuous double-membrane sheet (lamella) (Fig. 8L,M). The sheet-like remodeling may impede the high conductivity of the SSC thought to be aided by its meshwork (fenestrations) (Song et al., 2013). This swelling and remodeling are manifestations of stress to the SSC in 24 month OHCs.
Mitochondrial energy production is modeled to be lower at 24 months
During aging, increased ROS production and decreased respiratory chain activity cause a decrease in mitochondrial energy-producing ability (Yin et al., 2016). Changes in OHC mitochondrial size, number, and crista density during aging raised the possibility that the rate of ATP production is altered in aged OHC. To address this question, we used the modeling schema of Song et al. (2013). The first parameter needed for this modeling is the crista shape factor, also called lamellarity. The crista shape factor influences mitochondrial respiratory performance and efficiency (Else et al., 2004; Cogliati et al., 2013; Cserep et al., 2018) with higher values predicting higher performance. Measurements from 3DEM showed that the crista shape factor was slightly lower for 24 month OHC mitochondria compared with 18 month OHC mitochondria (Table 1, first column), suggesting reduced respiratory efficiency. This is consistent with our finding of less cristae membrane surface area, which predicts a decreased proton motive force, leading to lower ATP-producing capacity. The number of ATP molecules produced per second per OHC mitochondrion was modeled to be lower for 24 month mitochondria (Table 1, second column). The value for 18 month mitochondria was higher because these mitochondria were larger than 3 and 15 month mitochondria, yet had the same cristae density. We then desired to know how much energy per second (i.e., power) would be produced in the form of ATP by an OHC mitochondrial volume and available for use by the SSC and lateral PM. Table 1 (third column) shows that modeled power output from ATP hydrolysis for 24 month mitochondria is lower.
Further, the estimated number of mitochondria near the lateral SSC was lower in the 24 month OHC (Table 1, fourth column), which also translated to a reduced number of molecules of ATP per second available for energy needs (Table 1, fifth column). The ATP production rates of OHC mitochondria are in agreement with estimations for other cell types (Attwell and Laughlin, 2001; Babu et al., 2017; Garcia et al., 2019). The flow of ATP through an OHC crista junction is estimated to be 3-4 × 10⁴ molecules/s (Table 1; and graphic associated with Table 1). There was no significant difference across ages because the lowered ATP production at 24 months was complemented with a lower number of crista junctions at that age. Because the ATP production is linearly dependent on the cristae membrane surface area, crista junction number and cristae surface area appear to be coupled for ATP generation and dispersal through the junction consistent with the concept of structurally buffered energy production implied by the spatiotemporal simulations of Garcia et al. (2019). This energy modeling provides a foundation for sequelae involving ATP deficiency and hints that the drop-in modeled ATP production rate in 24 month OHC to less than half of the younger mice may contribute to the functional stress and death observed in aged OHCs of CBA/CaJ mice.
A schematic diagram summarizing our findings is illustrated in Figure 9, where increasing SSC stress with age leads to reduced mitochondrial and cytosolic Ca2+ levels, supporting the hypotheses of dysregulation of OHC mitochondrial biogenesis, reduced modeled ATP production, and cristae degeneration. As our understanding of components of cells improves using 3DEM, it is essential to unravel how they interact with each other by coupling structural nuances with functional determinations to identify underlying molecular mechanisms. We report discoveries of polarization of cristae and crista junctions in mitochondria adjacent to the SSC and that short, thin filaments tether these organelles. Coupling reduced mitochondrial membrane potential, Drp1 RNA levels, mitochondrial Ca2+ level and responsiveness to external K+ stimulation, and SSC stress with the plasticity of cristae and crista junctions in aged OHCs provide mechanistic insight for the mitochondrion’s influence in the progression of aging. Finally, the application of theoretical modeling of ATP production based on 3D cristae structure opens the door to multiscale energy considerations not only for ARHL but also for normal cellular functions and other diseases.
Figure 9.

Schematic diagrams represent how altered organelle connectomics in the OHC may contribute to progressive HL. The PM, SSC, and mitochondria are part of the OHC’s Ca2+-regulating machinery; and in the young animal, Ca2+ homeostasis is maintained. Mitochondria tethered to the SSC have cristae polarized toward it. In contrast, the old animal exhibits SSC stress, mitochondrial fission/fusion imbalance, and a remarkable reduction in mitochondrial and cytoplasmic Ca2+ levels. When extracellular K+ is elevated, Ca2+ enters the cell through the Cav and is uploaded into the SSC-tethered mitochondria. In the old animal, there is reduced K+-induced mitochondrial Ca2+ upload, enlarged, yet fewer mitochondria, fewer cristae, SSC swelling, and fewer mitochondria tethered to the SSC. The altered Ca2+ homeostasis underpins the candidate hypothesis that disruption of organelle connectomics is a mechanism for HL. PM, Plasma membrane; mito, mitochondrion; Cav, voltage-gated Ca2+ channel.
Discussion
Implications of reduced Drp1 and altered Ca2+ homeostasis for ARHL
The molecular mechanisms underlying ARHL are mainly unknown. Thus, the report that oxidative stress induces Bak-dependent mitochondrial apoptosis in the C57BL/6J mouse model provided critical mechanistic insight into ARHL (Someya and Prolla, 2010). We report a second molecular mechanism contributing to ARHL-inhibited Drp1 RNA expression in the larger mitochondria of 24 month CBA/CaJ mice (Fig. 5). This result agrees with the report by Favaro et al. (2019) that Drp1-deficient mitochondria are larger. They also report that Ca2+ uptake into the mitochondria was abnormal, and the ER showed stress, two features we observed at 24 month OHCs (Figs. 1, 8; Movie 1). The tethering of OHC mitochondria to the SSC, sites of Ca2+ release, suggest that they are the first to sense transients in Ca2+ concentration via the MCU complex (De Stefani et al., 2011) and would motivate future work to test the hypothesis that the lowered response by 24 month OHC mitochondria to a surge in cytosolic Ca2+ concentration (Fig. 1) is linked to reduced expression or function of the MCU complex or its regulator, MCUR1 (Mallilankaraman et al., 2012). In other studies, Drp1 ablation in mouse adult forebrain altered synaptic transmission as well as decreased oxygen consumption and ATP production (Oettinghaus et al., 2016), consistent with our modeling of lowered ATP-producing capacity in Drp1-deficient, aged OHC mitochondria (Table 1; Extended Data Table 1-1). Finally, Drp1 was also reduced in mouse cardiac and skeletal muscles during aging (Zhou et al., 2017), which couples aging to Drp1 deficiency and perturbed Ca2+ homeostasis (Favaro et al., 2019). Aging could impact mitochondrial more broadly in the auditory pathway to impair hearing.
Crista shape and size and crista junction structure influence the rate of ATP production. The modeling of Song et al. (2013) used spatial representations of cristae, inner boundary membrane, and crista junctions with dimensions and geometry derived from electron microscope tomography. Shown is a model of a crista junction and part of a crista. The crista junction has a diameter of 11 nm, the mean value from our measurements, consistent across ages. The “ATP stream” is represented by many copies of the surface representation of the atomic-resolution structure of ATP in different orientations with accurate scaling of ATP molecule size; the Stokes-Einstein diameter of an ATP molecule is 1.4 nm. The biophysical model estimates that the ATP stream going through each OHC crista junction is about 3 × 10⁴ ATP/s, giving the impression that a crista junction is like an ATP fire nozzle. Download Table 1-1, TIF file (1.2MB, tif)
Tomographic volume and surfaced-rendered volume after membrane segmentation of a mitochondrion and SSC in a 15 month OHC. First sequence, Moving quickly through the z slices of the tomographic volume. Second sequence, Rotations of the surface-renTY dered volume. Chocolate represents the SSC meshwork. Rosy brown represents the mitochondrial inner boundary membrane. Various shades of brown represent the cristae. Third sequence, Rotation of the SSC only. Fourth sequence, The cristae rotated with the mitochondrial inner boundary membrane made translucent to see the cristae better. Fifth sequence, Rotation with crista junctions added as a black with the same mean diameter as measured, ∼14 nm. Seven crista junctions face toward the SSC and four faces away, showing the polarization. Sixth sequence, Rotation with the mitochondrial inner boundary membrane made opaque to see the crista junction distribution better. Seventh sequence, All the segmentation.
Increased mitochondrial size and decreased mitochondrial membrane potential in older OHCs suggest a reduced capacity for ATP generation
The 3DEM of this study uncovered mitochondrial structural details, some of which were modified with age, having several functional implications for ARHL. The observed increase in mitochondrial size at 18 and 24 months in OHCs (Fig. 4) and its correlation to a decrease in mitochondrial membrane potential (Fig. 2) reflect similar findings in the aged brain and spinal ganglion neurons (Sastre et al., 2000; Martinelli et al., 2006). They may represent a decrease in mitochondrial complex I-linked state 3 respiration (Thomsen et al., 2018). An increase in mitochondrial size has been associated with metabolic and oxidative stress (Gouras et al., 2016). The metabolic competence, as measured by cytochrome oxidase density inside mitochondria, of the largest synaptic mitochondria in monkey cerebellum decreased with age (Bertoni-Freddari et al., 2008). If this result can be translated to mouse OHC, then the 24 month OHC mitochondria, which are significantly larger than those at 3 and 15 months, nonetheless displaying significantly fewer cristae, may represent reduced numbers of cytochrome oxidase and perhaps other OXPHOS complexes, which in turn may reflect a reduced capacity for ATP generation that would affect OHC functions. A decrease in mitochondrial membrane potential, as found for 24 month OHCs, and respiration would also lower the capacity of the mitochondrion to produce ATP, stressing OHC and potentially leading to cell death.
Mitochondria tethered to the SSC have polarized cristae
Cristae architecture reflects the energy demands of a cell even within periods as short as 10 min (Dlaskova et al., 2019). Cristae polarization toward the SSC was shown in OHCs but not recognized (Lim, 1986; Schulte, 1993; Weaver and Schweitzer, 1994; Spicer et al., 1998). Using the gerbil, Spicer et al. (1998) showed that most mitochondria (27 of 37; 73%) displayed strong cristae polarization, higher than that found in the mouse. Cristae polarization was first analyzed in the mitochondria-associated adherens complex (MAC) of the calyx of Held (Perkins et al., 2010, 2015). The near-perfect polarization of cristae toward the presynaptic membrane is one of the defining features of MAC mitochondria. Recently, cristae polarization was also reported in brown adipocytes in the subpopulation of mitochondria adjacent to a lipid droplet (Varghese et al., 2019). These peri-droplet mitochondria are anchored to the lipid droplet, not unlike the tethering of OHC mitochondria to the SSC.
May cristae polarization aid Ca2+ sensing?
Mitochondria close to the SSC may calibrate their ATP production by efficiently sensing Ca2+ levels because of their cristae polarization. The preferred perpendicular orientation of cristae (Fig. 6) in OHC mitochondria tethered to the SSC, which releases Ca2+ via its ryanodine receptor, may facilitate entry of Ca2+. Diffusion along cristae “highways” extending the length of OHC mitochondria, as proposed for mitochondria in the auditory brainstem MAC (Perkins et al., 2010, 2015). Close apposition of the three membranes separating the SSC lumen from the mitochondrial matrix is likely essential for efficient Ca2+ transport because the affinity of the MCU for Ca2+ is surprisingly low (De Stefani et al., 2011; Kamer and Mootha, 2015). Therefore, mitochondria-SSC tethering may be critical so that a spatially restricted microdomain of high Ca2+ concentration is created (De Stefani et al., 2016) and may provide a structural framework for bidirectional signaling between the two organelles that are developmentally regulated as reported in the muscle (Boncompagni et al., 2009). Ca2+ uptake into mitochondria stimulates ATP production mainly via activation of tricarboxylic acid cycle enzymes (Denton and McCormack, 1980). Reduced Ca2+ uptake into aged mitochondria would inhibit ATP production. One function of ATP in the OHC is to fuel the release of Ca2+ from the SSC. Ca2+-induced Ca2+ release in the mammalian cochlea has been suggested to facilitate efferent transmission in OHCs (Grant et al., 2006). Aging weakens the control of Ca2+ homeostasis, which can impact the maintenance of a proper energy level (Kopke et al., 1999; Tavanai and Mohammadkhani, 2017; Castelli et al., 2019). Our findings of lowered mitochondrial Ca2+ level, mitochondria less responsive to elevated cytosolic Ca2+ concentration, and modeled reduction in mitochondrial ATP production capacity in aged OHCs point to compromised efferent transmission and energy stress in ARHL.
Crista junction alterations in the aged OHC
The preference for crista junctions to face the SSC in OHCs (Fig. 6) reflects functional crosstalk between the MICOS proteins at this junction and the respiratory chain complexes (Harner et al., 2014; Chojnacka et al., 2015; Friedman et al., 2015; van der Laan et al., 2016) that we hypothesize attunes crista biogenesis to the needs of the SSC. This hypothesis is supported by the ability of a MICOS protein, MIC10, to travel out of crista junctions and stabilize rows of ATP synthase dimers to grow lamellar cristae, the only type of cristae found in OHC mitochondria (Eydt et al., 2017; Rampelt et al., 2017b). Further, MICOS-mediated crista junction formation through MIC60 is linked to the activity of complex IV via its subunit, Cox17 (Chojnacka et al., 2015). Our finding of slow decay in mitochondrial depolarization at 24 month OHCs (Fig. 2D) appears not to be related to Opa1 impairment but may be tied to perturbation of the MICOS complex. The significant increase in crista junction polarization in 24 month mitochondria may be a compensatory attempt to signal for crista biogenesis in mitochondria that have lost crista numbers and size. The extent of 24 month crista junction polarization is similar to that reported for MAC mitochondria (Perkins et al., 2010), which had nearly twice as many crista junctions facing the synaptic side compared with facing away from the synapse (174 vs 96, ratio = 1.81). In summary, a perturbation of crista junction number and polarity, as observed in aged OHC mitochondria, likely alter respiration.
The molecular basis for the observed decrease in crista junction numbers in 24 month OHC mitochondria may center on two proteins: the MICU1 and PTEN-induced kinase 1 (PINK1). The MCU complex contains three core proteins: MICU1, MCU, and EMRE. MICU1 stabilizes crista junctions and the mitochondrial membrane potential (Gottschalk et al., 2019). When the mitochondrial Ca2+ level is elevated, MCU and EMRE join MICU1 at the mitochondrial inner boundary membrane in a dynamic manner regulated by MICU1. Our findings of fewer crista junctions, reduced mitochondrial membrane potential, and lowered mitochondrial Ca2+ level and responsiveness to K+ stimulation in 24 month OHC mitochondria begs the question, “In aged OHC, could there occur lowered expression or mislocalization of MCU complex proteins?” In support of this hypothesis, loss of MCUR1 induces a decrease in mitochondrial membrane potential leading indirectly to lowered mitochondrial Ca2+ uptake (Raffaello et al., 2016). Recently, it was discovered that PINK1 was required to phosphorylate MIC60 for crista junction numbers to increase (Tsai et al., 2018).
Perturbations to MICOS proteins that regulate crista junctions may also be involved with the observed crista junction remodeling at 24 months. Mic60, Mic13, and QIL1 are essential for the formation of crista junctions (John et al., 2005; Rabl et al., 2009; Guarani et al., 2015; Anand et al., 2016). Mic10 curves crista junctions, forming a membrane-sculpting scaffold for stabilizing the large MICOS complex (Eydt et al., 2017). Mammalian Mic27 specifically binds the membrane-curving phospholipid cardiolipin. Mutations to the genes or under-expression of these 5 MICOS components may contribute to the change in crista junction numbers in 24 month OHC mitochondria.
Footnotes
This work was supported by National Institutes of Health Grants P01 AG051443, R01 DC015135, R01 DC016099, R01 AG060504-01, and 5P41 GM103412-29 to National Center for Microscopy and Imaging Research. We apologize to the authors whose pertinent publications we were not able to cite because of a word limit for the Introduction and Discussion sections.
The authors declare no competing financial interests.
References
- Anand R, Strecker V, Urbach J, Wittig I, Reichert AS (2016) Mic13 is essential for formation of crista junctions in mammalian cells. PLoS One 11:e0160258. 10.1371/journal.pone.0160258 [DOI] [PMC free article] [PubMed] [Google Scholar]
- Attwell D, Laughlin SB (2001) An energy budget for signaling in the grey matter of the brain. J Cereb Blood Flow Metab 21:1133–1145. 10.1097/00004647-200110000-00001 [DOI] [PubMed] [Google Scholar]
- Babu V, Vazirian S, Perkins G, Lysakowski A (2017) Energy output of mitochondria located near synaptic ribbons in inner ear hair cells. FASEB J 31:740–21.. [Google Scholar]
- Bai U, Seidman MD, Hinojosa R, Quirk WS (1997) Mitochondrial DNA deletions associated with aging and possibly presbycusis: a human archival temporal bone study. Am J Otol 18:449–453. [PubMed] [Google Scholar]
- Bawa B, Abbott LC (2008) Analysis of calcium ion homeostasis and mitochondrial function in cerebellar granule cells of adult CaV 2.1 calcium ion channel mutant mice. Neurotox Res 13:1–18. [DOI] [PubMed] [Google Scholar]
- Bertoni-Freddari C, Balietti M, Giorgetti B, Grossi Y, Casoli T, Di Stefano G, Perretta G, Fattoretti P (2008) Selective decline of the metabolic competence of oversized synaptic mitochondria in the old monkey cerebellum. Rejuvenation Res 11:387–391. 10.1089/rej.2008.0659 [DOI] [PubMed] [Google Scholar]
- Boncompagni S, Rossi AE, Micaroni M, Beznoussenko GV, Polishchuk RS, Dirksen RT, Protasi F (2009) Mitochondria are linked to calcium stores in striated muscle by developmentally regulated tethering structures. Mol Biol Cell 20:1058–1067. 10.1091/mbc.e08-07-0783 [DOI] [PMC free article] [PubMed] [Google Scholar]
- Bottger EC, Schacht J (2013) The mitochondrion: a perpetrator of acquired hearing loss. Hearing Research 303:12–19. [DOI] [PMC free article] [PubMed] [Google Scholar]
- Brandt T, Mourier A, Tain LS, Partridge L, Larsson NG, Kuhlbrandt W (2017) Changes of mitochondrial ultrastructure and function during ageing in mice and Drosophila. Elife 6:e24662 10.7554/eLife.24662 [DOI] [PMC free article] [PubMed] [Google Scholar]
- Castelli V, Benedetti E, Antonosante A, Catanesi M, Pitari G, Ippoliti R, Cimini A, d’Angelo M (2019) Neuronal cells rearrangement during aging and neurodegenerative disease: metabolism, oxidative stress and organelles dynamic. Front Mol Neurosci 12:132. 10.3389/fnmol.2019.00132 [DOI] [PMC free article] [PubMed] [Google Scholar]
- Chavez-Valdez R, Flock DL, Martin LJ, Northington FJ (2016) Endoplasmic reticulum pathology and stress response in neurons precede programmed necrosis after neonatal hypoxia-ischemia. Int J Dev Neurosci 48:58–70. [DOI] [PMC free article] [PubMed] [Google Scholar]
- Chen H, Tang J (2014) The role of mitochondria in age-related hearing loss. Biogerontology 15:13–19. 10.1007/s10522-013-9475-y [DOI] [PubMed] [Google Scholar]
- Chojnacka M, Gornicka A, Oeljeklaus S, Warscheid B, Chacinska A (2015) Cox17 protein is an auxiliary factor involved in the control of the mitochondrial contact site and cristae organizing system. J Biol Chem 290:15304–15312. 10.1074/jbc.M115.645069 [DOI] [PMC free article] [PubMed] [Google Scholar]
- Cogliati S, Frezza C, Soriano ME, Varanita T, Quintana-Cabrera R, Corrado M, Cipolat S, Costa V, Casarin A, Gomes LC, Perales-Clemente E, Salviati L, Fernandez-Silva P, Enriquez JA, Scorrano L (2013) Mitochondrial cristae shape determines respiratory chain supercomplexes assembly and respiratory efficiency. Cell 155:160–171. 10.1016/j.cell.2013.08.032 [DOI] [PMC free article] [PubMed] [Google Scholar]
- Cserep C, Posfai B, Schwarcz AD, Denes A (2018) Mitochondrial ultrastructure is coupled to synaptic performance at axonal release sites. eNeuro 5: ENEURO.0390-17.2018. [DOI] [PMC free article] [PubMed] [Google Scholar]
- Darshi M, Mendiola VL, Mackey MR, Murphy AN, Koller A, Perkins GA, Ellisman MH, Taylor SS (2011) ChChd3, an inner mitochondrial membrane protein, is essential for maintaining crista integrity and mitochondrial function. J Biol Chem 286:2918–2932. 10.1074/jbc.M110.171975 [DOI] [PMC free article] [PubMed] [Google Scholar]
- De Stefani D, Raffaello A, Teardo E, Szabo I, Rizzuto R (2011) A forty-kilodalton protein of the inner membrane is the mitochondrial calcium uniporter. Nature 476:336–340. 10.1038/nature10230 [DOI] [PMC free article] [PubMed] [Google Scholar]
- De Stefani D, Rizzuto R, Pozzan T (2016) Enjoy the trip: calcium in mitochondria back and forth. Annu Rev Biochem 85:161–192. 10.1146/annurev-biochem-060614-034216 [DOI] [PubMed] [Google Scholar]
- Denton RM, McCormack JG (1980) The role of calcium in the regulation of mitochondrial metabolism. Biochem Soc Trans 8:266–268. 10.1042/bst0080266 [DOI] [PubMed] [Google Scholar]
- Dlaskova A, Spacek T, Engstova H, Spackova J, Schrofel A, Holendova B, Smolkova K, Plecita-Hlavata L, Jezek P (2019) Mitochondrial cristae narrowing upon higher 2-oxoglutarate load. Biochim Biophys Acta Bioenerg 1860:659–678. [DOI] [PubMed] [Google Scholar]
- Else PL, Brand MD, Turner N, Hulbert AJ (2004) Respiration rate of hepatocytes varies with body mass in birds. J Exp Biol 207:2305–2311. 10.1242/jeb.01017 [DOI] [PubMed] [Google Scholar]
- Eydt K, Davies KM, Behrendt C, Wittig I, Reichert AS (2017) Cristae architecture is determined by an interplay of the MICOS complex and the F1FO ATP synthase via Mic27 and Mic10. Microb Cell 4:259–272. 10.15698/mic2017.08.585 [DOI] [PMC free article] [PubMed] [Google Scholar]
- Favaro G, Romanello V, Varanita T, Andrea Desbats M, Morbidoni V, Tezze C, Albiero M, Canato M, Gherardi G, De Stefani D, Mammucari C, Blaauw B, Boncompagni S, Protasi F, Reggiani C, Scorrano L, Salviati L, Sandri M (2019) DRP1-mediated mitochondrial shape controls calcium homeostasis and muscle mass. Nat Commun 10:2576. 10.1038/s41467-019-10226-9 [DOI] [PMC free article] [PubMed] [Google Scholar]
- Fischel-Ghodsian N, Bykhovskaya Y, Taylor K, Kahen T, Cantor R, Ehrenman K, Smith R, Keithley E (1997) Temporal bone analysis of patients with presbycusis reveals high frequency of mitochondrial mutations. Hear Res 110:147–154. 10.1016/s0378-5955(97)00077-4 [DOI] [PubMed] [Google Scholar]
- Friedman JR, Mourier A, Yamada J, McCaffery JM, Nunnari J (2015) MICOS coordinates with respiratory complexes and lipids to establish mitochondrial inner membrane architecture. Elife 4:e07739 10.7554/eLife.07739 [DOI] [PMC free article] [PubMed] [Google Scholar]
- Fuchs PA. (2014) A ‘calcium capacitor’ shapes cholinergic inhibition of cochlear hair cells. J Physiol 592:3393–3401. [DOI] [PMC free article] [PubMed] [Google Scholar]
- Fujimoto C, Yamasoba T (2014) Oxidative stresses and mitochondrial dysfunction in age-related hearing loss. Oxid Med Cell Longev 2014:582849. 10.1155/2014/582849 [DOI] [PMC free article] [PubMed] [Google Scholar]
- Fujinami Y, Mutai H, Mizutari K, Nakagawa S, Matsunaga T (2012) A novel animal model of hearing loss caused by acute endoplasmic reticulum stress in the cochlea. J Pharmacol Sci 118:363–372. [DOI] [PubMed] [Google Scholar]
- Garcia GC, Bartol TM, Bushong E, Perkins G, Sejnowski TJ, Ellisman MH, Skupin A (2019) Mitochondrial morphology provides a mechanism for energy buffering at synapses. Sci Rep 9:18306. [DOI] [PMC free article] [PubMed] [Google Scholar]
- Gates GA, Mills JH (2005) Presbycusis. Lancet 366:1111–1120. 10.1016/S0140-6736(05)67423-5 [DOI] [PubMed] [Google Scholar]
- Glytsou C, Calvo E, Cogliati S, Mehrotra A, Anastasia I, Rigoni G, Raimondi A, Shintani N, Loureiro M, Vazquez J, Pellegrini L, Enriquez JA, Scorrano L, Soriano ME (2016) Optic atrophy 1 is epistatic to the core MICOS component MIC60 in mitochondrial cristae shape control. Cell Rep 17:3024–3034. 10.1016/j.celrep.2016.11.049 [DOI] [PMC free article] [PubMed] [Google Scholar]
- Gottschalk B, Klec C, Leitinger G, Bernhart E, Rost R, Bischof H, Madreiter-Sokolowski CT, Radulović S, Eroglu E, Sattler W, Waldeck-Weiermair M, Malli R, Graier WF (2019) MICU1 controls cristae junction and spatially anchors mitochondrial Ca2+ uniporter complex. Nat Commun 10:3732. 10.1038/s41467-019-11692-x [DOI] [PMC free article] [PubMed] [Google Scholar]
- Gouras P, Ivert L, Neuringer M, Nagasaki T (2016) Mitochondrial elongation in the macular RPE of aging monkeys, evidence of metabolic stress. Graefes Arch Clin Exp Ophthalmol 254:1221–1227. 10.1007/s00417-016-3342-x [DOI] [PMC free article] [PubMed] [Google Scholar]
- Grant L, Slapnick S, Kennedy H, Hackney C (2006) Ryanodine receptor localisation in the mammalian cochlea: an ultrastructural study. Hear Res 219:101–109. 10.1016/j.heares.2006.06.002 [DOI] [PubMed] [Google Scholar]
- Guarani V, McNeill EM, Paulo JA, Huttlin EL, Fröhlich F, Gygi SP, Van Vactor D, Harper JW (2015) QIL1 is a novel mitochondrial protein required for MICOS complex stability and cristae morphology. Elife 4:e06265 10.7554/eLife.06265 [DOI] [PMC free article] [PubMed] [Google Scholar]
- Han C, Someya S (2013) Mouse models of age-related mitochondrial neurosensory hearing loss. Mol Cell Neurosci 55:95–100. 10.1016/j.mcn.2012.07.004 [DOI] [PMC free article] [PubMed] [Google Scholar]
- Harner ME, Unger AK, Izawa T, Walther DM, Ozbalci C, Geimer S, Reggiori F, Brügger B, Mann M, Westermann B, Neupert W (2014) Aim24 and MICOS modulate respiratory function, tafazzin-related cardiolipin modification and mitochondrial architecture. Elife 3:e01684. 10.7554/eLife.01684 [DOI] [PMC free article] [PubMed] [Google Scholar]
- Harner ME, Unger AK, Geerts WJ, Mari M, Izawa T, Stenger M, Geimer S, Reggiori F, Westermann B, Neupert W (2016) An evidence based hypothesis on the existence of two pathways of mitochondrial crista formation. Elife 5:e18853 10.7554/eLife.18853 [DOI] [PMC free article] [PubMed] [Google Scholar]
- He ZZ, Dallos P (1999a) Somatic stiffness of cochlear outer hair cells is voltage-dependent. Proc Natl Acad Sci USA 96:8223–8228. 10.1073/pnas.96.14.8223 [DOI] [PMC free article] [PubMed] [Google Scholar]
- He ZZ, Dallos P (1999b) Development of acetylcholine-induced responses in neonatal gerbil outer hair cells. J Neurophysiol 81:1162–1170. 10.1152/jn.1999.81.3.1162 [DOI] [PubMed] [Google Scholar]
- Ivannikov MV, Macleod GT (2013) Mitochondrial free Ca2+ levels and their effects on energy metabolism in Drosophila motor nerve terminals. Biophys J 104:2353–2361. 10.1016/j.bpj.2013.03.064 [DOI] [PMC free article] [PubMed] [Google Scholar]
- John GB, Shang Y, Li L, Renken C, Mannella CA, Selker JM, Rangell L, Bennett MJ, Zha J (2005) The mitochondrial inner membrane protein mitofilin controls cristae morphology. Mol Biol Cell 16:1543–1554. 10.1091/mbc.e04-08-0697 [DOI] [PMC free article] [PubMed] [Google Scholar]
- Kamer KJ, Mootha VK (2015) The molecular era of the mitochondrial calcium uniporter. Nat Rev Mol Cell Biol 16:545–553. 10.1038/nrm4039 [DOI] [PubMed] [Google Scholar]
- Karaki H, Urakawa N, Kutsky P (1984) Potassium-induced contraction in smooth muscle. Nihon Heikatsukin Gakkai Zasshi 20:427–444. [DOI] [PubMed] [Google Scholar]
- Keithley EM. (2020) Pathology and mechanisms of cochlear aging. J Neurosci Res 98:1674–1684. 10.1002/jnr.24439 [DOI] [PMC free article] [PubMed] [Google Scholar]
- Kopke R, Allen KA, Henderson D, Hoffer M, Frenz D, Van de Water T (1999) A radical demise: toxins and trauma share common pathways in hair cell death. Ann NY Acad Sci 884:171–191. 10.1111/j.1749-6632.1999.tb08641.x [DOI] [PubMed] [Google Scholar]
- Kujawa SG, Fallon M, Skellett RA, Bobbin RP (1996) Time-varying alterations in the f2-f1 DPOAE response to continuous primary stimulation: II. Influence of local calcium-dependent mechanisms. Hear Res 97:153–164. [PubMed] [Google Scholar]
- Lim DJ. (1986) Functional structure of the organ of Corti: a review. Hear Res 22:117–146. 10.1016/0378-5955(86)90089-4 [DOI] [PubMed] [Google Scholar]
- Mallilankaraman K, Cárdenas C, Doonan JP, Chandramoorthy HC, Irrinki KM, Golenár T, Csordás T, Madireddi P, Yang J, Müller M, Miller R, Kolesar JE, Molgó J, Kaufman B, Hajnóczky G, Foskett JK, Madesh M (2012) MCUR1 is an essential component of mitochondrial Ca2+ uptake that regulates cellular metabolism. Nat Cell Biol 14:1336–1343. [DOI] [PMC free article] [PubMed] [Google Scholar]
- Mammano F, Frolenkov GI, Lagostena L, Belyantseva IA, Kurc M, Dodane V, Colavita A, Kachar B (1999) ATP-Induced Ca(2+) release in cochlear outer hair cells: localization of an inositol triphosphate-gated Ca(2+) store to the base of the sensory hair bundle. J Neurosci 15:6918–6929. [DOI] [PMC free article] [PubMed] [Google Scholar]
- Markaryan A, Nelson EG, Hinojosa R (2009) Quantification of the mitochondrial DNA common deletion in presbycusis. Laryngoscope 119:1184–1189. 10.1002/lary.20218 [DOI] [PubMed] [Google Scholar]
- Martinelli C, Sartori P, Ledda M, Pannese E (2006) A study of mitochondria in spinal ganglion neurons during life: quantitative changes from youth to extremely advanced age. Tissue Cell 38:93–98. 10.1016/j.tice.2005.12.002 [DOI] [PubMed] [Google Scholar]
- Meyer J, Mack AF, Gummer AW (2001) Pronounced infracuticular endocytosis in mammalian outer hair cells. Hear Res 161:10–22. [DOI] [PubMed] [Google Scholar]
- Muller M, von Hunerbein K, Hoidis S, Smolders JW (2005) A physiological place-frequency map of the cochlea in the CBA/J mouse. Hear Res 202:63–73. 10.1016/j.heares.2004.08.011 [DOI] [PubMed] [Google Scholar]
- Oettinghaus B, Schulz JM, Restelli LM, Licci M, Savoia C, Schmidt A, Schmitt K, Grimm A, Morè L, Hench J, Tolnay M, Eckert A, D’Adamo P, Franken P, Ishihara N, Mihara K, Bischofberger J, Scorrano L, Frank S (2016) Synaptic dysfunction, memory deficits and hippocampal atrophy due to ablation of mitochondrial fission in adult forebrain neurons. Cell Death Differ 23:18–28. 10.1038/cdd.2015.39 [DOI] [PMC free article] [PubMed] [Google Scholar]
- Ohlemiller KK. (2006) Contributions of mouse models to understanding of age- and noise-related hearing loss. Brain Res 1091:89–102. 10.1016/j.brainres.2006.03.017 [DOI] [PubMed] [Google Scholar]
- Paredes RM, Etzler JC, Watts LT, Zheng W, Lechleiter JD (2008) Chemical calcium indicators. Methods 46:143–151. 10.1016/j.ymeth.2008.09.025 [DOI] [PMC free article] [PubMed] [Google Scholar]
- Perkins GA, Ellisman MH (2011) Mitochondrial configurations in peripheral nerve suggest differential ATP production. J Struct Biol 173:117–127. 10.1016/j.jsb.2010.06.017 [DOI] [PMC free article] [PubMed] [Google Scholar]
- Perkins GA, Bossy-Wetzel E, Ellisman MH (2009) New insights into mitochondrial structure during cell death. Exp Neurol 218:183–192. 10.1016/j.expneurol.2009.05.021 [DOI] [PMC free article] [PubMed] [Google Scholar]
- Perkins GA, Tjong J, Brown JM, Poquiz PH, Scott RT, Kolson DR, Ellisman MH, Spirou GA (2010) The micro-architecture of mitochondria at active zones: electron tomography reveals novel anchoring scaffolds and cristae structured for high-rate metabolism. J Neurosci 30:1015–1026. 10.1523/JNEUROSCI.1517-09.2010 [DOI] [PMC free article] [PubMed] [Google Scholar]
- Perkins GA, Jackson DR, Spirou GA (2015) Resolving presynaptic structure by electron tomography. Synapse 69:268–282. 10.1002/syn.21813 [DOI] [PMC free article] [PubMed] [Google Scholar]
- Pozzan T, Rizzuto R, Volpe P, Meldolesi J (1994) Molecular and cellular physiology of intracellular calcium stores. Physiol Rev 74:595–636. [DOI] [PubMed] [Google Scholar]
- Puschner B, Schacht J (1997) Energy metabolism in cochlear outer hair cells in vitro. Hear Res 114:102–106. 10.1016/s0378-5955(97)00163-9 [DOI] [PubMed] [Google Scholar]
- Rabl R, Soubannier V, Scholz R, Vogel F, Mendl N, Vasiljev-Neumeyer A, Körner C, Jagasia R, Keil T, Baumeister W, Cyrklaff M, Neupert W, Reichert AS (2009) Formation of cristae and crista junctions in mitochondria depends on antagonism between Fcj1 and Su e/g. J Cell Biol 185:1047–1063. 10.1083/jcb.200811099 [DOI] [PMC free article] [PubMed] [Google Scholar]
- Raffaello A, Mammucari C, Gherardi G, Rizzuto R (2016) Calcium at the center of cell signaling: interplay between endoplasmic reticulum, mitochondria, and lysosomes. Trends Biochem Sci 41:1035–1049. 10.1016/j.tibs.2016.09.001 [DOI] [PMC free article] [PubMed] [Google Scholar]
- Rampelt H, Bohnert M, Zerbes RM, Horvath SE, Warscheid B, Pfanner N, van der Laan M (2017a) Mic10, a core subunit of the mitochondrial contact site and cristae organizing system, interacts with the dimeric F1Fo-ATP synthase. J Mol Biol 429:1162–1170. 10.1016/j.jmb.2017.03.006 [DOI] [PubMed] [Google Scholar]
- Rampelt H, Zerbes RM, van der Laan M, Pfanner N (2017b) Role of the mitochondrial contact site and cristae organizing system in membrane architecture and dynamics. Biochim Biophys Acta Mol Cell Res 1864:737–746. 10.1016/j.bbamcr.2016.05.020 [DOI] [PubMed] [Google Scholar]
- Reijntjes DO, Lee JH, Park S, Schubert NM, van Tuinen M, Vijayakumar S, Jones TA, Jones SM, Gratton MA, Xia XM, Yamoah EN, Pyott SJ (2019) Sodium-activated potassium channels shape peripheral auditory function and activity of the primary auditory neurons in mice. Sci Rep 9:2573. 10.1038/s41598-019-39119-z [DOI] [PMC free article] [PubMed] [Google Scholar]
- Sang L, Zheng T, Min L, Zhang X, Ma X, Entenman S, Su Y, Zheng Q (2017) Otoprotective effects of ethosuximide in NOD/LtJ mice with age-related hearing loss. Int J Mol Med 40:146–154. 10.3892/ijmm.2017.3004 [DOI] [PMC free article] [PubMed] [Google Scholar]
- Sastre J, Pallardo FV, Vina J (2000) Mitochondrial oxidative stress plays a key role in aging and apoptosis. IUBMB Life 49:427–435. [DOI] [PubMed] [Google Scholar]
- Sastri M, Darshi M, Mackey M, Ramachandra R, Ju S, Phan S, Adams S, Stein K, Douglas CR, Kim JJ, Ellisman MH, Taylor SS, Perkins GA (2017) Sub-mitochondrial localization of the genetic-tagged mitochondrial intermembrane space-bridging components Mic19, Mic60 and Sam50. J Cell Sci 130:3248–3260. 10.1242/jcs.201400 [DOI] [PMC free article] [PubMed] [Google Scholar]
- Schorr S, van der Laan M (2018) Integrative functions of the mitochondrial contact site and cristae organizing system. Semin Cell Dev Biol 76:191–200. 10.1016/j.semcdb.2017.09.021 [DOI] [PubMed] [Google Scholar]
- Schuknecht HF, Gacek MR (1993) Cochlear pathology in presbycusis. Ann Otol Rhinol Laryngol 102:1–16. 10.1177/00034894931020S101 [DOI] [PubMed] [Google Scholar]
- Schulte BA. (1993) Immunohistochemical localization of intracellular Ca-ATPase in outer hair cells, neurons and fibrocytes in the adult and developing inner ear. Hear Res 65:262–273. 10.1016/0378-5955(93)90219-q [DOI] [PubMed] [Google Scholar]
- Sergeyenko Y, Lall K, Liberman MC, Kujawa SG (2013) Age-related cochlear synaptopathy: an early-onset contributor to auditory functional decline. J Neurosci 33:13686–13694. [DOI] [PMC free article] [PubMed] [Google Scholar]
- Someya S, Prolla TA (2010) Mitochondrial oxidative damage and apoptosis in age-related hearing loss. Mech Ageing Dev 131:480–486. 10.1016/j.mad.2010.04.006 [DOI] [PMC free article] [PubMed] [Google Scholar]
- Someya S, Yamasoba T, Kujoth GC, Pugh TD, Weindruch R, Tanokura M, Prolla TA (2008) The role of mtDNA mutations in the pathogenesis of age-related hearing loss in mice carrying a mutator DNA polymerase gamma. Neurobiol Aging 29:1080–1092. 10.1016/j.neurobiolaging.2007.01.014 [DOI] [PMC free article] [PubMed] [Google Scholar]
- Someya S, Xu J, Kondo K, Ding D, Salvi RJ, Yamasoba T, Rabinovitch PS, Weindruch R, Leeuwenburgh C, Tanokura M, Prolla TA (2009) Age-related hearing loss in C57BL/6J mice is mediated by Bak-dependent mitochondrial apoptosis. Proc Natl Acad Sci USA 106:19432–19437. 10.1073/pnas.0908786106 [DOI] [PMC free article] [PubMed] [Google Scholar]
- Song DH, Park J, Maurer LL, Lu W, Philbert MA, Sastry AM (2013) Biophysical significance of the inner mitochondrial membrane structure on the electrochemical potential of mitochondria. Phys Rev E Stat Nonlin Soft Matter Phys 88:062723. 10.1103/PhysRevE.88.062723 [DOI] [PMC free article] [PubMed] [Google Scholar]
- Spicer SS, Thomopoulos GN, Schulte BA (1998) Cytologic evidence for mechanisms of K+ transport and genesis of Hensen bodies and subsurface cisternae in outer hair cells. Anat Rec 251:97–113. [DOI] [PubMed] [Google Scholar]
- Tavanai E, Mohammadkhani G (2017) Role of antioxidants in prevention of age-related hearing loss: a review of literature. Eur Arch Otorhinolaryngol 274:1821–1834. 10.1007/s00405-016-4378-6 [DOI] [PubMed] [Google Scholar]
- Thomsen K, Yokota T, Hasan-Olive MM, Sherazi N, Fakouri NB, Desler C, Regnell CE, Larsen S, Rasmussen LJ, Dela F, Bergersen LH, Lauritzen M (2018) Initial brain aging: heterogeneity of mitochondrial size is associated with decline in complex I-linked respiration in cortex and hippocampus. Neurobiol Aging 61:215–224. 10.1016/j.neurobiolaging.2017.08.004 [DOI] [PubMed] [Google Scholar]
- Triffo WJ, Palsdottir H, Song J, Morgan DG, McDonald KL, Auer M, Raphael RM (2019) 3D Ultrastructure of the Cochlear Outer Hair Cell Lateral Wall Revealed By Electron Tomography. Front Cell Neurosci 13:560. [DOI] [PMC free article] [PubMed] [Google Scholar]
- Tsai PI, Lin CH, Hsieh CH, Papakyrikos AM, Kim MJ, Napolioni V, Schoor C, Couthouis J, Wu RM, Wszolek ZK, Winter D, Greicius MD, Ross OA, Wang X (2018) PINK1 phosphorylates MIC60/mitofilin to control structural plasticity of mitochondrial crista junctions. Mol Cell 69:744–56.e6. 10.1016/j.molcel.2018.01.026 [DOI] [PubMed] [Google Scholar]
- van der Laan M, Horvath SE, Pfanner N (2016) Mitochondrial contact site and cristae organizing system. Curr Opin Cell Biol 41:33–42. 10.1016/j.ceb.2016.03.013 [DOI] [PubMed] [Google Scholar]
- Varghese M, Kimler VA, Ghazi FR, Rathore GK, Perkins GA, Ellisman MH, Granneman JG (2019) Adipocyte lipolysis affects Perilipin 5 and cristae organization at the cardiac lipid droplet-mitochondrial interface. Sci Rep 9:4734. 10.1038/s41598-019-41329-4 [DOI] [PMC free article] [PubMed] [Google Scholar]
- Weaver SP, Schweitzer L (1994) Development of gerbil outer hair cells after the onset of cochlear function: an ultrastructural study. Hear Res 72:44–52. 10.1016/0378-5955(94)90204-6 [DOI] [PubMed] [Google Scholar]
- Wolf DM, Segawa M, Kondadi AK, Anand R, Bailey ST, Reichert AS, van der Bliek AM, Shackelford DB, Liesa M, Shirihai OS (2019) Individual cristae within the same mitochondrion display different membrane potentials and are functionally independent. EMBO J 38:e101056. 10.15252/embj.2018101056 [DOI] [PMC free article] [PubMed] [Google Scholar]
- Wollweber F, von der Malsburg K, van der Laan M (2017) Mitochondrial contact site and cristae organizing system: a central player in membrane shaping and crosstalk. Biochim Biophys Acta Mol Cell Res 1864:1481–1489. 10.1016/j.bbamcr.2017.05.004 [DOI] [PubMed] [Google Scholar]
- Yamasoba T, Someya S, Yamada C, Weindruch R, Prolla TA, Tanokura M (2007) Role of mitochondrial dysfunction and mitochondrial DNA mutations in age-related hearing loss. Hear Res 226:185–193. 10.1016/j.heares.2006.06.004 [DOI] [PubMed] [Google Scholar]
- Yin F, Sancheti H, Patil I, Cadenas E (2016) Energy metabolism and inflammation in brain aging and Alzheimer’s disease. Free Radic Biol Med 100:108–122. 10.1016/j.freeradbiomed.2016.04.200 [DOI] [PMC free article] [PubMed] [Google Scholar]
- Yu YF, Wu WY, Xiao GS, Ling HY, Pan C (2016) Protection of the cochlear hair cells in adult C57BL/6J mice by T-type calcium channel blockers. Exp Ther Med 11:1039–1044. 10.3892/etm.2016.2970 [DOI] [PMC free article] [PubMed] [Google Scholar]
- Yuan T, Gao SS, Saggau P, Oghalai JS (2010) Calcium imaging of inner ear hair cells within the cochlear epithelium of mice using two-photon microscopy. J Biomed Opt 15:016002. 10.1117/1.3290799 [DOI] [PMC free article] [PubMed] [Google Scholar]
- Zerbes RM, van der Klei IJ, Veenhuis M, Pfanner N, van der Laan M, Bohnert M (2012) Mitofilin complexes: conserved organizers of mitochondrial membrane architecture. Biol Chem 393:1247–1261. 10.1515/hsz-2012-0239 [DOI] [PubMed] [Google Scholar]
- Zheng QY, Johnson KR, Erway LC (1999) Assessment of hearing in 80 inbred strains of mice by ABR threshold analyses. Hear Res 130:94–107. 10.1016/s0378-5955(99)00003-9 [DOI] [PMC free article] [PubMed] [Google Scholar]
- Zhou J, Chong SY, Lim A, Singh BK, Sinha RA, Salmon AB, Yen PM (2017) Changes in macroautophagy, chaperone-mediated autophagy, and mitochondrial metabolism in murine skeletal and cardiac muscle during aging. Aging (Albany NY) 9:583–599. 10.18632/aging.101181 [DOI] [PMC free article] [PubMed] [Google Scholar]
Associated Data
This section collects any data citations, data availability statements, or supplementary materials included in this article.
Supplementary Materials
Crista shape and size and crista junction structure influence the rate of ATP production. The modeling of Song et al. (2013) used spatial representations of cristae, inner boundary membrane, and crista junctions with dimensions and geometry derived from electron microscope tomography. Shown is a model of a crista junction and part of a crista. The crista junction has a diameter of 11 nm, the mean value from our measurements, consistent across ages. The “ATP stream” is represented by many copies of the surface representation of the atomic-resolution structure of ATP in different orientations with accurate scaling of ATP molecule size; the Stokes-Einstein diameter of an ATP molecule is 1.4 nm. The biophysical model estimates that the ATP stream going through each OHC crista junction is about 3 × 10⁴ ATP/s, giving the impression that a crista junction is like an ATP fire nozzle. Download Table 1-1, TIF file (1.2MB, tif)
Tomographic volume and surfaced-rendered volume after membrane segmentation of a mitochondrion and SSC in a 15 month OHC. First sequence, Moving quickly through the z slices of the tomographic volume. Second sequence, Rotations of the surface-renTY dered volume. Chocolate represents the SSC meshwork. Rosy brown represents the mitochondrial inner boundary membrane. Various shades of brown represent the cristae. Third sequence, Rotation of the SSC only. Fourth sequence, The cristae rotated with the mitochondrial inner boundary membrane made translucent to see the cristae better. Fifth sequence, Rotation with crista junctions added as a black with the same mean diameter as measured, ∼14 nm. Seven crista junctions face toward the SSC and four faces away, showing the polarization. Sixth sequence, Rotation with the mitochondrial inner boundary membrane made opaque to see the crista junction distribution better. Seventh sequence, All the segmentation.