Abstract
Background
The purpose of the current study was to investigate the predictive value of 18F‐fluorodeoxyglucose positron emission tomography/computed tomography (18F‐FDG PET/CT) for programmed death ligand 1 (PD‐L1) in non‐small cell lung cancer (NSCLC) patients through a systematic review and meta‐analysis.
Methods
The PubMed, Cochrane, and EMBASE database, from the earliest available date of indexing through 30 April 2020, were searched for studies evaluating the diagnostic performance of 18F‐FDG PET/CT for prediction of PD‐L1 expression in NSCLC patients.
Results
Across six studies (1739 patients), the pooled sensitivity for 18F‐FDG PET/CT was 0.72 (95% CI: 0.58–0.82) with heterogeneity (I2 = 90.9, P < 0.001) and a pooled specificity of 0.69 (95% CI: 0.64–0.74) with heterogeneity (I2 = 77.9, P < 0.001). Likelihood ratio (LR) syntheses gave an overall positive likelihood ratio (LR +) of 2.3 (95% CI: 1.8–2.9) and negative likelihood ratio (LR‐) of 0.41 (95% CI: 0.26–0.63). The pooled diagnostic odds ratio (DOR) was six (95% CI: 3–11). Hierarchical summary receiver operating characteristic (ROC) curve indicated that the area under the curve was 0.74 (95% CI: 0.70–0.78).
Conclusions
The current meta‐analysis showed a moderate sensitivity and specificity of 18F‐FDG PET/CT for the prediction of PD‐L1 expression in NSCLC patients. The DOR was low and the likelihood ratio scatter‐gram indicated that 18F‐FDG PET/CT might not be useful for the prediction of PD‐L1 expression in NSCLC patients and not for its exclusion.
Key points
Significant findings of the study
The current meta‐analysis showed a moderate sensitivity and specificity of 18F‐FDG PET/CT for the prediction of PD‐L1 expression in NSCLC patients. The DOR was low and the likelihood ratio scattergram indicated that 18F‐FDG PET/CT might not be useful for the prediction of PD‐L1 expression in NSCLC patients and not for its exclusion.
What this study adds
This study concluded that the role of 18F‐FDG PET/CT in predicting tumor expression of PD‐L1 should be further elucidated.
Keywords: 18F‐FDG, NSCLC, PD‐L1, PET/CT
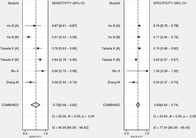
The current meta‐analysis showed a moderate sensitivity and specificity of 18F‐fluorodeoxyglucose positron emission tomography/computed tomography (18F‐FDG PET/CT) for the prediction of PD‐L1 expression in NSCLC patients. The DOR was low and the likelihood ratio scattergram indicated that 18F‐FDG PET/CT might not be useful for the prediction of PD‐L1 expression in NSCLC patients or its exclusion. This study supports that the role of 18F‐FDG PET/CT for predicting tumor expression of PD‐L1 should be further elucidated.
Introduction
Internationally, lung cancer is by far the leading cause of cancer‐related mortality among both men and women. 1 Based on cell origin, the majority of lung cancers (about 85%) are non‐small cell lung cancer (NSCLC). 2 Recently, molecular targeted therapies have dramatically improved the prognosis of selected advanced‐stage NSCLC patients with driver mutations (eg, epidermal growth factor receptor [EGFR]‐mutant, anaplastic lymphoma kinase [ALK]‐rearranged NSCLC). However, these therapies are ineffective in the majority of patients whose tumors lack genetic alterations. 3 Immune checkpoint inhibitors (ICIs), such as programmed cell death protein 1 (PD‐1) or programmed cell death ligand 1 (PD‐L1), have become one of the most promising approaches in the treatment for advanced NSCLC patients whose tumor does not contain a driver mutation. 4
Even though ICIs have dramatically changed the clinical outcomes of advanced NSCLC, 5 , 6 , 7 , 8 , 9 only a subset of patients with NSCLC respond to ICIs. Thus substantial efforts are ongoing to identify a biomarker of response to anti–PD‐1/PD‐L1 immunotherapy. Although as a predictive biomarker PD‐L1 expression in NSCLC has limitations, 10 PD‐L1 expression in NSCLC is the only FDA approved biomarker linked to specific PD‐1/PD‐L1 pathway blockade and expected to predict a response to anti‐PD‐1/PD‐L1 antibodies. 10 Immunohistochemistry (IHC) is a useful predictive biomarker to detect PD‐L1 expression, but obtaining adequate tumor tissue for PD‐L1 staining is not available in some patients. A functional noninvasive imaging modality based on glucose metabolism, 18F‐fluorodeoxyglucose positron emission tomography/computed tomography (18F‐FDG PET/CT) has become a standard modality for the diagnosis, staging, and evaluation of treatment response in NSCLC. 11 An association between glucose metabolism and EGFR mutation and ALK rearrangement in NSCLC have also been previously reported. 12 , 13 However, the relationship between glucose metabolism and PD‐L1 expression in NSCLC is not well known.
The purpose of our study was to perform a meta‐analysis of published data on the diagnostic performance of 18F‐FDG PET/CT for the prediction of PD‐L1 expression in NSCLC patients, in order to provide more evidence‐based data and to address further studies in the prediction of PD‐L1 expression in NSCLC patients.
Methods
Data sources and search strategy
A structured approach was followed to identify the patient population, interventions, comparators, outcomes, and study design (PICOS criteria). The search strategy included both subject headings (MeSH terms) and keywords for the target condition (non‐small cell lung cancer), the imaging techniques under investigation (18F‐FDG PET/CT), and the interventions (PD‐L1 expression). We conducted electronic English language literature searches of PubMed, Cochrane, and Embase database from the earliest available date of indexing through 30 April 2020. We also hand‐searched the reference lists of identified publications for additional studies. We used a search algorithm based on a combination of terms 1 : “PET” OR “positron emission tomography” OR “positron emission tomography/computed tomography” OR “positron emission tomography‐computed tomography” OR “PET‐CT” OR “FDG” OR “Fluorodeoxyglucose” and 2 “Lung neoplasms” OR “Lung cancer” OR “Non‐small cell lung cancer” OR “NSCLC” and 3 “PD‐L1”. For PubMed, the search strategy comprised both free text search and usage of Medical SubHeadings (MeSH). For Embase, free text search and the Emtree Thesaurus were used in the current study.
Study selection
The inclusion criteria for relevant studies were as follows: 18F‐FDG PET or PET/CT had been used to predict PD‐L1 expression in NSCLC patients; sufficient data to reassess sensitivity and specificity of 18F‐FDG PET or PET/CT for the prediction of PD‐L1 expression in NSCLC patients or absolute numbers of true positive (TP), true negative (TN), false positive (FP), and false negative (FN) data had been presented; and there was no data overlap. Duplicated publications were excluded, as were publications such as review articles, case reports, conference papers, and letters, which did not contain the original data. Two researchers independently reviewed titles and abstracts of the retrieved articles, applying the above‐mentioned selection criteria. Articles were rejected if clearly ineligible. The same researchers independently evaluated the full‐text of the included articles to determine their eligibility for inclusion of the current review.
Data extraction and quality assessment
Information about basic study (authors, year of publication, and country of origin), study design (prospective or retrospective), patients' characteristics and technical aspects were collected. Each study was analyzed to retrieve the number of TP, TN, FP, and FN findings of 18F‐FDG PET or PET/CT for the prediction of PD‐L1 expression in NSCLC patients, according to the reference standard. Only studies providing such complete information were finally included in the meta‐analysis. The overall quality of the included studies in this review was critically appraised by two authors independently, based on 15‐item modified Quality Assessment of Diagnostic Accuracy Studies (QUADAS2). 14 Discrepancies between the researchers were resolved by discussion.
Data synthesis and analysis
All data from each eligible study were extracted. The primary objective was to estimate the sensitivity and specificity, and the positive and negative likelihood ratios (LR + and LR–, respectively) with 95% confidence intervals (CIs), and diagnostic odds ratio (DOR) with 95% confidence interval (CI). A DOR can be calculated as the ratio of the odds of positivity in a disease state relative to the odds of positivity in the nondisease state, with higher values indicating better discriminatory test performance. 15 Between‐study statistical heterogeneity was assessed using I2 and the Cochrane Q test on the basis of the random effects analysis. 16 Publication bias was examined using the effective sample size funnel plot and associated regression test of asymmetry described by Deeks and colleagues. 17 We used the bivariate random‐effects model for analysis and pooling of the diagnostic performance measures across studies, as well as comparisons between different index tests. 18 , 19 The bivariate model estimates pairs of logit transformed sensitivity and specificity from studies, incorporating the correlation that might exist between sensitivity and specificity. Each data point of the summary receiver operator characteristic (SROC) graph comes from an individual study; then, the SROC curve is formed based on these points to form a smooth curve to reveal pooled accuracy. 20 When statistical heterogeneity was substantial, we performed meta‐regression to identify potential sources of bias. 21 Two‐sided P ≤ 0.05 was considered statistically significant. Statistical analyses were performed with commercial software programs (STATA, version 13.1; StataCorp LP, 4905 Lakeway Drive, College Station, TX, 77845, USA).
Results
Literature search and selection of studies
After a comprehensive computerized search was performed and reference lists were extensively cross‐checked, our research yielded 294 records, of which 27 records of duplicated abstracts were excluded after reviewing the title and abstract. Also, nonrelevant 135 studies, 92 conference abstracts, two notes, five letters, 14 case reports, and 12 review articles were excluded. The remaining seven full text articles were assessed for eligibility and one article was excluded due to insufficient data for the calculation of sensitivity and specificity of 18F‐FDG PET or PET/CT for the prediction of PD‐L1 expression in NSCLC patients. Finally, six studies were selected that were eligible for systematic review and meta‐analysis and no additional studies were found screening the references of these articles. 22 , 23 , 24 , 25 , 26 , 27 The characteristics of the included studies are presented in Table 1. The detailed procedure of study selection in the current meta‐analysis is shown in Fig 1.
Table 1.
Characteristics of the included studies
| Authors | Year | Country | Study design | AC, (%) | Patient number | M/F | Age (range) | PET parameter | Analysis of PET | PD‐L1 (+), % | Ever‐smoker (%) | Cutoff value |
|---|---|---|---|---|---|---|---|---|---|---|---|---|
| Hu et al.22 | 2020 | China | R | 100 | 450 | 203/247 | NR | SUVmax | QA | 9.6 | 74 | 5.5 |
| Hu et al.23 | 2020 | China | R | 82 | 362 | 197/165 | 62.6 (30–87) | SUVmax | QA | 50.8 | 31 | 8.5 |
| Takada et al.24 | 2017 | Japan | R | 83.7 | 256 | NA | 68 (36–89) | SUVmax | QA | 19.4 | 58.9 | 3.2 |
| Takada et al.25 | 2017 | Japan | R | 76.2 | 563 | NA | 69 (36–89) | SUVmax | QA | 23.5 | 61.1 | 4.2 |
| Wu et al.26 | 2019 | China | R | 0 | 24 | 20/4 | 62 (42–79) | SUVmax | QA | 70.8 | 79.2 | 12.4 |
| Zhang et al.27 | 2017 | China | R | 84.9 | 84 | 65/19 | 63 (34–85) | SUVmax | QA | 58.3 | 72.5 | 11.2 |
AC, adenocarcinoma; NA, not available; NR, not reported; QA, quantitative analysis; R, retrospective; SUVmax, maximum standardized uptake value.
Figure 1.
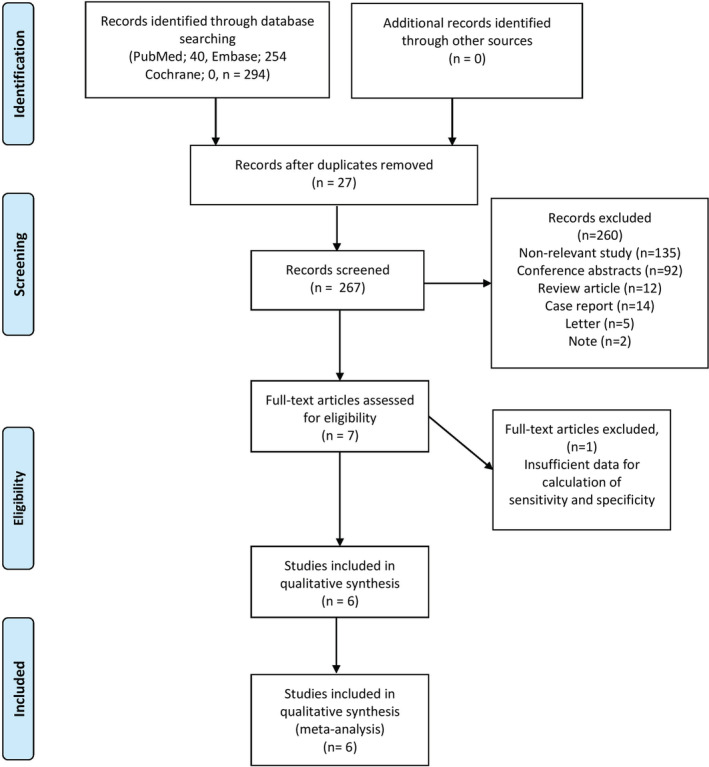
Flow chart of the search for eligible studies on the diagnostic performance of 18F‐FDG PET/CT for prediction of PD‐L1 expression in NSCLC patients.
Study description, quality, and publication bias
We conducted all analyses based on per‐patient data. After excluding 23 patients with small cell lung cancer from two studies, 24 , 25 there was a total of 1739 patients in the included studies, with ages ranging from 30 to 89 years. A total of 485 patients were male, and 435 patients were female. Gender information were unavailable from two studies. 24 , 25 All studies enrolled patients retrospectively. Four studies were from China. 22 , 23 , 26 , 27 A further two studies were performed by Non‐China investigators. 24 , 25 The median prevalence of PD‐L1 (+) of the six studies included was 37.15% with a range of 9.6% to 70.8%. The median prevalence of adenocarcinoma of the six studies selected was 82.85% with a range of 0% to 100%. The median prevalence of smoking history of the included studies was 66.8% with a range of 31% to 79.2%. All studies performed quantitative analysis of 18F‐FDG PET/CT for prediction of PD‐L1 expression in NSCLC patients. The principal characteristics of the six studies included in the meta‐analysis are included in Table 1. To assess a possible publication bias, Deeks' funnel plot asymmetry tests were designed. The nonsignificant slope indicates that no significant bias was found. The P‐value was 0.74 (Fig 2).
Figure 2.
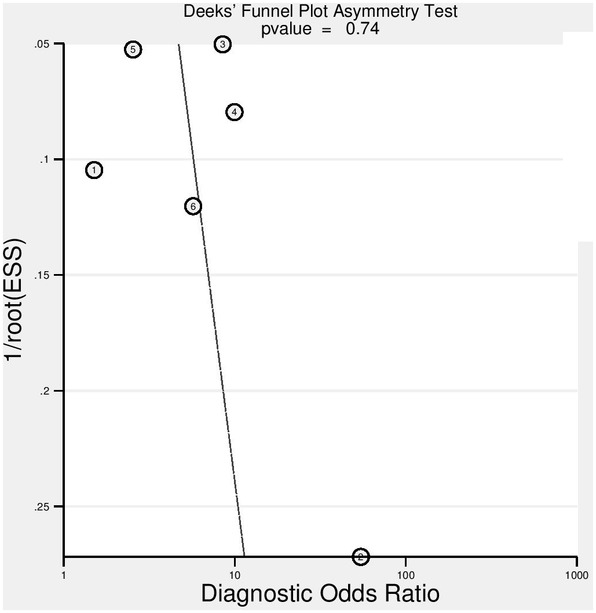
Results of Deeks's funnel plot of asymmetry test for publication bias. The nonsignificant slope indicates that no significant bias was found. ESS; effective sample size ( ) Study and (
 ) Regression Line.
Methodological quality assessment
Figure 3 shows the risk of bias and applicability concerns summary of the included studies and overall, the quality of the included studies was deemed satisfactory.
Figure 3.
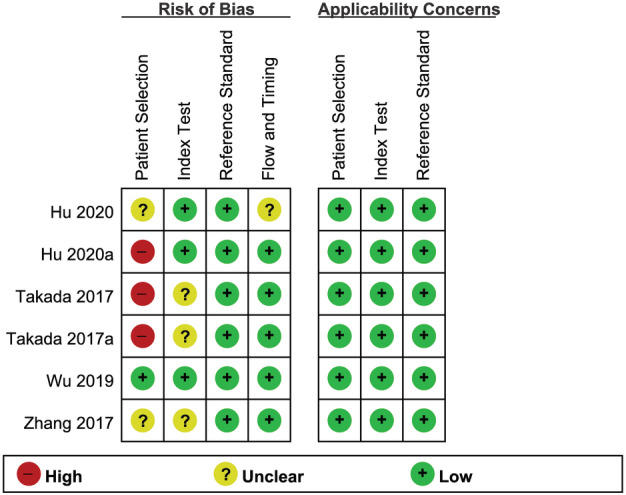
Risk of bias and applicability concerns summary ( ) High, (
 ) Unclear, and (
 ) Low.
Diagnostic performance of 18F‐FDG PET/CT for prediction of PD‐L1 expression
The diagnostic performance results of 18F‐FDG PET/CT for the prediction of PD‐L1 expression in NSCLC patients are presented in Fig 4. The pooled sensitivity for 18F‐FDG PET/CT was 0.72 (95% CI: 0.58–0.82) with heterogeneity (I2 = 90.9, 95% CI: 85.2–96.6, P < 0.001) and a pooled specificity of 0.69 (95% CI: 0.64–0.74) with heterogeneity (I2 = 77.9, 95% CI: 60.3–95.4, P < 0.001). Likelihood ratio (LR) syntheses gave an overall positive likelihood ratio (LR +) of 2.3 (95% CI: 1.8–2.9) and negative likelihood ratio (LR‐) of 0.41 (95% CI: 0.26–0.63). The pooled diagnostic odds ratio (DOR) was six (95% CI: 3–11). Forest plots of the sensitivity and specificity 18F‐FDG PET/CT for the prediction of PD‐L1 expression in NSCLC patients are shown in Fig 4. Fig 5 shows hierarchical summary receiver operating characteristic (ROC) curve and indicates that the areas under the curve was 0.74 (95% CI: 0.70–0.78).
Figure 4.
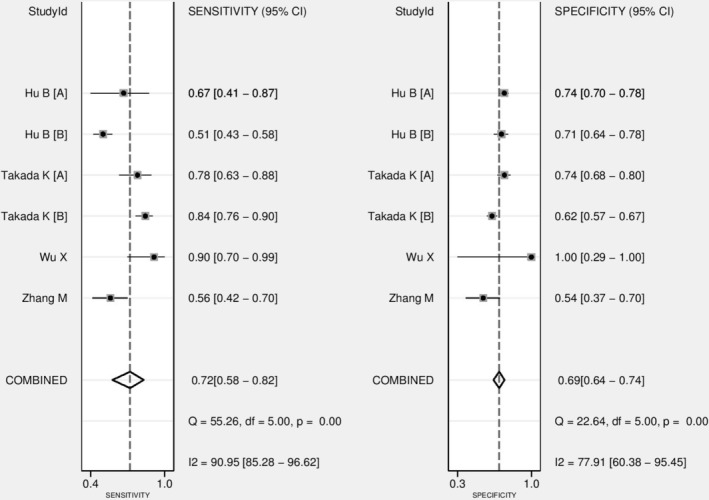
Forest plot of pooled sensitivity and specificity of 18F‐FDG PET/CT for prediction of PD‐L1 expression in NSCLC patients.
Figure 5.
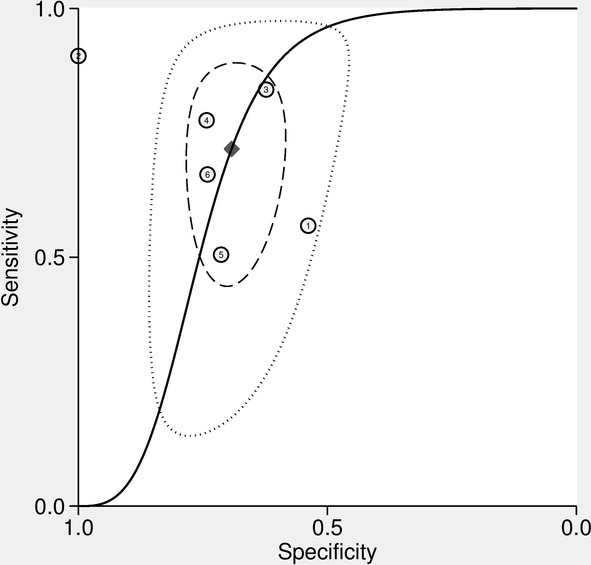
Hierarchical summary receiver operating characteristic (HSROC) curves of 18F‐FDG PET/CT for prediction of PD‐L1 expression in NSCLC patients ( ) Observed data, (
 ) Summary Operating point SENS = 0.72 (0.58–0.82) SPEC = 0.69 (0.64–0.74), (
 ) SROC Curve AUC = 0.74 (0.70–0.78), (
 ) 95% Confidence Contour, and (
 ) 95% Prediction Contour.
Heterogeneity evaluation and meta‐regression analysis
Between‐study heterogeneity was present for sensitivity and specificity among studies of 18F‐FDG PET/CT for prediction of PD‐L1 expression in NSCLC patients. A meta‐regression analysis was performed to explore other sources of heterogeneity in the studies of 18F‐FDG PET/CT. Meta‐regression showed that no definite variable was the source of heterogeneity in the current meta‐analysis (Table 2).
Table 2.
Effects of moderators
| Variables | Coefficient* | SE | DOR | 95% CI of DOR | P ** | |
|---|---|---|---|---|---|---|
| Smoker proportion,% (>66.8 vs. ≤66.8) | −0.244 | 0.5283 | 0.78 | 0.00 | 644.74 | 0.7245 |
| Adenocarcinoma proportion, % (>82.85 vs. ≤82.85) | −0.093 | 0.4641 | 0.91 | 0.00 | 331.55 | 0.8739 |
| PD‐L1 (+), % (>37.15 vs. ≤37.15) | −1.270 | 0.5492 | 0.28 | 0.00 | 301.36 | 0.2599 |
Regression coefficient.
P‐value of random effect meta‐regression using maximum likelihood estimation (ML) between study variances and the weighted least squares of study size for regression model estimation.
Smoker proportion, % (1, >66.8 vs. 0, ≤66.8); Adenocarcinoma proportion, % (1, >82.85 vs. 0, ≤82.85); PD‐L1 (+), % (1, >37.15 vs. 0, ≤37.15).
CI, confidence interval; DOR, diagnostic odds ratio; SE, standard error.
Likelihood ratio scatter‐gram
Figure 6 shows the likelihood ratio scatter‐gram which displays the summary point of likelihood ratios obtained as functions of mean sensitivity and specificity in the right lower quadrant suggesting that 18F‐FDG PET/CT might not be useful for prediction of PD‐L1 expression in NSCLC patients (when positive) and not for its exclusion (when negative).
Figure 6.
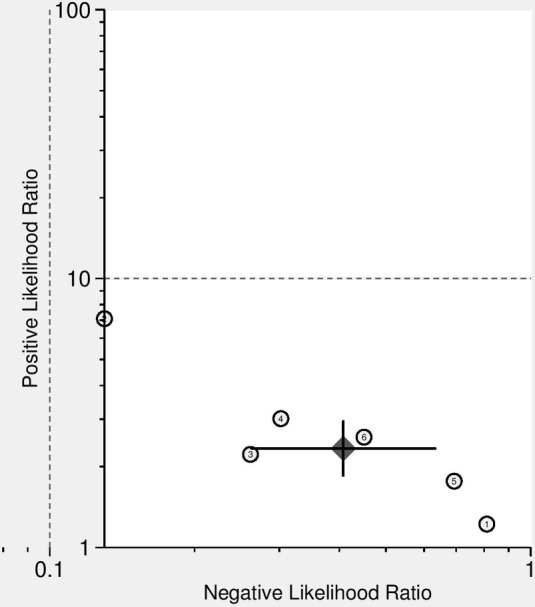
Likelihood ratio scatter‐gram of 18F‐FDG PET/CT for prediction of PD‐L1 expression in NSCLC patients. LUQ: Exclusion & Confirmation, LRP > 10, LRN < 0.1, RUQ: Confirmation Only, LRP > 10, LRN > 0.1; LLQ: Exclusion Only, LRP < 10, LRN < 0.1, RLQ: No Exclusion or Confirmation, LRP < 10, LRN > 0.1; ( ) Summary LRP & LRN for Index Test With 95% Confidence ntervals.
Discussion
Despite limitations, so far, PD‐L1 expression by IHC is the most common clinically detected biomarker for predicting patient response to anti‐PD‐1/PD‐L1 antibody. 28 The current meta‐analysis showed moderate diagnostic performance of 18F‐FDG PET/CT for the prediction of PD‐L1 expression in NSCLC patients.
The present systematic review and meta‐analysis included six studies, comprising a total of 1739 patients with NSCLC who all had undergone preoperative 18F‐FDG PET/CT followed by surgical resection. All included studies retrospectively analyzed the diagnostic performance of 18F‐FDG PET/CT for the prediction of PD‐L1 expression in NSCLC patients. Overall, methodological quality of included studies was satisfactory. Meta‐analytically, 18F‐FDG PET/CT for the prediction of PD‐L1 expression in NSCLC patients showed that sensitivity, specificity, positive likelihood ratio, negative likelihood ratio, and DOR of 18F‐FDG PET/CT were 0.72 (95% CI: 0.58–0.82), 0.69 (95% CI: 0.64–0.74), 2.3 (95% CI: 1.8–2.9), 0.41 (95% CI: 0.26–0.63), and six (95% CI: 3–11), respectively. In addition, the area under the ROC curve was 0.74, suggesting moderate performance.
Previous studies have reported that mammalian target of rapamycin (mTOR) complex 1 activity affects the value of FDG uptake in lung cancer, 29 and the activation of protein kinase B (AKT) ‐mTOR pathway increases the expression of PD‐L1 in lung cancer. 30 These findings suggest that a correlation between high FDG uptake and PD‐L1 expression may share the activation of the AKT–mTOR pathway. Further study regarding the mechanism of association between FDG uptake and PD‐L1 expression in NSCLC is needed.
The current meta‐analysis showed a considerable heterogeneity of sensitivity and specificity between studies. The included studies were statistically heterogeneous in their estimates of sensitivity and specificity. This heterogeneity is likely to arise through diversity in methodological aspects between different studies and the basic differences among the patients in the included studies may have contributed to the observed heterogeneity of the results too. Also, a major limitation was the considerable heterogeneity of cutoff values of SUVmax of 18F‐FDG PET/CT for the definition of a positive PET scan in included studies. Also, studies included in this meta‐analysis used different definition for positivity of PD‐L1 protein expression. Four studies used the cutoff value of 5% for defining PD‐L1 positivity 23 , 24 , 25 , 27 and another two studies used 1% for positivity. 22 , 26 Immunohistochemical analysis were performed using different methods to determine PD‐L1 expression. Different PD‐L1 monoclonal antibodies from different vendors (clone SP 142, dilution 1:100; Spring Bioscience, Ventana, Arizona, USA), 24 , 25 (clone SP 142, dilution 1:300; OriGene Technologies, Maryland, USA), 21 (clone 28‐8, Abcam, Cambridge, UK), 27 and (clone 28‐8, pharmDx, California, USA) 23 were used in the studies. One study did not clarify the antibody used for immunohistochemical analysis. 26 Another concern is interobserver variability for assessing PD‐L1 expression. Seven pathologists independently evaluated the PD‐L1 expression from 55 resected lung cancer tissue with five PD‐L1 assays (28‐8 from two different vendors, 22C3, SP142, and SP263) to investigate interrater variation. 31 In this study, using ≥1% stained tumor cells as cutoff for a positive test, up to 20% of the cases were differently classified as positive or negative by any pathologist. When this challenge is overcome by longer assay experience and cutoff optimization, more evident data can be obtained. To minimize bias in the selection of studies and in the data extraction, reviewers who were blinded to the journal, author, institution, and date of publication independently selected articles based on the inclusion criteria, and scores were assigned to study design characteristics and examination results by using a standardized form that was based on the QUADAS2 tool. Also, publication bias is a major concern in all meta‐analyses as studies reporting significant findings are more likely to be published than those reporting nonsignificant results. We assessed the publication bias in our analysis by using funnel plots which showed no definite asymmetry.
In the absence of oncogene addiction (eg, EGFR mutation, ALK or ROS1 translocation), ICI monotherapy or combination with cytotoxic chemotherapy has moved from the second‐line to the first‐line setting in patients with advanced NSCLC with all levels of PD‐L1 expression. 4 For patients with unresectable stage III NSCLC, concurrent chemoradiotherapy followed by durvalumab, anti‐PD‐L1 monoclonal antibody has shown a significant improvement in three‐year OS rates, demonstrating the long‐term clinical benefit. 32 However, at the present time, we do not know whether adjuvant or neoadjuvant ICIs will benefit patients with localized resectable NSCLC in terms of disease‐free and, ultimately, overall survival. 33 Several phase 3 studies of adjuvant and neoadjuvant immunotherapy are still underway. Since IHC for PD‐L1 expression was performed with surgically resected lung cancer from solely stage I to III in all studies included in this meta‐analysis, our analysis does not have any stage IV NSCLC which currently benefit from treatment with ICIs. Another issue for anti‐PD‐L1 therapeutic strategies is discordances of PD‐L1 expression between surgically resected specimens and small biopsies of NSCLC patients. 34 Only half of the small biopsy specimens showed a correlation of PD‐L1 expression between lung biopsies and corresponding resected tumors.
The current meta‐analysis showed moderate sensitivity and specificity of 18F‐FDG PET/CT for the prediction of PD‐L1 expression in NSCLC patients. Furthermore, the DOR was low and the likelihood ratio scatter‐gram indicated that 18F‐FDG PET/CT might not be useful for the prediction of PD‐L1 expression in NSCLC patients and not for its exclusion. Therefore, the role of 18F‐FDG PET/CT for predicting tumor expression of PD‐L1 should be further elucidated, and well designed clinical studies should also address these associations.
In conclusion, the predictive value of 18F‐FDG PET/CT for PD‐L1 expression in NSCLC patients were not satisfactory. 18F‐FDG PET/CT might not be useful for the prediction of PD‐L1 expression in NSCLC patients and not for its exclusion. Therefore, cautious application and interpretation should be paid to the 18F‐FDG PET/CT for the prediction of PD‐L1 expression in NSCLC patients.
Disclosure
The authors declare that there is no conflict of interest that could be perceived as prejudicing the impartiality of this study.
References
- 1. Barta JA, Powell CA, Wisnivesky JP. Global epidemiology of lung cancer. Ann Glob Health 2019; 85 (1): 1–16. [DOI] [PMC free article] [PubMed] [Google Scholar]
- 2. Ferlay J, Soerjomataram I, Dikshit R et al Cancer incidence and mortality worldwide: Sources, methods and major patterns in GLOBOCAN 2012. Int J Cancer 2015; 136 (5): E359–86. [DOI] [PubMed] [Google Scholar]
- 3. Hirsch FR, Scagliotti GV, Mulshine JL et al Lung cancer: Current therapies and new targeted treatments. Lancet 2017; 389 (10066): 299–311. [DOI] [PubMed] [Google Scholar]
- 4. NCCN Clinical practice guidelines in oncology (NCCN guidelines) non‐small cell lung cancer version 3.2020. National Comprehensive Cancer Network. [Cited 16 Sept 2020.] Available from URL: http://www.nccn.org/professionals/physician_gls/pdf/nscl.pdf.
- 5. Garon EB, Rizvi NA, Hui R e a. Pembrolizumab for the treatment of non‐small‐cell lung cancer. N Engl J Med 2015; 372 (21): 2018–28. [DOI] [PubMed] [Google Scholar]
- 6. Borghaei H, Paz‐Ares L, Horn L et al Nivolumab versus Docetaxel in advanced nonsquamous non‐small‐cell lung cancer. N Engl J Med 2015; 373 (17): 1627–39. [DOI] [PMC free article] [PubMed] [Google Scholar]
- 7. Fehrenbacher L, Spira A, Ballinger M et al Atezolizumab versus docetaxel for patients with previously treated non‐small‐cell lung cancer (POPLAR): A multicentre, open‐label, phase 2 randomised controlled trial. Lancet 2016; 387 (10030): 1837–46. [DOI] [PubMed] [Google Scholar]
- 8. Herbst RS, Baas P, Kim DW et al Pembrolizumab versus docetaxel for previously treated, PD‐L1‐positive, advanced non‐small‐cell lung cancer (KEYNOTE‐010): A randomised controlled trial. Lancet 2016; 387 (10027): 1540–50. [DOI] [PubMed] [Google Scholar]
- 9. Reck M, Rodriguez‐Abreu D, Robinson AG et al Pembrolizumab versus chemotherapy for PD‐L1‐positive non‐small‐cell lung cancer. N Engl J Med 2016; 375 (19): 1823–33. [DOI] [PubMed] [Google Scholar]
- 10. Davis AA, Patel VG. The role of PD‐L1 expression as a predictive biomarker: An analysis of all US Food and Drug Administration (FDA) approvals of immune checkpoint inhibitors. J Immunother Cancer 2019; 7 (1): 278. [DOI] [PMC free article] [PubMed] [Google Scholar]
- 11. Stroobants S, Verschakelen J, Vansteenkiste J. Value of FDG‐PET in the management of non‐small cell lung cancer. Eur J Radiol 2003; 45 (1): 49–59. [DOI] [PubMed] [Google Scholar]
- 12. Choi H, Paeng JC, Kim D‐W et al Metabolic and metastatic characteristics of ALK‐rearranged lung adenocarcinoma on FDG PET/CT. Lung Cancer 2013; 79 (3): 242–7. [DOI] [PubMed] [Google Scholar]
- 13. Yip SS, Kim J, Coroller TP et al Associations between somatic mutations and metabolic imaging phenotypes in non–small cell lung cancer. J Nucl Med 2017; 58 (4): 569–76. [DOI] [PMC free article] [PubMed] [Google Scholar]
- 14. Whiting PF, Rutjes AW, Westwood ME et al QUADAS‐2: A revised tool for the quality assessment of diagnostic accuracy studies. Ann Intern Med 2011; 155 (8): 529–36. [DOI] [PubMed] [Google Scholar]
- 15. Glas AS, Lijmer JG, Prins MH, Bonsel GJ, Bossuyt PM. The diagnostic odds ratio: A single indicator of test performance. J Clin Epidemiol 2003; 56 (11): 1129–35. [DOI] [PubMed] [Google Scholar]
- 16. Thompson SG. Why sources of heterogeneity in meta‐analysis should be investigated. BMJ 1994; 309 (6965): 1351–5. [DOI] [PMC free article] [PubMed] [Google Scholar]
- 17. Deeks JJ, Macaskill P, Irwig L. The performance of tests of publication bias and other sample size effects in systematic reviews of diagnostic test accuracy was assessed. J Clin Epidemiol 2005; 58 (9): 882–93. [DOI] [PubMed] [Google Scholar]
- 18. Hamza TH, van Houwelingen HC, Stijnen T. The binomial distribution of meta‐analysis was preferred to model within‐study variability. J Clin Epidemiol 2008; 61 (1): 41–51. [DOI] [PubMed] [Google Scholar]
- 19. Reitsma JB, Glas AS, Rutjes AW, Scholten RJ, Bossuyt PM, Zwinderman AH. Bivariate analysis of sensitivity and specificity produces informative summary measures in diagnostic reviews. J Clin Epidemiol 2005; 58 (10): 982–90. [DOI] [PubMed] [Google Scholar]
- 20. Rutter CM, Gatsonis CA. A hierarchical regression approach to meta‐analysis of diagnostic test accuracy evaluations. Stat Med 2001; 20 (19): 2865–84. [DOI] [PubMed] [Google Scholar]
- 21. Lijmer JG, Mol BW, Heisterkamp S et al Empirical evidence of design‐related bias in studies of diagnostic tests. JAMA 1999; 282 (11): 1061–6. [DOI] [PubMed] [Google Scholar]
- 22. Hu B, Xiao J, Xiu Y, Fu Z, Shi H, Cheng D. Correlation of PD‐L1 expression on tumor cell and tumor infiltrating immune cell with 18F‐fluorodeoxyglucose uptake on PET/computed tomography in surgically resected pulmonary adenocarcinoma. Nucl Med Commun 2020; 41 (3): 252–9. [DOI] [PubMed] [Google Scholar]
- 23. Hu B, Chen W, Zhang Y, Shi H, Cheng D, Xiu Y. (18)F‐FDG maximum standard uptake value predicts PD‐L1 expression on tumor cells or tumor‐infiltrating immune cells in non‐small cell lung cancer. Ann Nucl Med 2020; 34 (5): 322–8. [DOI] [PubMed] [Google Scholar]
- 24. Takada K, Toyokawa G, Tagawa T et al Association between PD‐L1 expression and metabolic activity on (18)F‐FDG PET/CT in patients with small‐sized lung cancer. Anticancer Res 2017; 37 (12): 7073–82. [DOI] [PubMed] [Google Scholar]
- 25. Takada K, Toyokawa G, Okamoto T et al Metabolic characteristics of programmed cell death‐ligand 1‐expressing lung cancer on (18) F‐fluorodeoxyglucose positron emission tomography/computed tomography. Cancer Med 2017; 6 (11): 2552–61. [DOI] [PMC free article] [PubMed] [Google Scholar]
- 26. Wu X, Huang Y, Li Y, Wang Q, Wang H, Jiang L. (18)F‐FDG PET/CT imaging in pulmonary sarcomatoid carcinoma and correlation with clinical and genetic findings. Ann Nucl Med 2019; 33 (9): 647–56. [DOI] [PubMed] [Google Scholar]
- 27. Zhang M, Wang D, Sun Q et al Prognostic significance of PD‐L1 expression and (18)F‐FDG PET/CT in surgical pulmonary squamous cell carcinoma. Oncotarget 2017; 8 (31): 51630–40. [DOI] [PMC free article] [PubMed] [Google Scholar]
- 28. Patel SP, Kurzrock R. PD‐L1 expression as a predictive biomarker in cancer immunotherapy. Mol Cancer Ther 2015; 14 (4): 847–56. [DOI] [PubMed] [Google Scholar]
- 29. Kaira K, Serizawa M, Koh Y et al Biological significance of 18F‐FDG uptake on PET in patients with non‐small‐cell lung cancer. Lung Cancer 2014; 83 (2): 197–204. [DOI] [PubMed] [Google Scholar]
- 30. Lastwika KJ, Wilson W 3rd, Li QK et al Control of PD‐L1 expression by oncogenic activation of the AKT‐mTOR pathway in non‐small cell lung cancer. Cancer Res 2016; 76 (2): 227–38. [DOI] [PubMed] [Google Scholar]
- 31. Brunnstrom H, Johansson A, Westbom‐Fremer S et al PD‐L1 immunohistochemistry in clinical diagnostics of lung cancer: Inter‐pathologist variability is higher than assay variability. Mod Pathol 2017; 30 (10): 1411–21. [DOI] [PubMed] [Google Scholar]
- 32. Gray JE, Villegas A, Daniel D et al Three‐year overall survival with Durvalumab after Chemoradiotherapy in stage III NSCLC‐update from PACIFIC. J Thorac Oncol 2020; 15 (2): 288–93. [DOI] [PMC free article] [PubMed] [Google Scholar]
- 33. Vansteenkiste J, Wauters E, Reymen B, Ackermann CJ, Peters S, De Ruysscher D. Current status of immune checkpoint inhibition in early‐stage NSCLC. Ann Oncol 2019; 30 (8): 1244–53. [DOI] [PubMed] [Google Scholar]
- 34. Ilie M, Long‐Mira E, Bence C et al Comparative study of the PD‐L1 status between surgically resected specimens and matched biopsies of NSCLC patients reveal major discordances: A potential issue for anti‐PD‐L1 therapeutic strategies. Ann Oncol 2016; 27 (1): 147–53. [DOI] [PubMed] [Google Scholar]


