

Abstract
Background
Spread through air spaces (STAS) has recently been demonstrated to exhibit a negative impact on lung adenocarcinoma prognosis. However, most of these studies investigated STAS in nonmucinous adenocarcinoma. Here, we investigated the incidence of STAS in invasive mucinous adenocarcinoma (IMA) of the lung and evaluated whether tumor STAS was a risk factor of disease recurrence in IMA. We also examined clinicoradiologic factors in patients with IMA harboring STAS.
Methods
We reviewed pathologic specimens and imaging characteristics of primary tumors from 132 consecutive patients who underwent surgical resection for IMA to evaluate STAS. Patients with and without STAS were compared with respect to clinical characteristics as well as computed tomography (CT) imaging using logistic regression. The relationships between all variables including STAS and survival were analyzed.
Results
Among a total of 132 patients, full pathologic specimens were available for 119 patients, and STAS was observed in 86 (72.3%). IMA patients with STAS were significantly associated with older age, presence of lobulated and spiculated margins on CT scan (P = 0.009, P = 0.006, and P = 0.027). In multivariate analysis for overall survival (OS), STAS was a borderline independent poor prognostic predictor (P = 0.028). Older age, history of smoking, higher T stage, presence of lymph node metastasis, and consolidative morphologic type remained independent predictors for OS.
Conclusions
STAS was associated with reduced OS and was a borderline independent poor prognostic factor in IMA. IMA with STAS was associated with older age and presence of lobulated and spiculated margins on CT scan.
Key points
Significant findings of the study
Compared with other subtypes, IMA shows a higher incidence of STAS, which is an independent poor prognostic predictor even in IMA. Lobulated and spiculated margins on CT are associated with STAS.
What this study adds
Considering that STAS can carry the potential for aerogenous metastasis, predicting STAS using preoperative surrogate CT imaging is desirable to avoid limited resection.
Keywords: CT, lung adenocarcinoma, mucinous, prognosis, spread through air spaces
Mucinous lung adenocarcinoma shows an incidence of STAS of 72%. STAS is an independent poor prognostic predictor even in mucinous adenocarcinoma. STAS is associated with older age, and lobulated and spiculated margins on CT.
Introduction
Tumor invasion is one of the important factors determining outcome in malignant tumors. With regard to lung adenocarcinoma (ADC), the pathological criteria for tumor invasion are defined as follows: (i) histological subtypes other than a lepidic pattern; (ii) tumor cells infiltrating myofibroblastic stroma; or (iii) tumor cells invading lymphatics, blood vessels, or pleura. 1 , 2 In addition to these criteria, spread through air spaces (STAS) has recently been recognized as a pattern of invasion in lung cancer. 3 , 4 , 5 STAS is defined as micropapillary clusters, solid nests, or single cells spreading within air spaces beyond the edge of the main tumor. 3 Two large cohort studies reported that patients with STAS showed poorer prognosis than patients without STAS, particularly in patients with nonmucinous ADCs, in which STAS was more frequently identified in cases of tumors with a micropapillary, solid pattern. 3 , 4 In addition, recent reports showed that STAS was also a significant poor prognostic factor in patients with lung squamous cell carcinoma, lung pleomorphic carcinoma, and metastasis from colorectal cancer. 6 , 7 , 8
Invasive mucinous ADC (IMA) is a variant of invasive ADC of the lung that accounts for approximately 5%–10% of lung ADCs. 1 , 9 IMA is composed of tall columnar cells with basal nuclei and abundant cytoplasmic mucin. 10 In terms of prognosis, survival data for patients with IMA are limited due to its low incidence, and the results from the small number of published studies are conflicting. In some studies, IMA tended to show a more aggressive clinical course compared with nonmucinous ADC. 5 , 11 , 12 In contrast, other studies demonstrated no significant difference in recurrence‐free survival between patients with IMA and nonmucinous adenocarcinoma. 13 Furthermore, little data is available regarding the relationship between STAS and IMA. In our study, a large number of patients (132) were enrolled to evaluate prognostic factors including STAS. Given that mucinous tumor cells might spread into the airspace more easily in the background of abundant alveolar mucin such as pseudomyxoma peritonei or mucinous colorectal ADC spreading to the peritoneal surface, 14 we hypothesized that STAS might be more common in IMA than nonmucinous ADC, and that the presence of STAS would be related to poorer prognosis in IMA.
Therefore, the purpose of this study was two‐fold: (i) To review the clinicopathologic and radiologic features of IMA patients with pathologically confirmed STAS; and (ii) to compare the prognoses of patients with STAS and those without STAS in a large cohort.
Methods
This retrospective study was approved by our institutional review board (approval 2015–03‐089), and informed consent was waived.
Patient population
All patients who had undergone curative surgery for lung IMA through the surgical database of the Department of Thoracic Surgery within a tertiary referral cancer center of our institution were included in the study. Between February 1998 and November 2012, 138 patients were identified (Fig 1). Six patients were excluded because the computed tomography (CT) imaging results were of insufficient quality for accurate review. A total of 132 patients with completely resected solitary IMAs were included in this study. After excluding 13 patients with insufficient pathology for entire tumor review, clinicopathologic and radiologic features regarding STAS were assessed. In the prognostic evaluation of IMA patients, 10 patients were excluded for the following reasons: (i) Synchronous or metachronous lung cancer (n = 7); and (ii) concomitant presence of malignancy other than lung cancer (n = 3).
Figure 1.
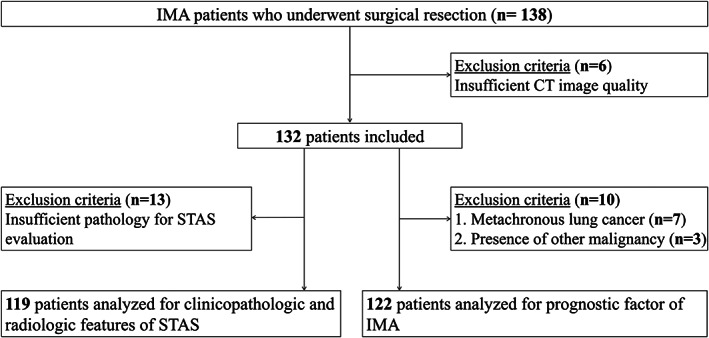
Flow diagram of the study cohort (n = 132).
We examined age, sex, smoking history, type of operation and neoadjuvant or adjuvant therapy as clinical factors. Lobectomy was accomplished via (traditional) open thoracotomy or minimally invasive video‐assisted thoracoscopic surgical (VATS) approaches. All mediastinal tissue containing the lymph nodes was dissected and removed systematically within anatomical landmarks following ESTS guidelines in patients who underwent lobectomy. 15 In our study, limited resection was performed by wedge resection. The decision for wedge resection was based on the following criteria: (i) 18–75 year old patients medically fit for lobectomy rather than alternative treatment such as radiation (predicted postoperative FEV1 > 40% and predicted postoperative DLco >40% or VO2max >15 mL/kg minute); (ii) ECOG 0–1; (iii) solitary pure ground‐glass opacity (GGO) with a maximum nodule diameter of 3 cm or less or solitary subsolid nodule with a maximum diameter of 2 cm or less, but consolidation/tumor ratio less than 0.25; (iv) peripheral location (outer third of lung field); and (v) cT1a‐bN0M0. The tumor was grasped and staplers were used to perform a wedge resection with an adequate safety margin, at least 2 cm of normal lung tissue beyond the tumor. From N1 nodes, only level 10 was sampled by clearing the tissue off the pulmonary vessels. A systematic mediastinal nodal sampling was routinely performed in all cases of wedge resection. For right‐sided tumors, levels 4, 7, and 9 were sampled, and for left‐sided tumors, levels 5, 6, 7, and 9 were sampled. If resection was incomplete or the tumor was found to be greater than T1 or NO by immediate pathologic analysis, the protocol specified that the surgeon complete the lobectomy. In terms of pathologic presentation, surgical margin distance of tumor, T classification, lymph node (LN) metastasis, pathologic stage, and histologic differentiation of tumor were evaluated. The TNM classification of the American Joint Committee on Cancer Staging Manual (seventh edition) was used for pathological staging. 16
For prognostic analysis, recurrence was confirmed with a combination of clinical, radiologic, pathologic, and surgical findings. The postoperative recurrence pattern was divided into two patterns: locoregional and distant recurrence. Locoregional recurrence was defined as evidence of a tumor at the surgical margin of the original tumor in the same lobe or a second ipsilateral lobe, in an ipsilateral hilar LN, or ipsilateral mediastinal LN. Distant recurrence was defined as evidence of a tumor in the contralateral lung, contralateral mediastinal LN, ipsilateral supraclavicular LN, or outside the hemithorax.
Radiologic analysis
Two board‐certified thoracic radiologists independently reviewed preoperative enhanced CT images. Discrepancies after the first independent review were resolved through a second review, and a decision was reached by consensus of the two readers. CT scans with intravenous contrast enhancement were considered of diagnostic quality if they were acquired or reconstructed to 2.5 mm thickness or less without artifacts. 17 CT factors recorded from the CT scans were morphology (nodular vs. consolidation), solidity (solid vs. part solid), margin characteristics including lobulated and spiculated margins, and well defined heterogeneous GGO (Figs S1A). When analyzing the marginal characteristics, 100% of the margins were fully evaluated, and the presence of lobulation or spiculation was defined based on the margin of 50% or more. Well defined or nonspiculated were classified as when the margins were neither lobulated nor spiculated (Figs S1b). We also recorded the internal characteristics of the CT angiogram and air bronchogram signs.
Histopathologic analysis
An experienced lung pathologist reviewed all slides using the Aperio Slide Scanning System (ScanScope T3; Aperio Technologies Inc., Vista, CA, USA), producing high resolution digital images (0.25 lm/pixel at 40). STAS was defined as detachment of small solid cell nests (at least five tumor cells) within airspace in the lung parenchyma beyond the edge of the main tumor. In addition, presence of combined pneumonia presenting as alveolar lumen filled with neutrophils was evaluated (Fig S2). 18
Statistical analysis
Statistical analyses were performed using R project (R version 3.5.1, Vienna, Austria). Data were expressed as the mean ± SD or frequency (percentage). Pearson's Chi‐square test or Fisher's exact test were used for comparison between absence of STAS and presence of STAS with respect to clinical characteristics as well as CT imaging in IMAs. Multivariate logistic regression was used to explore the clinicoradiologic features that facilitate the detection of STAS in IMA; receiver operating characteristic (ROC) curve analysis was performed to evaluate the predictive performance. We performed five‐fold cross‐validation tests to assess the performance of our prediction model.
Disease specific survival (DSS) was defined as the interval between the date of surgical resection and detection of recurrence. Overall survival (OS) was defined as the interval between the date of surgical resection and that of death, or the last follow‐up visit. Cox proportional hazards regression models were used to assess the prognostic value of each factor in IMA patients on univariate analysis. A P‐value <0.1 was considered statistically significant on univariate analysis, and adjusted multivariate analysis was used to identify independent risk factors. A P‐value <0.05 was considered statistically significant on multivariate analysis. Kaplan–Meier analysis with a log‐rank test was used to compare the survival differences between STAS‐positive and STAS‐negative groups. ROC analysis with area under the curve (AUC) calculation was conducted to compare the sensitivity and specificity for prediction of OS by our proposed risk score model with five‐fold validation.
Results
Demographics of the study cohort
The clinicopathologic and radiologic characteristics of all IMA patients are shown in Table S1. A total of 124 patients (93.9%) underwent lobectomy, and eight patients (6.1%) underwent wedge resection (limited resection). The rate of lobectomy (n = 124) were right upper lobe (n = 18), right middle lobe (n = 8), right lower lobe (n = 47), left upper lobe (n = 17), left lower lobe (n = 33) and bilobe (n = 1). The median surgical bronchial margin, determined as the shortest centimeter distance between the tumor margin and resected bronchus, was 3.37 cm. The median LN ratio, determined as the ratio of tumor‐positive LNs ratio among all LNs extracted during surgery, was 0.03, and 16 patients (12.1%) had nodal metastasis.
Among 122 patients who met the inclusion criteria for prognostic evaluation, 31 patients (25.4%) received adjuvant or neoadjuvant therapy and 91 patients (74.6%) did not. The type of neoadjuvant or adjuvant therapy was adjuvant chemotherapy in 21 patients (67.8%), adjuvant radiotherapy in four patients (12.9%), adjuvant CCRT (concurrent chemoradiotherapy) in one patient (3.2%), neoadjuvant chemotherapy plus adjuvant chemotherapy in three patients (9.7%), neoadjuvant CCRT in 1 patient (3.2%), neoadjuvant CCRT plus adjuvant radiotherapy in one patient (3.2%). The median follow‐up period without recurrence was 89.3 months (range 2.6–235 months). A total of 36 patients (29.5%) experienced recurrence during the follow‐up period. Among the 36 patients with recurrence, four had recurrence in a different ipsilateral lobe, indicating locoregional metastasis, and 32 patients had distant metastasis. During the follow‐up period, a total of 34 patients (27.8%) died. Among them, 26 patients died as a result of metastasis from lung mucinous adenocarcinoma, six patients died of old age and one patient died of pneumonia.
Incidence of STAS and associations of STAS with clinicopathologic and radiologic factors
Among the total 132 patients, STAS was observed in 86 (72.2%).
Table 1 shows the distribution of clinicopathologic and radiologic characteristics according to presence of STAS. We found significant positive correlations between presence of STAS and clinicopathologic features of older age, presence of LN metastasis, poor differentiation, and combined pneumonia on pathology. Among radiologic factors, lobulated and spiculated margins were associated with presence of STAS with statistical significance. On multivariate logistic regression analysis, IMA patients with STAS showed a significant tendency for older age (odds ratio [OR] = 1.070, P = 0.009), presence of lobulated margin on CT (OR = 4.808, P = 0.006), and presence of spiculated margin on CT (OR = 4.314, P = 0.027) (Table 2). Representative microphotographs of STAS correlated with CT images in IMA patients are shown in Fig 2, 3. The predictive model for presence of STAS showed discrimination performance with an AUC of 0.837, and the five‐fold cross‐validation tests demonstrated an AUC of 0.768 (Fig S3).
Table 1.
Associations between STAS and clinicopathological and radiologic factors
| STAS | ||||
|---|---|---|---|---|
| Factors | All patients (119) | Negative (n = 33 [27.8%]) | Positive (n = 86 [72.2%]) | P‐value |
| Clinical factor | ||||
| Age, median (SD) | 57.3 [11.5] | 55.0 [11.2] | 60.1 [10.5] | 0.026 |
| Current/ex‐smoker | 42 (35.3) | 10 (30.3) | 32 (37.2) | 0.481 |
| Pathologic factor | ||||
| Surgical bronchial margin cm, median (SD) | 3.4 [1.7] | 3.0 [1.5] | 3.53 [1.7] | 0.155 |
| T classification | 0.371 | |||
| 1A | 32 (26.9) | 13 (39.4) | 19 (22.1) | |
| 1B | 22 (18.5) | 5 (15.2) | 17 (19.8) | |
| 2A | 49 (41.2) | 13 (39.4) | 36 (41.9) | |
| 2B | 15 (12.6) | 2 (6.1) | 13 (15.1) | |
| 3 | 1 (0.8) | 0 (0.0) | 1 (1.2) | |
| Positive LN ratio, median (SD) | 0.03 [0.10] | 0.01 [0.04] | 0.04 [0.12] | 0.247 |
| Positive LN, present | 14 (11.8) | 1 (3.0) | 13 (15.1) | 0.100 |
| Tumor differentiation | 0.027 | |||
| Well dif. | 87 (73.1) | 31 (93.9) | 56 (65.1) | |
| Moderate dif. | 24 (20.2) | 1 (3.0) | 23 (26.7) | |
| Poorly differentiated | 8 (6.7) | 1 (3.0) | 7 (8.1) | |
| Combined pneumonia, present | 16 (13.4) | 1 (3.0) | 15 (17.4) | 0.070 |
| CT factor | ||||
| Morphology | 0.552 | |||
| Nodular type | 91 (86.5) | 24 (72.7) | 67 (77.9) | |
| Consolidative type | 28 (23.5) | 9 (27.3) | 19 (22.1) | |
| Solidity | 0.937 | |||
| Solid lesion | 62 (52.1) | 17 (51.5) | 45 (52.3) | |
| Part‐solid lesion | 57 (47.9) | 16 (48.5) | 41 (47.7) | |
| Lobulated margin, present | 47 (39.5) | 7 (21.2) | 40 (46.5) | 0.014 |
| Spiculated margin, present | 39 (32.8) | 4 (12.1) | 35 (40.7) | 0.005 |
| Well defined heterogeneous GGO, present | 14 (11.8) | 5 (15.2) | 9 (10.5) | 0.494 |
| Air bronchogram, present | 73 (61.3) | 21 (63.6) | 52 (60.5) | 0.751 |
| CT angiogram, present | 22 (18.5) | 7 (21.2) | 15 (17.4) | 0.636 |
Bold numbers indicate statistical significance (P < 0.10).
CT, computed tomography; GGO, ground‐glass opacity; LN, lymph node; dif, differentiation; SD, standard deviation; STAS, spread through air space.
Table 2.
Multivariate logistic regression of clinicopathologic and radiologic factors associated with STAS
| Factors | Odds ratio | 95% CI | P‐value |
|---|---|---|---|
| Age, older (per year) | 1.070 | 1.017–1.127 | 0.009 |
| Tumor differentiation, poorly/moderate (vs. well) | 7.458 | 0.082–62.670 | 0.060 |
| Combined pneumonia | 8.683 | 0.915–82.416 | 0.060 |
| Lobulated margin on CT | 4.808 | 1.556–14.864 | 0.006 |
| Spiculated margin on CT | 4.314 | 1.181–15.756 | 0.027 |
Bold numbers indicate statistical significance (P < 0.05).
CI, confidence interval; CT, computed tomography; STAS, spread through air spaces.
Figure 2.
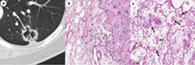
Representative images of spiculated and lobulated margins on CT correlated with pathology. (a) Enhanced CT scan with lung window (2 mm thickness) shows the lobulated and spiculated margins of the main tumor. (b) Low‐magnification photomicrograph (hematoxylin and eosin, original magnification x20) of the sample in 2a shows STAS (arrows) within air spaces in the lung parenchyma beyond the edge of the main tumor (dashed line). (c) High‐magnification photomicrograph (hematoxylin and eosin, original magnification x100) of the boxed region in 2b shows STAS (arrows) with abundant extracellular mucin (asterisk).
Figure 3.

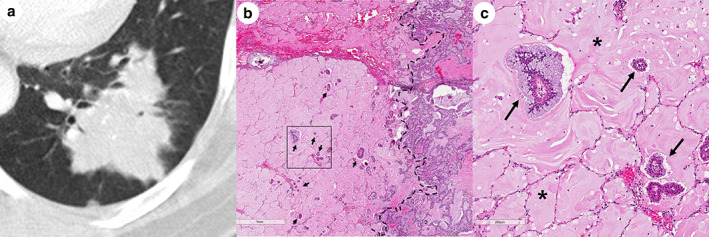
Representative image of the spiculated margin seen on CT scan, correlated with pathology. (a) Enhanced CT scan with lung window (2 mm thickness) shows the spiculated margin of the main tumor. (b) Low magnification photomicrograph (hematoxylin and eosin, original magnification X20) of the sample in 3a shows STAS (arrows) apart from the main tumor (dashed line). (c) High‐magnification photomicrograph (hematoxylin and eosin, original magnification x100) of the boxed region in 3b shows STAS (arrows) of the tumor nest.
Prognostic analysis
The results of univariate and multivariate analyses for OS and DSS in IMA patients are shown in Table 3 and Table S2. The OS rate was lower in patients with STAS compared with patients without STAS, and there was a borderline significant difference (P = 0.091). In multivariate analysis for OS, STAS was an independent poor prognostic predictor (hazard ratio [HR] = 5.040, P = 0.028). In order to verify that the P‐value was 0.091 on the univariate analysis, we fixed the STAS on the multivariate analysis and analyzed the correlation with other variables, then the result was similar to the univariate analysis. A P‐value of 0.091 in the univariate analysis was considered to be due to an insufficient number of patients. So we argued that there was a marginally significant difference between presence of STAS and lower OS rate in patients with IMA. Kaplan–Meier analysis with a log‐rank test demonstrated a lower OS rate in patients with STAS compared with patients without STAS, although there was no statistically significant difference (P = 0.080, Fig S4). In multivariate models with Cox proportional hazard model to identify independent prognostic factors, older age (HR = 1.090, P = 0.002), history of smoking (HR = 7.607, P = 0.002), higher T stage (HR = 1.892, P = 0.025), presence of LN metastasis (HR = 7.081, P = 0.001), and consolidative morphologic type (HR = 7.144, P = 0.003) on CT scan remained independent predictors for OS. ROC analysis of the sensitivity and specificity for prediction of OS with five‐fold validation at several time points is shown in Fig S5. The AUC was highest at 0.925 at 34 months. We did not observe any significant difference in DSS between STAS‐positive and STAS‐negative IMA patients (P = 0.317). However, presence of LN metastasis (HR = 6.288, P = 0.003) and consolidative morphologic type (HR = 3.841, P = 0.004) on CT scan were independent prognostic factors for poorer DSS.
Table 3.
Results of univariate and multivariate analyses for overall survival
| Univariate | Multivariate | |||||
|---|---|---|---|---|---|---|
| Variable | HR | 95% CI | P‐value | HR | 95% CI | P‐value |
| Clinical factor | ||||||
| Age, older | 5.165 | 2.379–11.213 | <0.001 | 1.090 | 1.033–1.151 | 0.002 |
| Smoking, present | 2.049 | 1.023–4.104 | 0.043 | 7.607 | 2.151–26.90 | 0.002 |
| Surgery, lobectomy | 7456 | 0 ‐ inf | 0.997 | |||
| (Neo) adjuvant therapy, present | 1.594 | 0.768–3.309 | 0.211 | |||
| Pathologic factor | ||||||
| Surgical bronchial margin, less than 1 cm | 3.147 | 1.185–8.357 | 0.021 | 3.073 | 0.534–17.69 | 0.209 |
| T classification, higher | 2.151 | 1.522–3.04 | <0.001 | 1.892 | 1.085–3.300 | 0.025 |
| Positive LN, present | 5.330 | 2.556–11.115 | <0.001 | 7.081 | 2.348–21.35 | 0.001 |
| Tumor differentiation, poorly differentiated | 1.895 | 1.163–3.09 | 0.004 | 1.874 | 0.767–4.576 | 0.168 |
| STAS, present | 2.501 | 0.864–7.320 | 0.091 | 5.040 | 1.194–21.28 | 0.028 |
| CT factor | ||||||
| Morphology, consolidative type | 3.049 | 1.521–6.113 | 0.002 | 7.144 | 1.946–26.23 | 0.003 |
| Solidity, part‐solid type | 1.146 | 0.574–2.297 | 0.696 | |||
| Lobulated margin, present | 1.121 | 0.557–2.255 | 0.749 | |||
| Spiculated margin, present | 0.702 | 0.315–0.563 | 0.386 | |||
| Well defined heterogeneous GGO, present | 2.274 | 0.981–5.271 | 0.053 | 0.718 | 0.160–3.233 | 0.666 |
| Air bronchogram, present | 0.965 | 0.482–1.948 | 0.968 | |||
| CT angiogram, present | 2.591 | 1.242, 5.405 | 0.011 | 3.020 | 0.968–9.417 | 0.057 |
Bold numbers indicate statistical significance (P < 0.10 on univariate analysis and P < 0.05 on multivariate analysis).
CI, confidence interval; CT, computed tomography; dif, differentiation; GGO, ground glass opacity; HR, hazard ratio; LN, lymph node; STAS, spread through air spaces.
Discussion
Our study consisted of a substantial number of patients, and the results demonstrated that those with IMA showed a higher incidence of STAS (72.3%) compared with patients with nonmucinous ADC (approximately 14.8%–47.6%), 3 , 4 , 19 , 20 , 21 , 22 squamous cell carcinoma (30%), 6 or pleomorphic ADC (40%). 23 Only two studies have previously reported the incidence in IMA patients. One study by Isaka et al. 24 reported the STAS incidence in IMA patients, 50% (1/2 patients), confirmed by bronchial washing cytology as well as formalin‐fixed paraffin‐embedded tissue secretion. The other study by Kim et al. 25 revealed the incidence of STAS, 50% (8/16 patients) in IMA patients. IMA confirmed unique clinical, pathologic, radiologic, and genetic characteristics compared with nonmucinous ADCs. In terms of genetic characteristics, IMA has been reported to exhibit a higher KRAS mutation, up to 86%, 13 , 26 with lesser TP53 mutation than nonmocinous ADCs. Also, aberrant expression of mucin proteins, including MUC2, MUC5AC, and MUC6 has been found in IMA patients. 27 In terms of causality regarding higher STAS incidence, given that MUC5AC functions in IMA to alter cell polarity and migration of cancer cells, 27 , 28 mucin proteins, either alone or through their interactions with many receptors, mediate cell signals and could be more likely to spread via tumor cells floating in pools of abundant extracellular mucin which is replacing air spaces. This might be one reason for the higher occurrence of STAS in IMA.
Prognostic determinants in patients with IMA have yet to be clearly defined. Previous investigators have proposed that a consolidative type or multifocal nodular type and higher T stage were predictors of poor OS rate in patients with IMA. 29 Our results are consistent overall with the previous study in terms of poor OS in patients with consolidative type, higher T stage, presence of LN metastasis, and older age. Notably, our study included STAS as well as factors previously found to be associated with prognosis to identify important prognostic factors. STAS was demonstrated to show a negative impact on prognosis based on the 2015 WHO Classification for lung adenocarcinoma in two large cohort studies. 3 , 4 , 30 According to the latest meta‐analysis study, the presence of STAS is a poor prognostic factor for patients with non‐small cell lung cancer (NSCLC). 31 In our study, STAS was a poor prognostic predictor for OS rate in IMA patients. Also, higher T stage was a poor prognostic factor. However, a direct association between STAS and T stage remains controversial. 2 , 4 , 6 In some studies, the frequency of STAS increased with stage, but was not statistically significant. 25 , 32 However, in contrast, other reports found that STAS prevalent at the higher stages was statistically significant. 4 , 6 Warth et al. 4 demonstrated STAS revealed a worse prognostic factor but was not independent of T stage. We analyzed the OS of STAS with the T stage adjusted to confirm the prognostic factor of STAS with T stage association, and there was no statistically significant difference in univariate analysis (P = 0.773). Therefore, we are in agreement that the presence of STAS is an independent poor prognostic factor, regardless of T stage. A higher incidence of intrapulmonary metastasis without extrapulmonary metastasis has been reported in patients with IMA. 33 In the study by Shim et al. 13 all recurrences were limited to the lungs, with no extrapulmonary metastases in 72 IMA patients. The characteristic of intra‐alveolar tumor cells, which means STAS, with the detached primary focus is raising the possibility of a pathogenic association with intrapulmonary metastasis. Shiono et al. supported our hypothesis that demonstrating STAS in patients with nonmucinous ADC is associated with intrapulmonary metastasis, including that from surgical margins. 34
Another notable aspect of our study is that we analyzed CT factors as well as clinicopathologic factors for prediction of STAS. With CT image quality improvement, high correlation between CT and pathologic findings and high diagnostic yield of PET‐CT, surgery is occasionally performed without a preoperative biopsy. 35 In these cases, limited resection has increased in low risk patients with early‐stage lung cancer, especially in those with tumors less than 2 cm in diameter. 36 However, recent studies have suggested that in patients with STAS, sublobar resection was associated with a significantly higher risk of recurrence than lobectomy and lobectomy should remain the standard treatment option for patient with early‐stage lung adenocarcinoma. 32 , 37 , 38 In our study, the presence of STAS in IMA patients tended to result in poorer prognosis than the absence of STAS. Therefore, a decision as to whether to proceed with limited resection should be carefully taken for a patient with the presence of STAS, but our conclusions need be confirmed by further studies. Therefore, predicting STAS using preoperative surrogate CT imaging can be helpful in clinical decision‐making regarding lung cancer treatment. Several studies have reported that absence of GGO, higher percentage of tumor solid component, and presence of a notch sign were associated with STAS. 25 , 39 Our study showed that lobulated and spiculated margins were associated with STAS, with probable characteristic imaging features focused on IMA. Lobulated and spiculated margins reflect the interaction between tumor growth and normal lung parenchyma. Although the precise reason for the relationship between the presence of these margin characteristics and STAS is not yet clear, we speculate that it may reflect STAS in terms of tumor growth rate to varying degrees in the tumor periphery. Meanwhile, the solid component was not related to the STAS in our results, which may be due to unique mucin components of IMA.
Several studies have presented various definitions for STAS. Warth summarized various definitions of STAS, 40 in which the common concept is a small cancer cell cluster that is separate from the main mass and observed in the alveolar space. The biological mechanisms underlying the development and progression of STAS have not been identified, but neoplastic cells would have to overcome several obstacles in STAS development. Some studies have hypothesized that STAS cancer cells detach from the primary focus and overcome anoikis, which is a form of programmed cell death that occurs in anchorage‐dependent cells when they detach from the surrounding extracellular matrix. 41 , 42 Several reports showed that that tumor‐infiltrating neutrophils are abundant in lung ADCs and linked to poorer outcome in patients with ADC. 43 Tumor‐infiltrating neutrophils have been implicated in not only release of mitogenic and scattering factors that favor cancer cell migration, but also induce detachment of tumor cells and favor tumor shedding. 44 , 45 In our study, STAS tended to be associated with combined pneumonia, but without statistical significance. Second, immunohistochemical analysis revealed that overexpression of laminin 5 by neoplastic cells can increase anoikis resistance and activate the epidermal growth factor receptor, and these mechanisms are also possibly associated with tumor detachment and progression. 42 Further molecular studies on tumor‐host interactions are needed to identify the underlying biological mechanisms of STAS.
Our study had several limitations. This was a retrospective study performed at a single institution. External validation is required to consolidate the results of our study as a larger series of patients in the same study could allow a better comparison between STAS and different histological types of lung cancer. However, to overcome this limitation, we aimed to include as many IMA patients as possible using logical selection and reviewed all formalin fixed slides of resected IMA at our institution during a period longer than 13 years. Second, OS rates were lower in patients with presence of STAS compared with absence of STAS in IMA patients, but were not statistically significant in univariate analysis. Validation studies are required to clarify the prognostic impact of STAS in patients with IMA in an external cohort.
In conclusion, the STAS incidence in IMA patients was 72.2%, which is higher than frequencies in patients with nonmucinous ADC or other NSCLCs. IMA patients with STAS showed a reduced OS rate compared with patients without STAS and was a borderline independent poor prognostic factor. Lobulated and spiculated margins visible on CT scan were significantly associated with STAS, indicating that these CT factors would be helpful to predict STAS in IMA patients.
Disclosure
The authors have no relevant conflicts of interest to disclose.
Supporting information
Appendix S1 Supporting Information.
Figure S1 Representative CT image of a well defined heterogeneous ground‐glass opacity (GGO), with well defined and nonspiculated margins.
(a) Well defined heterogeneous GGO (asterisk) when the mixture of consolidation and GGO was shown beyond imaginary margin of lesion (dashed line).
(b) Well defined and nonspiculated margin was defined as smoothly rounded.
Figure S2 Representative pathologic image of combined pneumonia.
Low magnification photomicrography (HE, original magnification X40) showed combined pneumonia presenting as alveolar lumen filled with neutrophils (arrows).
Figure S3 Receiver operating characteristic (ROC) analysis for the prediction of STAS.
The predictive model for presence of STAS showed discrimination performance with an area under the receiver operating characteristic curve (AUC) of 0.837 with statistically significant difference (P = 0.050). The five‐fold cross‐validation tests demonstrated an AUC of 0.768.
Figure S4 Kaplan–Meier analysis of OS (overall survival) rate with presence of STAS.
A Kaplan–Meier analysis with a log‐rank test demonstrated that the OS rate was lower in patients with STAS compared with those without STAS, whereas there was no statistically significant difference (P = 0.080).
Figure S5 Receiver operating characteristic (ROC) analysis for the prediction of OS.
ROC with five‐fold cross‐validation of the sensitivity and specificity for the prediction of overall survival at several time points. An area under the receiver operating characteristic curve (AUC) of 0.925 was highest at 34 months.
Table S1 Clinicopathologic characteristics of invasive mucinous adenocarcinoma patients (n = 132).
Table S2. Results of univariate and multivariate analyses for disease‐specific survival.
Acknowledgments
This work was supported by the Korea Health Technology R&D Project through the Korea Health Industry Development Institute (KHIDI), which was funded by the Ministry of Health and Welfare (HI17C0086), and by a National Research Foundation of Korea (NRF) grant funded by the Korean government (MSIP; Ministry of Science, ICT, and Future Planning) (No. NRF‐2016R1A2B4013046 and NRF‐2017M2A2A7A02018568).
Drs. Lee and Kang contributed equally to this work.
References
- 1. Travis WD, Brambilla E, Noguchi M et al International association for the study of lung cancer/american thoracic society/european respiratory society international multidisciplinary classification of lung adenocarcinoma. J Thorac Oncol 2011; 6: 244–85. [DOI] [PMC free article] [PubMed] [Google Scholar]
- 2. Warth A, Beasley MB, Mino‐Kenudson M. Breaking new ground: The evolving concept of spread through air spaces (STAS). J Thorac Oncol 2017; 12: 176–8. [DOI] [PubMed] [Google Scholar]
- 3. Kadota K, Nitadori J, Sima CS et al Tumor spread through air spaces is an important pattern of invasion and impacts the frequency and location of recurrences after limited resection for small stage I lung adenocarcinomas. J Thorac Oncol 2015; 10: 806–14. [DOI] [PMC free article] [PubMed] [Google Scholar]
- 4. Warth A, Muley T, Kossakowski CA et al Prognostic impact of intra‐alveolar tumor spread in pulmonary adenocarcinoma. Am J Surg Pathol 2015; 39: 793–801. [DOI] [PubMed] [Google Scholar]
- 5. Travis WD, Brambilla E, Nicholson AG et al The 2015 World Health Organization classification of lung tumors: Impact of genetic, clinical and radiologic advances since the 2004 classification. J Thorac Oncol 2015; 10: 1243–60. [DOI] [PubMed] [Google Scholar]
- 6. Lu S, Tan KS, Kadota K et al Spread through air spaces (STAS) is an independent predictor of recurrence and lung cancer‐specific death in squamous cell carcinoma. J Thorac Oncol 2017; 12: 223–34. [DOI] [PMC free article] [PubMed] [Google Scholar]
- 7. Shiono S, Ishii G, Nagai K et al Predictive factors for local recurrence of resected colorectal lung metastases. Ann Thorac Surg 2005; 80: 1040–5. [DOI] [PubMed] [Google Scholar]
- 8. Lee G, Lee HY, Jeong JY et al Clinical impact of minimal micropapillary pattern in invasive lung adenocarcinoma: Prognostic significance and survival outcomes. Am J Surg Pathol 2015; 39: 660–6. [DOI] [PubMed] [Google Scholar]
- 9. Hwang DH, Sholl LM, Rojas‐Rudilla V et al KRAS and NKX2‐1 mutations in invasive mucinous adenocarcinoma of the lung. J Thorac Oncol 2016; 11: 496–503. [DOI] [PubMed] [Google Scholar]
- 10. Yousem SA, Beasley MB. Bronchioloalveolar carcinoma: A review of current concepts and evolving issues. Arch Pathol Lab Med 2007; 131: 1027–32. [DOI] [PubMed] [Google Scholar]
- 11. Wislez M, Antoine M, Baudrin L et al Non‐mucinous and mucinous subtypes of adenocarcinoma with bronchioloalveolar carcinoma features differ by biomarker expression and in the response to gefitinib. Lung Cancer 2010; 68: 185–91. [DOI] [PubMed] [Google Scholar]
- 12. Casali C, Rossi G, Marchioni A et al A single institution‐based retrospective study of surgically treated bronchioloalveolar adenocarcinoma of the lung: Clinicopathologic analysis, molecular features, and possible pitfalls in routine practice. J Thorac Oncol 2010; 5: 830–6. [DOI] [PubMed] [Google Scholar]
- 13. Shim HS, Kenudson M, Zheng Z et al Unique genetic and survival characteristics of invasive mucinous adenocarcinoma of the lung. J Thorac Oncol 2015; 10: 1156–62. [DOI] [PubMed] [Google Scholar]
- 14. Winder T, Lenz HJ. Mucinous adenocarcinomas with intra‐abdominal dissemination: A review of current therapy. Oncologist 2010; 15: 836–44. [DOI] [PMC free article] [PubMed] [Google Scholar]
- 15. Lardinois D, De Leyn P, Van Schil P et al ESTS guidelines for intraoperative lymph node staging in non‐small cell lung cancer. Eur J Cardiothorac Surg 2006; 30: 787–92. [DOI] [PubMed] [Google Scholar]
- 16. Edge SB, Compton CC. The American joint committee on cancer: The 7th edition of the AJCC cancer staging manual and the future of TNM. Ann Surg Oncol 2010; 17: 1471–4. [DOI] [PubMed] [Google Scholar]
- 17. Rubin GD. Lung nodule and cancer detection in computed tomography screening. J Thorac Imaging 2015; 30: 130–8. [DOI] [PMC free article] [PubMed] [Google Scholar]
- 18. Bellocq A, Antoine M, Flahault A et al Neutrophil alveolitis in bronchioloalveolar carcinoma: Induction by tumor‐derived interleukin‐8 and relation to clinical outcome. Am J Pathol 1998; 152: 83–92. [PMC free article] [PubMed] [Google Scholar]
- 19. Morales‐Oyarvide V, Mino‐Kenudson M. Tumor islands and spread through air spaces: Distinct patterns of invasion in lung adenocarcinoma. Pathol Int 2016; 66: 1–7. [DOI] [PubMed] [Google Scholar]
- 20. Shiono S, Yanagawa N. Spread through air spaces is a predictive factor of recurrence and a prognostic factor in stage I lung adenocarcinoma. Interact Cardiovasc Thorac Surg 2016; 23: 567–72. [DOI] [PubMed] [Google Scholar]
- 21. Dai C, Xie H, Su H et al Tumor spread through air spaces affects the recurrence and overall survival in patients with lung adenocarcinoma >2 to 3 cm. J Thorac Oncol 2017; 12: 1052–60. [DOI] [PubMed] [Google Scholar]
- 22. Uruga H, Fujii T, Fujimori S, Kohno T, Kishi K. Semiquantitative assessment of tumor spread through air spaces (STAS) in early‐stage lung adenocarcinomas. J Thorac Oncol 2017; 12: 1046–51. [DOI] [PubMed] [Google Scholar]
- 23. Yokoyama S, Murakami T, Tao H et al Tumor spread through air spaces identifies a distinct subgroup with poor prognosis in surgically resected lung pleomorphic carcinoma. Chest 2018; 154: 838–47. [DOI] [PubMed] [Google Scholar]
- 24. Isaka T, Yokose T, Miyagi Y et al Detection of tumor spread through airspaces by airway secretion cytology from resected lung cancer specimens. Pathol Int 2017; 67: 487–94. [DOI] [PubMed] [Google Scholar]
- 25. Kim SK, Kim TJ, Chung MJ et al Lung adenocarcinoma: CT features associated with spread through air spaces. Radiology 2018; 289: 831–40. [DOI] [PubMed] [Google Scholar]
- 26. Nakaoku T, Tsuta K, Ichikawa H et al Druggable oncogene fusions in invasive mucinous lung adenocarcinoma. Clin Cancer Res 2014; 20: 3087–93. [DOI] [PMC free article] [PubMed] [Google Scholar]
- 27. Lakshmanan I, Ponnusamy MP, Macha MA et al Mucins in lung cancer: Diagnostic, prognostic, and therapeutic implications. J Thorac Oncol 2015; 10: 19–27. [DOI] [PubMed] [Google Scholar]
- 28. Geles A, Gruber‐Moesenbacher U, Quehenberger F et al Pulmonary mucinous adenocarcinomas: Architectural patterns in correlation with genetic changes, prognosis and survival. Virchows Arch 2015; 467: 675–86. [DOI] [PubMed] [Google Scholar]
- 29. Lee HY, Cha MJ, Lee KS et al Prognosis in resected invasive mucinous adenocarcinomas of the lung: Related factors and comparison with resected nonmucinous adenocarcinomas. J Thorac Oncol 2016; 11: 1064–73. [DOI] [PubMed] [Google Scholar]
- 30. Warth A, Muley T, Harms A et al Clinical relevance of different papillary growth patterns of pulmonary adenocarcinoma. Am J Surg Pathol 2016; 40: 818–26. [DOI] [PubMed] [Google Scholar]
- 31. Liu H, Yin Q, Yang G, Qie P. Prognostic impact of tumor spread through air spaces in non‐small cell lung cancers: A meta‐analysis including 3564 patients. Pathol Oncol Res 2019; 25: 1303–10. [DOI] [PubMed] [Google Scholar]
- 32. Shiono S, Endo M, Suzuki K, Yarimizu K, Hayasaka K, Yanagawa N. Spread through air spaces is a prognostic factor in sublobar resection of non‐small cell lung cancer. Ann Thorac Surg 2018; 106: 354–60. [DOI] [PubMed] [Google Scholar]
- 33. Gaikwad A, Souza CA, Inacio JR et al Aerogenous metastases: A potential game changer in the diagnosis and management of primary lung adenocarcinoma. AJR Am J Roentgenol 2014; 203: W570–82. [DOI] [PubMed] [Google Scholar]
- 34. Shiono S, Endo M, Suzuki K, Hayasaka K, Yanagawa N. Spread through air spaces in lung cancer patients is a risk factor for pulmonary metastasis after surgery. J Thorac Dis 2019; 11: 177–87. [DOI] [PMC free article] [PubMed] [Google Scholar]
- 35. Nishio R, Akata S, Saito K et al The ratio of the maximum high attenuation area dimension to the maximum tumor dimension may be an index of the presence of lymph node metastasis in lung adenocarcinomas 3 cm or smaller on high‐resolution computed tomography. J Thorac Oncol 2007; 2: 29–33. [PubMed] [Google Scholar]
- 36. Altorki NK, Kamel MK, Narula N et al Anatomical segmentectomy and wedge resections are associated with comparable outcomes for patients with small cT1N0 non‐small cell lung cancer. J Thorac Oncol 2016; 11: 1984–92. [DOI] [PubMed] [Google Scholar]
- 37. Bains S, Eguchi T, Warth A et al Procedure‐specific risk prediction for recurrence in patients undergoing lobectomy or sublobar resection for small (</=2 cm) lung adenocarcinoma: An international cohort analysis. J Thorac Oncol 2019; 14: 72–86. [DOI] [PMC free article] [PubMed] [Google Scholar]
- 38. Eguchi T, Kameda K, Lu S et al Lobectomy is associated with better outcomes than sublobar resection in spread through air spaces (STAS)‐positive T1 lung adenocarcinoma: A propensity score‐matched analysis. J Thorac Oncol 2019; 14: 87–98. [DOI] [PMC free article] [PubMed] [Google Scholar]
- 39. Toyokawa G, Yamada Y, Tagawa T et al Computed tomography features of resected lung adenocarcinomas with spread through air spaces. J Thorac Cardiovasc Surg 2018; 156: 1670–6 e4. [DOI] [PubMed] [Google Scholar]
- 40. Warth A. Spread through air spaces (STAS): Prognostic impact of a semi‐quantitative assessment. J Thorac Dis 2017; 9: 1792–5. [DOI] [PMC free article] [PubMed] [Google Scholar]
- 41. Kodama T, Kameya T, Shimosato Y, Koketsu H, Yoneyama T, Tamai S. Cell incohesiveness and pattern of extension in a rare case of bronchioloalveolar carcinoma. Ultrastruct Pathol 1980; 1: 177–88. [DOI] [PubMed] [Google Scholar]
- 42. Kodama K, Ishii G, Miyamoto S et al Laminin 5 expression protects against anoikis at aerogenous spread and lepidic growth of human lung adenocarcinoma. Int J Cancer 2005; 116: 876–84. [DOI] [PubMed] [Google Scholar]
- 43. Lin EY, Pollard JW. Role of infiltrated leucocytes in tumour growth and spread. Br J Cancer 2004; 90: 2053–8. [DOI] [PMC free article] [PubMed] [Google Scholar]
- 44. Wislez M, Rabbe N, Marchal J et al Hepatocyte growth factor production by neutrophils infiltrating bronchioloalveolar subtype pulmonary adenocarcinoma: Role in tumor progression and death. Cancer Res 2003; 63: 1405–12. [PubMed] [Google Scholar]
- 45. Wislez M, Antoine M, Rabbe N et al Neutrophils promote aerogenous spread of lung adenocarcinoma with bronchioloalveolar carcinoma features. Clin Cancer Res 2007; 13: 3518–27. [DOI] [PubMed] [Google Scholar]
Associated Data
This section collects any data citations, data availability statements, or supplementary materials included in this article.
Supplementary Materials
Appendix S1 Supporting Information.
Figure S1 Representative CT image of a well defined heterogeneous ground‐glass opacity (GGO), with well defined and nonspiculated margins.
(a) Well defined heterogeneous GGO (asterisk) when the mixture of consolidation and GGO was shown beyond imaginary margin of lesion (dashed line).
(b) Well defined and nonspiculated margin was defined as smoothly rounded.
Figure S2 Representative pathologic image of combined pneumonia.
Low magnification photomicrography (HE, original magnification X40) showed combined pneumonia presenting as alveolar lumen filled with neutrophils (arrows).
Figure S3 Receiver operating characteristic (ROC) analysis for the prediction of STAS.
The predictive model for presence of STAS showed discrimination performance with an area under the receiver operating characteristic curve (AUC) of 0.837 with statistically significant difference (P = 0.050). The five‐fold cross‐validation tests demonstrated an AUC of 0.768.
Figure S4 Kaplan–Meier analysis of OS (overall survival) rate with presence of STAS.
A Kaplan–Meier analysis with a log‐rank test demonstrated that the OS rate was lower in patients with STAS compared with those without STAS, whereas there was no statistically significant difference (P = 0.080).
Figure S5 Receiver operating characteristic (ROC) analysis for the prediction of OS.
ROC with five‐fold cross‐validation of the sensitivity and specificity for the prediction of overall survival at several time points. An area under the receiver operating characteristic curve (AUC) of 0.925 was highest at 34 months.
Table S1 Clinicopathologic characteristics of invasive mucinous adenocarcinoma patients (n = 132).
Table S2. Results of univariate and multivariate analyses for disease‐specific survival.