

Abstract
Anemia is a frequent complication of chronic kidney disease (CKD), related in part to the disruption of iron metabolism. Iron therapy is very common in children with CKD and excess iron has been shown to induce bone loss in non-CKD settings, but the impact of iron on bone health in CKD remains poorly understood. Here, we evaluated the effect of oral and parenteral iron therapy on bone transcriptome, bone histology and morphometry in two mouse models of juvenile CKD (adenine-induced and 5/6-nephrectomy). Both modalities of iron therapy effectively improved anemia in the mice with CKD, and lowered bone Fgf23 expression. At the same time, iron therapy suppressed genes implicated in bone formation and resulted in the loss of cortical and trabecular bone in the mice with CKD. Bone resorption was activated in untreated CKD, but iron therapy had no additional effect on this. Furthermore, we assessed the relationship between biomarkers of bone turnover and iron status in a cohort of children with CKD. Children treated with iron had lower levels of circulating biomarkers of bone formation (bone-specific alkaline phosphatase and the amino-terminal propeptide of type 1 procollagen), as well as fewer circulating osteoblast precursors, compared to children not treated with iron. These differences were independent of age, sex, and glomerular filtration rate. Thus, iron therapy adversely affected bone health in juvenile mice with CKD and was associated with low levels of bone formation biomarkers in children with CKD.
Keywords: chronic kidney disease, mineral metabolism, anemia, FGF23, phosphate, gene expression, pediatric nephrology
Graphical Abstract

Introduction
Chronic kidney disease (CKD) is a major public health problem affecting between 8% and 16% of the population worldwide1,2. In USA, the lifetime risk of developing a glomerular filtration rate (GFR) of less than 60 mL/min/1.73 m2 is more than 50%3. Children with CKD are particularly vulnerable, and once reached end stage renal disease, their survival remains about 30 times lower than that of the healthy peers4. Anemia and CKD-mineral bone disorder (MBD) are the common complications of CKD in children5. The pathogenesis of anemia in CKD involves disruption of the erythropoietin axis and alterations of iron metabolism. Growing concerns about the safety of erythropoiesis-stimulating agents (ESA) and their limited efficacy in the setting of low iron availability in CKD has led to a wide acceptance of the “iron first” approach, recommended by current guidelines6. Iron preparations are currently the most common medication class used in North American children with pre-dialysis CKD after angiotensin-converting enzyme (ACE)-inhibitors and active vitamin D7,8. The frequency of iron therapy in children with pre-dialysis CKD far exceeds the frequency of the ESA use7. At the same time, safety of iron therapy has been a topic for extensive debate in the nephrology community9–11. We have recently reported that oral iron therapy negatively affected renal function in mice with CKD12, while a number of studies demonstrated improvement in renal function and renal fibrosis following iron restriction or iron chelation in experimental CKD13–15.
Iron has been widely implicated in bone health16,17. In non-CKD models, iron was shown to inhibit osteoblast differentiation, activity, matrix mineralization, and formation of the new bone in vitro and in-vivo18,19. Iron excess has been directly associated with osteoporosis in the general population20. In patients with transfusion-dependent thalassemia, iron excess is associated with fractures, bone pain, and low bone mass, particularly affecting cortical bone21. Surprisingly, very few studies have assessed the effect of iron on bone health in CKD22–24.
The interest to the role of iron in CKD-MBD has recently re-emerged due to growing evidence about connection between iron, phosphate homeostasis, FGF23, and PTH25. Indeed, in an animal model of CKD26 and in clinical trials27,28, ferric citrate reduced serum phosphorus, PTH, and FGF23 levels, raising questions about potential off-target benefits of iron therapy in CKD-MBD. However, no studies to date have reported radiographic or histologic assessment of bone health in patients with CKD with relation to iron therapy. Furthermore, the effects of lowering FGF23 on bone health in CKD remain poorly understood. Recent study found no improvement of cortical porosity in conditional bone-specific (Dmp1-Cre) Fgf23-deficient mice fed adenine diet, compared to Cre-controls29. Similar to FGF23, it is not clear whether lowering PTH benefits bone health in patients with pre-dialysis CKD. For that reason, recent KDIGO guidelines do not support routine use of calcitriol and vitamin D analogs to lower PTH in patients with CKD G3a–G5 not on dialysis30.
In the present study, we evaluated the effect of oral and parenteral iron administration in juvenile mice with CKD on bone histology, morphometry, and elucidated the underlying changes in bone transcriptome. Furthermore, we examined the association between iron therapy and biomarkers of bone formation and resorption in children with CKD.
RESULTS
Oral and parenteral iron therapy improves anemia in mice with CKD
We used two mouse models of CKD, adenine diet12,24 and 5/6-nephrectomy. Two groups of CKD mice received iron therapy in oral (carbonyl iron, CKD+POFe) or parenteral (iron dextran intraperitoneally, CKD+IPFe) form, and were compared with untreated CKD (CKD+noFe) and control (Ctr) mice. Eight weeks after CKD induction, CKD+noFe mice developed anemia (Figures 1, S1a). Both modalities of iron therapy significantly improved anemia in CKD mice, to the levels similar to controls (Figures 1a–c, S1a). Serum iron levels were low in CKD+noFe mice compared to controls, but similar between CKD+POFe and controls (Figure 1d, S1b). CKD induced serum hepcidin and iron therapy resulted in an additional elevation of serum hepcidin (Figure 1e) and serum ferritin (Figures 1f, S1c). While serum iron was higher in the CKD+IPFe group than in the CKD+POFe group, parenteral iron did not elevate serum hepcidin above the levels seen in the CKD+POFe group (Figure 1e), consistent with the study of Daba et al.31, who attributed the stronger induction of hepcidin by oral compared to parenteral iron to differences in their effects on iron compartmentalization. In our study iron stores in controls were identified by histology in the spleen, but not in the liver or in the bone marrow. In CKD+POFe mice, iron stores appeared in the bone marrow, and were increased in the spleen, compared to controls (Figure 1g). In CKD+POFe and CKD+IPFe groups, iron stores were notably increased in the bone marrow, spleen, and liver, compared to CKD+noFe and control mice (Figure 1g). Liver iron content in mice without CKD treated with IP iron was similar to that in mice with CKD treated with IP iron (Figure S2a). In the bone marrow, IP iron therapy resulted in a higher iron accumulation in mice with CKD than in mice without CKD (Figure S2a). Liver iron content in CKD+ mice treated with oral iron in our study was comparable with that in Alport syndrome mice treated with iron in the study of Francis et al.26 and with human data reported by Querfeld et al.32 Mild iron accumulation was seen in the parathyroid glands of mice from the CKD+IPFe group but not from the CKD+POFe group (Figure S3). Thus, both oral and parenteral iron therapy significantly improved anemia in CKD mice while each modality of iron therapy distinctly affected iron compartmentalization.
Figure 1. Oral and parenteral iron therapy improves anemia in mice with CKD.
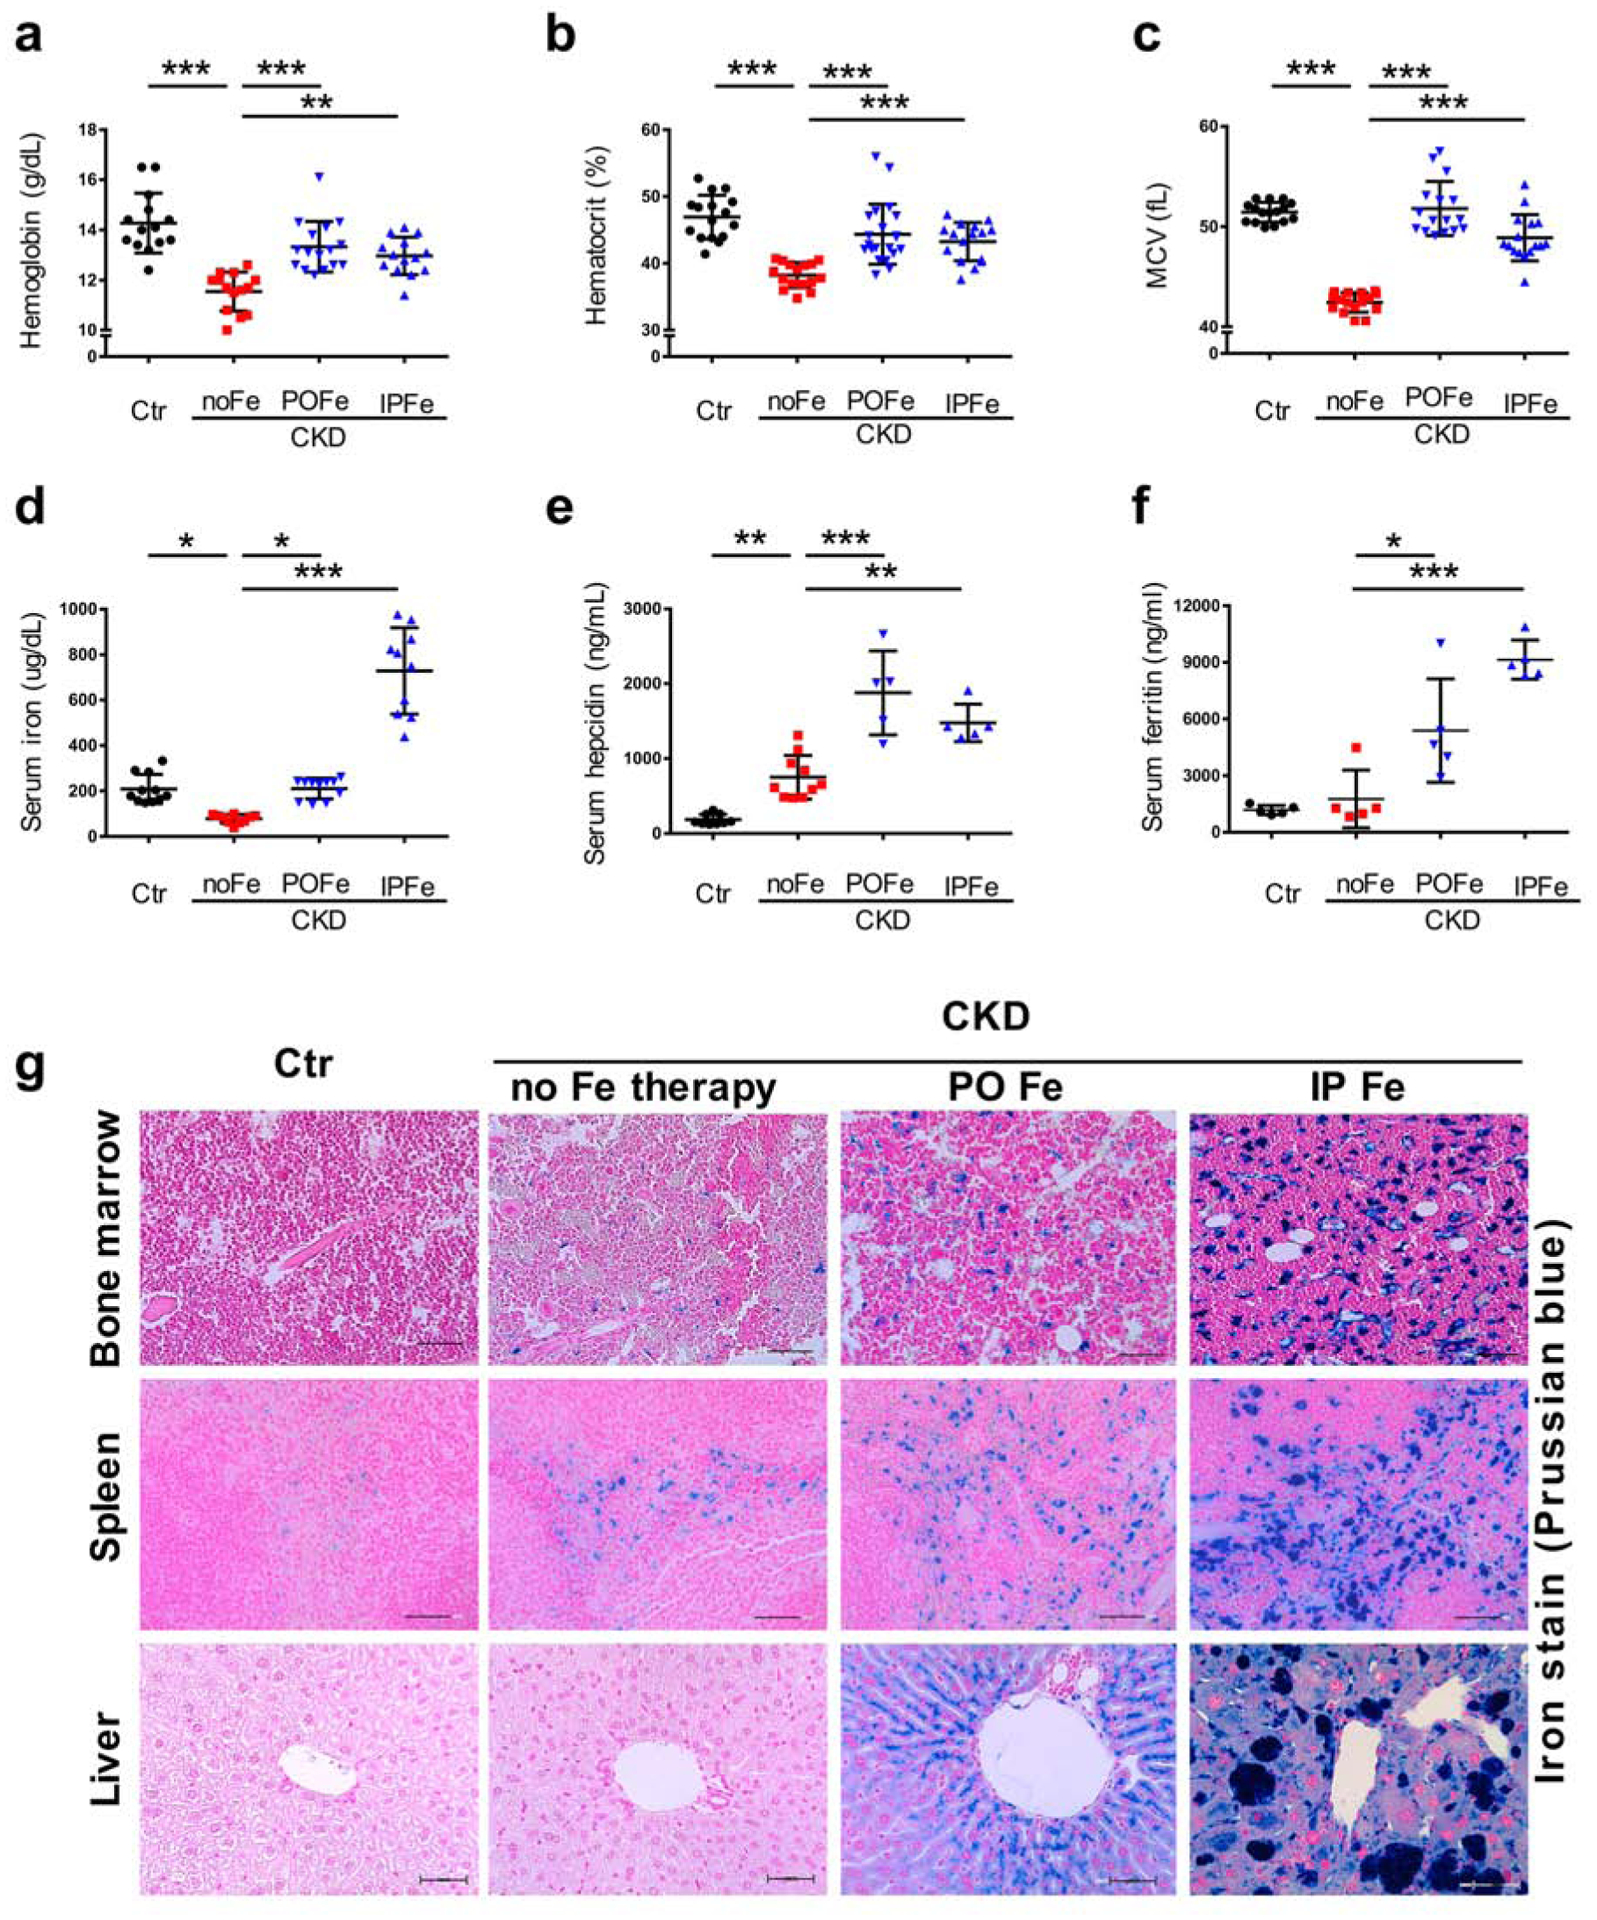
CKD was induced by a 0.2% adenine diet. Littermates fed the same diet without adenine served as controls (Ctr). In CKD mice, both oral (0.5% carbonyl iron diet, CKD+POFe) and parenteral (iron dextran intraperitoneally weekly, 0.5 g/kg/dose, CKD+IPFe) iron therapy improved (a) hemoglobin, (b) hematocrit, (c) and mean corpuscular volume (MCV) in CKD mice, (d) through the prevention of hypoferremia, compared to CKD+noFe mice. (e) Iron therapy stimulated hepcidin production, which corresponded to (f) raise in serum ferritin and (g) iron accumulation in the bone marrow, spleen, and liver of mice with CKD. Representative images, Prussian blue stain. Scale bars, 50 μm. Blood was collected and tissues harvested at euthanasia after 8 weeks of adenine diet; n=14–16 (a-d), n≥5 (e-f) per group. Error bars are standard deviations; ns, non-significant; *p<0.05, **p<0.01, ***p<0.001.
Effects of iron therapy on mineral homeostasis, systemic inflammation, and kidney function in CKD mice
Iron can affect mineral homeostasis14,26, inflammation33, and kidney function12, which in turn may have an impact on bone health. Therefore, we assessed these systemic manifestations of CKD in our model. Parenteral, but not oral iron therapy reduced iFGF23 (Figure 2a) and PTH (Figure 2c) in mice with advanced CKD. Serum 1,25(OH)2 Vitamin D was low in CKD+noFe compared to controls, but iron therapy had no statistically significant effect on 1,25(OH)2 Vitamin D (Figure 2b). In the adenine model, hyperphosphatemia, seen in CKD+noFe group, was reduced in both CKD+POFe and CKD+IPFe groups (Figure 2c). A similar trend was observed in the 5/6 nephrectomy model (Figure S1d). Serum calcium was not different between the groups (Figure 2e). Serum IL-6 and TNF-α were induced in the CKD+POFe, but not in the CKD+IPFe group, compared to CKD+noFe mice (Figure 2f–g). These differences correlate with the distinct effects of oral vs. parenteral iron on the kidney function. Indeed, in the adenine model, serum creatinine and BUN were higher in the CKD+POFe and lower in the CKD+IPFe group, compared to CKD+noFe (Figure 2h–i). A similar trend was observed in the 5/6-nephrectomy model (Figure S1e–f). Body mass index (BMI) was reduced by CKD compared to controls, but iron therapy did not affect BMI (Figure 2j). These results indicate that oral and parenteral iron administration impact systemic manifestations of CKD differently, highlighting the importance of assessing how both modalities affect bone health in CKD.
Figure 2. Mineral homeostasis, inflammation, and kidney function are differentially affected by oral vs. parenteral iron therapy in CKD mice.

(a) Serum intact fibroblast growth factor 23 (iFGF23), (b) 1,25(OH)2 Vitamin D, (c) parathyroid hormone (PTH), (d) serum phosphorus, (e) serum calcium, (f) serum interleukin 6 (IL-6), (g) serum tumor necrosis factor alpha (TNFα), (h) serum creatinine, (i) blood urea nitrogen (BUN), and (j) body mass index (BMI) in four groups of mice: controls (Ctr), iron-untreated CKD mice (CKD+noFe), CKD mice treated with oral (PO) iron (CKD+POFe), and CKD mice treated with intraperitoneally (IP) administered iron (CKD+IPFe); n=7–14 (a, c-e, h-i), n≥4 (b, f-g) per group. Blood was collected at euthanasia after 8 weeks of adenine diet in CKD mice or regular diet in controls. Error bars are standard deviations; ns, non-significant; *p<0.05; **p<0.01; ***p<0.001.
Iron therapy reduces trabecular bone volume in CKD mice
Trabecular bone volume was decreased in untreated CKD mice compared to controls, consistent with our previous report24. Trabecular bone volume was further diminished in CKD+POFe and CKD+IPFe groups compared to CKD+noFe, based on the histologic assessment and micro-CT of distal femurs (Figures 3a, S1g). Quantitative analysis demonstrated that within the similar total tissue volume selected for scanning (Figure 3b), CKD+POFe and CKD+IPFe mice had decreased bone volume and bone volume / total volume ratio, decreased trabecular number (Figures 3c–e, S1h–i), decreased trabecular thickness (Figure 3f), and increased trabecular separation (Figure 3g), compared to CKD+noFe mice. In mice without CKD, iron therapy also decreased trabecular bone volume and number, compared to controls, although not to the extent seen in mice with CKD treated with iron (Figure S2b–c). Thus, iron therapy resulted in the loss and thinning of the trabecular bone in CKD mice.
Figure 3. Trabecular bone loss in CKD mice treated with iron.

(a) Histology and micro-computed tomography (micro-CT) imaging of the trabecular bone within distal femur in four groups of mice after 8 weeks of adenine or control diets: controls (Ctr), iron-untreated CKD (CKD+noFe), CKD treated with oral iron (CKD+POFe), and CKD treated with parenteral iron (CKD+IPFe). Upper panels: hematoxylin and eosin (H&E), scale bars 500 μm. Middle panels: representative micro-CT mid-scans. Lower panels: micro-CT 3D reconstruction. Color gradient represents trabecular thickness. Micro-CT quantification of (b) total volume (TV) of tissues selected for scanning, (c) bone volume (BV), (d) percent of bone volume within the total volume (BV/TV), (e) trabecular number (Tb.N), (f) trabecular thickness Tb.Th), and (g) trabecular separation (Tb.Sp), n=10 per group. Error bars are standard deviations; ns, non-significant; *p<0.05, **p<0.01, ***p<0.001.
Iron therapy leads to the loss of cortical bone volume in CKD mice
Cortical bone mineral density is associated with fracture risk in children with CKD34. As previously described24, cortical bone volume and thickness were reduced in untreated CKD mice compared to control littermates, based on histologic examination and micro-CT of femur mid-diaphysis (Figures 4, S1g). Both oral and parenteral iron therapy further reduced cortical bone area and cortical thickness (Figure 4b–e, S1j), tissue mineral density (Figure 4f), and polar moment of inertia (Figure 4g) in CKD mice, compared to the CKD+noFe group. Cortical porosity was higher in CKD+POFe than in CKD+noFe group (Figures 4h and S1k). In mice without CKD, iron therapy also reduced cortical thickness and increased cortical porosity, compared to controls, however the reduction was less severe than in mice with CKD treated with iron (Figure S2d–e). These findings indicate that iron therapy adversely affects cortical bone volume and microstructure in CKD mice.
Figure 4. Iron therapy leads to the cortical bone loss in mice with CKD.

(a) Hematoxylin and eosin (H&E) staining (upper panels) and micro-computed tomography (micro-CT), 3D reconstruction (lower panels) of mid-femur cross-sections in four groups of mice after 8 weeks of adenine or control diets: controls (Ctr), iron-untreated CKD (CKD+noFe), CKD treated with oral iron (CKD+POFe), and CKD treated with parenteral iron (CKD+IPFe); scale bars, 500 μm. Micro-CT quantification of (b) total area (Tt.Ar), (c) cortical area (Ct.Ar), (d) cortical bone area fraction (Ct.Ar/Tt.Ar), (e) cortical thickness (Ct.Th), (f) tissue mineral density (D.Tiss), (g) moment of inertia (J), (h) cortical porosity (Ct.Porosity), n=10 per group. Error bars are standard deviations; ns, non-significant; *p<0.05, **p<0.01, ***p<0.001.
Iron therapy suppresses expression of genes implicated in bone formation in mice with early CKD
To elucidate transcriptional changes underlying the effects of iron therapy on bone health, we performed bone RNA sequencing analysis on the tissues obtained from mice exposed to adenine diet for 3 weeks in the presence and absence of iron therapy and from control mice. The differences in bone morphometry between the groups were not yet apparent at this time (Supplementary Table S1). In all groups, transcripts specific for osteoblasts, osteocytes, and osteoclasts were present in high abundance (Supplementary Table S2). The top 60 differentially expressed genes formed two distinct clusters (Figure 5a). The first cluster encompassed the transcripts overexpressed in the CKD+noFe group compared to all other groups. Transcripts that formed the second cluster also had higher expression in the CKD+noFe group compared to controls; however, they remained highly expressed under iron therapy. To delineate the functional role of these clusters, we analyzed the expression of genes with known role in bone biology (Figure 5b). Expression of osteoblast and osteocyte genes critical for bone formation followed the first pattern, while the expression of osteoclast genes implicated in bone resorption fit into the second pattern. Expression of selected genes was confirmed by real-time PCR (Figure 5c). Of note, Fgf23 expression was suppressed by both oral and parenteral iron therapy. Ingenuity Pathway Analysis (IPA) indicated that iron therapy suppressed bone mineralization, osteoblast differentiation, bone mineral density, bone strength, and bone remodeling pathways (Table 1). Thus, RNA sequencing revealed that in mice with early CKD, iron therapy suppressed expression of genes implicated in bone formation. Osteoclast genes were activated by CKD and remained overexpressed in the presence of iron therapy.
Figure 5. Iron therapy alters bone gene expression profile in mice with CKD.

(a) Heatmap visualization of RNA sequencing analysis showing top differentially expressed transcripts from bone marrow-free femur tissues in four mouse groups: controls (Ctr), untreated CKD (CKD+noFe), CKD treated with oral iron (CKD+POFe), and CKD treated with parenteral iron (CKD+IPFe), n=3 per group. Expression of the transcripts was compared between control and CKD+noFe groups, between CKD+noFe and CKD+POFe groups, and between CKD+noFe and CKD+IPFe groups. Top 20 differentially expressed transcripts from each of these comparisons formed the heatmap. The transcripts from the dominating cluster are induced in CKD+noFe compared to both controls and both iron-treated CKD groups. The color scale represents differences in gene expression z-scores (b) Heatmap depicting expression of transcripts known to play a major role on bone formation (osteoblast and osteocyte genes) and bone resorption (osteoclast genes). (c) Expression of selected individual genes in four groups of mouse femurs quantified by conventional real-time PCR. Gene expression was normalized by Actb, n=3–5 per group. Femurs were collected after 3 weeks of adenine or control diets. The data are presented as fold of control animals (Ctr). Error bars are standard deviations; *p<0.05, **p<0.01.
Table 1. Bone formation pathways affected by iron therapy in mice with CKD.
Gene expression was assessed by bone marrow-free femur tissues RNA sequencing. Bones were obtained from mice fed adenine diet for 3 weeks. Pathways affected by iron therapy were identified using ingenuity pathway analysis (IPA). Negative activation z-scores indicate
| Pathway / function | Genes | p-value | Activation z-score |
|---|---|---|---|
| Bone mineralization | Ankh↓, Aspn↓, Bmp4↓, Cebpb↑, Dkk2↓, Dmp1↓, En1↓, Enpp1↓, Esr2↓, Fgf23↓, Gadd45b↓, Grem1↑, II10↓, Mgp↓, Mmp13↓, Nabp2↑, Postn↓, Sfrp4↓, Spp1↓ | 5.64E-09 | −1.028 |
| Osteoblast differentiation | Bmp4↓, Cebpb↑, Dkk2↓, Edn1↓, Enpp1↓, Fgf23↓, FosI1↓, Gdf10↑, Gdpd2↑, Grem1↑, Id4↑, Ifi16↓, II10↓, Ostn↓, Pitx2↓, Postn↓, Sfrp4↓, Spp1↓, Tnfaip6↓, Uama↑ | 2.47E-06 | −0.721 |
| Bone mineral density | Aspa↓, Camk4↓, Cd14↓, Cd38↑, Dkk2↓, Dmp1↓, Esr2↓, Fgf23↓, Igf2↓, Mgp↓, Nr1h4↓, Postn↓, Spp1↓, Thbs2↓ | 5.93E-05 | −0.859 |
| Bone strength | Esr2↓, II10↓, Postn↓, Sfrp4↓, Spp1↓, Wnt16↓ | 1.43E-04 | −0.896 |
| Bone remodeling | Camk4↓, Cd38↑, Cd44↓, Cebpb↑, Edn1↓, Enpp1↓, Igf2↓, Mgp↓, Ppargc1b↓, Sfrp4↓, Spon1↓, Spp1↓, Tph1↓, Wnt16↓ | 2.79E-04 | −1.389 |
suppression of the respected pathways by iron therapy.
Gene expression is lower in CKD/POFe group compared to CKD group
Gene expression is higher in CKD/POFe group compared to CKD group
Bone formation and bone resorption in mice with and without CKD in the presence and absence of iron therapy
To evaluate phenotypic effect of the changes in bone transcriptome induced by iron therapy, we assessed bone formation and resorption by histology and histomorphometry. In the bones of iron-treated mice, we observed decreased osteoblast number and osteoblast surface compared to untreated CKD+noFe mice (Figures 6a–c and S1g). Mineral apposition rate and bone formation rate, assessed by double calcein labeling, were also decreased in both CKD+POFe and CKD+IPFe groups compared to the CKD+noFe group (Figure 6a, d–e). Interestingly, while no significant differences in bone morphometry were observed between CKD+POFe and CKD+IPFe groups, osteoid seams of CKD+IPFe bones had more iron than CKD+POFe bones (Figure 6a). Osteoclast activity, assessed by tartrate resistant acid phosphatase (TRAP) staining, was induced in all CKD groups, showing no significant effect of iron therapy (Figure 6a). Serum bone-specific alkaline phosphatase (BAP) levels were induced in untreated CKD. CKD+POFe and CKD+IPFe groups had lower serum BAP than CKD+noFe group (Figure 6f). Urine Deoxypyridinoline (DPD) to creatinine ratio was higher in all CKD groups compared to controls but similar between iron-treated and iron-untreated groups (Figure 6g). In mice without CKD, iron therapy also suppressed bone formation, compared to controls (Figure S2f–j). In contrast to mice with CKD, in mice without CKD iron therapy activated bone resorption (Figure 2f, k). Thus, consistent with our RNA-sequencing data (Figure 5), bone histology and dynamic histomorphometry indicated that iron therapy suppressed bone formation and had no appreciable effect on bone resorption in CKD mice
Figure 6. Assessment of bone formation and bone resorption in four groups of mice.

(a) Bone histology (upper panels) demonstrated decreased osteoblast (white arrows) number in CKD mice treated with oral (CKD+POFe) and parenteral (CKD+IPFe) iron compared to untreated CKD mice (CKD+noFe), hematoxylin and eosin staining. Mineral apposition rate, assessed by the distance between two calcein-labeled lines (upper middle panels), was decreased in CKD+POFe and CKD+IPFe mouse bones, compared to CKD+noFe and controls (Ctr). Calcein was injected 7 days and 3 days before euthanasia. Perls’ Prussian blue staining (lower middle panels) identified iron in osteoid seams in all mouse groups (black arrows); CKD+IPFe group had the strongest and most extensive iron staining. Tartrate-resistant acid phosphatase (TRAP) staining (lower panels) indicated increased osteoclast activity in all CKD groups compared to controls, with no appreciable effect of iron therapy. Bones were harvested after 3 weeks of adenine or control diets. Representative images, 40x magnification; bone samples from n≥3 mice per group were analyzed. Scale bars, 100 μm (upper and lower middle panels), 50 μm (upper middle and lower panels). Quantification of (b) osteoblast number, (c) osteoblast surface, (d) mineral apposition rate (MAR), and (e) bone formation rate per unit of bone surface (BFR/BS), n=3–6 per group. (f) Serum bone-specific alkaline phosphatase (BAP), a marker of bone formation, is activated in CKD+noFe group and suppressed by iron therapy in CKD+POFe and CKD+IPFe groups back to the levels seen in controls, n=5–8 per group. (g) Urine deoxypyridinoline (DPD), a marker of bone resorption, normalized by urine creatinine is elevated in all CKD groups compared to controls, with no significant effect of iron therapy, n=8–10 per group. Serum and urine were collected after 8 weeks of adenine / control diet. Error bars are standard deviations; ns, non-significant; **p<0.01, ***p<0.001.
Biomarkers of bone formation in children with CKD are suppressed by oral iron therapy
To determine translational significance of our animal findings we evaluated the association between iron therapy and biomarkers of bone formation and resorption in a cohort of children with CKD. Clinical characteristics of the cohort are shown in Supplementary Table S3. Forty percent of children were receiving oral iron therapy. Serum total and bone-specific alkaline phosphatase (BAP) and amino-terminal propeptide of type 1 procollagen (P1NP) were significantly lower in children receiving iron therapy (Figure 7a–b) than in children not treated with iron. Urine excretion of DPD was not different between the groups (Figure 7c). Flow cytometric analysis of the peripheral blood demonstrated that children treated with iron had fewer circulating osteoblast precursors than children not treated with iron (Figure 7d), while no differences in circulating osteoclast precursors were identified (Figure 7e). Analyses of the differences in bone biomarkers between the groups of children treated vs. not treated with iron were adjusted for age, sex, GFR, and PTH (Tables 2 and S4). Thus, analyses of bone formation and resorption biomarkers in children with CKD yielded results consistent with our experimental findings.
Figure 7. Bone formation and bone resorption biomarkers in children with CKD.

Serum levels of bone formation biomarkers (a) bone-specific alkaline phosphatase (BAP) and (b) procollagen type 1 N-terminal propeptide (P1NP) were lower in children with CKD receiving iron therapy compared to children with CKD not receiving iron therapy. (c) Urine deoxypyridinoline (DPD) to urine creatinine ratio, a marker of bone resorption was not different between the two groups of children with CKD. (d) Flow cytometry analysis of circulating osteoblast precursors. Representative plots and quantification by counts and percents. The alkaline phosphatase (ALP)+ and osteocalcin+ double positive population was gated from forward scatter vs. side scatter parent population of peripheral blood mononuclear cells (PBMC). (e) Circulating osteoclast precursors. Quantification of the CD11b+ and CD51/61+ (vitronectin receptor)+ double positive PBMC populations. P-values are adjusted for age, sex, and glomerular filtration rate. Children with CKD not receiving iron therapy (CKD+noFe), n=35; children with CKD receiving oral iron therapy (CKD+POFe), n=23. Error bars are standard deviations; ns, non-significant; *p<0.05, **p<0.01, ***p<0.001.
Table 2.
Multivariate analysis of the relationship between iron therapy and bone biomarkers in children with CKD.
| Variables | BAP | P1NP | Osteoblast precursors | DPD/Cr | Osteoclast precursors | |||||
|---|---|---|---|---|---|---|---|---|---|---|
| β (95% CI) | P | β (95% CI) | P | β (95% CI) | P | β (95% CI) | P | β (95% CI) | P | |
| Iron therapy vs. no iron therapy | −19.89 (−37.3, −2.47) | 0.02 | −310.86 (−539.1, −82.5) | 0.01 | −17.74 (−29.88, −5.60) | 0.006 | −0.18 (−0.61, 0.27) | 0.43 | 2.91 (−0.94, 6.76) | 0.13 |
| Age | −3.93 (−5.46, −2.41) | <0.001 | −46.44 (−67.98, −24.90) | <0.001 | −0.07 (−1.49, 1.35) | 0.91 | −0.08 (−0.12, −0.04 | <0.001 | 0.17 (−0.16, 0.51) | 0.29 |
| Sex | −2.35 (−22.05, 17.34) | 0.81 | −15.08 (−269.9, 239.7) | 0.90 | −2.53 (−16.14, 11.07) | 0.70 | −0.16 (−0.60, 0.29) | 0.49 | −3.07 (−7.37, 1.23) | 0.15 |
| GFR | −0.32 (−0.89, 0.25) | 0.26 | −3.48 (−12.82, 5.86) | 0.45 | −0.12 (−0.50, 0.26) | 0.53 | 0.00 (−0.01, 0.01) | 0.64 | 0.01 (−0.09, 0.11) | 0.86 |
Osteoblast precursors were defined as alkaline phosphatase (ALP)+ and osteocalcin+ double positive peripheral blood mononuclear cells (PBMCs), and osteoclast precursors as CD11b+ and CD51/61+ (vitronectin receptor)+ double positive PBMCs. Linear regression analysis. BAP, serum bone-specific alkaline phosphatase; P1NP, serum amino-terminal propeptide of type 1 procollagen; DPD/Cr, urine deoxypyridinoline to creatinine ratio; CI, confidence interval; GFR, glomerular filtration rate.
DISCUSSION
Iron is widely used to treat anemia in patients with CKD. Bone health is compromised in most patients with CKD. Iron has been implicated in bone biology; however, the effects of iron therapy on bone health in CKD remain largely unknown. Here we report that iron therapy, in the doses adequate to control anemia, reduced bone mass in mice, owing to iron-induced imbalance between bone formation and resorption. In line with these animal data, in children with CKD, iron therapy was associated with decreased biomarkers of bone formation and with reduced number of circulating osteoblast precursors.
Iron overload-associated bone loss is well characterized in non-CKD settings. Tsay et al. reported cortical and trabecular bone loss in healthy adult wild type mice treated with iron dextran33, which was also seen in juvenile CKD(−) mice treated with iron dextran in our study. Children with iron overload secondary to transfusion-dependent hematologic disorders have decreased bone mineral density35. However, it remains unclear whether iron therapy in the setting of CKD would result in bone effects similar to those observed in the absence of CKD. In our model, iron therapy resulted in the loss of both cortical and trabecular bone, and decreased bone mineral density. This was consistent with the study of Mandalunis et al, where intraperitoneal administration of iron dextran to 5/6-nephrectomized rats resulted in a reduction of trabecular and cortical bone volume and elicited features of adynamic bone disease22,23. Interestingly, similar to our current iron therapy model, improvement of iron availability due to hepcidin blockade was also associated with a loss of trabecular bone24, although not as severe as in WT CKD mice treated with iron in the present study.
Emerging evidence indicates that bone homeostasis is disrupted very early in the course of CKD36,37. Our bone RNA sequencing data demonstrated that in early CKD, both osteoclast-specific and osteoblast/osteocyte-specific genes were highly expressed in CKD mice, compared to controls. Expression of osteoclast-specific genes implicated in bone resorption was not enhanced by iron therapy in CKD mice. In contrast, in both iron-treated CKD groups, osteoblast/osteocyte-specific bone formation genes were down-regulated, suppressing osteoblast differentiation and bone mineralization pathways. Unbiased bone genomic studies have not been previously reported in CKD. A targeted analysis of bone gene expression in a mouse model of polycystic kidney disease demonstrated early activation of genes associated with osteoclast activity, while repression of genes associated with osteoblast function was observed in late-stage disease38. Our genomic data were consistent with the activation of both bone formation and bone resorption in early, untreated CKD, indicating increased bone turnover. In the presence of iron therapy, the genomic signature shifted toward a marked imbalance between bone formation and resorption, favoring suppression of bone formation by iron, while bone resorption remained activated.
The translational effect of these iron-induced genomic changes was confirmed by bone histology and dynamic histomorphometry, as well as by assessment of the peripheral biomarkers of bone formation and resorption. Iron-untreated CKD was characterized by a parallel activation of both bone formation and bone resorption. In iron-treated CKD groups, we found suppressed bone formation, while bone resorption did not change, compared to mice with iron-untreated CKD. Preferential effect of iron on bone formation rather than resorption was also reported by de Vernejoul et al., who found decreased osteoblast recruitment but no change in osteoclast activity in pigs treated with iron dextran39. Conversely, Tsay et al. suggested that activation of bone resorption was primarily responsible for the iron-induced bone loss in adult mice without CKD33. In our study, iron also activated bone resorption in mice without CKD, compared to control mice not treated with iron. Therefore, both iron and CKD independently activated bone resorption. However, we did not observe an additional activation of bone resorption when mice were exposed to both CKD and iron simultaneously. This was likely because CKD per se activated osteoclasts beyond the threshold amenable to an additional activation by iron. On the contrary, iron and CKD exerted the opposite effects on bone formation, which negated each other when applied simultaneously. Thus, suppression of bone formation by iron therapy in the setting of activated by CKD bone resorption resulted in a net loss of bone mass in mice with CKD treated with iron.
Bone biopsy is considered a gold standard for bone assessment in patients with CKD but performed infrequently30. Assessment of the peripheral biomarkers of bone formation and resorption remains important in the evaluation of CKD-MBD40. Iron-treated children from our CKD cohort displayed lower levels of total and bone-specific alkaline phosphatase and P1NP (bone formation biomarkers), and no differences in urine DPD/creatinine ratio (bone resorption biomarker), compared to children with CKD not receiving iron. Furthermore, in children with CKD, iron therapy was associated with decreased numbers of circulating osteoblast precursors, but not osteoclast precursors. These human data are in line with our experimental findings, suggesting a link between iron therapy and suppressed bone formation in CKD. While the ability of iron to suppress bone formation in non-CKD settings has been described41, iron could also activate osteoclasts and bone resorption in the absence of CKD42. Similar to our mouse data, the lack of bone resorption activation by iron in our human study could mean that osteoclast activity had already been induced by CKD beyond the stimulating potential of iron.
In our experiments, both oral and parenteral iron administration to CKD mice improved hyperphosphatemia, consistent with other reports26. The mechanism of serum phosphorus reduction by iron remains incompletely understood. Ferrous citrate could serve as a phosphate binder in the gut43. Reduction of serum phosphorus in mice with CKD treated with parenteral iron in our study suggests additional systemic mechanisms by which iron could reduce serum phosphorus. We also observed that both oral and parenteral iron suppressed bone FGF23 gene expression in in mice with early CKD. Circulating iFGF23 and PTH in late CKD were reduced only by parenteral iron dextran, but not by oral carbonyl iron. In the study of Francis et al. oral ferric citrate reduced serum phosphorus, iFGF23, and PTH in Col4a3-KO mice26. The lack of improvement of FGF23 and PTH in late CKD by oral iron therapy in our model can be explained by a more advanced CKD and more severe inflammation in the CKD+POFe mice than in the CKD+IPFe group. Inflammation is known to increase FGF23 production44. Thus, uremia and inflammation could have negated the potential lowering effect of oral iron on FGF23 and PTH in our study. In light of iron depositions that we observed in the parathyroid glands in the CKD+IPFe but not CKD+POFe group, it is also possible that parenterally administered iron exerted a direct suppressive effect on the parathyroid gland. Importantly, suppression of FGF23 levels in CKD mice treated with parenteral iron failed to improve their bone health, in line with findings reported by Clinkenbeard et al.29.
While mechanisms mediating the effects of iron in the bone remain elusive, our study suggests that these effects cannot be explained merely by the presence of ferric iron in the bone. Indeed, in our mouse model, parenteral iron administration resulted in a higher bone iron content than oral administration, but the changes in bone volume were similar between CKD+POFe and CKD+IPFe groups. Thus, we found no direct correlation between bone iron content (assessed by staining) and bone volume. These observations are consistent with several cross-sectional human studies which also did not find an association between bone iron content and bone histomorphometry. Custodio et al. did not find a correlation between the presence of iron in osteoid beams and bone histomorphometry45. Rioja et al. reported a similar lack of association between iron-positive bone perimeters and bone remodeling in children with thalassemia46. In both studies, similar to our mouse model, iron was found in the osteoid but not in the fully mineralized bone. Importantly, osteoid iron pool is very dynamic and easily mobilizable. After intraperitoneal injection, radioactive iron accumulates in osteoid within hours but in 2 days after injection almost no iron can be found in the osteoid47. Therefore, osteoid may serve as a transient compartment in bone iron trafficking, however the significance of osteoid iron in bone health remains unclear. Taken together with these reports, our findings indicate that visualization of osteoid iron may not be sufficient for the assessment of iron effects in the bone, and highlight a need for novel approaches to study the role of iron therapy in CKD-MBD.
Our study had several limitations. Control mice were not pair-fed with CKD mice and therefore we cannot fully exclude the impact of the differences in food intake and energy metabolism on the alterations in bone structure and function seen in mice with CKD, compared to control mice. However, nutritional factors likely did not impact the effects of iron on bone health, because we did not observe statistically significant differences in BMI between CKD+noFe, CKD+POFe, and CKD+IPFe groups. We used carbonyl iron for oral iron therapy in juvenile mice and therapeutic effects were similar to those seen in children with CKD treated with oral ferrous sulfate. However, it would be of interest to assess the effects of different oral iron preparations, such as ferric citrate, on bone health in CKD. Because we were interested in modeling bone disease in pediatric CKD, we used actively growing mice for experimentation. In future studies, it would be important to evaluate effects of iron on bone health in adult CKD.
In summary, in this study we assessed the effects of oral and parenteral iron therapy on bone health in juvenile CKD by direct examination of bone tissues in two murine models of juvenile CKD. Oral and parenteral iron therapy had different effects on inflammation, renal function, and circulating markers of CKD-MBD. However, the impact of both modalities of iron therapy on bone health was similar. Iron suppressed bone formation, which resulted in a loss of cortical and trabecular bone in CKD mice. Consistent with animal data, in children with CKD, we found associations between iron therapy and suppression of the peripheral biomarkers of bone formation, as well as between iron therapy and depletion of circulating osteoblast precursors. These data highlight the need to further optimize the management of anemia of CKD in the context of underlying iron metabolism alterations, accounting for the potential adverse effects of iron therapy on bone health in patients with CKD.
METHODS
Animals
The animal protocol was approved by the Institutional Animal Care and Use Committee of Weill Cornell Medicine. C57BL/6J male mice were fed 0.2% adenine diet from 3 to 11 weeks of age as previously described24 to induce CKD. Five-week-old 129S male mice underwent two-step 5/6 nephrectomy or sham surgery. Mice were randomly assigned to five groups: controls [CKD(−)noFe], untreated CKD [CKD+noFe], CKD fed 0.5% carbonyl iron diet [CKD+POFe], CKD receiving intraperitoneal iron dextran [a complex of ferric hydroxide, Fe(OH)3 and low molecular weight (10000) dextran] weekly, 0.5 g/kg/dose [CKD+IPFe], and mice without CKD receiving the same dose of iron dextran weekly [CKD(−)IPFe]. Three and eight weeks after CKD induction, mice were euthanized via pentobarbital injection. Body length to calculate BMI was defined as half of the nose (snout) to tail tip length.
Biochemistry, blood count
Blood was collected from the inferior vena cava at euthanasia. Blood urea nitrogen (BUN), creatinine, and phosphorus were measured on the Beckman Coulter (Brea, CA) AU 680 analyzer. Serum iron was measured using colorimetric assay (Pointe Scientific, Canton, MI). Cytokines were measured by electrochemiluminescence on the QuickPlex SQ 120 Analyzer using a V-Plex kit from Meso Scale Discovery (Rockville, MD). Mouse BAP and DPD were measured by ELISA (Supplementary Table 4). Mouse blood counts were performed on the IDEXX Procyte DX analyzer (Westbrook, ME).
Histology
Calcein was injected subcutaneously (15mg/kg) 7 and 3 days before sacrifice. Right legs were fixed in 10% formalin and left legs in 70% ethanol. Following fixation, bones were decalcified in 10% EDTA for 10 days, embedded in paraffin, sectioned, and processed for hematoxylin and eosin, Perls’ Prussian blue, and TRAP stains. A subset of bones was embedded in polymethylmethacrylate. Calcein fluorescence was captured using EVOS® FL Auto Imaging System microscope (Thermo Fisher Scientific). Terminology was derived from the Report of the American Society of Bone and Mineral Research Histomorphometry Nomenclature Committee48. Spleens and livers were fixed in 10% formalin, paraffin embedded, sectioned, and stained with Perls’ Prussian blue.
Micro-CT
Left femurs removed after euthanasia were placed in 70% ethanol. A distal segment of the femurs (1.35 mm in length starting 100 μm from the growth plate) and a 1.4 mm segment of the mid-diaphysis were used, respectively, for trabecular and cortical bone micro-CT analysis on a Scanco μCT 35 system (Scanco Medical, Brüttisellen, Switzerland) as previously described24. Bone morphometric indexes were reported using nomenclature recommended by the American Society of Bone and Mineral Research49.
RNA isolation, RNA sequencing and RT-PCR
Total RNA was extracted from mid-diaphyses of femurs harvested at 3 weeks after flushing out the bone marrow, using the RNeasy mini kit (Qiagen, Hilden, Germany). Following RNA isolation, total RNA integrity was checked using a 2100 Bioanalyzer (Agilent Technologies, Santa Clara, CA). RNA concentration was measured using the NanoDrop system (Thermo Fisher Scientific, Inc., Waltham, MA). Preparation of RNA sample library and RNA-sequencing were performed by the Genomics Core Facility at Weill Cornell Medicine. Messenger RNA was prepared using TruSeq Stranded mRNA Sample Library Preparation kit (Illumina, San Diego, CA). The normalized cDNA libraries were pooled and sequenced on Illumina HiSeq4000 sequencer with single-end 50 cycles and analyzed using STAR (V2.5.2) and DESeq2 package. RT-PCR was performed on a 7500 Fast real-time PCR system (Applied Biosystems). The genes of interest were normalized to the Ct value of Actb, using the ΔΔCt method and the data were presented as fold of control50. Primer sequences are shown in Supplementary Table S6.
Patients
Children with CKD were enrolled in pediatric nephrology clinics at Weill Cornell Medical Center after obtaining informed consent. The study was approved by the Institutional Review Board. Clinical characteristics, including iron therapy status were abstracted from medical records. Serum was separated immediately following blood collection and stored at −80 degrees until analyzed. BAP and DPD were measured by ELISA and P1NP was determined using radioimmunoassay (Supplementary Table S5). Plasma PTH and serum 25(OH)-vitamin D were measured by the New York-Presbyterian Hospital clinical laboratory using Siemens ADVIA Centaur® intact PTH assay (Siemens Healthcare) and the LIAISON® 25 OH Vitamin D total assay (DiaSorin S.p.A.) respectively. Peripheral blood mononuclear cells (PBMC) were isolated through Lymphoprep™ density gradient centrifugation in SepMate™ tubes (Stemcell Technologies) as per manufacturer’s protocol and stored in liquid nitrogen until analyzed.
Flow cytometry
Anti-alkaline phosphatase and anti-osteocalcin antibodies were used to label osteoblast precursors, anti-CD11b+ and anti-vitronectin receptor antibodies to label osteoclast precursors as previously described51 (Supplementary Table S4). The non-specific sites were blocked using anti-CD16/32 antibody through incubating PBMCs for 10 minutes at 4°C. The fixation permeabilization treatment was performed before staining using fix/perm buffer (Thermo Fisher Scientific) for 15 minutes at 4°C. The cells were incubated with antibodies for 40 minutes at 4° C in the dark. The stained cells were washed twice, fixed in 2% paraformaldehyde (Santa Cruz Biotechnology) and captured (10,000 events per sample) using BD Fortessa (BD Biosciences).
Statistics
Data were reported as mean±SD, median (interquartile range), or n (%). One-way analysis of variance (ANOVA) was used for the analysis of differences among 4 groups with Tukey post-hoc test. Multiple linear regression was used for multivariate analyses of human data. GraphPad Prism (La Jolla, CA) and STATA-12.0 (Stata Corp, College Station, TX) were used for statistical analyses.
Supplementary Material
Supplementary Table S1. Micro-computed tomography analysis of cortical and trabecular bone in mice with early CKD in the presence and absence of iron therapy and in control mice.
Supplementary Table S2. Expression of the selected transcripts specific for osteoblasts, osteocytes, and osteoclasts in four groups of mice based on RNA sequencing.
Supplementary Table S3. Clinical characteristics of the human CKD cohort.
Supplementary Table S4. Multivariate analysis of the relationship between iron therapy and bone biomarkers in children with CKD, adjusted for serum parathyroid hormone.
Supplementary Table S5. Reagents used in this study.
Supplementary Table S6. Mouse primers used for mRNA quantitation by real-time PCR.
Supplementary Figure S1. Iron therapy and bone health in mice with CKD induced by 5/6-nephrectomy.
Supplementary Figure S2. Effect of iron therapy on bone morphometry, bone formation and resorption in mice without CKD.
Supplementary Figure S3. Histology of the parathyroid glands in control mice and in mice with CKD in the presence and absence of iron therapy.
Translational Statement.
This study showed that young CKD mice treated with iron to correct anemia showed lower cortical and trabecular bone volume compared to CKD mice not treated with iron. In a parallel human study, iron therapy was associated with decreased levels of bone formation biomarkers. These results suggest a need to further optimize treatment of renal anemia in children with CKD, accounting for the potential adverse effects of iron therapy on bone health.
Acknowledgements
This work was supported in part by the National Institutes of Health (NIH) National Institute of Diabetes and Digestive and Kidney Diseases K08 DK114558 (OA), R01DK095112 and RO1DK090554-07 (SR), National Center for Advancing Translational Sciences UL1TR002384 to the Clinical and Translational Science Center, Weill Cornell Medicine (OA, MEC, YSZ), National Heart, Lung, and Blood Institute R01 HL133801 (MEC), and Rohr Family Clinical Scholar Award (OA). Authors greatly appreciate the contribution of E. Perelstein, M.D., M.P.H., J. Kumar, M.D., M.P.H., A. Gajjar, M.D., M.S.C.E., and S. Pellegrino, R.N. from the Division of Pediatric Nephrology, Department of Pediatrics at Weill Cornell Medicine for subject enrollment into the human study. Authors thank Fatima Al-Bilani for help with animal experiments. Authors greatly appreciate the help of S. Monette, D.M.V., M.V.Sc., DACVP with histological assessment of the parathyroid tissues and S. Cunningham-Rundles, Ph.D. for critically reviewing the manuscript.
Sources of support that require acknowledgment:
National Heart, Lung, and Blood Institute R01 HL133801 (MEC).
National Institute of Diabetes and Digestive and Kidney Diseases K08 DK114558 (OA), R01DK095112 and 5RO1DK090554-07 (SR).
National Center for Advancing Translational Sciences UL1TR002384 (OA, MEC, YSZ) and KL2TR002385 (YSZ) to the Clinical and Translational Science Center, Weill Cornell Medicine
Footnotes
Publisher's Disclaimer: This is a PDF file of an unedited manuscript that has been accepted for publication. As a service to our customers we are providing this early version of the manuscript. The manuscript will undergo copyediting, typesetting, and review of the resulting proof before it is published in its final form. Please note that during the production process errors may be discovered which could affect the content, and all legal disclaimers that apply to the journal pertain.
Disclosure
SR is a consultant for Cambridge Healthcare Research, Celgene Corp, Disc Medicine, FORMA Therapeutics, Ghost Tree Capital, IONIS Pharmaceuticals, Noble insight, Protagonist Therapeutics, Sanofi Aventis U.S., Inc., Slingshot Insight, Techspertio, venBio Select LLC. The spouse of MEC is a cofounder and shareholder, and serves on the Scientific Advisory Board of Proterris, Inc. All other authors have no conflicts of interest to disclose.
Supplementary information is available on Kidney International’s website.
References
- 1.Xie Y, Bowe B, Mokdad AH, et al. Analysis of the Global Burden of Disease study highlights the global, regional, and national trends of chronic kidney disease epidemiology from 1990 to 2016. Kidney international. 2018;94(3):567–581. [DOI] [PubMed] [Google Scholar]
- 2.Chen TK, Knicely DH, Grams ME. Chronic Kidney Disease Diagnosis and Management: A Review. JAMA. 2019;322(13):1294–1304. [DOI] [PMC free article] [PubMed] [Google Scholar]
- 3.Matsushita K, Coresh J, Sang Y, et al. Estimated glomerular filtration rate and albuminuria for prediction of cardiovascular outcomes: a collaborative meta-analysis of individual participant data. The lancet Diabetes & endocrinology. 2015;3(7):514–525. [DOI] [PMC free article] [PubMed] [Google Scholar]
- 4.Harambat J, Van Stralen KJ, Kim JJ, Tizard EJ. Epidemiology of chronic kidney disease in children. Pediatric nephrology. 2012;27(3):363–373. [DOI] [PMC free article] [PubMed] [Google Scholar]
- 5.Akchurin M Chronic Kidney Disease and Dietary Measures to Improve Outcomes. Pediatric Clinics. 2019;66(1):247–267. [DOI] [PMC free article] [PubMed] [Google Scholar]
- 6.McMurray JJ, Parfrey PS, Adamson JW, et al. Kidney disease: Improving global outcomes (KDIGO) anemia work group. KDIGO clinical practice guideline for anemia in chronic kidney disease. Kidney International Supplements. 2012;2(4):279–335. [Google Scholar]
- 7.Akchurin M, Schneider MF, Mulqueen L, et al. Medication adherence and growth in children with CKD. Clinical Journal of the American Society of Nephrology. 2014;9(9):1519–1525. [DOI] [PMC free article] [PubMed] [Google Scholar]
- 8.Blydt-Hansen TD, Pierce CB, Cai Y, et al. Medication treatment complexity and adherence in children with CKD. Clinical Journal of the American Society of Nephrology. 2014;9(2):247–254. [DOI] [PMC free article] [PubMed] [Google Scholar]
- 9.Ribeiro S, Belo L, Reis F, Santos-Silva A. Iron therapy in chronic kidney disease: Recent changes, benefits and risks. Blood reviews. 2016;30(1):65–72. [DOI] [PubMed] [Google Scholar]
- 10.Agarwal R, Kusek JW, Pappas MK. A randomized trial of intravenous and oral iron in chronic kidney disease. Kidney international. 2015;88(4):905–914. [DOI] [PMC free article] [PubMed] [Google Scholar]
- 11.Macdougall IC, Bircher AJ, Eckardt K-U, et al. Iron management in chronic kidney disease: conclusions from a “Kidney Disease: Improving Global Outcomes”(KDIGO) Controversies Conference. Kidney international. 2016;89(1):28–39. [DOI] [PubMed] [Google Scholar]
- 12.Akchurin O, Patino E, Dalal V, et al. Interleukin-6 Contributes to the Development of Anemia in Juvenile CKD. Kidney international reports. 2019;4(3):470–483. [DOI] [PMC free article] [PubMed] [Google Scholar]
- 13.Naito Y, Fujii A, Sawada H, et al. Association between renal iron accumulation and renal interstitial fibrosis in a rat model of chronic kidney disease. Hypertension Research. 2015;38(7):463. [DOI] [PubMed] [Google Scholar]
- 14.Hanudel MR, Chua K, Rappaport M, et al. Effects of dietary iron intake and chronic kidney disease on fibroblast growth factor 23 metabolism in wild-type and hepcidin knockout mice. American Journal of Physiology-Renal Physiology. 2016;311(6):F1369–F1377. [DOI] [PMC free article] [PubMed] [Google Scholar]
- 15.Remuzzi A, Puntorieri S, Brugnetti B, Bertani T, Remuzzi G. Renoprotective effect of low iron diet and its consequence on glomerular hemodynamics. Kidney international. 1991;39(4):647–652. [DOI] [PubMed] [Google Scholar]
- 16.Weinberg ED. Role of iron in osteoporosis. Pediatric endocrinology reviews : PER. 2008;6 Suppl 1:81–85. [PubMed] [Google Scholar]
- 17.Jeney V Clinical Impact and Cellular Mechanisms of Iron Overload-Associated Bone Loss. Frontiers in pharmacology. 2017;8:77. [DOI] [PMC free article] [PubMed] [Google Scholar]
- 18.Balogh E, Tolnai E, Nagy B Jr., et al. Iron overload inhibits osteogenic commitment and differentiation of mesenchymal stem cells via the induction of ferritin. Biochimica et biophysica acta. 2016;1862(9):1640–1649. [DOI] [PubMed] [Google Scholar]
- 19.Vogiatzi MG, Tsay J, Verdelis K, et al. Changes in bone microarchitecture and biomechanical properties in the th3 thalassemia mouse are associated with decreased bone turnover and occur during the period of bone accrual. Calcified tissue international. 2010;86(6):484–494. [DOI] [PMC free article] [PubMed] [Google Scholar]
- 20.Kim BJ, Ahn SH, Bae SJ, et al. Iron overload accelerates bone loss in healthy postmenopausal women and middle‐aged men: A 3‐year retrospective longitudinal study. Journal of Bone and Mineral Research. 2012;27(11):2279–2290. [DOI] [PubMed] [Google Scholar]
- 21.Vogiatzi MG, Macklin EA, Fung EB, et al. Bone disease in thalassemia: a frequent and still unresolved problem. Journal of Bone and Mineral Research. 2009;24(3):543–557. [DOI] [PMC free article] [PubMed] [Google Scholar]
- 22.Mandalunis P, Gibaja F. Experimental renal failure and iron overload: A histomorphometric study in the alveolar bone of rats. Experimental and Toxicologic Pathology. 2002;54(2):85–90. [DOI] [PubMed] [Google Scholar]
- 23.Mandalunis PM, Ubios AM. Experimental renal failure and iron overload: a histomorphometric study in rat tibia. Toxicologic pathology. 2005;33(3):398–403. [DOI] [PubMed] [Google Scholar]
- 24.Akchurin O, Sureshbabu A, Doty SB, et al. Lack of hepcidin ameliorates anemia and improves growth in an adenine-induced mouse model of chronic kidney disease. American Journal of Physiology-Renal Physiology. 2016;311(5):F877–F889. [DOI] [PMC free article] [PubMed] [Google Scholar]
- 25.Edmonston D, Wolf M. FGF23 at the crossroads of phosphate, iron economy and erythropoiesis. Nature Reviews Nephrology. 2019:1–13. [DOI] [PubMed] [Google Scholar]
- 26.Francis C, Courbon G, Gerber C, et al. Ferric citrate reduces fibroblast growth factor 23 levels and improves renal and cardiac function in a mouse model of chronic kidney disease. Kidney International. 2019. [DOI] [PMC free article] [PubMed] [Google Scholar]
- 27.Fishbane S, Block GA, Loram L, et al. Effects of ferric citrate in patients with nondialysis-dependent CKD and iron deficiency anemia. Journal of the American Society of Nephrology. 2017;28(6):1851–1858. [DOI] [PMC free article] [PubMed] [Google Scholar]
- 28.Block GA, Block MS, Smits G, et al. A Pilot Randomized Trial of Ferric Citrate Coordination Complex for the Treatment of Advanced CKD. Journal of the American Society of Nephrology. 2019:ASN. 2018101016. [DOI] [PMC free article] [PubMed] [Google Scholar]
- 29.Clinkenbeard EL, Noonan ML, Thomas JC, et al. Increased FGF23 protects against detrimental cardio-renal consequences during elevated blood phosphate in CKD. JCI insight. 2019;4(4). [DOI] [PMC free article] [PubMed] [Google Scholar]
- 30.Ketteler M, Block GA, Evenepoel P, et al. Executive summary of the 2017 KDIGO Chronic Kidney Disease–Mineral and Bone Disorder (CKD-MBD) Guideline Update: what’s changed and why it matters. Kidney international. 2017;92(1):26–36. [DOI] [PubMed] [Google Scholar]
- 31.Daba A, Gkouvatsos K, Sebastiani G, Pantopoulos K. Differences in activation of mouse hepcidin by dietary iron and parenterally administered iron dextran: compartmentalization is critical for iron sensing. Journal of Molecular Medicine. 2013;91(1):95–102. [DOI] [PubMed] [Google Scholar]
- 32.Querfeld U, Dietrich R, Taira R, Kangarloo H, Salusky I, Fine R. Magnetic resonance imaging of iron overload in children treated with peritoneal dialysis. Nephron. 1988;50(3):220–224. [DOI] [PubMed] [Google Scholar]
- 33.Tsay J, Yang Z, Ross FP, et al. Bone loss caused by iron overload in a murine model: importance of oxidative stress. Blood. 2010;116(14):2582–2589. [DOI] [PMC free article] [PubMed] [Google Scholar]
- 34.Denburg MR, Tsampalieros AK, de Boer IH, et al. Mineral metabolism and cortical volumetric bone mineral density in childhood chronic kidney disease. The Journal of Clinical Endocrinology & Metabolism. 2013;98(5):1930–1938. [DOI] [PMC free article] [PubMed] [Google Scholar]
- 35.De Sanctis V, Soliman AT, Elsefdy H, et al. Bone disease in β thalassemia patients: past, present and future perspectives. Metabolism. 2018;80:66–79. [DOI] [PubMed] [Google Scholar]
- 36.Wesseling-Perry K, Pereira RC, Tseng C-H, et al. Early skeletal and biochemical alterations in pediatric chronic kidney disease. Clinical Journal of the American Society of Nephrology. 2012;7(1):146–152. [DOI] [PMC free article] [PubMed] [Google Scholar]
- 37.Graciolli FG, Neves KR, Barreto F, et al. The complexity of chronic kidney disease–mineral and bone disorder across stages of chronic kidney disease. Kidney international. 2017;91(6):1436–1446. [DOI] [PubMed] [Google Scholar]
- 38.Sabbagh Y, Graciolli FG, O’Brien S, et al. Repression of osteocyte Wnt/β‐catenin signaling is an early event in the progression of renal osteodystrophy. Journal of Bone and Mineral Research. 2012;27(8):1757–1772. [DOI] [PubMed] [Google Scholar]
- 39.de Vernejoul M, Pointillart A, Golenzer C, Morieux C, Bielakoff J, Modrowski D, Miravet L. Effects of iron overload on bone remodeling in pigs. The American journal of pathology. 1984;116(3):377–384. [PMC free article] [PubMed] [Google Scholar]
- 40.Lalayiannis A, Crabtree N, Fewtrell M, et al. Assessing bone mineralisation in children with chronic kidney disease: what clinical and research tools are available? Pediatric Nephrology. 2019:1–21. [DOI] [PMC free article] [PubMed] [Google Scholar]
- 41.Jeney V Clinical impact and cellular mechanisms of iron overload-associated bone loss. Frontiers in pharmacology. 2017;8:77. [DOI] [PMC free article] [PubMed] [Google Scholar]
- 42.Ishii K-a, Fumoto T, Iwai K, et al. Coordination of PGC-1β and iron uptake in mitochondrial biogenesis and osteoclast activation. Nature medicine. 2009;15(3):259. [DOI] [PubMed] [Google Scholar]
- 43.Ganz T, Bino A, Salusky IB. Mechanism of action and clinical attributes of Auryxia®(ferric citrate). Drugs. 2019:1–12. [DOI] [PMC free article] [PubMed] [Google Scholar]
- 44.Francis C, David V. Inflammation regulates FGF23 production. Current opinion in nephrology and hypertension. 2016;25(4):325. [DOI] [PMC free article] [PubMed] [Google Scholar]
- 45.Custodio MR, Elias RM, Velasquez WD, et al. The unexpected presence of iron in bone biopsies of hemodialysis patients. International urology and nephrology. 2018;50(10):1907–1912. [DOI] [PubMed] [Google Scholar]
- 46.Rioja L, Girot R, Garabédian M, Cournot-Witmer G. Bone disease in children with homozygous β-thalassemia. Bone and mineral. 1990;8(1):69–86. [DOI] [PubMed] [Google Scholar]
- 47.Huser H, Gerber L, Eichenberger P, Waelti E, Cottier H. Short-lasting accumulation in osteoid bone seams of radioactive iron injected as citrate into mice. The American journal of pathology. 1988;131(2):339. [PMC free article] [PubMed] [Google Scholar]
- 48.Parfitt AM, Drezner MK, Glorieux FH, et al. Bone histomorphometry: standardization of nomenclature, symbols, and units: report of the ASBMR Histomorphometry Nomenclature Committee. Journal of bone and mineral research. 1987;2(6):595–610. [DOI] [PubMed] [Google Scholar]
- 49.Bouxsein ML, Boyd SK, Christiansen BA, Guldberg RE, Jepsen KJ, Müller R. Guidelines for assessment of bone microstructure in rodents using micro–computed tomography. Journal of bone and mineral research. 2010;25(7):1468–1486. [DOI] [PubMed] [Google Scholar]
- 50.Schmittgen TD, Livak KJ. Analyzing real-time PCR data by the comparative C T method. Nature protocols. 2008;3(6):1101. [DOI] [PubMed] [Google Scholar]
- 51.D’Amelio P, Cristofaro MA, Grimaldi A, et al. The role of circulating bone cell precursors in fracture healing. Calcified tissue international. 2010;86(6):463–469. [DOI] [PubMed] [Google Scholar]
Associated Data
This section collects any data citations, data availability statements, or supplementary materials included in this article.
Supplementary Materials
Supplementary Table S1. Micro-computed tomography analysis of cortical and trabecular bone in mice with early CKD in the presence and absence of iron therapy and in control mice.
Supplementary Table S2. Expression of the selected transcripts specific for osteoblasts, osteocytes, and osteoclasts in four groups of mice based on RNA sequencing.
Supplementary Table S3. Clinical characteristics of the human CKD cohort.
Supplementary Table S4. Multivariate analysis of the relationship between iron therapy and bone biomarkers in children with CKD, adjusted for serum parathyroid hormone.
Supplementary Table S5. Reagents used in this study.
Supplementary Table S6. Mouse primers used for mRNA quantitation by real-time PCR.
Supplementary Figure S1. Iron therapy and bone health in mice with CKD induced by 5/6-nephrectomy.
Supplementary Figure S2. Effect of iron therapy on bone morphometry, bone formation and resorption in mice without CKD.
Supplementary Figure S3. Histology of the parathyroid glands in control mice and in mice with CKD in the presence and absence of iron therapy.