

Abstract
Protein therapeutics typically require a concentrated protein formulation, which can lead to self-association and/or high viscosity due to protein-protein interaction (PPI). Excipients are often added to improve stability, bioavailability, and manufacturability of the protein therapeutics, but the selection of excipients often relies on trial and error. Therefore, understanding the excipient-protein interaction and its effect on non-specific PPI are important for rational selection of formulation development. In this study, we validate a general workflow based on the site identification by ligand competitive saturation (SILCS) technology, termed SILCS-Biologics that can be applied to protein therapeutics for rational excipient selection. The National Institute of Standards and Technology monoclonal antibody (NISTmAb) reference along with the CNTO607 mAb are used as model antibody proteins to examine protein-protein interactions and NISTmAb was used to further examine excipient-protein interactions, in silico. Metrics from SILCS include the distribution and predicted affinity of excipient and buffer interactions with the NISTmAb Fab and the relation of the interactions to predicted PPI. Comparison with a range of experimental data showed multiple SILCS metrics to be predictive. Specifically, the number of favorable sites to which an excipient binds and the number of sites to which excipients binds that are involved in predicted protein-protein interactions correlate with the experimentally determined viscosity. In addition, a combination of number of binding sites and the predicted binding affinity are indicated to be predictive of relative protein stability. Comparison of arginine, trehalose and sucrose, all of which give the highest viscosity in combination with analysis of B22 and kD and the SILCS metrics indicate that higher viscosities are associated with a low number of predicted binding sites with the lower binding affinity of arginine leading to its anomalously high impact on viscosity. The present study indicates the potential for the SILCS-Biologics approach to be of utility in the rational design of excipients during biologics formulation.
Keywords: monoclonal antibody, molecular dynamics, biologics, protein-based drugs, formulation, protein-protein interactions
Graphical Abstract

Introduction
Protein therapeutics have been playing an increasing role as new therapeutic agents since the adoption of recombinant human insulin.1–3 In fact, protein-based therapeutics represent about 30% of the newly approved drugs in 2016.4 Formulation represents one of the key bottlenecks in the development of protein therapeutics because complex interactions of the proteins can lead to aggregation and high viscosity, and ultimately reduces the sample quality.5 In addition, they must be formulated to maintain active protein levels during long-term storage and subsequent injection/infusion.6–8 Therefore, formulation of protein therapeutics can be considered as an optimization process identifying combinations of excipients and buffers that act at the molecular level (1) to stabilize the native (folded) protein structure, preventing denaturation (unfolding) leading to loss of biological activity and non-specific aggregation of denatured protein molecules, and (2) to minimize protein-protein interactions (PPI) of the native structure, thereby avoiding aggregation and minimizing viscosity.9–11
Protein formulation invariably involves expensive and time-consuming experiments. To assist the formulation process, several computational tools have been developed. Many of these adopt bioinformatics approaches to predict aggregation-prone regions (APR) in a protein sequence.12 However, many of the sequences used for training those bioinformatics algorithms are based on beta-sheet forming sequences, such as amyloidogenic sequences13–16 and the utility of applying such algorithms to predict aggregation of globular proteins might be uncertain. Structure-based methods to predict aggregation have also been developed. The spatial aggregation propensity (SAP) score has shown that the higher the SAP score, which indicates the protein has larger exposed hydrophobic surface during molecular dynamics (MD) simulation, is associated with increased protein aggregation.17 Similarly, spatial charge map (SCM) was proposed to characterize total charges of atoms that are exposed on the protein surface, which was shown to correlate with viscosity of the protein.18 SAP has been successfully applied to design a new sequence of an antibody that yielded a product that exhibited less aggregation.17 However, care must be taken when mutating a protein sequence because APR sequences tend to be found in protein-protein binding sites, including complementary-determining region (CDRs), and introducing mutation to the APR sequence may have adverse effect on therapeutic activity.19
Currently, computational tools that help formulation scientists in screening for potential excipients are rare. Recent work by Cloutier et. al.20 has shown that preferential interaction coefficients (Γ23) calculated from MD simulation could be applied to select excipients that preferably interact with the protein (versus remain in the bulk phase). Such excipients would be anticipated to prevent self-interaction of proteins and reduce viscosity. While it was shown that the Γ23 computed from MD simulation matches the experimental values, the correlation between Γ23 and the experimental viscosity was not clear. More recently, a machine learning model was developed for use in formulations with individual excipients based on Γ23 data in conjunction with a large number of mAb surface properties for 5 excipients and NaCl.21 While the use of Γ23 in conjunction with machine learning opens up new avenues for formulation science the model is based on MD simulations that require significant computational resources especially when information on a large number of excipients or combination of excipients and buffers are required.
In this work, we describe the application of the SILCS (Site-Identification by Ligand Competitive Saturation) approach22–24 for ranking excipients for a given protein, here monoclonal antibodies (mAb). Figures 1 shows the schematics of this workflow, namely SILCS-Biologics (Somani et al., submitted for publication). The workflow starts with the antibody 3D structure and generating SILCS FragMaps. The SILCS FragMaps encode the protein-functional group interaction pattern all across the protein surface while taking into account desolvation penalties and protein flexibility, allowing detailed description of protein-ligand interactions on any part of protein surface.23 SILCS has been successfully applied for lead compound identification and optimization as well as the identification of novel ligand pockets in the structure-based small molecule drug development field.25–29 The SILCS FragMaps are then used in antibody-antibody PPI docking and global docking of excipients on the antibody surface, utilizing the SILCS-PPI and SILCS-Hotspots methods, respectively.30, 31 Finally, the information gathered by the workflow are processed and compared with experimental data, such as viscosity, which allows future prediction of excipients that could modulate the properties of the antibody formulation.
Figure 1.
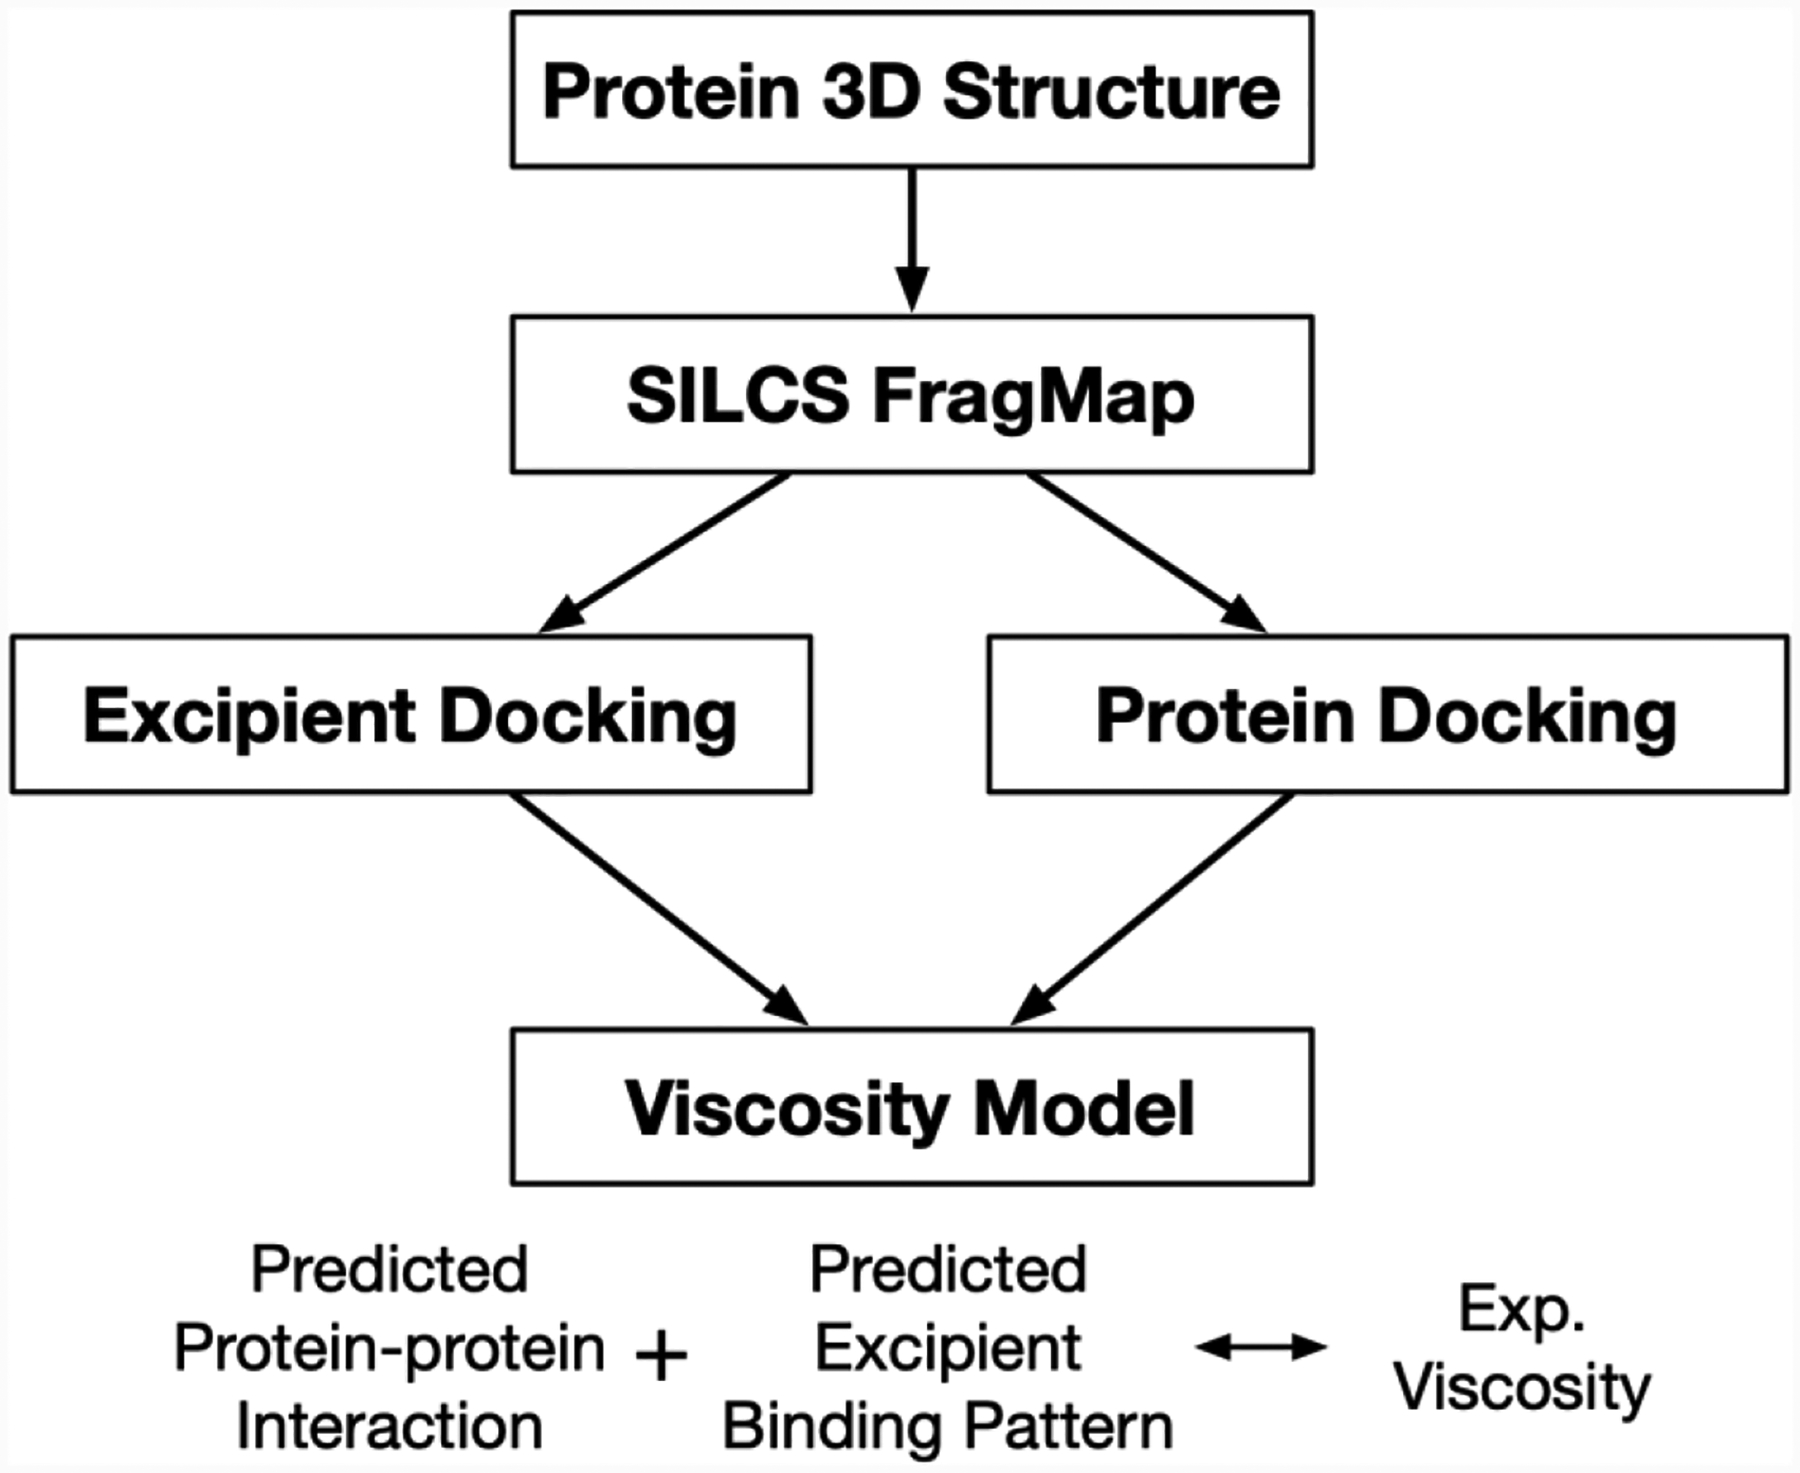
Overview of SILCS-Biologics workflow.
The present context of excipient ranking builds upon this approach where the binding site is effectively the whole solvent exposed surface of the protein. Exploiting this along with the highly computationally efficient SILCS-MC approach allows SILCS to provide a detailed molecular level view of how well a given excipient “coats” the surface of a protein. This information may be used to understand how excipients may facilitate stabilization of the protein and, in conjunction with the SILCS-PPI approach, identify excipients that may bind to protein-protein self-interaction hot spots on the surface of the protein thereby minimizing protein aggregation, a significant problem in protein-based drug formulation.
In this work, we apply the SILCS-Biologics approach to the NISTmAb32 along with CNTO607 mAb,33 focusing on the Fab in each case, to illustrate the utility of the workflow and demonstrate the types of information generated by the workflow. The NISTmAb is known to be highly stable such that it shows high concentratability and low viscosity at high concentrations. In contrast, the CNTO607 mAb aggregates at relatively low concentrations.34 We show that PPI analysis indicates the CDR of CNTO607 is more prone to be involved in self-association consistent with crystallographic and mutagenesis experiments.34 In addition, with the NISTmAb the number of excipients predicted to favorably interact with the antibody by SILCS-Biologics correlates with the decrease in viscosity, suggesting the workflow can be used in screening large number of excipients. Moreover, additional metrics from SILCS-Biologics are shown to correlate with the second virial coefficient of the Debye plot (B22), diffusion interaction parameter (kD), and the structure factor (S(0)exp) as well as with protein stability and allow for a molecular level interpretation of the events contributing to the impact of excipients on those properties.
Materials & Methods1
SILCS simulations and FragMap preparation
Crystal structures of NISTmAb Fab, PDB:5K8A, and CNTO607 Fab, PDB:3G6A, were used to initialize the SILCS simulations. SILCS FragMap simulations were performed using the SilcsBio software package version 2020.2 (SilcsBio, LLC) with the GROMACS simulation package.35 The SILCS simulation protocol is previously described.28 Briefly, the simulation systems involving protein, water and eight solute molecules including benzene, propane, methanol, formamide, acetaldehyde, imidazole, methylammonium, and acetate were prepared. Total of 10 independent simulation systems were prepared with randomly positioned solute molecules at approximately 0.25 M each and with the sidechains of solvent exposed protein residues systematically varied to improve convergence. The simulation systems were minimized and equilibrated for 1 ns with positional restraint on non-hydrogen protein atoms using GROMACS simulation package.35 Following 25 cycles of 200,000 steps of oscillating chemical potential Grand Canonical Monte Carlo (GCMC) sampling24, 36 of the water and solutes around the protein, the production simulations consist of 100 cycles of GCMC/MD simulation. During each cycle, 200,000 steps of GCMC simulation is performed, which drives the sampling of solute and water molecules, followed by a 1 ns molecular dynamics (MD) simulation of the entire system. Weak harmonic restraints with a force constant of 0.12 kcal/mol/Å were kept on all Cα atoms of the protein during the MD simulations. The unit cal stands for calorie, while 1 kcal equals to 1000 cal. The protein conformations and distributions of water and solutes were saved every 10 ps during MD simulation phase for analysis. The protein, solutes and water were described using the CHARMM36m protein force field,37, 38 the CHARMM General force field (CGenFF)39 and the TIP3P water model modified for the CHARMM force field.40
The FragMaps were generated by binning the selected solute atoms into voxels of a 1 Å spaced grid spanning the simulation system. The voxel occupancy can be used to calculate grid-based free energy (GFE)41 using the equation,
where Ni is the observed voxel occupancy of the probe at grid point i, and N0 is the expected voxel occupancy of the probe alone in the bulk for a given concentration. During the GCMC phase of the production simulation, the number of probe molecules fluctuated, therefore the number of water molecules were used to correct the bulk concentration of the solute molecules.38 GFE is a measure of free energy change for moving an atom from the bulk state to the grid point i. For example, if the GFE of a voxel near protein is −1.5 kcal/mol, then the probe atoms are about 12 times more likely to be found in that voxel than in the voxels that are far away from the protein (“bulk”) at room temperature.
Protein-protein Docking Using SILCS FragMap
A global protein docking was performed using the SILCS FragMaps to determine the protein-protein interaction preference using SilcsBio software package (SilcsBio, LLC). The details and the validation of SILCS-PPI protocol has been described previously.42 Briefly, two sets of maps were prepared; SILCS FragMap and the protein sidechain probability grid maps (PPGMaps) for both the receptor and the ligand proteins. The FragMaps and PPGMaps were computed from the same SILCS GCMC/MD trajectories described above. The PPGMaps were calculated by computing the voxel occupancy of selected sidechain atoms (see Table 1 of ref.42 for the selected sidechain atoms) and normalized by the maximum occupancy value, i.e., have ranges from 0 to 1.
Table 1.
Experimental data for the NISTmAb from Xu et al.46 including the Viscosity, the second virial coefficient of the Debye plot (B22), diffusion interaction parameter (kD), the structure factor (S(0)exp) and the temperature at which the heat capacity starts to change, ΔTonset, versus control.
| Excipient | Viscosity at 170 mg/mL (cp) | B22 (mol mL/g2) | kD (mL/g) | S(0)exp | ΔTonset (°C) |
|---|---|---|---|---|---|
| Arginine | 29.06 | 4.20E-05 | −3.20 | 0.33 | −0.02 |
| Trehalose | 25.02 | 3.24E-04 | 20.88 | 0.16 | 1.70 |
| Sucrose | 24.43 | 3.86E-04 | 19.84 | 0.11 | 3.08 |
| Glucose | 21.21 | 3.14E-04 | 23.49 | 0.09 | 3.47 |
| Mannitol | 21.16 | 2.95E-04 | 24.45 | 0.13 | 2.85 |
| Proline | 18.69 | 3.17E-04 | 22.10 | 0.10 | 1.01 |
| Glycine | 16.32 | 3.08E-04 | 26.20 | 0.07 | 1.90 |
| Alanine | 15.82 | 3.10E-04 | 21.20 | 0.09 | 3.10 |
| Control | 12.2 | 2.29E-04 | 19.80 | 0 |
The SILCS-PPI protocol is designed to maximize the complementarity between the FragMaps from one protein and the PPGMaps from another protein. Both FragMaps and PPGMaps were pre-processed to reduce sampling noise. For the FragMaps, all voxels that are 5 Å away from the excluded area (i.e., protein interior) as defined by the SILCS Exclusion map were removed since those grids are influenced by bulk phase behavior and only add noise to the sampling. For the ligand PPGMaps, all voxels that are overlapping with the exclusion map were removed since they occupy the repulsive core of the protein and only PPGMaps that are accessible to the solvent or SILCS solute molecules are useful for protein-protein interaction determination.
The protein-protein docking was performed globally using an FFT-based algorithm.42 The receptor FragMaps and PPGMaps were fixed in space and the orientation of ligand FragMaps and PPGMaps were varied systematically over all possible orientations. For each orientation of the ligand protein, all possible translations of the ligand FragMaps and PPGMaps can be efficiently evaluated using FFT operations. The overlapped voxels from FragMaps and PPGMaps were multiplied and summed to yield the protein grid free energy (PGFE) score as previously described.42 Each docking calculation was performed with a 10˚ rotational angle interval on the 1 Å grid. The rotation angles were uniformly distributed to avoid the biases around the poles,43, 44 which resulted in 14,904 rotational angles. For each rotation angle, we stored the top 10 scoring solutions for further analysis, which resulted in 149,040 docked conformations. The details of the scoring function and FFT procedure can be found in ref.42.
PPI preference (PPIP) map was calculated using a clustering analysis. Clustering analysis was performed on the total 149,040 docked poses. Due to the large number of poses, it is computationally untenable to use RMSD based clustering algorithm. Instead, the center of mass (i.e., x, y, and z position) and the orientation (i.e., Euler angles) of poses were used to compute the distance between the pose conformations. Two-step clustering was performed where the clusters are identified using the center of mass of the poses alone followed by another clustering analysis using the three Euler angles of poses that belong to the same cluster. The distance in angular space was measured by , where α, β, and γ represent the three Euler angles. Cluster cutoffs of 10 Å and 0.5 (approximately 30˚) were used for the center of mass and the Euler angles, respectively. In the case of the NISTmAb Fab, this procedure reduces the number of poses to 5,508. After the clustering, the per-residue PPI preference was computed as the number of contacts between the receptor and ligand atoms within a 5 Å cutoff and summed over all poses. The per-residue PPI preference value is then normalized by the maximum per-residue PPI preference value. This value is called the PPI preference (PPIP) score and higher values suggests that a residue is more likely involved in a protein-protein interaction.
Excipient Docking and Screening
Excipient docking and screening is initiated with a docking algorithm, namely SILCS-MC, which involves Monte-Carlo (MC) sampling of ligands in the field of the FragMaps for scoring.23 Briefly, the SILCS-MC algorithm involves Monte-Carlo (MC) sampling of the ligand in translational, rotational and torsional space in the field of FragMaps. The energy of a ligand conformation is evaluated by the combination of CGenFF intramolecular energies and ligand grid free energy (LGFE) score, which is the sum of atomic GFEs, as previously described.23, 30 The atomic GFE for each ligand atom is assigned by the FragMap voxel that the atom occupies. The protein structure is not explicitly included, but the Exclusion map prevents the ligand from sampling the region where no solute or water molecules visited during the SILCS simulations, i.e., the interior of the protein. This allows for rapid docking of the ligand while accounting for protein flexibility in a mean-field fashion as that information is embedded in the FragMaps and the Exclusion map. LGFEs, which represents the predicted approximate free energy of binding of the excipients, have been shown to correlate well with the binding affinities of small, drug-like molecules to a range of proteins.30
To identify preferential binding of excipients on the protein surface, SILCS-Hotspots approach was used. In SILCS-Hotspots, the SILCS-MC method is extended to identify binding “hotspots” of a small molecule across the whole protein surface.31 The detailed method and the validation of the method has been described previously.31 Briefly, the entire FragMap space was divided into 14.14 Å3 boxes. The box size is determined to be slightly larger than the SILCS-MC sampling region, which is a 10 Å radius sphere. In each box, the SILCS-MC sampling was performed for each excipient by randomly positioning it within the sphere of radius 10 Å centered at the middle of the sampling box. The excipient was then subjected to 10,000 MC steps at 300 K. During this phase of sampling, the molecular translations, orientation, and the torsion angle of an internal rotatable bond could change up to 1 Å, 180˚, and 180˚, respectively. This was followed by 40,000 MC simulated annealing phase where the temperature of the system was gradually reduced from 300 K to 0 K. During the annealing phase, the molecular translations, orientation, and the torsion angle of an internal rotatable bond could change up to 0.2 Å, 9˚, and 9˚, respectively. This process was repeated 1,000 times for each excipient in each sampling box. The results from each individual sampling box were pooled together and clustering analysis performed.
To identify excipient binding “hotspots”, a center-of-mass based clustering analysis was performed with a simple clustering algorithm45 where the conformer with the largest number of neighbors is identified as the cluster center, and its members were removed from the pool of conformations. We used adaptive clustering radius based on the molecular extent because different excipient molecules have different size. This process was repeated until no additional conformers remain. Once the cluster centroids for each excipient are identified, a second round of clustering was performed to identify the sites populated by different excipients. This was achieved by using the same clustering algorithm and a radius of 4 Å from which binding sites were identified that contain one or more members from the collection of excipients under study, e.g., the binding sites where one or more types of excipient bind. The LGFE scores of each of the excipients in each site are then averaged with the sites are ranked based on the average LGFE scores. It should be noted that the site identification and the excipients included in each site is sensitive to the two clustering radii.
Combining protein-protein interaction preference maps and protein-excipient docking
SILCS-Biologics combines the PPIP and protein-excipient information as previously described (Somani et al., submitted for publication). A total of 20 common excipient molecules ranging from amino acids to sugars were prepared and used in protein-excipient docking. The complete list of excipients is acetate, alanine, arginine, aspartic acid, citric acid, glucose, glutamic acid, glycine, histidine, lactate, lysine, malate, mannitol, phosphate, proline, sorbitol, succinate, sucrose, threonine, trehalose, and valine. The protonation states of the excipient molecules are considered at pH 6. The protonation state was chosen to match the experimental condition. Docking of each excipient is performed as described in the previous section. Using the excipient binding site, a number of features associated with the antibody self PPIP and antibody-excipient interaction screening were extracted. For example, “total number of binding sites having LE < −0.25” is the number of binding poses per excipient having ligand efficiency (LE; LE = LGFE / [# of non-hydrogen atoms]) less than −0.25 kcal/mol, hence suggesting the number of binding poses that have relatively strong binding affinity.
Experiments on the NISTmAb
Experiments and associated data on NISTmAb were previously presented,46 with just a brief summary here. Experiments were performed at pH 6 in the presence of 25 mM Histidine with excipient concentrations of 171 mM (Arg), 200 mM (Pro, Gly and Ala), 237 mM (mannitol) and 300 mM (sucrose, trehalose and glucose). The unit M stands for molar concentration of mol/L, while mM stands for concentration of 10−3 mol/L. A series of NISTmAb solutions varying in mAb concentration were prepared for each excipient condition: the kD and B22 results were measured from dilute mAb solutions (less than 20 mg/mL), S(0)exp values were measured from highest examined mAb concentrations (from 130 to 170 mg/mL), whereas the viscosity data was all obtained at 170 mg/mL. The viscosity of the Histidine control was 12.2 cp. For more detailed list of the experimental conditions, see Table 1 of Ref.46.
Results
Antibody Fab domain self-interaction PPI preference maps
The SILCS-PPI protein-protein docking algorithm was used to examine the self-interaction preference of the Fab domain of the NISTmAb. While we have only used the Fab domain to reduce the computational cost, poses that would have been sterically inaccessible in full-length IgG1 antibody have been excluded. To filter those poses, full-length IgG1 antibody structure (PDB:1HZH) is overlaid on the receptor Fab pose (see Figure S1), and any poses in which the ligand Fab has a steric clash (having more than 2 ligands atoms within 5 Å of any full-length receptor atoms) with the second Fab in the IgG1 antibody are discarded. This is justified because the individual Fab and Fc domains are relatively rigid, while the relative orientation of Fab with respect to Fc as well as the second Fab varies significantly due to the flexible linkers. It is possible that the Fc domain may affect the FragMap densities by domain-domain interactions, particularly near the hinge region.32, 47 However, we expect such an effect will be limited to the Fab-Fc domain interface and the FragMap densities near the elbow or CDR will not be affected. By focusing on the domain-domain interaction while not considering the domain relative orientations, we can efficiently perform protein-protein docking as well as excipient hotspot mapping. In addition, the PPI and the excipient poses having steric clashes when overlaid with the full-length mAb (see Methods section for more detail) were rejected, thereby reflecting some influences from Fc domain on the SILCS metrics. This approach can be readily repeated over different full-length mAb conformations as more information about the orientation of Fab and Fc becomes available.
Figure 2 shows the self-interaction preference surface of the Fab domain of NISTmAb. The PPIP score is defined as the number of contacts per residue over the top 2,000 docked poses sorted by PGFE score. 5 Å was used as the cutoff distance for contact between any ligand and receptor non-hydrogen atoms. The number of contacts per residue is then normalized by the maximum number of contacts, resulting in interaction preference score having values from 0 to 1. Interestingly, the NISTmAb does not show a strong interaction preference in the complementary-determining region (CDR) region. The regions having the strongest PPIP are around the CDR on the sides of the Fab. This low interaction preference in the CDR is consistent with the experimental data showing this antibody to have low viscosity at high concentrations.46 The PPIP self-interaction information can be used to introduce mutations to the antibody sequence to enhance the stability of antibody.
Figure 2.
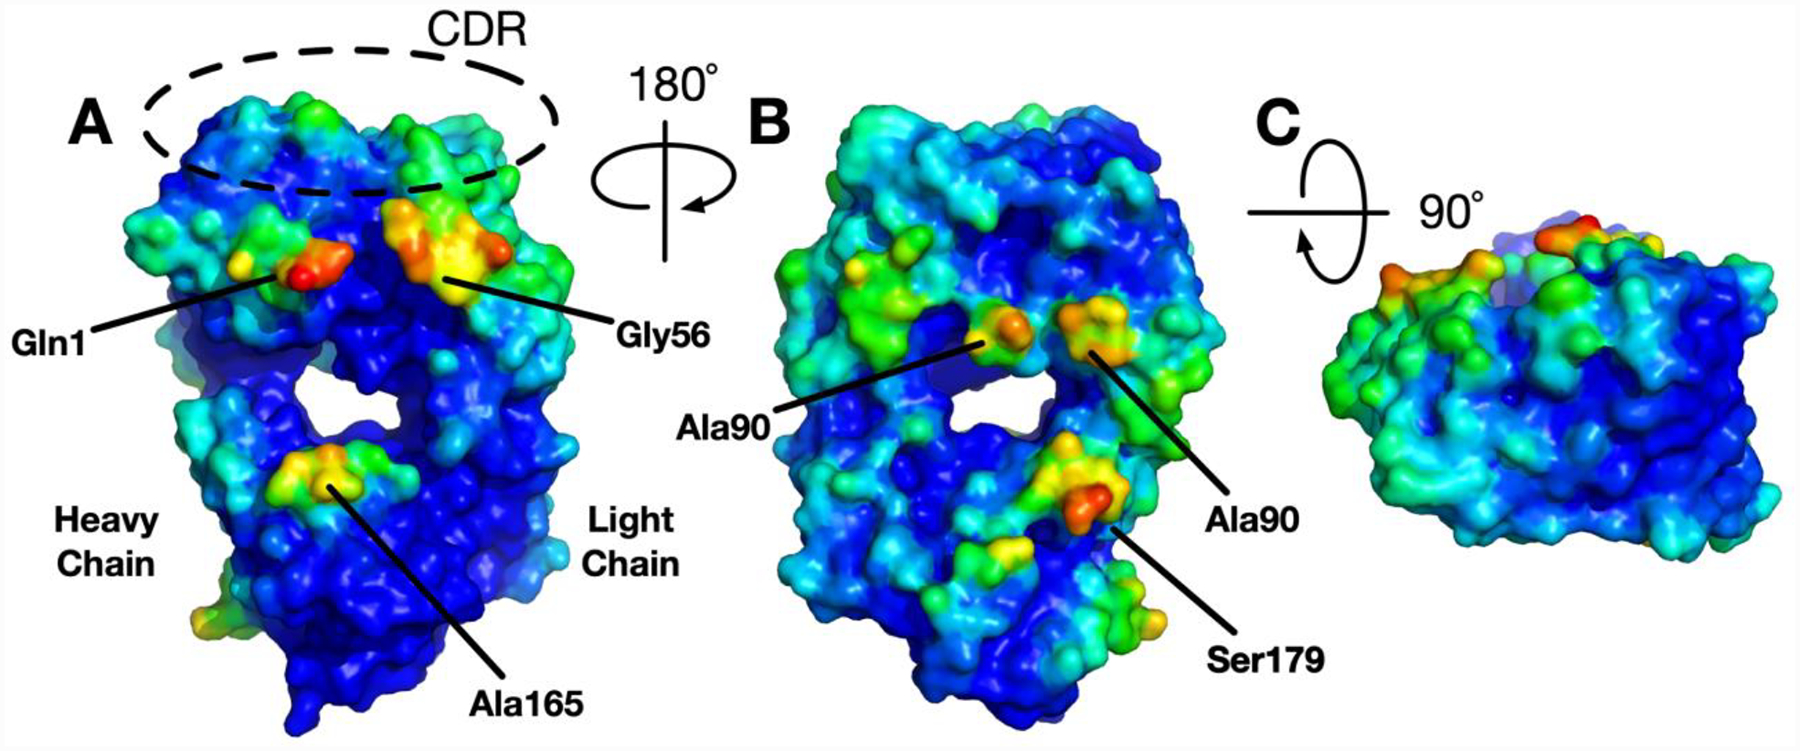
NISTmAb Fab domain self-interaction preference surface. The interaction PPIP score is scaled to 0 (lower) to 1 (higher) and the color is assigned blue to red, respectively.
We compare the protein self-interaction patterns of NISTmAb with CNTO607, an antibody which shows a high propensity of aggregation and with a well characterized mechanism of aggregation.34, 48 CNTO607 mAb irreversibly precipitates at roughly 13 mg/mol, much lower than typical target concentration of therapeutic antibody formulations.48 Figure 3 shows the self-interaction preference surface of antibody CNTO607 Fab domain computed with the same procedure as NISTmAb Fab domain. The CDR of CNTO607 shows much stronger preferences for self-interaction compared to the Fab domain of NISTmAb, where almost no residues in the CDR loops have significant self-interaction PPIP values. The SILCS-PPI simulations highlight the hydrophobic hotspot triad of 103FHW105 (same as F99, H100 and W100a in Ref.48) in the heavy chain CDR3 which was identified to be responsible for aggregation based on X-ray crystallography and biophysical characterization of mutant proteins.34 PPIP values for the F103, H104 and W105 were 0.91, 0.50 and 1.0, respectively, where 1.0 represents the maximum on the PPIP scale. Figure S2 shows the PPIP values of CNTO607 mapped on the solvent accessible surface and its amino acid sequence. In addition to the hydrophobic triad in the CDRs, the crystal structure of CNTO 607 Fab (PDB: 3G6A) showed salt bridge interactions between LC D49 and LC D50 (same as D50 and D51 of Ref.46) in the Fv domain of one molecule with heavy chain K210 and K215 of another molecule (Figure S2). Mutations of the lysine residues disrupting the salt bridge interactions were found to improve solubility as well as viscosity34 indicating that these residues are also involved in self-association. The residues involved in the salt bridge are highlighted by the SILCS-PPI simulations (PPIP values of K210, K215, D49 and D50 were 0.25, 0.13, 0.41 and 0.28, respectively). It should be noted that the self-interaction PPIP value, in the current form, is a relative quantity and the values from two different antibodies cannot be directly compared. Therefore, we cannot comment on whether one antibody is more prone to aggregation or not using just self-interaction preference. Nevertheless, if aggregation is observed, SILCS-PPI simulations can guide protein engineering efforts by identifying aggregation hotspot residues.
Figure 3.
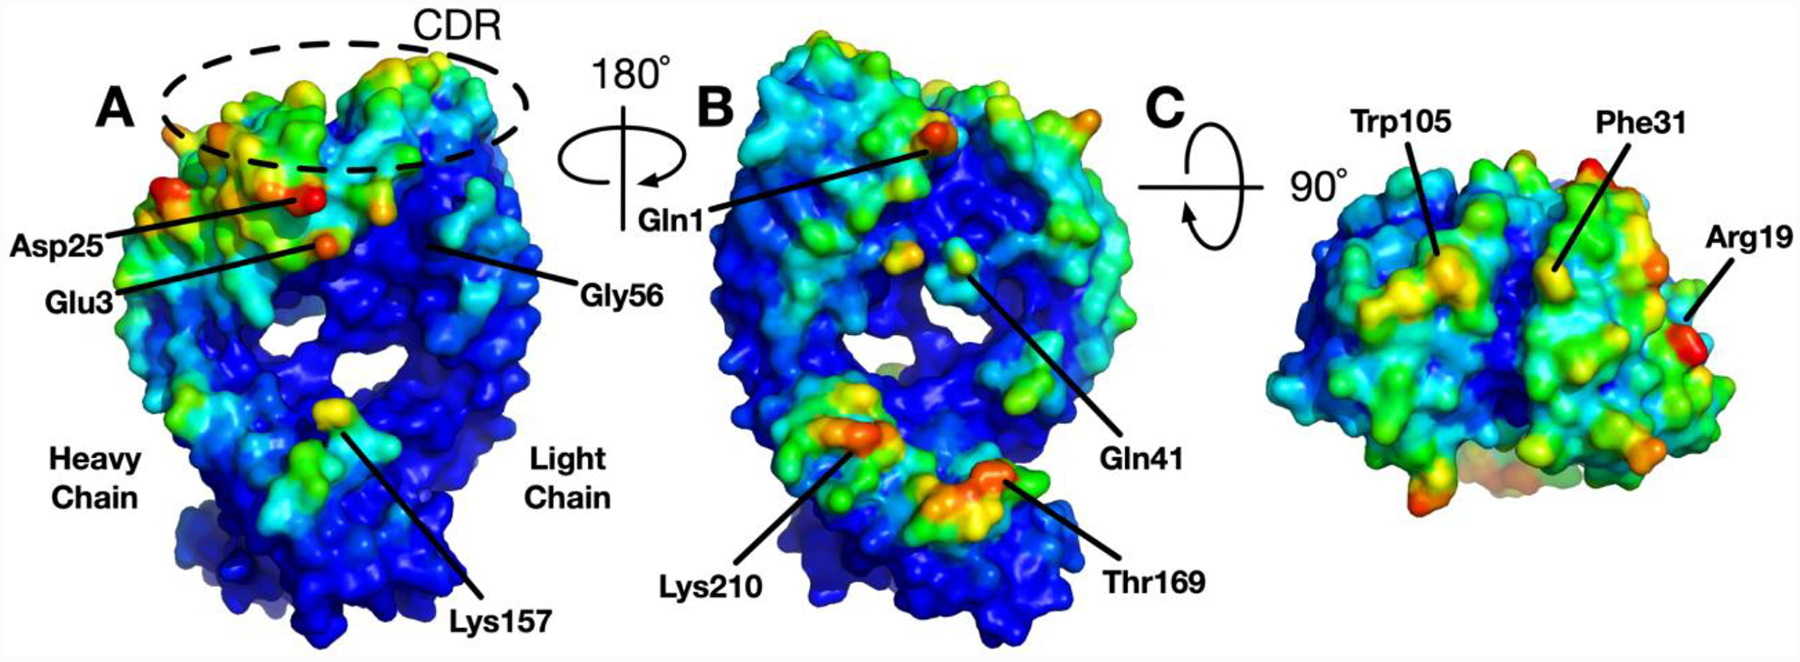
Antibody CNTO607 Fab domain self-interaction preference surface. The interaction PPIP score is scaled to 0 (lower) to 1 (higher) and the color is assigned blue to red, respectively.
Excipient-Fab domain interaction analysis
To investigate the excipient-protein interactions, a total of 20 commonly used excipients, such as amino acids and sugars, were selected and used in an excipient-Fab domain interaction analysis. For each excipient, global docking was performed, and the resulting poses were pooled together for clustering analysis, which resulted in the identification of multiple binding sites for each excipient. The cluster centroid positions of each excipient were clustered again to identify “hotspots” on the protein that are favored by one or more excipients. Similar analysis has been performed in protein-fragment interactions.31 Figure 4 shows an example of hotspots of arginine (Arg) and lysine (Lys) given the energetic threshold of LE < −0.25 kcal/mol. We chose ligand efficiency (LE) for comparing energetics of different excipient because LE is independent of the size of the excipient molecules. Interestingly, Arg and Lys have quite similar chemical structure, but there are differences in the pattern of binding between the two excipients. We hypothesize that the difference is due to the bulkier guanidinium group on Arg, preventing Arg from fitting in a smaller pocket compared to Lys.
Figure 4.
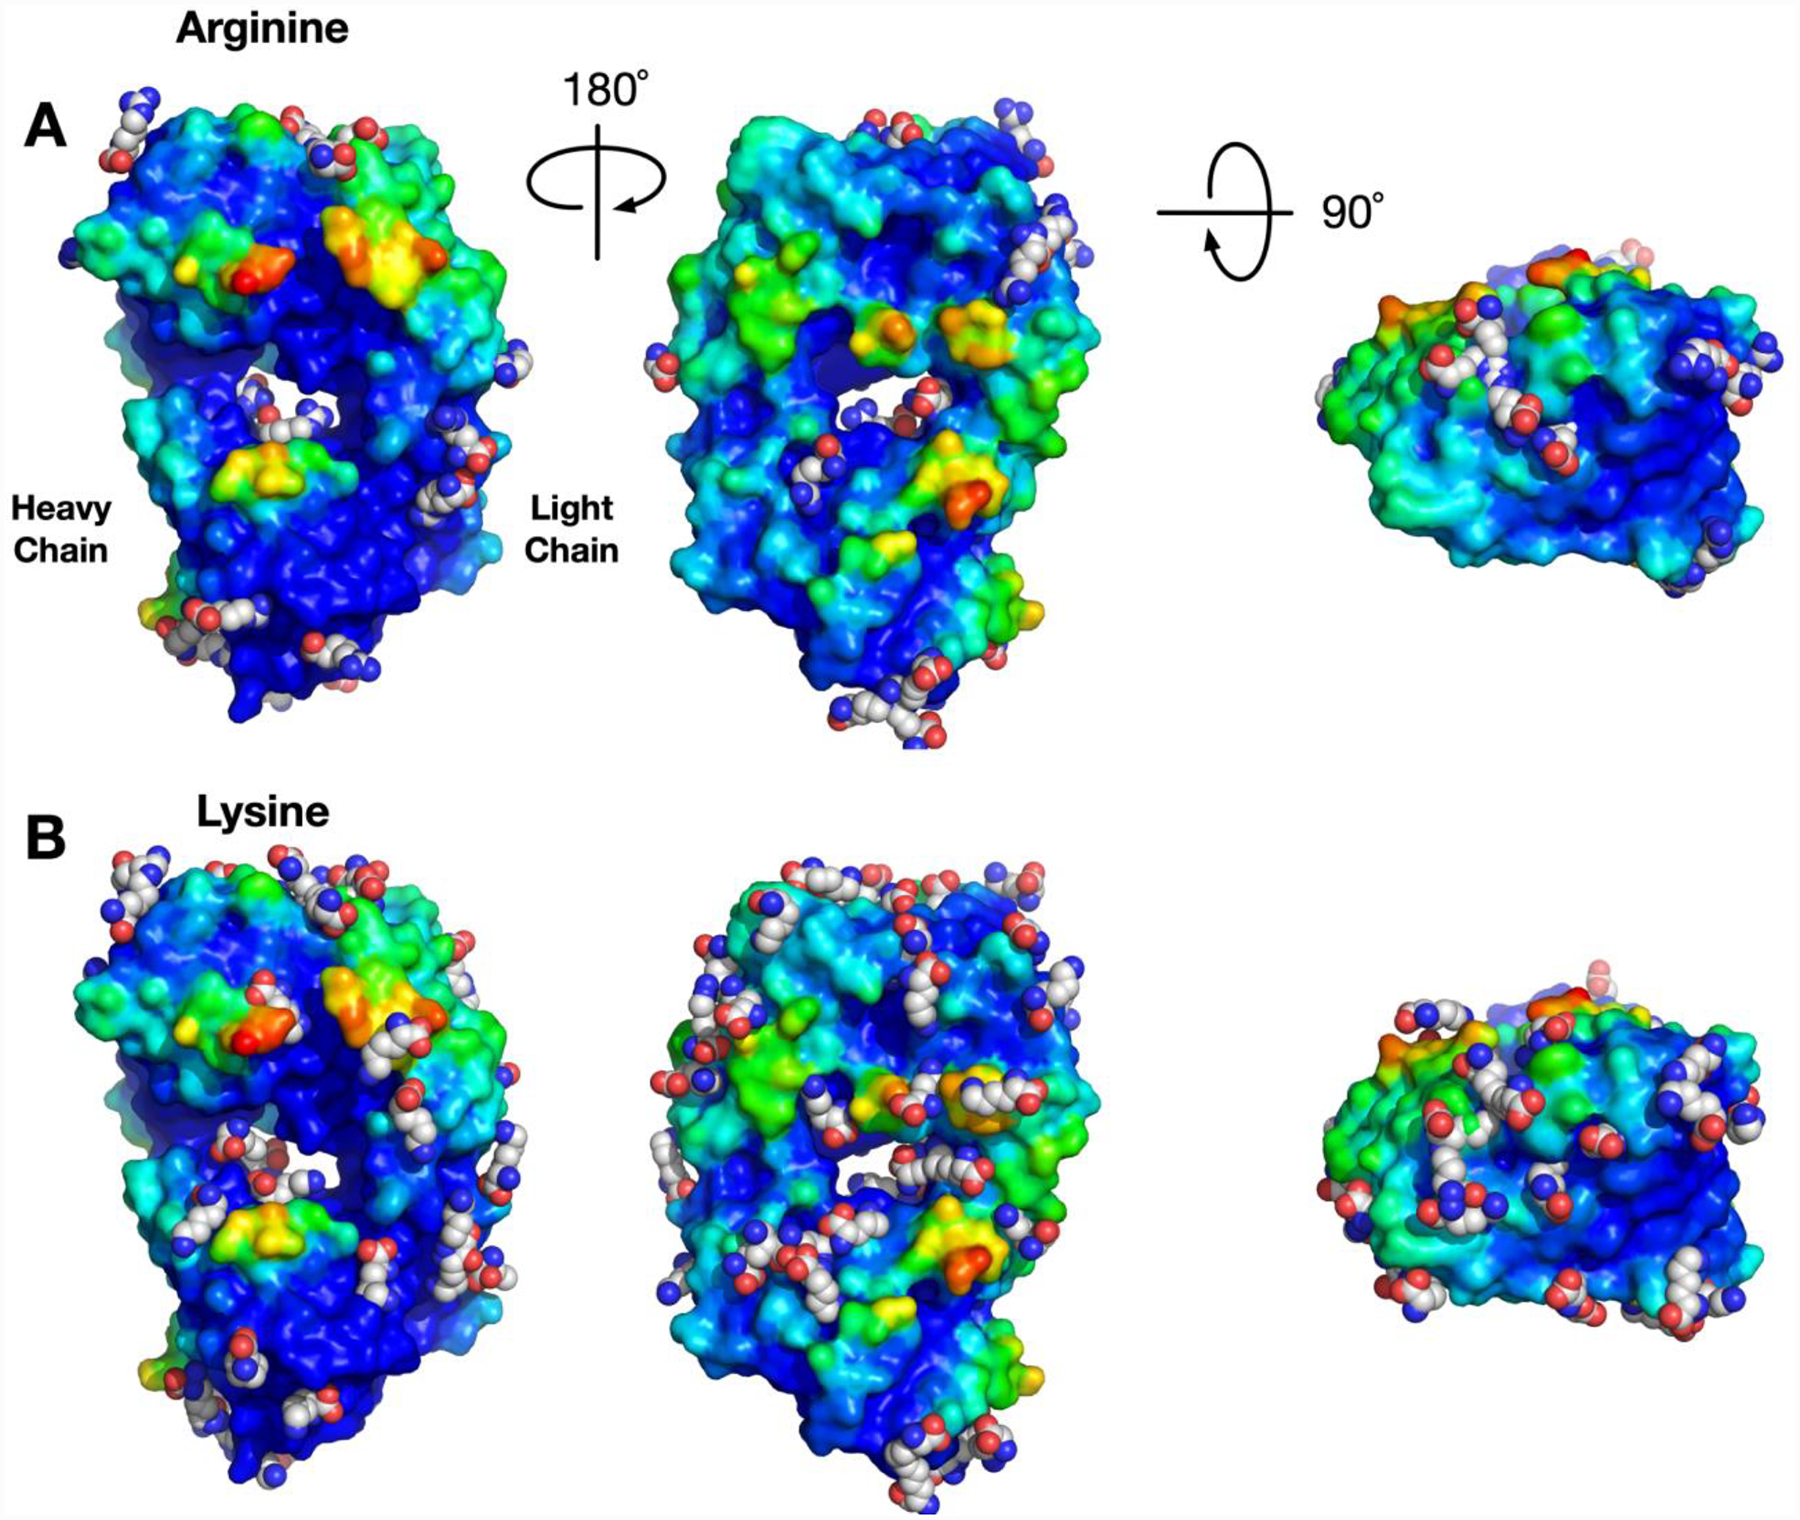
Excipient-NISTmAb Fab domain interaction hotspots of Arg and Lys having LE < −0.25 kcal/mol. The surface of NISTmAb Fab domain is colored using the Fab self-interaction preference score.
The information from the clustering approach with the excipients can be useful for understanding differential behavior of excipients or the competition between excipients and buffers for a given binding site. For example, the use of Lys or Arg as an excipient may lead to different outcomes during formulation, and it is not easy to rationalize the observation. In the NISTmAb Fab example, we found that all Arg binding sites are also occupied by Lys given the energetic threshold, while there are additional sites to which only Lys binds. Figure S3 shows the binding sites for Lys that do not also bind Arg. Moreover, Lys binds to more regions of the protein predicted to be prone to self-interaction. From this observation, we hypothesized that properties based on two metrics, such as total number of binding sites above a certain energetic threshold, could be used to correlate how well certain excipients “coat” the protein surface and impact aggregation and viscosity.
Correlation analysis with experimental viscosity
Beyond visual inspection, quantitative metrics of excipient-protein interactions can be examined. Table 2 shows a selected set of individual and combined metrics of various excipients from SILCS-Biologics. Only data for the subset of excipients that were included in the experimental measurements are presented here. See Table S1 with the complete list of excipients. The metrics include the number of binding sites to which each excipient binds based on either a −1 kcal/mol LGFE or −0.25 LE kcal/mol cutoff, the relative affinity analysis (RAA), which is the number of binding sites with a relative affinity within a factor of 1000 of the most favorable LGFE score for a given excipient, the number of binding sites with average PPIP score for residues within 5 Å of the excipient greater than 0.1, a combination of the number of binding sites based on LE and PPIP and the average LGFE and LE of the top 10 scoring poses of each excipient. Analysis of the values in Table 1 shows significant differences in all the properties between the excipients. For example, Arg binds to a substantially lower number of sites based on LGFE, LE and PPIP as compared to the other amino acids, with the number of sites similar to that of the some of the sugars. The predicted binding affinity shows sucrose and trehalose to be the most favorable, though taking into account the size of the molecules leads to them having the least favorable LE scores.
Table 2.
Selected SILCS-Biologics combined properties describing protein-excipient interactions for the NISTmAb Fab domain. LGFE and LE are in kcal/mol.
| Excipient | # Binding Site (LGFE < −1) | # Binding Site (LE < −0.25) | # Binding Site (RAA < 1000) | # Binding Site (PPIP > 0.10) | # Binding Site (LE < −0.25 and PE > 0.10) | Ave LGFE | Ave LE |
|---|---|---|---|---|---|---|---|
| Arginine | 62 | 26 | 13 | 18 | 8 | −4.57 | −0.38 |
| Trehalose | 49 | 14 | 17 | 14 | 2 | −7.35 | −0.32 |
| Sucrose | 50 | 18 | 14 | 14 | 5 | −7.29 | −0.32 |
| Glucose | 94 | 61 | 51 | 22 | 13 | −5.45 | −0.46 |
| Mannitol | 70 | 42 | 26 | 19 | 11 | −5.92 | −0.49 |
| Proline | 131 | 66 | 86 | 36 | 14 | −3.63 | −0.46 |
| Glycine | 105 | 84 | 105 | 24 | 18 | −2.88 | −0.58 |
| Alanine | 137 | 91 | 137 | 35 | 20 | −3.18 | −0.53 |
To understand the relationship of the SILCS-Biologics properties to the experimental observables, simple correlation analysis was performed on the metrics in Table 2 with the experimental data for the viscosity, the second virial coefficient of the Debye plot (B22), diffusion interaction parameter (kD), and the structure factor (S(0)exp) (Table 3). Notably, the correlations with the viscosity are quite high for many of the SILCS metrics. With metrics related to the number of binding sites occupied there are systematically negative correlations, indicating that occupation of a larger number of binding sites is associated with lower viscosity. Reasonable correlations are also obtained with the LGFE and LE metrics averaged over the 10 most favorable binding poses. Interestingly, the viscosity is larger with more favorable LGFE values associated with the negative correlation, but the opposite occurs with LE with good correlations being obtained in both cases. Overall, the systematically strong correlations observed between viscosity and the various SILCS metrics indicates their potential utility for excipient selection.
Table 3.
Correlation analysis between selected SILCS-Biologics combined properties describing protein-excipient interactions for the NISTmAb Fab domain and experimental data from reference46 (Table 1).
| # Binding Site (LGFE < −1) | # Binding Site (LE < −0.25) | # Binding Site (RAA < 1000) | # Binding Site (PPIP > 0.10) | # Binding Site (LE < −0.25 and PPIP > 0.10) | Ave LGFE | Ave LE | ||
|---|---|---|---|---|---|---|---|---|
| Viscosity | R | −0.83 | −0.90 | −0.90 | −0.74 | −0.85 | −0.65 | 0.83 |
| R2 | 0.69 | 0.82 | 0.81 | 0.55 | 0.72 | 0.42 | 0.68 | |
| B22 | R | 0.16 | 0.18 | 0.24 | 0.10 | 0.07 | −0.25 | −0.06 |
| R2 | 0.02 | 0.03 | 0.06 | 0.01 | 0.00 | 0.06 | 0.00 | |
| kD | R | 0.34 | 0.43 | 0.41 | 0.24 | 0.33 | 0.01 | −0.41 |
| R2 | 0.11 | 0.18 | 0.17 | 0.06 | 0.11 | 0.00 | 0.17 | |
| S(0)exp | R | −0.50 | −0.57 | −0.57 | −0.40 | 0.52 | −0.17 | 0.47 |
| R2 | 0.25 | 0.33 | 0.33 | 0.16 | 0.27 | 0.03 | 0.22 | |
| Without Arg | # Binding Site (LGFE < −1 kcal/mol) | # Binding Site (LE < −0.25) | # Binding Site (RAA < 1000) | # Binding Site (PE > 0.10) | # Binding Site (LE < −0.25 and PE > 0.10) | Ave LGFE | Ave LE | |
| Viscosity | R | −0.90 | −0.98 | −0.95 | −0.82 | −0.98 | −0.98 | 0.92 |
| R2 | 0.81 | 0.96 | 0.91 | 0.68 | 0.95 | 0.96 | 0.84 | |
| B22 | R | −0.49 | −0.57 | −0.44 | −0.44 | −0.55 | −0.54 | 0.72 |
| R2 | 0.24 | 0.32 | 0.19 | 0.19 | 0.30 | 0.29 | 0.52 | |
| kD | R | 0.25 | 0.51 | 0.28 | 0.11 | −0.48 | 0.51 | −0.77 |
| R2 | 0.06 | 0.26 | 0.08 | 0.01 | 0.23 | 0.26 | 0.59 | |
| S(0)exp | R | −0.70 | −0.82 | −0.73 | −0.57 | −0.83 | −0.79 | 0.71 |
| R2 | 0.49 | 0.68 | 0.53 | 0.33 | 0.68 | 0.63 | 0.50 |
The correlations between the SILCS metrics and B22, kD and S(0)exp are systematically lower than those with the viscosity (Table 3). S(0)exp, obtained from a small angle scattering experiment, has been shown to be of utility to study protein stability in dilute solutions as well as high concentrations.46 This is consistent with the R2 value of S(0)exp with viscosity, R2 = 0.68, being higher than with either kD and B22,. Lower correlations are obtained for B22 and kD with viscosity, R2 = 0.55 and 0.29, respectively. Although, B22 and kD have been widely used in low concentrations experiment as an indicator of viscosity at higher concentrations typically used in formulations, the behavior of proteins in dilute solution and in concentrated formulation may be significantly different due to crowding effect and predictions made in dilute solution may not be accurate.49–51 The lower correlation of SILCS metrics with these biophysical measurements than the viscosity suggests the usefulness of SILCS metrics in predicting viscosity at high concentrations. The lower correlation with the biophysical measurements also appears to be in part due to the behavior of Arg and that data in conjunction with the SILCS metrics may be used to obtain a molecular model leading to the changes in viscosity, as discussed below.
Shown in Figure 5 is the experimental viscosity versus “# of binding sites with LE < −0.25” or “# of binding sites with PPIP > 0.1.” The strength of the correlations is obvious as is the presence of Arg as an outlier. With Arg as an excipient the experimental viscosity is 29.1 cp significantly higher than that in the presence of the remaining excipients, though it should be noted that the viscosity in the presence of all the excipients is higher than that of the Histidine (His) control value of 12.2 cp. To evaluate the impact of Arg on the predictability of the SILCS metrics the correlation analysis was repeated in its absence, with the results presented in the lower portion of Table 3. The omission of Arg leads to improved correlations in all cases, with the improvements greatest with B22 followed by S(0)exp and then kD.
Figure 5.
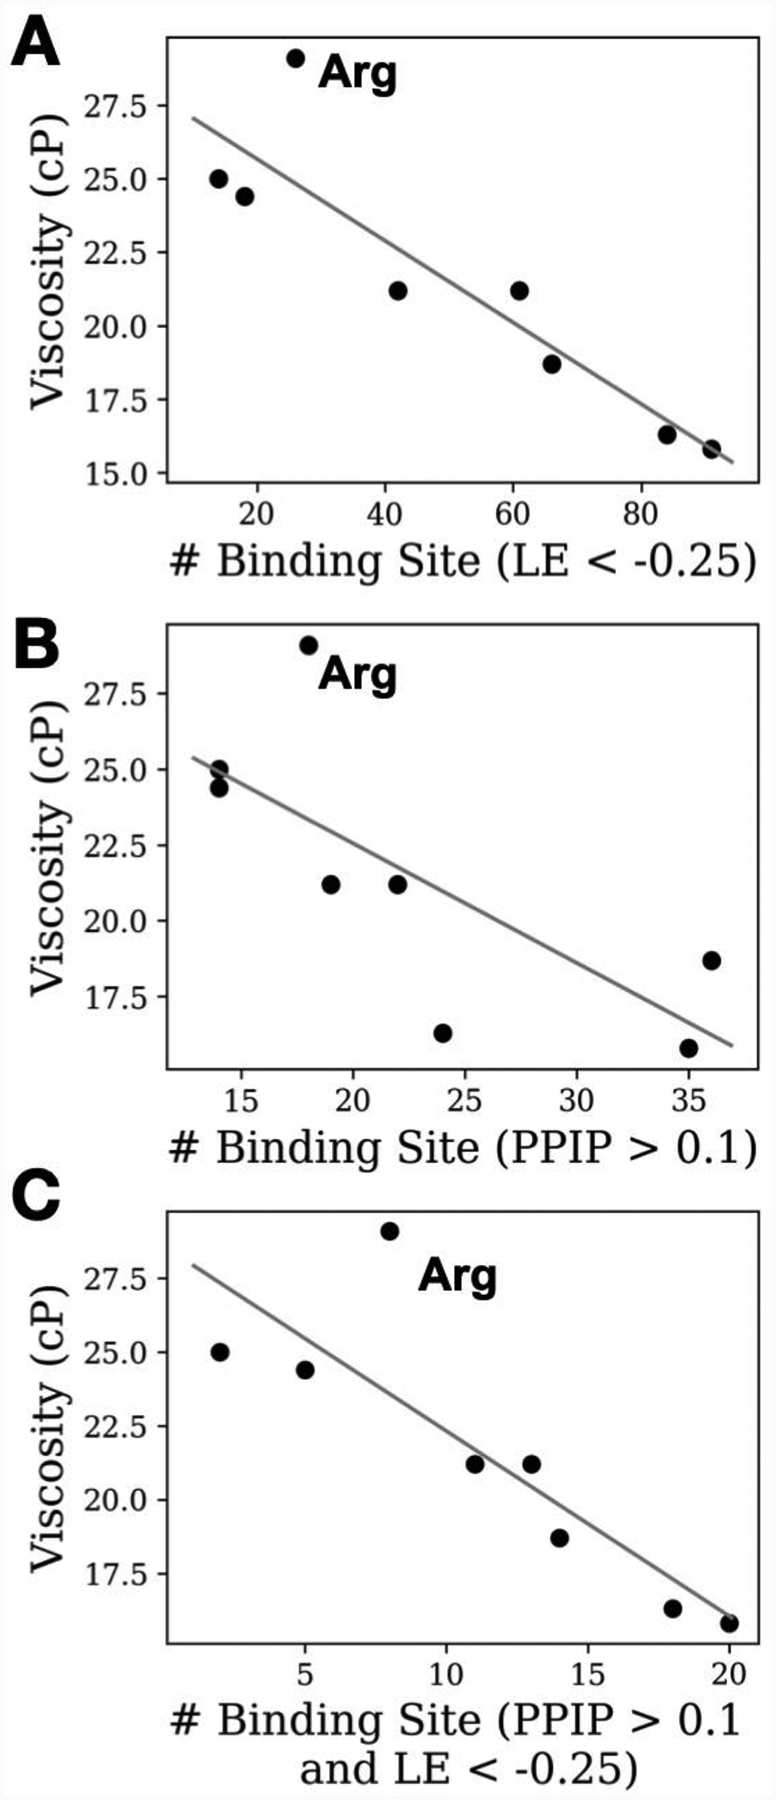
Correlation between the number of binding sites with A) favorable binding affinity, B) with high PPI preference (PPIP), and C) both favorable binding affinity and high PPIP value. The solid line is the best-fit curve using linear regression. The excipient Arg data points are indicated as they are an outlier and the data for the plots are shown in Tables 1 and 2.
Analysis of the SILCS metrics in Table 2 for the excipients allows for identification of potential indicators that may be used to flag this behavior a priori. With respect to the other experimentally studied amino acids, the differences with Arg are readily evident. The various number of binding sites occupied metrics are all significantly lower than the other amino acids while the LE is less favorable. When all the amino acids are considered (Table S1), Arg still has the lowest number of binding sites based on LGFE and PPI metrics with Lys or His having the lowest values in the other SILCS metrics related to the number of binding sites. However, when the average over all 5 categories is taken, Arg yields a value of 25 versus 38 and 40 for Lys and His, respectively (Table S2). With respect to all the excipients, sucrose and trehalose typically have low values for the various number of binding site metrics. Notably, Arg, sucrose and trehalose yield the highest viscosities observed in the experimental study (Table 1), indicating the potential predictive utility of this class of SILCS metrics. His alone yields the lowest viscosity, but this is only at 25 mM compared to the 171 to 300 mM concentrations of the other excipients in addition to His.
Tonset, the temperature at which significant changes in heat capacity are first observed, is an indicator of relative protein stability. In Table 4 the correlation between the SILCS-Biologics metrics and ΔTonset (changes in Tonset values with the presence of various excipients as compared to the His control) is presented. In general, the correlations are low with the omission of Arg not leading to any systematic improvements. Analysis of the experimental data (Table 1) shows Arg to have a very small ΔTonset relative to the other studied amino acids. Thus, while the SILCS metrics are individually not correlative with ΔTonset for NISTmAb, in the context of the amino acids, the low number of binding sites for Arg suggests that these metrics may be representative of the impact of excipients on stability. Building on this, when multiple regression analysis is performed against the number of binding sites based on the LGFE < −1.0 kcal/mol and the average LGFE score a R2 values of 0.38 is obtained with respect to ΔTonset. The coefficients for the terms are 0.04 and −0.79, respectively, indicating that as the number of binding sites and the average LGFE becomes more favorable, the ΔTonset increases associated with increased stability of the protein. While the validity of performing multiple regression analysis with such a small number data points is a concern, the result along with the physically intuitive model that increased interactions will lead to stabilization, do suggest the potential utility of the SILCS metrics for predicting the impact of excipients on protein stability. It should be noted that the ΔTonset will be affected by the domain that undergoes thermal melting, but the order of melting is ambiguous,46 while the SILCS metrics are derived from the Fab domain-excipient interactions.
Table 4.
Correlation analysis between selected SILCS-Biologics metrics describing protein-excipient interactions for the NISTmAb Fab domain and experimental ΔTonset from the Table 1 of Ref.46.
| ΔTonset | # Binding Site (LGFE < −1 kcal/mol) | # Binding Site (LE < −0.25) | # Binding Site (RAA < 1000) | # Binding Site (PE > 0.10) | # Binding Site (LE < −0.25 and PE > 0.10) | Ave LGFE | Ave LE |
|---|---|---|---|---|---|---|---|
| R | 0.09 | 0.24 | 0.18 | −0.02 | 0.21 | −0.24 | −0.19 |
| R2 | 0.01 | 0.06 | 0.03 | 0.00 | 0.04 | 0.06 | 0.04 |
| Without Arg | |||||||
| R | −0.18 | 0.00 | −0.12 | −0.26 | 0.08 | −0.24 | −0.02 |
| R2 | 0.03 | 0.00 | 0.01 | 0.07 | 0.01 | 0.06 | 0.00 |
Molecular mechanism of excipient action
To obtain insights into the molecular mechanism of excipient action analysis of B22 and kD was undertaken given the reasonable correlation of these terms in the absence of Arg. Both B22 and kD terms are predictive of non-specific PPI, e.g., positive B22 and kD values are associated with reduced PPI, so they have been used to predict viscosity of protein formulation.52 B22 is measured via light scattering and, as such, includes information on direct PPI interactions while kD, being determined from the diffusion constant includes both thermodynamic (direct PPI) and hydrodynamic (frictional) contributions. Both kD and B22 are typically measured in a dilute solution and the behavior of proteins in dilute solution versus in a concentrated formulation may be significantly different due to crowding effects, such that predictions made in dilute solution may not extrapolate to higher concentations.49–51 However, the differential information content in these experimental observables allows for them to be of utility to understand details of the impact of excipients on the viscosity in conjunction with the SILCS metrics.
B22 typically shows a negative correlation with the various number of binding site terms as well as the average LGFE (Figure S4 and S5). This indicates that as an excipient binds to more sites on the Fab, there is a decrease in B22 which would indicate an increase in attractive PPI interactions and, hence, increased viscosity. However, the variation of B22 across the excipients is small (Table 1) indicating minimal impact of the excipients on direct PPI at the concentrations studied. Notably, the outlier Arg has a B22 value nearly an order of magnitude lower that than that of the other excipients. This indicates that the low number of binding sites with Arg may contribute to a greater number of PPI. While sucrose and trehalose have similar trends for the number of binding sites, their more favorable LGFE scores suggest potentially longer resident times for these excipients that may offer additional inhibition of PPI leading to the larger B22 and smaller viscosity values.
kD showed the largest correlation with number of binding sites occupied based on LE (Figure S4 and S5) and combined LE and PPIP cutoffs with those correlations being lower than that with B22. Reasonable correlations were obtained with the average LGFE and LE terms. As with B22, the dependence of kD on the various binding site metrics was small though the relationship with average LGFE and LE was reversed with a more favorable LGFE leading to a lower kD. With kD the lowest positive values besides the outlier Arg occur with sucrose and trehalose in contrast to B22 where these have the largest positive values. This suggests that these sugars are blocking direct PPI, with the lower kD values relative to the other excipients, excluding Arg, likely being due to hydrodynamics effects. This leads to a model where the more favorable binding affinity of sucrose and trehalose can protect against PPI though they are binding to a relatively small number of sites on the Fab, with these sugars in solution leading to higher viscosity via hydrodynamic effects. While generally it is thought that greater excipient-protein interactions lead to lowered viscosity, the present results suggest that the binding affinity of the excipient could also plays a role in reducing viscosity. With Arg, the small B22 and negative kD suggest that the increased viscosity is due to the low number of binding sites that cannot be overcome by a more favorable binding affinity which would lead to the occurrence of additional PPI and increased viscosity. The negative kD (vs. control = 19.8) for Arg may further indicate that hydrodynamic effects due to Arg in solution may further contribute to the increased viscosity. Interestingly, recent studies indicate the possible formation of Arg clusters in solution, leading to clusters containing 8–10 molecules.53 Such a phenomena may contribute the increased viscosity of Arg seen with the NISTmAb.
Discussion
Here we apply SILCS-Biologics to both NISTmAb and CNTO607 mAb. The SILCS-Biologics workflow (Somani et al., submitted for publication) uses the SILCS technology to compute SILCS FragMaps with those FragMaps subsequently used in evaluation of the protein-protein self-interaction and protein-excipient interactions.31, 42 The protein-protein self-interaction patterns can provide insight on protein residues that are likely involved in self-interactions, which might be useful for designing a mutation that could lead to less aggregation and improve viscosity. The protein-excipient interaction analysis is used to investigate the excipients that could potentially reduce aggregation and improve viscosity by “coating” the protein surface. The SILCS FragMap simulation is the most computationally expensive step in the SILCS-Biologics workflow, which requires 10 GPU nodes with at least 4 CPUs per node for 3–4 days. However, the subsequent protein-protein interaction and protein-excipient interaction analyses steps do not require large compute resources, allowing screening of large number of excipients.
The present results may be interpreted in the context of the preferential interaction parameter, Γ23, a metric that indicates the excess number of excipient molecules interacting with the protein relative to being in solution.54, 55 A positive Γ23 indicates the excipient has a higher local concentration on the protein surface, an effect interpreted to lead to increased protein solubility as the potential PPI contact area is decreased due to the presence of the excipients on the protein surface. In the opposite case, with a negative Γ23 the concentration of the excipient at the protein surface is low relative to in solution, such that the protein is more favorably hydrated, leading to decreased protein solubility as more PPI interactions can occur. This behavior was observed with Arg and the relatively insoluble proteins human MAGOH, fragment 1–153 of murine Ref2–1 and WW domains 3 and 4 from Drosophilia Su(dx).56 However, subsequent studies on lysozyme and Arg indicate the reverse outcome where Γ23 was decreased.57 These examples highlight the challenge of protein formulation where observations and models developed for a given set of protein and conditions do not translate to different proteins. We hypothesize that this is due to local effects occurring on the protein surface, where the occupation of specific regions on the protein surface by particular excipients impacts the potential occurrence of PPI. Thus, it is essential to obtain a descriptor analogous to Γ23 that varies across the protein surface. The SILCS-Biologics methodology directly addresses this by allowing for the full distribution of excipient binding sites on the protein surface to be determined including the predicted binding affinities of the excipients for each site.
Notable is the high correlation of the SILCS-Biologics with the published experimental data. A general trend of an increased number of binding sites on the protein by an excipient leading to lower viscosity is observed indicating that increased coating of the protein surface does lead to a lower viscosity. However, based on the anomalous behavior of Arg along with the results in sucrose and trehalose the balance between the number of predicted binding sites and the predicted binding affinity, based on the average LGFE, further indicates a model where the lowered number of binding sites may partially overcome the higher binding affinity, minimizing an increase in viscosity. Finally, while the individual SILCS metrics did not show correlation with the experimental data on protein stability, the combination of the predicted total number of binding sites with LGFE < −1 kcal/mol combined with the predicted binding affinity based on the average LGFE does yield a reasonable correlation. Overall, these results indicate the potential utility of SILCS-Biologics for the rational prediction of excipients to both maintain lower viscosity and improve protein stability during the formulation process.
The current SILCS-Biologics workflow has a few limitations. First, the SILCS simulations are performed by a fixed charge model where the charges are determined with a fixed pH condition. Given experimental formulations evaluate protein-excipients in a wide range of pH conditions, SILCS FragMap computed in a single protonation state is limiting. Approaches that can overcome the limitation of single protonation state are being explored. Secondly, the self-interaction PPIP score is expressed in relative terms, which makes it difficult to compare the magnitude of self-interaction preference from one protein to another. Finally, it needs to be emphasized that given the variability of the physical properties of antibodies the ability to extrapolate the present results from the NISTmAb to other mAb is likely limited. Further studies on a wider range of mAb on which extensive experimental evaluation has been undertaken is required. The data used in this work is available upon request.
Supplementary Material
Figure S1: Example of protein-protein docking pose filtering
Figure S2: CNTO607 surface and sequence colored by protein-protein interaction preference values
Figure S3: Lysine exclusive binding sites on the NIST Fab domain.
Figures S4 and S5: Correlation plots of SILCS metrics and experimental data.
Tables S1 and S2: Calculated and average SILCS metrics for the NIST Fab domain.
Acknowledgement
This work was supported by National Institutes of Health grant R43GM130198. The authors acknowledge computer time and resources from the Computer-Aided Drug Design (CADD) Center at the University of Maryland, Baltimore.
Footnotes
Conflict of Interest
ADM Jr is co-founder and Chief Scientific Officer of SilcsBio, LLC. SJ is an employee of SilcsBio LLC when the studies were performed.
Certain commercial equipment, instruments, or materials (or suppliers, or software, …) are identified in this paper to foster understanding. Such identification does not imply recommendation or endorsement by the National Institute of Standards and Technology, nor does it imply that the materials or equipment identified are necessarily the best available for the purpose.
References
- 1.Ecker DM; Jones SD; Levine HL, The therapeutic monoclonal antibody market. MAbs 2015, 7 (1), 9–14. [DOI] [PMC free article] [PubMed] [Google Scholar]
- 2.Kintzing JR; Filsinger Interrante MV; Cochran JR, Emerging Strategies for Developing Next-Generation Protein Therapeutics for Cancer Treatment. Trends in Pharmacological Sciences 2016, 37 (12), 993–1008. [DOI] [PMC free article] [PubMed] [Google Scholar]
- 3.Walsh G, Biopharmaceutical benchmarks 2010. Nat. Biotechnol 2010, 28 (9), 917–924. [DOI] [PubMed] [Google Scholar]
- 4.Mullard A, 2016 FDA drug approvals. Nat. Rev. Drug Discov 2017, 16 (2), 73–76. [DOI] [PubMed] [Google Scholar]
- 5.Mueller C; Altenburger U; Mohl S, Challenges for the pharmaceutical technical development of protein coformulations. J. Pharm. Pharmacol 2017, 70 (5), 666–674. [DOI] [PubMed] [Google Scholar]
- 6.Cauchy M; DAoust S; Dawson B; Rode H; Hefford MA, Thermal Stability: A Means to Assure Tertiary Structure in Therapeutic Proteins. Biologicals 2002, 30 (3), 175–185. [DOI] [PubMed] [Google Scholar]
- 7.Huus K; Havelund S; Olsen HB; van de Weert M; Frokjaer S, Thermal dissociation and unfolding of insulin. Biochemistry 2005, 44 (33), 11171–11177. [DOI] [PubMed] [Google Scholar]
- 8.Shire SJ, Formulation and manufacturability of biologics. Current Opinion in Biotechnology 2009, 20 (6), 708–714. [DOI] [PubMed] [Google Scholar]
- 9.Kamerzell TJ; Esfandiary R; Joshi SB; Middaugh CR; Volkin DB, Protein-excipient interactions: mechanisms and biophysical characterization applied to protein formulation development. Adv. Drug Deliv. Rev 2011, 63 (13), 1118–1159. [DOI] [PubMed] [Google Scholar]
- 10.Roberts CJ, Therapeutic protein aggregation: mechanisms, design, and control. Trends Biotech. 2014, 32 (7), 372–380. [DOI] [PMC free article] [PubMed] [Google Scholar]
- 11.Roberts CJ; Das TK; Sahin E, Predicting solution aggregation rates for therapeutic proteins: approaches and challenges. Int J Pharm 2011, 418 (2), 318–333. [DOI] [PubMed] [Google Scholar]
- 12.Agrawal NJ; Kumar S; Wang X; Helk B; Singh SK; Trout BL, Aggregation in Protein-Based Biotherapeutics: Computational Studies and Tools to Identify Aggregation-Prone Regions. J Pharm Sci 2011, 100 (12), 5081–5095. [DOI] [PubMed] [Google Scholar]
- 13.Fernandez-Escamilla A-M; Rousseau F; Schymkowitz J; Serrano L, Prediction of sequence-dependent and mutational effects on the aggregation of peptides and proteins. Nat. Biotechnol 2004, 22 (10), 1302–1306. [DOI] [PubMed] [Google Scholar]
- 14.Tartaglia GG; Cavalli A; Pellarin R; Caflisch A, Prediction of aggregation rate and aggregation-prone segments in polypeptide sequences. Protein Sci. 2005, 14 (10), 2723–2734. [DOI] [PMC free article] [PubMed] [Google Scholar]
- 15.Tartaglia GG; Pawar AP; Campioni S; Dobson CM; Chiti F; Vendruscolo M, Prediction of aggregation-prone regions in structured proteins. J. Mol. Biol 2008, 380 (2), 425–436. [DOI] [PubMed] [Google Scholar]
- 16.Tartaglia GG; Vendruscolo M, The Zyggregator method for predicting protein aggregation propensities. Chem. Soc. Rev 2008, 37 (7), 1395–1401. [DOI] [PubMed] [Google Scholar]
- 17.Chennamsetty N; Voynov V; Kayser V; Helk B; Trout BL, Design of therapeutic proteins with enhanced stability. Proc. Natl. Acad. Sci. USA 2009, 106 (29), 11937–11942. [DOI] [PMC free article] [PubMed] [Google Scholar]
- 18.Agrawal NJ; Helk B; Kumar S; Mody N; Sathish HA; Samra HS; Buck PM; Li L; Trout BL, Computational tool for the early screening of monoclonal antibodies for their viscosities. MAbs 2016, 8 (1), 43–48. [DOI] [PMC free article] [PubMed] [Google Scholar]
- 19.Chennamsetty N; Voynov V; Kayser V; Helk B; Trout BL, Prediction of Aggregation Prone Regions of Therapeutic Proteins. J. Phys. Chem. B 2010, 114 (19), 6614–6624. [DOI] [PubMed] [Google Scholar]
- 20.Cloutier T; Sudrik C; Mody N; Sathish HA; Trout BL, Molecular Computations of Preferential Interaction Coefficients of IgG1 Monoclonal Antibodies with Sorbitol, Sucrose, and Trehalose and the Impact of These Excipients on Aggregation and Viscosity. Mol. Pharm 2019, 16 (8), 3657–3664. [DOI] [PubMed] [Google Scholar]
- 21.Cloutier TK; Sudrik C; Mody N; Sathish HA; Trout BL, Machine Learning Models of Antibody-Excipient Preferential Interactions for Use in Computational Formulation Design. Mol. Pharm 2020. [DOI] [PubMed] [Google Scholar]
- 22.Guvench O; MacKerell AD Jr, Computational Fragment-Based Binding Site Identification by Ligand Competitive Saturation. PLoS Comput. Biol 2009, 5 (7), e1000435–12. [DOI] [PMC free article] [PubMed] [Google Scholar]
- 23.Raman EP; Yu W; Lakkaraju SK; MacKerell AD Jr, Inclusion of multiple fragment types in the site identification by ligand competitive saturation (SILCS) approach. J. Chem. Inf. Model 2013, 53 (12), 3384–3398. [DOI] [PMC free article] [PubMed] [Google Scholar]
- 24.Lakkaraju SK; Raman EP; Yu W; MacKerell AD Jr, Sampling of Organic Solutes in Aqueous and Heterogeneous Environments Using Oscillating Excess Chemical Potentials in Grand Canonical-like Monte Carlo-Molecular Dynamics Simulations. J. Chem. Theory Comput 2014, 10 (6), 2281–2290. [DOI] [PMC free article] [PubMed] [Google Scholar]
- 25.Cao X; Yap JL; Newell-Rogers MK; Peddaboina C; Jiang W; Papaconstantinou HT; Jupitor D; Rai A; Jung K-Y; Tubin RP; Yu W; Vanommeslaeghe K; Wilder PT; MacKerell AD Jr; Fletcher S; Smythe RW, The novel BH3 α-helix mimetic JY-1–106 induces apoptosis in a subset of cancer cells (lung cancer, colon cancer and mesothelioma) by disrupting Bcl-xL and Mcl-1 protein-protein interactions with Bak. Mol. Cancer 2013, 12 (1), 42. [DOI] [PMC free article] [PubMed] [Google Scholar]
- 26.Cardenas MG; Yu W; Beguelin W; Teater MR; Geng H; Goldstein RL; Oswald E; Hatzi K; Yang S-N; Cohen J; Shaknovich R; Vanommeslaeghe K; Cheng H; Liang D; Cho HJ; Abbott J; Tam W; Du W; Leonard JP; Elemento O; Cerchietti L; Cierpicki T; Xue F; MacKerell AD Jr; Melnick AM, Rationally designed BCL6 inhibitors target activated B cell diffuse large B cell lymphoma. J. Clin. Invest 2016, 126 (9), 3351–3362. [DOI] [PMC free article] [PubMed] [Google Scholar]
- 27.Cheng H; Linhares BM; Yu W; Cardenas MG; Ai Y; Jiang W; Winkler A; Cohen S; Melnick A; MacKerell AD Jr; Cierpicki T; Xue F, Thiourea-Based Inhibitors of the B-Cell Lymphoma 6 (BCL6) BTB Domain via NMR- Based Fragment Screening and Computer-Aided Drug Design. 2018, 1–85. [DOI] [PMC free article] [PubMed] [Google Scholar]
- 28.Raman EP; Lakkaraju SK; Denny RA; MacKerell AD Jr, Estimation of relative free energies of binding using pre-computed ensembles based on the single-step free energy perturbation and the site-identification by Ligand competitive saturation approaches. J. Comput. Chem 2017, 38 (15), 1238–1251. [DOI] [PMC free article] [PubMed] [Google Scholar]
- 29.Yu W; Lakkaraju SK; Raman EP; Fang L; MacKerell AD Jr, Pharmacophore modeling using site-identification by ligand competitive saturation (SILCS) with multiple probe molecules. J. Chem. Inf. Model 2015, 55 (2), 407–420. [DOI] [PMC free article] [PubMed] [Google Scholar]
- 30.Ustach VD; Lakkaraju SK; Jo S; Yu W; Jiang W; MacKerell AD Jr, Optimization and Evaluation of Site-Identification by Ligand Competitive Saturation (SILCS) as a Tool for Target-Based Ligand Optimization. J. Chem. Inf. Model 2019. [DOI] [PMC free article] [PubMed] [Google Scholar]
- 31.MacKerell AD Jr; Jo S; Lakkaraju SK; Lind C; Yu W, Identification and characterization of fragment binding sites for allosteric ligand design using the site identification by ligand competitive saturation hotspots approach (SILCS-Hotspots). Biochim Biophys Acta Gen Subj 2020, 1864 (4), 129519. [DOI] [PMC free article] [PubMed] [Google Scholar]
- 32.Castellanos MM; Howell SC; Gallagher D; Curtis JE, Characterization of the NISTmAb Reference Material using Small-Angle Scattering and Molecular Simulation. Analytical and Bioanalytical Chemistry 2017, 1–29. [DOI] [PubMed] [Google Scholar]
- 33.Teplyakov A; Obmolova G; Wu S-J; Luo J; Kang J; O'Neil K; Gilliland GL, Epitope mapping of anti-interleukin-13 neutralizing antibody CNTO607. J. Mol. Biol 2009, 389 (1), 115–123. [DOI] [PubMed] [Google Scholar]
- 34.Bethea D; Wu S-J; Luo J; Hyun L; Lacy ER; Teplyakov A; Jacobs SA; O'Neil KT; Gilliland GL; Feng Y, Mechanisms of self-association of a human monoclonal antibody CNTO607. Protein Eng. Des. Sel 2012, 25 (10), 531–537. [DOI] [PubMed] [Google Scholar]
- 35.Abraham MJ; Murtola T; Schulz R; Páll S; Smith JC; Hess B; Lindahl E, GROMACS: High performance molecular simulations through multi-level parallelism from laptops to supercomputers. SoftwareX 2015, 1–2, 19–25. [Google Scholar]
- 36.Lakkaraju SK; Yu W; Raman EP; Hershfeld AV; Fang L; Deshpande DA; MacKerell AD Jr, Mapping functional group free energy patterns at protein occluded sites: nuclear receptors and G-protein coupled receptors. J. Chem. Inf. Model 2015, 55 (3), 700–708. [DOI] [PMC free article] [PubMed] [Google Scholar]
- 37.Best RB; Zhu X; Shim J; Lopes PEM; Mittal J; Feig M; MacKerell AD Jr, Optimization of the additive CHARMM all-atom protein force field targeting improved sampling of the backbone φ, ψ and side-chain χ(1) and χ(2) dihedral angles. J. Chem. Theory Comput 2012, 8 (9), 3257–3273. [DOI] [PMC free article] [PubMed] [Google Scholar]
- 38.Huang J; Rauscher S; Nawrocki G; Ran T; Feig M; de Groot BL; ller H. G. u.; MacKerell AD Jr, CHARMM36m: an improved force field for folded and intrinsically disordered proteins. Nat. Methods 2016, 14 (1), 1–6. [DOI] [PMC free article] [PubMed] [Google Scholar]
- 39.Vanommeslaeghe K; Hatcher E; Acharya C; Kundu S; Zhong S; Shim J; Darian E; Guvench O; Lopes P; Vorobyov I; MacKerell AD Jr, CHARMM general force field: A force field for drug-like molecules compatible with the CHARMM all-atom additive biological force fields. J. Comput. Chem 2010, 31 (4), 671–690. [DOI] [PMC free article] [PubMed] [Google Scholar]
- 40.Durell SR; Brooks BR; Ben-Naim A, Solvent-Induced Forces between Two Hydrophilic Groups. J. Phys. Chem 1994, 98, 2198–2202. [Google Scholar]
- 41.Raman EP; Yu W; Guvench O; MacKerell AD Jr, Reproducing crystal binding modes of ligand functional groups using Site-Identification by Ligand Competitive Saturation (SILCS) simulations. J. Chem. Inf. Model 2011, 51 (4), 877–896. [DOI] [PMC free article] [PubMed] [Google Scholar]
- 42.Yu W; Jo S; Lakkaraju SK; Weber DJ; MacKerell AD Jr, Exploring protein-protein interactions using the Site-Identification by Ligand Competitive Saturation (SILCS) methodology. Proteins 2018, 87 (4), 289–301. [DOI] [PMC free article] [PubMed] [Google Scholar]
- 43.Lovisolo L; da Silva EAB, Uniform distribution of points on a hyper-sphere with applications to vector bit-plane encoding. IEE Proceedings - Vision, Image and Signal Processing 2001, 148 (3), 187–193. [Google Scholar]
- 44.Solernou A; Fernandez-Recio J, Protein docking by Rotation-Based Uniform Sampling (RotBUS) with fast computing of intermolecular contact distance and residue desolvation. BMC Bioinformatics 2010, 11, 352. [DOI] [PMC free article] [PubMed] [Google Scholar]
- 45.Zhang Y; Skolnick J, SPICKER: A clustering approach to identify near-native protein folds. 2004, 25 (6), 865–871. [DOI] [PubMed] [Google Scholar]
- 46.Xu AY; Castellanos MM; Mattison K; Krueger S; Curtis JE, Studying Excipient Modulated Physical Stability and Viscosity of Monoclonal Antibody Formulations Using Small-Angle Scattering. Mol. Pharm 2019, 16 (10), 4319–4338. [DOI] [PubMed] [Google Scholar]
- 47.Koenig P; Lee CV; Walters BT; Janakiraman V; Stinson J; Patapoff TW; Fuh G, Mutational landscape of antibody variable domains reveals a switch modulating the interdomain conformational dynamics and antigen binding. Proc. Natl. Acad. Sci. USA 2017, 114 (4), E486–E495. [DOI] [PMC free article] [PubMed] [Google Scholar]
- 48.Wu S-J; Luo J; O'Neil KT; Kang J; Lacy ER; Canziani G; Baker A; Huang M; Tang QM; Raju TS; Jacobs SA; Teplyakov A; Gilliland GL; Feng Y, Structure-based engineering of a monoclonal antibody for improved solubility. Protein Eng. Des. Sel 2010, 23 (8), 643–651. [DOI] [PubMed] [Google Scholar]
- 49.Sorret LL; DeWinter MA; Schwartz DK; Randolph TW, Challenges in Predicting Protein-Protein Interactions from Measurements of Molecular Diffusivity. Biophys. J 2016, 111 (9), 1831–1842. [DOI] [PMC free article] [PubMed] [Google Scholar]
- 50.Tomar DS; Kumar S; Singh SK; Goswami S; Li L, Molecular basis of high viscosity in concentrated antibody solutions: Strategies for high concentration drug product development. MAbs 2016, 8 (2), 216–228. [DOI] [PMC free article] [PubMed] [Google Scholar]
- 51.Woldeyes MA; Qi W; Razinkov VI; Furst EM; Roberts CJ, How Well Do Low- and High-Concentration Protein Interactions Predict Solution Viscosities of Monoclonal Antibodies? J Pharm Sci 2018, 1–84. [DOI] [PubMed] [Google Scholar]
- 52.James S; McManus JJ, Thermal and Solution Stability of Lysozyme in the Presence of Sucrose, Glucose, and Trehalose. J. Phys. Chem. B 2012, 116 (34), 10182–10188. [DOI] [PubMed] [Google Scholar]
- 53.Das U; Hariprasad G; Ethayathulla AS; Manral P; Das TK; Pasha S; Mann A; Ganguli M; Verma AK; Bhat R; Chandrayan SK; Ahmed S; Sharma S; Kaur P; Singh TP; Srinivasan A, Inhibition of protein aggregation: supramolecular assemblies of arginine hold the key. PLoS One 2007, 2 (11), e1176. [DOI] [PMC free article] [PubMed] [Google Scholar]
- 54.Arakawa T; Timasheff SN, Theory of protein solubility. Methods Enzymol 1985, 114, 49–77. [DOI] [PubMed] [Google Scholar]
- 55.Arakawa T; Bhat R; Timasheff SN, Preferential interactions determine protein solubility in three-component solutions: the MgCl2 system. Biochemistry 1990, 29 (7), 1914–23. [DOI] [PubMed] [Google Scholar]
- 56.Golovanov AP; Hautbergue GM; Wilson SA; Lian LY, A simple method for improving protein solubility and long-term stability. J Am Chem Soc 2004, 126 (29), 8933–9. [DOI] [PubMed] [Google Scholar]
- 57.Schneider CP; Trout BL, Investigation of cosolute-protein preferential interaction coefficients: new insight into the mechanism by which arginine inhibits aggregation. J Phys Chem B 2009, 113 (7), 2050–8. [DOI] [PMC free article] [PubMed] [Google Scholar]
Associated Data
This section collects any data citations, data availability statements, or supplementary materials included in this article.
Supplementary Materials
Figure S1: Example of protein-protein docking pose filtering
Figure S2: CNTO607 surface and sequence colored by protein-protein interaction preference values
Figure S3: Lysine exclusive binding sites on the NIST Fab domain.
Figures S4 and S5: Correlation plots of SILCS metrics and experimental data.
Tables S1 and S2: Calculated and average SILCS metrics for the NIST Fab domain.