

Abstract
Pictorial cues generally produce stronger search performance relative to categorical cues. We asked how universal is the benefit of a pictorial cue? To test this, we trained observers to categorize sinusoidal gratings in which categories were distinguished by spatial frequency or orientation. Next, participants completed a search task in which targets were pictorially and categorically cued. Measures of target and distractor processing that primarily rely on foveal processing showed universal benefits; however, the benefit was larger in the orientation condition. Importantly, an index of the direction of spatial attention (i.e., target guidance) showed that the orientation condition produced a pictorial benefit but the spatial frequency condition did not. Experiment two replicated the spatial frequency results and also included conditions that increased the discriminability, lowered the spatial frequencies, or both increased the discriminability and decreased the spatial frequencies of the categories. We found that only categories utilizing lower spatial frequencies produced a pictorial guidance benefit. This demonstrates that pictorial cues do not universally improve search performance above categorical cues; it depends on the features that distinguish the categories. Additionally, the increased discriminability condition improved guidance but failed to produce a pictorial benefit, suggesting an interesting disassociation between the amount of target guidance and the existence of a pictorial benefit. Given that perception is known to progress from low/coarse to high/fine spatial frequencies, this suggests that the pictorial guidance benefit acts on early low spatial frequency processing only, but foveal object recognition processes utilize both early and late spatial frequency processing.
Keywords: Visual Search, Target Representation, Categorical, Pictorial, Guidance
Visual search tasks are embedded in our daily lives. For example, when shopping for groceries, we must localize and identify products to buy from the store shelves. Unlike laboratory environments, we rarely see a pictorial preview of the to-be purchased item before we begin our search. At times, we might view a picture of the item we hope to find on our phone, providing the exact visual details. However, more frequently we typically utilize categorical features retrieved from long-term memory. In these two situations, the mental representation of the target necessarily varies in specificity; in the first case, the target representation likely contains precise visual details acquired from the picture of the target, whereas in the second case, the target representation likely contains visual details that apply to the entire product category.
Laboratory-based search studies have classically used either pictorial cues or a small number of targets (e.g., Vickery, King, & Jiang, 2005). This approach ensures that the visual details of the target are well known, and likely minimizes the variability in the target representation. Whereas this approach has proven fruitful in determining the underpinnings of attentional processes involved in search, knowing the precise visual details of the target is unlike most everyday search tasks. Instead, we generally search for categories; find any pen as opposed to a specific pen. This results in less specific visual details of the target because the details must necessarily pertain to the entire category of items (Yu, Maxfield, & Zelinsky, 2016).
Most laboratory-based categorical search tasks designate targets with a word cue before search onset (e.g., the words “teddy bear” or “fish”). In these cases, the details of the target category must be retrieved from long-term memory to guide attention through the search display. Search is thought to be a cyclical process in which attention is first guided to a region of space containing the most category consistent features (Yu et al., 2016). This is followed by categorization processes to determine if the target category is present (Zelinsky, Adeli, Peng, & Samaras, 2013; Zelinsky, Peng, & Samaras, 2013). If an item from the target category is found, search stops. However, if the target is not found, attention is directed to the region of space containing the next most category consistent features and the categorization process begins again. Importantly, search for specific items, rather than categories, is thought to function in a fundamentally similar way. However, features of the specific target item are thought to be used for search rather than features specific to the entire target category (Wolfe, 1994; Zelinsky, 2008; Zelinsky et al., 2013)
Prior studies suggest pictorial cues produce superior search performance relative to categorical cues (Wolfe, Horowitz, Kenner, Hyle, & Vasan, 2004; Vickery et al., 2005; Castelhano, Pollatsek, & Cave, 2008). It is generally assumed that the pictorial search benefit arises from the use of a more specific target representation (Maxfield & Zelinsky, 2012; Schmidt, & Zelinsky, 2009). Despite poorer search performance, recent evidence suggests that categorical cues can guide overt attention as early as the first search eye movement (Maxfield & Zelinsky, 2012; Schmidt, & Zelinsky, 2009; Yang, & Zelinsky, 2009; Zelinsky, & Schmidt, 2009). Moreover, increased target specificity increases search guidance (i.e. the spatial focus of attention immediately shifts to the target at search onset more frequently; Schmidt & Zelinsky, 2009). For example, “brown boots” results in stronger guidance relative to “boots”. Furthermore, hierarchical levels of categorization, superordinate, basic, and subordinate (e.g. corresponding to mammal, dog, and golden retriever respectively; Rosch, Mervis, Gray, Johnson, & Boyes-Braem, 1976), show graded levels of search performance, with the most specific cues (subordinate cues) resulting in the strongest search guidance (Maxfield, & Zelinsky, 2012). This further suggests that guidance improves with increased categorical specificity.
Despite clear evidence that increased target specificity improves search performance, the exact details of an individual’s categorical representations are largely unknown and certainly vary from person to person (Golan, Bentin, DeGutis, Robertson, & Harel, 2014). For example, if a person is given a categorical cue of “pen,” some may envision a blue retractable pen, whereas others may envision a writing quill, and others still may envision a more generic long cylindrical item. The resulting variability in the target representation makes it difficult to predict the resulting search performance. More specifically, weaker target guidance, slower target verification times, and slower overall response times have been found with more variable categories (Hout, Robbins, Godwin, Fitzsimmons, & Scarince, 2017). This issue is especially evident with real-world stimuli but in this study, we attempt to minimize this by training observers to categorize classes of items composed of basic visual features in which the categorical variance is known.
In this study, we sought to explore if the previously reported benefit of a pictorial cue is universal. To test this, we created categories comprised of circular sinusoidal gratings that varied in spatial frequency and orientation. Category membership was dependent on one feature dimension (spatial frequency or orientation, depending upon condition). Participants learned to categorize stimuli into two groups and then completed a search task that utilized pictorial and categorical cues. Importantly, we only analyzed search data from participants who sufficiently learned the categories, suggesting that their categorical representations were of similar quality. This allows us to control the variability of the categorical representation and to directly measure the benefit of a pictorial preview.
We expect to observe one of three possible data patterns. One possibility is that we observe a pictorial benefit in both conditions consistent with the idea that there is a universal benefit to pictorial cues. The second possibility would be that the reduced peripheral acuity associated with higher spatial frequencies may affect pictorially and categorically cued search equally. If targets and distractors are separated along category lines, we reasoned that the necessary acuity would be the same irrespective of the cue type. This would result in a search guidance advantage for orientation relative to spatial frequency search, but it would preserve the target specificity benefit of a pictorial cue in both conditions, again consistent with a universal benefit. Lastly, since coarse, low-frequency information is processed before fine, high-frequency information (i.e. the coarse global shape information is processed earlier than the fine details; Goffaux, Peters, Haubrechts, Schiltz, Jansma, & Goebel, 2010; Schyns & Oliva, 1994; Sugase, Yamane, Ueno, & Kawano, 1999; Tamura & Tanaka, 2001; Watt, 1987), and search guidance must operate quickly (within the duration of a single fixation), the early guidance of spatial attention may act only on this coarse information. Given the considerable evidence that top-down facilitation of object recognition is initially mediated by this coarse information only (for review see Bar, 2003; Fenske, Aminoff, Gronau, & Bar, 2006), it stands to reason that despite having the acuity to distinguish spatial frequencies in peripheral vision (evident by above chance search guidance), target specificity and the pictorial guidance advantage may only operate on coarse, low frequency information. In this case, the pictorial preview of a relatively higher spatial frequency stimulus would not afford additional coarse details to improve search guidance above what can be observed with a categorical cue. This would be expected to result in a guidance benefit for pictorial cues when categories are defined by orientation but not when they are defined by relatively higher spatial frequencies. By comparing search performance in response to a pictorial and categorical cue, when categories are defined by orientation or spatial frequency, we can observe if the magnitude of the search benefit of a pictorial cue, over a categorical cue, is universal across feature dimensions or not.
Experiment One
Why might these feature dimensions be expected to create a search guidance difference?
Both spatial frequency and orientation are known to exhibit strong search guidance (for a review, see Wolfe & Horowitz, 2004). Importantly, spatial frequency and orientation behave somewhat differently in foveal and peripheral vision. Both low and high spatial frequencies can easily be discriminated in foveal vision, but the ability to discriminate high spatial frequencies rapidly drops off in peripheral vision (Cleland, Harding, & Tulunay-Keesey, 1979). The ability to discriminate orientation in peripheral vision also decreases (Sally & Gurnsey, 2003), but there is little reason to suspect that the change would not be uniform across orientations. The non-uniformity of spatial frequency processing across the field of view (i.e., the selective drop-out of higher spatial frequencies in peripheral vision), should primarily decrease the guidance of spatial attention to peripheral target locations containing categories distinguished by spatial frequency. Importantly, acuity differences alone would be expected to affect both pictorial and categorical cues equally. However, if guidance is instead mediated by coarse, low-spatial frequency information in a similar fashion as top-down facilitation of object recognition (Fenske, et al., 2006), this could manifest as the absence of a pictorial guidance benefit. However, target detection accuracy, distractor dwell time, and target dwell time largely rely on foveal processing (Rao, Zelinsky, Hayhoe, & Ballard, 2002; Zelinsky, 2008), and should, therefore, allow for accurate discrimination of a wide variety of spatial frequencies. Therefore, we hypothesize that categories distinguished by orientation should create a pictorial guidance benefit but the coarse-to-fine processing of spatial frequencies may selectively affect the ability to guide search to target locations when categories are distinguished by spatial frequency, resulting in no pictorial guidance advantage in the spatial frequency condition. We hypothesized that it would result in the lack of a pictorial preview benefit selectively in the spatial frequency condition.
Method
Participants
A power analysis was conducted using G*Power 3.1 (Faul, Erdfelder, Buchner, & Lang, 2009). Power was estimated utilizing the results of a separate pilot study that included categorical and pictorial search performance, for categories defined by spatial frequency or orientation, or the combination of the two. The sample size was estimated utilizing the smallest calculated effect size from the omnibus ANOVAs of all reported measures. Results suggest that we should expect a moderate effect size (observed Cohen’s d: .435). For an alpha level of .05 and power (1-β error probability) of .95, we would need 28 participants in each condition, thus we rounded up to 30 participants in each condition. This power analysis was used for both experiments 1 and 2.
All participants gave informed consent before participation. Sixty participants (30 in each condition) were randomly assigned to either the spatial frequency or orientation conditions. Participants were between 18 and 36 years old, with an average age of 19. The majority of participants were female (61%) and Caucasian (79%, 17% African American, 3% mixed raced). All participants reported having normal or corrected-to-normal vision. Acuity was additionally assessed via the Logarithmic Visual Acuity Chart; participants with acuity worse than 20/32 were excluded from participation. Recruitment was accomplished via the University of Central Florida’s Psychology Research Participation System. Participants received course credit for participation. This study was reviewed and approved by the University’s Institutional Review Board.
Stimuli & Apparatus
The stimuli used for the category learning task and search task were circular sinusoidal gratings. Stimuli varied in spatial frequency and orientation to create two sets of stimuli (one in which categories only differed in orientation and the other in which categories only differed in spatial frequency). Two categories were created within each of these sets of stimuli. These gratings were developed using the General Recognition Theory (GRT) toolbox (Alfonso-Reese, 2006) via Matlab R2015a.
Stimulus coordinate values for each category were sampled from bivariate normal distributions defined by the parameters summarized in Table 1. As shown in Figure 1, in both conditions, the categories were optimally divided by a single decision bound along a single critical dimension (i.e., by a horizontal or vertical line). Along this critical dimension, the standardized distance between category distributions, (objective d’ in signal detection parlance) was 4.6. Coordinate values from the category space shown in Figure 1 were transformed into frequency and orientation values to generate the grating stimulus displayed on each trial. The transformations on frequency (.25+x/50)) and orientation (y2 x π/50) were empirically derived in earlier pilot research to equate the saliency of changes along these distinct perceptual dimensions and have been used in a large number of reported studies (e.g., Ashby, Maddox, & Bohil, 2002; Filoteo, Lauritzen, & Maddox, 2010; Maddox, Ashby, & Bohil, 2003; Worthy, Markman, & Maddox, 2009). In practice, the values reported in the table below results in spatial frequencies in the range of 2.04 to 2.78 cycles per degree and orientations between −63 to 170 degrees from vertical (0 degrees).
Table 1.
Category Distribution Parameters Used in Experiment 1 and 2 Spatial Frequency Conditions
| Experiment | Condition | Category A | Category B | ||||||
|---|---|---|---|---|---|---|---|---|---|
| μf | μo | μf | μo | σ2f | σ2o | covf,o | d’ | ||
| 1 | Orientation | 125 | 280 | 125 | 320 | 9000 | 75 | 0 | 4.6 |
| 1,2 | LD | 280 | 125 | 320 | 125 | 75 | 9000 | 0 | 4.6 |
| 2 | SLD | 61 | 125 | 101 | 125 | 75 | 9000 | 0 | 4.6 |
| 2 | HD | 273 | 125 | 327 | 125 | 75 | 9000 | 0 | 6.4 |
| 2 | SHD | 54 | 125 | 108 | 125 | 75 | 9000 | 0 | 6.4 |
Note: LD = low discriminability, HD = high discriminability, f = frequency, o = orientation, cov = covariance. d’ refers to the standardized distance between category means along the critical dimension. Table values represent stimulus coordinates in arbitrary space – see text for description of transformations used in stimulus generation. For orientation condition, the frequency and orientation coordinates are transposed.
Figure 1.

Category distributions for the two category learning conditions. The Orientation condition is plotted on the left (A) and the spatial frequency condition is plotted on the right (B). Each coordinate pair indicates frequency and orientation values for a grating stimulus, which are illustrated by two examples from each condition.
Stimuli were present at a screen resolution of 1920 x 1080 pixels on a 24-inch Asus LED monitor (Model VG248) operating at a 144 Hz refresh rate. The categorization task was programmed and presented via Matlab R2015a and Psychtoolbox 3. The search task was programmed and presented via SR-Research Ltd.’s Experiment Builder (version number 1.10.1630). During the search task, eye movements were sampled at 1000 Hz using a desktop mounted EyeLink 1000 Plus eye tracker (SR-research) in head-stabilized mode, utilizing default saccade detection thresholds. Participants were placed in a headrest approximately 98 centimeters from the screen. Before the search task, a 13-point calibration routine was used to track eye positioning. Calibration accuracy was less than or equal to .49° on average and the maximum error was less than or equal to .99° for all study participants. Participants were recalibrated as necessary.
Procedure
Category Learning Task.
Participants in both conditions completed a category learning task that only differed in the stimuli as described above. This resulted in two between-subjects conditions: categories separated along the spatial frequency dimension and categories separated along the orientation dimension. During the categorization task, participants learned to classify stimuli into two distinct categories (“A” or “B”) via reinforcement feedback. Initially, the decision rule that determined category membership was unknown to the participant. The category learning task was comprised of five blocks of 80 trials each, for a total of 400 trials (200 trials from category “A” and 200 trials from category “B”). At the beginning of each trial, a 5.4° circular sinusoidal grating was shown in the center of the screen and remained on the screen until response. The participant had to decide if the stimulus was a member of category A or category B by pressing the “z” or “m” keys, respectively. After the response was recorded, feedback was given (“Correct! That was an A/B” or Incorrect! That was an A/B”). If the participant failed to respond within five seconds, they received the feedback, “Too long to respond – repeat trial” and the trial was repeated. Figure 2a depicts the sequence of events in this task. For the final two blocks of the categorization task, participants were instructed to respond as quickly and as accurately as possible. This was done to make the categorization training task and the search task more comparable as both require a speeded response.
Figure 2.

Figure 2a. Sequence for the categorization task. Figure 2b. Sequence for the search task. In this example, the category-defining dimension is orientation. Half of all trials presented a categorical cue and the other half presented a pictorial cue. The search target is in the lower left-hand side of the search array.
Search Task.
The search task was divided into two blocks, 16 practice trials followed by 160 experimental trials. The practice trials allowed participants to familiarize themselves with the eye tracker and response methods. Practice trials were excluded from all analyses. Before the start of each trial, a drift correct fixation dot was presented in the center of the screen. When ready, participants were instructed to look at the drift correct fixation dot and press the space bar; this started the trial and recorded any drift in the calibration that may have occurred since the last calibration. At the beginning of each trial, participants were cued with either a categorical text cue (A or B) denoting the target category or a pictorial cue which was identical to the target in the search display (1000 ms). Cue type (categorical or pictorial) resulted in two within-subjects search conditions that were interleaved and presented equally often. After the cue, an “X” was displayed in the center of the screen for 1000 ms to ensure the participant maintained central fixation. Finally, the search array was displayed (see Figure 2b). The search array consisted of four stimuli, with the center of each appearing 6° from central fixation. A target was present on every trial and the three remaining distractors on each trial were from the non-target category. Targets and distractors were all trial unique (i.e., they never repeated). To localize the target, participants were instructed to look at a stimulus and press the spacebar if they believed it was the target. The eye position was checked at the time of response to determine if a target or distractor was fixated, resulting in a correct or incorrect response, respectively. In this way, the search task required the participant to localize the target on each trial, allowing us to have a target present in 100% of search displays, maximizing our power to examine search guidance related effects. The search display remained on the screen until a response was made; however, participants were instructed to respond as quickly and as accurately as possible. Once the response was made, feedback was presented by displaying the words correct or incorrect in the center of the search display. For incorrect responses, the correct target stimulus was circled for 500 ms.
Measures
We measured search performance using five criteria: accuracy, overall response time, search guidance, distractor rejection time, and target dwell time. Accuracy was operationally defined as the percentage of trials in which the participant correctly localized the search target. Search guidance was defined as the percentage of trials in which the target was the first search object fixated. Distractor rejection time was defined as the average of the cumulative fixation duration (dwell time), on distractors before fixating the target. Target dwell time was defined as the cumulative fixation duration on the target before the manual response was made (Castelhano et al., 2008; Goldstein & Beck, 2018). We considered search guidance to be largely reliant on peripheral processing, while accuracy, distractor dwell time, and target dwell time were largely reliant on foveal processing. However, it is important to note these measures do not perfectly delineate target and distractor processing. Given that attention is known to “scout ahead” and peripherally preprocess stimuli that the eye will saccade towards (Henderson, Pollastek, & Rayner, 1989; Henderson, 1992; Henderson & Hollingsworth, 2003; Alvarez & Oliva, 2009; Hughes, Southwell, Gilchrist, & Tolhurst, 2016), this creates a dependency between foveal and peripheral processing. Likewise, information processed by foveal vision often gives cues about the broader context of the search display and can influence eye movements to peripheral locations.
Results
Category Learning Task
To determine whether participants had reached an acceptable degree of proficiency with the categories before performing the search task, we fit a series of decision bound models to each participant’s responses from the final block of speeded classification trials. The tested models, based on general recognition theory (GRT; Ashby & Townsend, 1986), assumed that the observer partitions the perceptual space into category response regions divided by a linear decision bound (akin to a multidimensional version of the decision criterion, β, from signal detection theory). Each classification response depends on which side of the observer’s bound falls the percept created by the stimulus. For a linear decision bound, several different hypotheses can be instantiated and tested using different slope and intercept parameter values to try to reproduce a participants’ classification responses.
In the current research, we fit four different models to each participant’s data. This included an optimal model that fixed the slope and intercept values for the decision bound at their optimal (i.e., accuracy maximizing) values, a free-intercept model that assumed the optimal slope (i.e., perpendicular to the salient coordinate axis; see Figure 1) but that included a free parameter to estimate the decision-bound intercept or placement along the critical axis, and the general linear classifier which included free slope and intercept parameters to find the best fitting decision bound to account for responding. Each of these models also included a single free noise parameter representing the combination of trial-by-trial variability in stimulus perception and decision criterion placement. Finally, a random-responder model was fit to the data, which merely predicted responses by flipping a virtual coin on each trial. This model was included to identify “non-learners” or participants who were responding at chance by the end of the training. Model parameters were estimated using maximum likelihood and the goodness-of-fit statistic was BIC ln(n)r – 2lnL, where n is the number of data points, r is the number of free parameters in the model, and L is the likelihood of the model given the data. Decision bound models have been utilized in a great deal of research, and additional details can be found in numerous articles (e.g., Ashby, Maddox, & Bohil, 2002; Maddox, Ashby, & Bohil, 2003).
Based on the model fitting results, we excluded from further analysis participants who were determined to be non-learners (responding at chance), or learners who failed to selectively attend to the critical dimension (as determined by slope estimates from the general linear classifier model). This resulted in the exclusion of 10 participants from the spatial frequency condition and 7 participants from the orientation condition, leaving 20 and 23 participants in each condition, respectively. All remaining results are based on this subset of individuals who learned the categories using the optimal selective attention rule to ensure a high degree of category knowledge.
Bayesian statistics were applied to all analyses. JASP (version 0.13.0.0) was used to estimate the Bayes Factor (BF01) in favor of the null hypothesis. Bayes Factors greater than 1 provide evidence for the null hypothesis, with larger values suggesting more evidence for the null hypothesis. Whereas, Bayes Factors less than 1 provides evidence for the alternative hypothesis. Confidence intervals were provided for all mean estimates and t-test difference intervals.
Accuracy
Accuracy from the last block of speeded category learning was used to evaluate categorization performance. An independent samples t-test showed that accuracy did not significantly differ between participants who learned the categories in the orientation and the spatial frequency conditions (orientation: M = .83, SD = .08, 95% CI [.80, .87]; spatial frequency: M = .80, SD = .09, 95% CI [.76, .84]; t(41) = 1.12, p = .27, d = .35, BF01= 2.01, 95% CI [−.02, .08]). This suggests participants in both conditions were able to distinguish the categories effectively.
Response Time
Response times from the last block of speeded category learning trials was used to compare average times across frequency and orientation rules. An independent samples t-test showed that response time did not differ significantly (orientation: M = 702.21, SD = 120.77, 95% CI [652.81, 751.61]; spatial frequency: M = 671.65, SD = 236.50, 95% CI [568, 776]; t (41) = .54, p = .59, d = .16, BF01 = 2.95, 95% CI [−82.87, 143.98]). Collectively, this suggests that categorization performance did not significantly differ between the two feature dimensions.
Search Task
All search analyses utilized a mixed-factor ANOVA to examine the within-subjects factor of cue type (pictorial vs. categorical) and the between-subjects factor of feature dimension (spatial frequency vs. orientation). When the omnibus ANOVA indicated an interaction, the effects of cue type were explored via paired samples t-tests at each level of feature dimension. Furthermore, Bayesian statistics were computed to directly test the pictorial benefit. The effects of feature dimension were tested via independent samples t-tests at each level of cue type. Except for accuracy, all measures were computed over correct trials only.
Accuracy
If categorical search only involves directing spatial attention to an object and then categorizing that object (Zelinsky et al., 2013), we would expect to observe similar patterns in search, as in the last block of category learning trials. The means and standard errors of the search accuracy are in Table 2. Overall results from the omnibus ANOVA indicated there was a main effect of feature dimension, F(1, 41) = 15.87, p < .001, ηp2 = .28, BF01 = .002, in which participants in the orientation condition were more accurate at localizing the target. We did not observe a main effect of cue type, F(1, 41) = .03, p = .86, ηp2 = .001, BF01 = 4.28, or an interaction of feature dimension and cue type, F(1, 41) = .19, p = .67, ηp2 = .01, BF01 = .14, indicating no benefit of a pictorial cue in terms of accuracy. Despite the lack of a difference in category training accuracy or response times, the orientation condition produced a significantly more accurate search than the spatial frequency condition, suggesting a dissociation between categorization and search.
Table 2.
Accuracy and Response Time for the Search Task
| Metric | Orientation | Spatial Frequency |
|---|---|---|
| Accuracy (%) | ||
| Categorical Cues | 85.76 (4.06) | 71.20 (5.12) |
| Pictorial Cues | 87.55 (1.37) | 70.44 (2.36) |
| Response Time (ms) | ||
| Categorical Cues | 2560.97 (252.37) | 1946.88 (156.40) |
| Pictorial Cues | 1615.40 (128.89) | 1822.41 (137.74) |
Note: Values in parentheses indicate standard error of the mean (SEM).
Response Time
Response time was quantified as the amount of time between search onset and correct manual identification of the target. Because response time is a holistic measure that requires both foveal and peripheral processing, increased search guidance may reduce RTs but this may not be evident due to changes in object processing times. If the search data replicates the category learning data, it would show no effect of category dimension. The means and standard errors can be seen in Table 2. Replicating prior work, the omnibus ANOVA revealed a main effect of cue type, F (1, 41) = 42.09, p < .001, ηp2 = .51, BF01 < .001, in which participants were faster with a pictorial cue. Consistent with the lack of a pictorial advantage, we observed an interaction between cue type and feature dimension, F (1, 41) = 26.45, p < .001, ηp2 = .39, BF01 < .001. However, we did not observe a main effect of feature dimension, F (1, 41) = .53, p = .47, ηp2 = .01, BF01 = 2.40. Two paired samples t-tests comparing cue type within the spatial frequency and orientation conditions indicated that the interaction was driven by the lack of a pictorial advantage in the spatial frequency condition and a significant pictorial advantage in the orientation condition (spatial frequency: t (19) = 1.29, p = .21, d = .17, BF01 = 2.08, 95% CI [−68.37, 289.62], orientation: t (22) = 7.14, p < .001, d = 1.04, BF01 < .001, 95% CI [678.83, 1235.00]). Two independent sample t-tests comparing feature dimension, within each level of cue type, indicated that participants in the spatial frequency condition responded faster than in the orientation condition when searching with a categorical cue, t (41) = 2.03, p = .05, d = .63, BF01 = .66, 95% CI [2.59, 1181.76]. When given a pictorial cue, participants had similar response times, t (41) = −1.34, p = .19, d = .41, BF01 = 1.63, 95% CI [−637.12, 128.90]. Collectively, this suggests that the orientation and spatial frequency conditions produce different RT patterns of data; pictorial cues are faster than categorical cues when searching for orientation but not when searching for spatial frequency.
Guidance
Visual search guidance was operationally defined as the proportion of trials in which the target was the first search object fixated. We predicted that orientation search guidance would produce a pictorial advantage but the spatial frequency condition would not due to the coarse-to-fine processing of spatial frequencies and the speed at which guidance must operate. Because there were four items in the search display, by chance alone (indicating no search guidance), the target would be fixated first on 25% of trials. One sample t-tests, against a critical value of 25%, showed guidance was above chance in all conditions (categorical orientation: t (22) = 3.56, p = .002, d = .74, BF01 = .03, 95% CI [.02, .07], pictorial orientation: t (22) = 13.52, p < .001, d = 2.82, BF01 < .001, 95% CI [.15, .20], categorical spatial frequency: t (19) = 2.22, p = .04, d = .50, BF01 = .32, 95% CI [.01, .22], pictorial spatial frequency: t (19) = 4.22, p < .001, d = .94, BF01 = .01, 95% CI [.04, .12]). The means and standard errors in all conditions are in Figure 3. Overall results from the omnibus ANOVA indicate that guidance was stronger when participants were given a pictorial cue, F (1, 41) = 4.94, p = .03, ηp2 = 11, BF01 = .42, however, the effect of feature dimension failed to reach significance, F (1, 41) = .17, p = .68, ηp2 = .23, BF01 = 3.52. Importantly, the ANOVA revealed a significant interaction between cue type and category feature dimension, F (1, 41) = 12.25, p = .001, ηp2 = .23, BF01 = .03. Consistent with the pattern of results observed in RT, the two paired samples t-tests, comparing cue type within the spatial frequency and orientation conditions indicated the interaction was driven by the lack of a pictorial advantage in the spatial frequency condition and a significant pictorial advantage in the orientation condition (spatial frequency: t (19) = .65, p = .53, d = .17, BF01 = 3.63, 95% CI [−.07, .12]; orientation: t (22) = −7.73, p < .001, d = 2.16, BF01 < .001, 95% CI [−.17, −.10]). Two independent sample t-tests comparing category feature dimension within each level of cue type further confirmed the interaction was driven by a pictorial advantage in the orientation condition; guidance was stronger in the orientation condition when given a pictorial cue compared to those in the spatial frequency condition (orientation: M = .43, SD = .06, 95% CI [.40, .46]; spatial frequency: M = .33, SD = .09, 95% CI [.29, .37]; t (41) = 4.06, p < .001, d = 1.22, BF01 = .01, 95% CI [−.17, .03]), but not when given a categorical cue, t (41) = −1.39, p = .17, d = .41, BF01 = 1.53, 95% CI [.05, .14]. This suggests that the coarse-to-fine processing of spatial frequency selectively negates the benefit of a pictorial cue.
Figure 3.

The percentage of trials in which the target item was the first object fixated in Experiment 1. Error bars indicate SEM. The black line represents chance (25%).
Distractor Rejection
A dwell time analysis was used to quantify the average cumulative fixation duration on distractors before the first fixation on the target. The means and standard errors in all conditions can be seen in Figure 4. We predicted that, on average, participants would reject distractors faster when given pictorial cues relative to categorical cues and no differences between category dimensions. Consistent with our hypothesis, the omnibus ANOVA revealed a significant effect of cue type in which pictorial previews resulted in faster distractor rejection relative to categorical cues, F (1, 41) = 47.50, p < .001, ηp2 = .54, BF01 < .001. Distractor rejection times did not differ by feature dimension, F (1, 41) = .003, p = .96, ηp2 < .001, BF01 = 3.61. However, the omnibus ANOVA also revealed a significant interaction between cue type and feature dimension, F (1, 41) = 6.05, p = .02, ηp2 = .13, BF01 < .001. Two paired sample t-tests comparing cue type within the spatial frequency and orientation conditions indicated that both conditions resulted in a pictorial cue advantage (distractors were rejected faster after a pictorial cue; spatial frequency: t (19) = 3.58, p = .002, d = .77, BF01 = .05, 95% CI [17.69, 67.54], orientation: t (22) = 6.14, p < .001, d = 1.32, BF01 < .001, 95% CI [59.58, 120.27]). Independent samples t-tests comparing orientation and spatial frequency with pictorial cues showed that orientation resulted in faster distractor rejection than spatial frequency, t (41) = −2.01, p = .05, d = .61, BF01 = .68, 95% CI [−45.61, .13]. When comparing orientation and spatial frequency with categorical cues, distractor rejection times did not differ, t (41) = 1.00, p = .32, d = .31, BF01 = 2.23, 95% CI [−25.09, 74.23]. This suggests that the pictorial advantage in distractor rejection speed was larger in the orientation condition than in the spatial frequency condition but present in both situations.
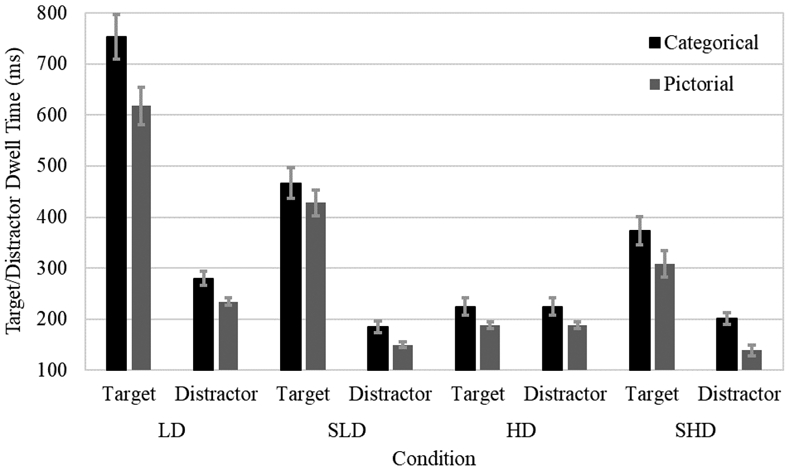
Figure 4.

Mean time spent dwelling on targets and distractors in Experiment 1. Error bars indicate SEM.
Target Dwell Time
Target dwell time was quantified as the cumulative amount of time participants fixated on the target throughout the search task, from search onset to correct identification of the target. Means and standard errors are plotted in Figure 4. Consistent with prior work, we predicted that participants would spend less time fixating the target with pictorial cues compared to categorical cues. When comparing feature dimensions, we anticipated no significant differences as this measure is primarily dependent on foveal processing. The omnibus ANOVA confirmed our prediction for cue type, F (1, 41) = 67.20, p < .001, ηp2 = .62, BF01 < .001; participants spent less time dwelling on the target with pictorial cues relative to categorical cues. We did not find a main effect of category feature dimension, F (1, 41) = .08, p = .78, ηp2 = .002, BF01 = 1.75. Consistent with the distractor rejection analysis, the omnibus ANOVA also revealed a significant interaction between cue type and category feature dimension, F (1, 41) = 18.60, p < .001, ηp2 = .31, BF01 < .001. Two paired samples t-tests comparing cue type within each level of category feature dimension indicated a pictorial advantage in both conditions (spatial frequency: t (19) = 2.56, p = .02, d = .21, BF01 = .33, 95% CI [9.97, 99.40]; orientation: t (22) = 9.49, p < .001, d = .47, BF01 < .001, 95% CI [137.59, 214.52]). The two independent samples t-tests revealed no significant differences between feature dimensions when looking at cue type independently (categorical: t (41) = .87, p = .39, d = .28, BF01 = 2.46, 95% CI [−117.91, 296.06], pictorial: t (41) = −.34, p = .74, d = .10, BF01 = 3.18, 95% CL [−227.26, 162.66]). Importantly, this suggests that the pictorial advantage in target dwell time is present in both feature dimensions but larger with orientation.
Discussion
This study sought to determine if pictorial cues result in a universal search benefit relative to categorical cues irrespective of the category-defining feature dimension. To accomplish this goal, we created categories in which the mean and variance separating categories were equated across feature dimensions (spatial frequency and orientation). As a manipulation check, we confirmed accuracy and response times were similar in the last block of category learning trials.
Despite similar performance in the categorization task, search performance differed. Participants more accurately localized targets defined by orientation than targets defined by spatial frequency. Furthermore, pictorial cues did not improve accuracy above categorical cues in either condition. RTs, on the other hand, suggest a pictorial advantage when searching for orientation, but not when searching for spatial frequency. At face value, the decreased accuracy and faster RT of the spatial frequency condition may seem like a speed-accuracy trade-off. However, the decreased accuracy was observed for both categorical and pictorially cued search, whereas spatial frequency RTs were only shorter than orientation RTs in the categorical condition. This suggests that the differences arise from an interaction of feature dimension and cue type rather than a speed-accuracy trade-off.
Importantly, RT relies on both foveal recognition processes and peripheral guidance processes. Foveal dwell time measures resulted in pictorial benefits, irrespective of the feature dimension. However, the pictorial benefit was smaller in the spatial frequency condition. This suggests that foveal processing behaves similarly when specificity increases in both the orientation and spatial frequency feature dimensions. The smaller magnitude pictorial advantage in the spatial frequency condition may be the result of decreased peripheral pre-processing of targets and distractors (Henderson et al., 1989; Henderson, 1992; Henderson & Hollingsworth, 2003; Alvarez & Oliva, 2009; Hughes et al., 2016).
Since coarse, low spatial frequencies are processed earlier than fine, high spatial frequencies and the guidance of spatial attention must operate very quickly, we hypothesized a lack of a pictorial guidance advantage when categories were distinguished by spatial frequency. Despite all conditions resulting in above chance guidance, we observed that spatial frequency search guidance did not improve with a pictorial cue, but orientation search guidance did improve with a pictorial cue. Importantly, the existence of above-chance guidance in all conditions suggests that categories could be resolved in the periphery (i.e., poor peripheral acuity would be expected to result in chance levels of guidance in both spatial frequency cue conditions). If search guidance were proportional to peripheral acuity, then this would suggest that all conditions except for the pictorial orientation condition resulted in similar acuity limitations. Rather, this suggests that the benefit of increased target specificity is likely mediated by coarse-to-fine processing of spatial frequencies.
Taken together, these results suggest that categorical search is not simply a cyclical process of guiding attention to a stimulus followed by the categorization of the stimulus, with the cycle repeating until the target is found (Yu et al., 2016; Zelinsky et al., 2013). Rather, we reasoned that the coarse-to-fine processing of spatial frequencies may eliminate the pictorial advantage when spatial frequencies are relatively higher (i.e. there may be sufficient acuity to guide search but a pictorial cue may not provide any additional coarse target detail above what can be attained from a categorical cue). However, one might argue that this pattern of results could be due to acuity limitations alone. At face value, the argument seems reasonable, visual acuity is known to drop from foveal to peripheral vision, resulting in a non-uniform perception of spatial frequency (Bennett & Banks, 1991). Importantly, peripheral stimuli are perceptually pre-processed before foveal vision arrives at the stimulus, and this pre-processing speeds foveal processing (Henderson et al., 1989; Henderson, 1992; Henderson & Hollingsworth, 2003; Alvarez & Oliva, 2009; Hughes et al., 2016). This would suggest that the reduced pictorial advantage in target and distractor dwell times, and the absence of a pictorial advantage in guidance in the spatial frequency condition may arise due to less efficient peripheral pre-processing of high spatial frequency information. However, we argued that a simple acuity limitation should manifest as a main effect in which spatial frequency search produces poorer search guidance than orientation search guidance. This is inconsistent with the data reported above in which there was only a pictorial advantage when searching for categories defined by orientation.
In Experiment 2, we sought to examine if categories utilizing lower spatial frequencies, and/or increased discriminability (the distance between the categories) would result in the reemergence of a pictorial advantage. If the lack of a pictorial advantage in Experiment 1 resulted from an acuity limitation, we would expect that increased category discriminability would restore the pictorial guidance advantage. If the categories have a larger spatial frequency difference, it should be easier to tell them apart in peripheral vision. This would be expected to minimize the impact of an acuity limitation. Conversely, if the pictorial advantage is mediated by coarse-to-fine processing, we should only observe a pictorial guidance advantage when spatial frequencies are sufficiently low.
Experiment Two
We sought to test if creating categories with lower spatial frequencies or greater discriminability may result in a pictorial guidance advantage. Additionally, we predicted that categories, which utilize both low spatial frequency and increased discriminability, would have the largest pictorial guidance advantage. To test this, we created four sets of stimuli: one which replicates the parameters of the spatial frequency condition in Experiment 1, one which increases the discriminability between the categories, one that lowers the categories spatial frequencies, and one that increases the discriminability and lowers the categories’ spatial frequencies. In the replication condition, we expect to replicate the results of Experiment 1 in which there is no benefit of a pictorial cue with our peripheral measure (guidance) and a small but significant pictorial benefit for foveal measures (target and distractor dwell time). In the two lower spatial frequency conditions, we expect to find a pictorial cue benefit for both peripheral and foveal measures, consistent with guidance being mediated by a coarse-to-fine processing stream. Interestingly, the increased discriminability condition should result in stronger guidance relative to the replication condition, but the critical question is if it will result in a pictorial advantage. If we observe a pictorial advantage when only the discriminability is increased, that may suggest the results of Experiment 1 stemmed from an acuity limitation. However, if the pictorial advantage only exists in the lower spatial frequency conditions, that would be consistent with search guidance being mediated by coarse-to-fine processing.
Method
Participants
All 120 participants, 30 in each condition, gave informed consent, none of which participated in Experiment 1. Participants were between 18 and 31 years old with an average age of 19. The majority of participants were female (67%) and Caucasian (55%, 20% African American, 9% Asian, 9% Other, 5% mixed race, 1% Hispanic, 1% Hawaiian/Pacific Islander). All participant-screening procedures, inclusion criteria, stimuli, apparatus, and procedures were identical to Experiment 1 with the following exceptions.
Stimuli & Procedure
The procedure was identical to that of Experiment 1; however, we varied the stimuli in four between-subjects conditions, each with an equal number of participants (see Table 1 for category distribution parameters used in Experiment 2). As in Experiment 1, the stimuli were modified circular sinusoidal gratings that varied in spatial frequency and orientation. However, in all conditions, spatial frequency was the relevant dimension. The first condition replicated the spatial frequency condition from Experiment 1. The second condition increased the discriminability of the categories by increasing the categories’ average spatial frequency difference (i.e., increasing the distance between the two category distributions along the spatial frequency dimension while holding all other information constant). The third condition shifted the replication spatial frequency dimension values to lower spatial frequencies. The fourth condition shifted the increased discriminability condition to lower spatial frequencies. Respectively, these conditions will be referred to as low discriminability (LD; i.e., the replication condition), high discriminability (HD), shifted low discriminability (SLD), and shifted high discriminability (SHD). To create stimuli with lower spatial frequencies, we shifted the category distributions to decrease the number of cycles per degree by subtracting a constant from the spatial frequency dimension value for each stimulus. This resulted in the identical distributions, but all stimuli were shifted such that all spatial frequencies were below 1.25 cycles per degree. To create distributions with greater discriminability, we increased the distance between the two distributions. This resulted in an objective d’ of 6.4 along the frequency dimension, whereas the original distributions utilized a d’ of 4.6, a nearly 40% increase in the distance between distributions. The distributions of the categories for each condition can be seen in Figure 5.
Figure 5.

a. This graph shows the two categorical distributions for the low discriminability conditions. b. This graph shows the two categorical distributions for the high discriminability condition. The displayed values are transformed according to the formulas described in Experiment 1.
Results
Category Learning Task
The same models as Experiment 1 were fit to the Experiment 2 category learning data to verify the use of an appropriate categorization rule. This resulted in the exclusion of 4 participants in the LD, 1 participant in the HD, 3 participants in the SLD, and 1 participant in the SHD condition. All remaining results will be based on this subset of individuals who learned the optimal categorization rule to ensure similar category expertise across conditions. For all analyses, one-way ANOVAs were used to examine the between-subjects factor of spatial frequency condition (LD, HD, SLD, SHD). JASP (version 0.13.0.0) was used to estimate the Bayes Factor (BF01) in favor of the null hypothesis for applied to all analyses.
Accuracy
Accuracy from the last block of speeded category learning trials was used to evaluate categorization performance. A one-way ANOVA showed a main effect of condition, F (3, 107) = 40.98, p < .001, ηp2 = .53, BF01 < .001. As predicted, LD had the lowest accuracy (M = .84, SD = .06, 95% CI [.81, .86]), followed by SLD (M = .94, SD = .03, 95% CI [.93, .96]), HD (M = .95, SD = .03, 95% CI [.94, .96]), and SHD (M = .96, SD = .05, 95% CI [.94, .98]). However, post hoc LSD comparisons showed only the LD condition significantly differed from the other three conditions, all p < .001. As expected, both the increase in discriminability and lower spatial frequency aided category learning accuracy.
Response Time
Response times from the last block were used to compare categorization time across conditions. A one-way ANOVA showed a main effect of condition, F (3, 107) = 35.04, p < .001, ηp2 = .50, BF01 < .001. SHD (M = 342.40, SD = 204.42, 95% CI [301.67, 463.40]) had the fastest response times followed by SLD (M = 382.54, SD = 147.05, 95% CI [286.46, 398.33]), HD (M = 614.75, SD = 85.71, 95% CI [582.15, 647.35]), and LD had the longest RTs (M = 698.86, SD = 160.61, 95% CI [633.99, 763.74]). Post hoc LSD comparisons showed all conditions significantly differed from one another, all p < .05, except for the comparison between the two shifted conditions, p = .33. Collectively, this suggests that shifting the distributions further apart and lowering their spatial frequency generally produced increased categorization accuracy and faster response times, suggesting that the categorization process improved. This pattern of RTs is to be expected given that we process stimuli from coarse (low) to fine (high) spatial frequencies (Watt, 1987; Goffaux, et al., 2010).
Search Task
For all search-related analyses, mixed-factor omnibus ANOVAs were used to examine the within-subjects factor of cue type (pictorial vs. categorical) and the between-subjects factor of spatial frequency condition (LD, HD, SLD, SHD). Any significant interactions were explored via paired samples t-tests (comparing categorical and pictorial search performance within each category learning condition). One-way ANOVAs were used to compare the four spatial frequency conditions across categorical or pictorial search conditions separately. Because these conditions were expected to differ in difficulty, we expect search performance metrics to correspond to the decrease in difficulty. However, we will focus on the presence or absence of a pictorial advantage in each condition. As in Experiment 1, only correct trials were included in the analyses.
Accuracy
Means and standard errors for accuracy can be found in Table 3. An omnibus ANOVA revealed a main effect of cue type, F (1, 107) = 10.93, p = .001, ηp2 = .09, BF01 = .15, a main effect of condition, F (3, 107) = 38.31, p < .001, ηp2 = .52, BF01 < .001, and an interaction of the two, F (3, 107) = 6.81, p < .001, ηp2 = .16, BF01 < .001. Surprisingly, participants tended to have better accuracy with a categorical cue. Collapsed across cue type, post hoc pairwise comparisons were consistent with our hypothesis that the LD condition had the lowest accuracy, followed by HD, SLD, and SHD conditions. However, the SLD and SHD accuracy did not significantly differ, p = .56. To interpret the interaction, paired sample t-tests were used to examine the categorical advantage per condition. The two low discriminability conditions produced a significant pictorial cost in search accuracy; participants displayed lower accuracy with a pictorial cue relative to a categorical cue (LD: t (25) = 5.25, p < .001, d = 1.12, BF01 = .001, 95% CI [.06, .14]; SLD: t (26) = 3.51, p = .002, d = .74, BF01 = .03, 95% CI [.01, .03]).
Table 3.
Accuracy and Response Time for the Search Task
| Metric | LD | SLD | HD | SHD |
|---|---|---|---|---|
| Accuracy (%) | ||||
| Categorical Cues | 86.94 (1.78) | 98.06 (0.28) | 94.67 (2.72) | 97.33 (1.26) |
| Pictorial Cues | 76.96 (1.71) | 96.25 (0.61) | 92.64 (1.44) | 98.91 (0.24) |
| Response Time (ms) | ||||
| Categorical Cues | 2054.15 (115.12) | 1248.38 (87.55) | 1260.40 (74.11) | 935.22 (52.71) |
| Pictorial Cues | 1693.11 (91.85) | 1134.50 (86.23) | 1083.45 (49.19) | 735.60 (38.28) |
Note: Values in parentheses indicate standard error of the mean (SEM).
Response Time
Means and standard errors for response time can be found in Table 3. The omnibus ANOVA indicated a main effect of cue type, F (1, 107) = 57.28, p < .001, ηp2 = .35, BF01 < .001, condition, F (3, 107) = 36.68, p < .001, ηp2 = .51, BF01 < .001, and an interaction of the two, F (3, 107) = 3.34, p = .02, ηp2 = .09, BF01 < .001. Response times were faster with a pictorial cue in all conditions. Post hoc LSD pairwise comparisons showed response times scaled with difficulty, the LD condition was the slowest, followed by HD, SLD, and SHD, although HD and SLD did not significantly differ, p = .85, all others p < .01. Paired sample t-tests showed a pictorial benefit in all conditions (LD: t (25) = 4.21, p < .001, d = .68, BF 01 = .01, 95% CI [186.49, 537.59]; SLD: t (26) = 2.07, p = .05, d = .25, BF 01 = .79, 95% CI [.66, 227.09]; HD: t (28) = 3.64, p = .001, d = .94, BF 01 = .03, 95% CI [77.47, 276.42]; SHD: t (28) = 7.64, p < .001, d = .80, BF 01 < .001, 95% CI [146.08, 253.16]).
Guidance
As in Experiment 1, the percentage of trials in which the target was the first search object fixated was used to quantify guidance. Means and standard errors for guidance can be found in Figure 6. One sample t-tests, against a critical value of 25%, showed guidance was above chance in all conditions, (pictorial LD: t (25) = 3.78, p = .001, d = .74, BF01 = .01, 95% CI [.02, .08], categorical LD: t (25) = 2.26, p = .04, d = .44, BF01 = .33, 95% CI [.002, .06], pictorial SLD: t (27) = 10.73, p < .001, d = 2.06, BF01 < .001 95% CI [.22, .33], categorical SLD: t (27) = 9.35, p < .001, d = 1.80, BF01 < .001, 95% CI [.17, .27], pictorial HD: t (28) = 7.56, p < .001, d = 1.40, BF01 < .001, 95% CI [.12, .21], categorical HD: t (28) = 6.99, p < .001, d = . 1.30, BF01 < .001, 95% CI [.11, .20] , pictorial SHD: t (29) = 38.61 , p < .001, d = 7.17, BF01 < .001, 95% CI [.57, .63], categorical SHD: t (29) = 26.02, p < .001, d = 4.83, BF01 < .001, 95% CI [.47, .55]). An omnibus ANOVA revealed a main effect of cue type, F (1, 107) = 25.36, p < .001, ηp2 = .19, BF01 < .001, a main effect of condition, F (3, 107) = 149.56, p < .001, ηp2 = .81, BF01 < .001, and an interaction of the two, F (3, 107) = 4.46, p = .01, ηp2 = .11, BF01 < .001. Post hoc LSD pairwise comparisons, collapsed over cue type, confirmed our hypothesis that the SHD condition had the strongest guidance followed by the SLD, HD, and LD conditions, all p < .01. Paired samples t-tests showed a pictorial advantage was only present in the two shifted conditions (SHD: t (28) = −6.44, p < .001, d = .94, BF01 < .001, 95% CI [−.12, −.06]; SLD: t (26) = −2.91, p = .01, d = .45, BF01 = .16, 95% CI [−.10, −.02]; LD: t (25) = −1.45, p = .16, d = .37, BF01 = 1.94, 95% CI [−.06, .02]; HD: t (28) = −.29, p = .77, d = .05, BF01 = 4.85, 95% CI [−.04, .03]). This suggests that the main effect of cue type and the interaction of condition and cue type was driven by the lack of a pictorial guidance advantage with the unshifted, lower spatial frequency conditions. This is consistent with the pictorial guidance advantage being mediated by a coarse-to-fine processing rather than a simple acuity limitation.
Figure 6.

The means for guidance in Experiment 2. Error bars indicate SEM. The black bar represents chance (25%).
Distractor Rejection
Means and standard errors for distractor rejection times can be found in Figure 7. An omnibus ANOVA revealed a main effect of cue type, F (1, 107) = 54.98, p < .001, ηp2 = .34, BF01 < .001, and a main effect of condition, F (3, 107) = 20.40, p < .001, ηp2 = .36, BF01 < .001, but the interaction of the two failed to reach significance, F (3, 107) = 1.48, p = .23, ηp2 = .04, BF01 <.001. Participants in all conditions rejected distractors faster with a pictorial cue. Post hoc pairwise comparisons showed participants in the LD condition had the slowest distractor rejection, followed by HD, SLD, and SHD, all p < .01. However, SLD and SHD did not differ significantly, p = .96. This suggests that both discriminability and lower spatial frequencies improve distractor rejection times.
Figure 7.
Mean time spent fixating targets and distractors in Experiment 2. Error bars indicate SEM.
Target Dwell Time
Means and standard errors for target dwell time can be found in Figure 7. An omnibus ANOVA revealed a main effect of cue type, F (1, 107) = 104.28, p < .001, ηp2 = .49, BF01 < .001, a main effect of condition, F (3, 107) = 23.62, p < .001, ηp2 = .40, BF01 < .001, and an interaction between the two, F (3, 107) = 12.50, p < .001, ηp2 = .26, BF01 < .001. Participants in all conditions dwelled less on the target with a pictorial cue. Post hoc pairwise comparisons showed participants in the LD condition had the slowest target dwell time, followed by HD, SLD, and SHD. All comparisons were significantly different, p < .05, except for the comparison between HD and SLD, p = .96. Paired samples t-tests showed a pictorial advantage was present in all conditions (LD: t (25) = 6.45, p < .001, d = .67, BF 01 < .001, 95% CI [92.18, 178.58]; SLD: t (26) = 3.95, p = .001, d = .27, BF 01 = .02, 95% CI [18.57, 58.86]; HD: t (28) = 2.52, p = .02, d = .22, BF 01 = .35, 95% CI [5.76 55.48]; SHD: t (28) = 8.76, p < .001, d = .46, BF 01 < .001 , 95% CI [50.11, 80.68]), suggesting magnitude differences in the magnitude pictorial advantage likely drove the interaction.
Discussion
In Experiment 2, we manipulated the discriminability and the spatial frequency of the categories to determine if the lack of a pictorial guidance advantage observed in Experiment 1 was due to one or both of these perceptual factors. To do so, we included a replication of the spatial frequency condition from Experiment 1, we increased the discriminability of the stimuli in another condition, lowered the spatial frequency of the stimuli in a third condition, and increased discriminability and decreased spatial frequency in a fourth condition. Importantly, we were able to generally replicate the results from Experiment 1 in the replication condition. In the category learning task, performance was best (as measured by accuracy and RT) with stimuli that had increased discriminability and lower spatial frequency, followed by stimuli with lower spatial frequency, followed by increased discriminability and performance was worst in the replication condition. This generally serves as a manipulation check and suggests that our data patterns are reliable.
The foveal search results largely mirrored the category learning data pattern. Measures of distractor rejection and target dwell time generally produced a pictorial benefit, replicating the results of Experiment 1. One exception to this pattern was observed in search accuracy in which the LD and SLD categorical cues resulted in higher accuracy than the pictorial cues. However, with increased discriminability (HD and SHD), categorical and pictorial accuracy rates were similar. We speculate that this data pattern may arise due to the working memory load required to code the precise visual details from a pictorial cue when discriminability is low (i.e., the representation must be more precise to accurately localize the search target when discriminability is low rather than high). We also found these measures scaled appropriately with the predicted level of difficulty. Generally, the LD condition resulted in the lowest accuracy, longest RT, distractor rejection, and target dwell time. With increased discriminability, lower spatial frequencies, or the combination of both of these manipulations, accuracy generally increased, RT, distractor rejection time, and target dwell time all decreased.
When examining our measure of search guidance, we observed above-chance guidance in all conditions, suggesting sufficient acuity to discriminate categories in peripheral vision. However, we observed a pictorial benefit only in the lower spatial frequency conditions (SLD and SHD) but not in the higher spatial frequency conditions (LD and HD). If the lack of a pictorial advantage were simply due to acuity limitations, the increased discriminability conditions should have produced a pictorial advantage as the larger category differences do not require high acuity. Given that only the low spatial frequency conditions produce a pictorial benefit, this is a clear indication that the pictorial guidance advantage is mediated by low spatial frequencies and likely a coarse-to-fine object processing stream. Importantly, increasing categorical discriminability did improve the level of search guidance relative to the replication condition, but failed to create a pictorial advantage. This suggests an interesting disassociation in which the amount of guidance seems to be unrelated to the presence of a pictorial guidance advantage. This is unexpected because guidance is thought to be driven by the ability to resolve the target in peripheral vision. As the ability to resolve peripheral targets increases, the size of the pictorial benefit and the overall level of guidance would both be expected to increase. However, that is not the case; in this data, the absolute level of guidance was unrelated to the likelihood of observing a pictorial benefit. Category discriminability may be sufficient to guide attention, but the added detail of a pictorial cue may not afford additional guidance beyond a categorical cue.
General Discussion
In this study, we sought to test how universal the pictorial advantage is across feature dimensions. To examine a pure effect of cue specificity, we controlled the variability of categorical representations by limiting our analyses to participants that sufficiently learned the categories determined via model fit. Participants learned to categorize stimuli into two groups then completed a search task, with pictorial and categorical cues. In Experiment 1, category membership was dependent on spatial frequency or orientation. We hypothesized that when orientation distinguished categories, pictorial cues would result in stronger guidance, faster distractor rejection, and faster target dwell times, consistent with previously reported patterns (Yang & Zelinsky, 2009; Schmidt & Zelinsky, 2009). Importantly, we expected the coarse-to-fine object processing to alter search performance in the spatial frequency condition. Given that high spatial frequency discrimination is limited in the periphery and that low spatial frequencies are preferentially used for early object recognition, we hypothesized that search metrics relying on peripheral processing would be negatively impacted. Conversely, search metrics dependent on foveal processing would show a consistent pictorial advantage irrespective of the relevant category dimension.
Whereas pictorial cues generally result in superior search performance, the pictorial benefit in our task was dependent on the feature dimension. When searching for higher spatial frequencies, we did not observe pictorial benefit in search guidance in Experiment 1 or Experiment 2. There was a pictorial advantage in distractor rejection and target dwell time, albeit a smaller benefit relative to the orientation condition. In Experiment 2, we increased the discriminability of the categories, decreased the cycles per degree to generate categories with lower spatial frequencies, or both. This allowed us to test if increased categorical discriminability and/or decreased spatial frequencies would restore the pictorial guidance advantage. Results indicated that the additional information provided by a pictorial cue strengthened search guidance only when spatial frequencies were lower. This is consistent with search guidance and specifically the specificity effect/pictorial advantage being mediated by coarse low spatial frequencies only, possibly due to the speed at which guidance must operate.
One alternative explanation that we have repeatedly discussed is an acuity limitation. We expected that an acuity limitation would affect both pictorial and categorical search similarly. This would result in a main effect of feature dimension and a main effect of cue type, in which pictorial cues universally produce stronger guidance, and higher spatial frequencies universally produce poorer, or no guidance at all. Rather, what we find is an interaction in which the pictorial benefit is selectively eliminated in the higher spatial frequency conditions. One alternative possibility is that improved pictorial guidance may require higher acuity than a categorical representation. We had assumed that search displays separated along category lines would result in similar acuity needs, regardless of the cue condition. Interestingly, this explanation would still require acuity to interact with target specificity in novel ways. Irrespective of this possibility, it is clear that lower frequency information is necessary to observe a pictorial guidance advantage but not to observe an increase in search guidance (i.e. greater discriminability between categories increased guidance but did not create a pictorial advantage). It is unclear how increased discriminability could increase overall guidance without also affording the acuity necessary to create a pictorial advantage.
Instead, these two experiments suggest that increasing target specificity with a pictorial cue does not always result in improved search guidance. Rather, guidance is likely mediated by coarse-low frequency information only, despite having sufficient acuity to distinguish items in the periphery. We observed a pictorial benefit when orientation was the relevant dimension and when spatial frequencies were low, but not when categories existed at higher spatial frequencies. Although higher spatial frequencies do guide search, pictorial cues do not improve that level of guidance beyond what is observed with a categorical cue. It is possible that similar patterns can be observed with other basic visual features or classes of real-world objects, but future work will need to test this interesting possibility. In essence, this is a case study to demonstrate a non-uniformity in the relationship between target representations and search guidance.
Furthermore, these studies highlight a clear dissociation between categorization and search. Previous models have posited that search is merely a cyclical process of guiding attention to a stimulus, followed by categorization processes, repeating until the target is found (Yu et al., 2016). Accuracy and response time in the categorization task was highly similar irrespective of feature dimension but performance in the search task varied extensively. This suggests that the make-up of the search array has a large impact on target detection, rendering the cyclical process insufficient to explain search data.
Interestingly, Experiment 2 showed that the absolute level of categorical or pictorial search guidance is largely unrelated to the existence of a pictorial benefit. When we increased the discriminability of categories, guidance drastically improved, yet we did not observe a pictorial guidance advantage. We argue this results from search guidance being mediated by early coarse, low-spatial frequency information only, much in the same way as object recognition (Bar, 2003). This suggests that despite having the acuity to guide search based on higher spatial frequencies, the additional information provided by a pictorial cue is only beneficial later on in the object recognition process. This raises the interesting possibility that some manipulations may increase the absolute level of search guidance but not afford themselves to a pictorial benefit. Importantly, this suggests that foveal and peripheral processing measures might be expected to interact with target representations in unpredictable ways.
Public Significance Statement: This study demonstrates that the benefit of a pictorial cue is not universal. In some situations, pictorial cues do not improve search performance above what is observed with a categorical cue. This also demonstrates a systematic disassociation between categorization and categorical search.
Open Practices Statement.
The raw data for the category learning task and the search task, for experiment 1 and 2, can be found at Open Science Framework: https://osf.io/ka5mt/?view_only=c8c36ab3718c467486be7b8ae7b7624c
Acknowledgments
Research reported in this publication was supported by the National Eye Institute of the National Institutes of Health under Award Number R15EY029511. The content is solely the responsibility of the authors and does not necessarily represent the official views of the National Institutes of Health. We thank Rosaria Bryan, Waleem Hernandez, Rebecca Koniuszy, Tamar Yishay, Bar Ainuz, Kelsey Podmeyer, Shivam Patel, Rachel Michels, Taylor Nakashima, Megan O’Reilly, Alia Raghunauth, Renee Sahatdijan, Girgis Saleem, Samantha Lopez, and all of the research assistants in the Attention and Memory Lab for help with data collection.
Footnotes
Publisher's Disclaimer: This Author Accepted Manuscript is a PDF file of a an unedited peer-reviewed manuscript that has been accepted for publication but has not been copyedited or corrected. The official version of record that is published in the journal is kept up to date and so may therefore differ from this version.
References
- Alvarez GA, & Oliva A (2009). Spatial ensemble statistics are efficient codes that can be represented with reduced attention. Proceedings of the National Academy of Sciences, 106(18), 7345–7350. 10.1073/pnas.0808981106 [DOI] [PMC free article] [PubMed] [Google Scholar]
- Alfonso-Reese LA (2006). General recognition theory of categorization: A MATLAB toolbox. Behavior research methods, 38(4), 579–583. 10.3758/BF03193888 [DOI] [PubMed] [Google Scholar]
- Ashby FG, Maddox WT, & Bohil CJ (2002). Observational versus feedback training in rule-based and information-integration category learning. Memory & Cognition, 30(5), 666–677. 10.3758/BF03196423 [DOI] [PubMed] [Google Scholar]
- Ashby FG, & Townsend JT (1986). Varieties of perceptual independence. Psychological Review, 93(2), 154. [PubMed] [Google Scholar]
- Bar M (2003). A cortical mechanism for triggering top-down facilitation in visual object recognition. Journal of Cognitive Neuroscience, 15(4), 600–609. 10.1162/089892903321662976 [DOI] [PubMed] [Google Scholar]
- Bennett PJ, & Banks MS (1991). The effects of contrast, spatial scale, and orientation on foveal and peripheral phase discrimination. Vision Research, 31(10), 1759–1786. 10.1016/0042-6989(91)90025-Z [DOI] [PubMed] [Google Scholar]
- Castelhano MS, Pollatsek A, & Cave KR (2008). Typicality aids search for an unspecified target, but only in identification and not in attentional guidance. Psychonomic Bulletin & Review, 15(4), 795–801. 10.3758/PBR.15.4.795 [DOI] [PubMed] [Google Scholar]
- Cleland BG, Harding TH, & Tulunay-Keesey U (1979). Visual resolution and receptive field size: Examination of two kinds of cat retinal ganglion cell. Science, 205(4410), 1015–1017. 10.1126/science.472720 [DOI] [PubMed] [Google Scholar]
- Faul F, Erdfelder E, Buchner A, & Lang AG (2009). Statistical power analyses using G* Power 3.1: Tests for correlation and regression analyses. Behavior Research Methods, 41(4), 1149–1160. 10.3758/BRM.41.4.1149 [DOI] [PubMed] [Google Scholar]
- Fenske MJ, Aminoff E, Gronau N, & Bar M (2006). Top-down facilitation of visual object recognition: Object-based and context-based contributions. Progress in Brain Research, 155, 3–21. 10.1016/S0079-6123(06)55001-0 [DOI] [PubMed] [Google Scholar]
- Filoteo JV, Lauritzen S, & Maddox WT (2010). Removing the frontal lobes: The effects of engaging executive functions on perceptual category learning. Psychological Science, 21(3), 415–423. 10.1177/0956797610362646 [DOI] [PMC free article] [PubMed] [Google Scholar]
- Goffaux V, Peters J, Haubrechts J, Schiltz C, Jansma B, & Goebel R (2010). From coarse to fine? Spatial and temporal dynamics of cortical face processing. Cerebral Cortex, 21(2), 467–476. 10.1093/cercor/bhq112 [DOI] [PMC free article] [PubMed] [Google Scholar]
- Golan T, Bentin S, DeGutis JM, Robertson LC, & Harel A (2014). Association and dissociation between detection and discrimination of objects of expertise: Evidence from visual search. Attention, Perception, & Psychophysics, 76(2), 391–406. 10.3758/s13414-013-0562-6 [DOI] [PubMed] [Google Scholar]
- Goldstein RR, & Beck MR (2018). Visual search with varying versus consistent attentional templates: Effects on target template establishment, comparison, and guidance. Journal of Experimental Psychology: Human Perception and Performance, 44(7), 1086 10.1037/xhp0000520 [DOI] [PubMed] [Google Scholar]
- Henderson JM (1992). Identifying objects across saccades: Effects of extrafoveal preview and flanker object context. Journal of Experimental Psychology: Learning, Memory, and Cognition, 18(3), 521 10.1037/0278-7393.18.3.521 [DOI] [PubMed] [Google Scholar]
- Henderson JM, & Hollingworth A (2003). Eye movements and visual memory: Detecting changes to saccade targets in scenes. Perception & Psychophysics, 65(1), 58–71. 10.3758/BF03194783 [DOI] [PubMed] [Google Scholar]
- Henderson JM, Pollatsek A, & Rayner K (1989). Covert visual attention and extrafoveal information use during object identification. Perception & psychophysics, 45(3), 196–208. 10.3758/BF03194783 [DOI] [PubMed] [Google Scholar]
- Hout MC, Robbins A, Godwin HJ, Fitzsimmons G, & Scarince C (2017). Categorical templates are more useful when features are consistent: Evidence from eye movements during search for societally important vehicles. Attention, Perception, & Psychophysics, 79(6), 1578–1592. 10.3758/s13414-017-1354-1 [DOI] [PubMed] [Google Scholar]
- Hughes AE, Southwell RV, Gilchrist ID, & Tolhurst DJ (2016). Quantifying peripheral and foveal perceived differences in natural image patches to predict visual search performance. Journal of Vision, 16(10), 18–18. 10.1167/16.10.18 [DOI] [PubMed] [Google Scholar]
- Maddox WT, Ashby FG, & Bohil CJ (2003). Delayed feedback effect on rule-based and information integration category learning. Journal of Experimental Psychology: Learning, Memory, and Cognition, 29(4), 650–662. 10.1037/0278-7393.29.4.650 [DOI] [PubMed] [Google Scholar]
- Maxfield JT, & Zelinsky GJ (2012). Searching through the hierarchy: How level of target categorization affects visual search. Visual Cognition, 20(10), 1153–1163. 10.1080/13506285.2012.735718 [DOI] [PMC free article] [PubMed] [Google Scholar]
- Rao RP, Zelinsky GJ, Hayhoe MM, & Ballard DH (2002). Eye movements in iconic visual search. Vision Research, 42(11), 1447–1463. 10.1016/S0042-6989(02)00040-8 [DOI] [PubMed] [Google Scholar]
- Rosch EH, Mervis CB, Gray WD, Johnson DM, Boyes-Braem P (1979). Basic objects in natural categories. Cognitive Psychology, 8(3), 382–439. 10.1016/0010-0285(76)90013-X [DOI] [Google Scholar]
- Sally SL, & Gurnsey R (2003). Orientation discrimination in foveal and extra-foveal vision: effects of stimulus bandwidth and contrast. Vision Research, 43(12), 1375–1385. 10.1016/S0042-6989(03)00119-6 [DOI] [PubMed] [Google Scholar]
- Schmidt J, & Zelinsky GJ (2009). Search guidance is proportional to the categorical specificity of a target cue. The Quarterly Journal of Experimental Psychology, 62(10), 1904–1914. 10.1080/17470210902853530 [DOI] [PubMed] [Google Scholar]
- Schyns PG, & Oliva A (1994). From blobs to boundary edges: Evidence for time-and spatial-scale-dependent scene recognition. Psychological Science, 5(4), 195–200. 10.1111/j.1467-9280.1994.tb00500.x [DOI] [Google Scholar]
- Sugase Y, Yamane S, Ueno S, & Kawano K (1999). Global and fine information coded by single neurons in the temporal visual cortex. Nature, 400(6747), 869–873. 10.1038/23703 [DOI] [PubMed] [Google Scholar]
- Tamura H, & Tanaka K (2001). Visual response properties of cells in the ventral and dorsal parts of the macaque inferotemporal cortex. Cerebral Cortex, 11(5), 384–399. 10.1093/cercor/11.5.384 [DOI] [PubMed] [Google Scholar]
- Vickery TJ, King LW, & Jiang Y (2005). Setting up the target template in visual search. Journal of Vision, 5(1), 8–8. 10.1167/5.1.8 [DOI] [PubMed] [Google Scholar]
- Watt RJ (1987). Scanning from coarse to fine spatial scales in the human visual system after the onset of a stimulus. JOSA A, 4(10), 2006–2021. 10.1364/JOSAA.4.002006 [DOI] [PubMed] [Google Scholar]
- Wolfe JM (1994). Guided search 2.0 a revised model of visual search. Psychonomic Bulletin & Review, 1(2), 202–238. 10.3758/BF03200774 [DOI] [PubMed] [Google Scholar]
- Wolfe JM, & Horowitz TS (2004). Opinion: What attributes guide the deployment of visual attention and how do they do it? Nature Reviews: Neuroscience, 5(6), 495 10.1038/nrn1411 [DOI] [PubMed] [Google Scholar]
- Wolfe JM, Horowitz TS, Kenner N, Hyle M, & Vasan N (2004). How fast can you change your mind? The speed of top-down guidance in visual search. Vision Research, 44(12), 1411–1426. 10.1016/j.visres.2003.11.024 [DOI] [PubMed] [Google Scholar]
- Worthy DA, Markman AB, & Maddox WT (2009). Choking and excelling under pressure in experienced classifiers. Attention, Perception, & Psychophysics, 71(4), 924–935. 10.3758/APP.71.4.924 [DOI] [PMC free article] [PubMed] [Google Scholar]
- Yang H, & Zelinsky GJ (2009). Visual search is guided to categorically-defined targets. Vision Research, 49(16), 2095–2103. 10.1016/j.visres.2009.05.017 [DOI] [PMC free article] [PubMed] [Google Scholar]
- Yu C-P, Maxfield JT, & Zelinsky GJ (2016). Searching for category-consistent features: A computational approach to understanding visual category representation. Psychological Science, 27(6), 870–884. 10.1177/0956797616640237 [DOI] [PMC free article] [PubMed] [Google Scholar]
- Zelinsky GJ (2008). A theory of eye movements during target acquisition. Psychological Review, 115(4), 787 10.1037/a0013118 [DOI] [PMC free article] [PubMed] [Google Scholar]
- Zelinsky GJ, Adeli H, Peng Y, & Samaras D (2013). Modeling eye movements in a categorical search task. Philosophical Transactions of the Royal Society B: Biological Sciences, 368(1628), 20130058 10.1098/rstb.2013.0058 [DOI] [PMC free article] [PubMed] [Google Scholar]
- Zelinsky GJ, Peng Y, & Samaras D (2013). Eye can read your mind: Decoding gaze fixations to reveal categorical search targets. Journal of Vision, 13(14), 10–10. 10.1167/13.14.10 [DOI] [PMC free article] [PubMed] [Google Scholar]
- Zelinsky GJ, & Schmidt J (2009). An effect of referential scene constraint on search implies scene segmentation. Visual Cognition, 17(6-7), 1004–1028. 10.1080/13506280902764315 [DOI] [Google Scholar]