

Introduction
The mammalian somatosensory system responds to mechanical, thermal and chemical stimuli to provide valuable sensory information about both the environment and the internal physiological state [19;47;53]. The sensory neurons of the trigeminal and dorsal root ganglia (DRG) are the primary somatosensory receptors, innervating the periphery and transmitting signals to the central nervous system. Recently single cell (sc) and single nuclear (sn) sequencing have defined an array of somatosensory neuronal classes and confirmed extensive similarity between these ganglia [7;13;24;31;32;42;48]. Some of these classes correspond to cells that have been previously targeted genetically as they are defined by individual functional markers [3;11;27]. Such experiments support the idea that genetically defined neural classes have distinct and specific roles [17;37]. However, other transcriptomic classes are only distinguished by complex patterns of gene expression [7;13;24;31;32;42;48]. Moreover, these diagnostic genes tend to have less clear function in sensory detection raising questions as to the significance of transcriptomic class and their selectivity in somatosensation. A problem with sc-sequencing is that cell isolation destroys information about the in vivo system. Consequently, it has been difficult to explore how neural class is related to anatomical features of the cells including their projection patterns.
Single cell sequencing of other neuronal populations has also vastly expanded the view of their diversity by exposing a complex array of new transcriptomic classes [46;51]. Just as in the somatosensory system, mapping the anatomical organization of these molecularly defined neural classes is a fundamental challenge. To address these inherent challenges, several groups have developed related in situ hybridization (ISH) based methods [6;30;41;49] that are effective at determining the cellular expression of many genes. These methods appear very powerful but require investment in probes and equipment as well as high resolution imaging, precise alignment and processing of massive datasets, limiting their widespread use. On the other hand, similar methods can be applied to a much smaller number of transcripts simplifying both methodology and analysis. For example, Spatial Genomic Analysis was developed to map cells in developing neural crest [25] by localizing just 35 genes. Similarly, a single cell qPCR method has been used to classify somatosensory neurons using 28 genes [1]. Therefore, we reasoned that an even smaller number of highly expressed transcripts selectively marking partially overlapping sets of scRNA-defined cell-classes might mean that multicolor ISH, low resolution imaging and just a few repeat cycles could be used to economically project transcriptomic classification of cells to anatomical sections as a means to test and extend predictions from scRNA-sequencing.
Here, we developed and refined this ISH-based approach to probe how neural diversity in the somatosensory system might orchestrate sensory discrimination and elicit select behavioral responses. To simplify analysis of the data and to make this type of strategy applicable to similar problems in other systems [46;51], we developed a powerful U-Net machine learning algorithm that automatically segments cells and assigns their classes. We then used this platform to characterize critical features of trigeminal sensory neurons including determining ion-channel expression profiles and examining peripheral targeting.
Material and Methods
Probe selection and validation
Single cell RNA sequence data [32] analyzed using the Seurat package developed in the Satija lab [40] was used to identify probes of multiplexed ISH. Potential probes were selected from genes that were prominent in the principle components used for clustering and were tested for their power at distinguishing trigeminal neural classes by analyzing their expression profiles in the sc-data. Criteria for probe selection included sharp boundaries in expression between classes, high level of expression in positive cells and expression in a large proportion of cells that made up a positive class. The fifteen probes chosen, provided redundancy for identification of most neural classes (Fig. 1a) but only a small number of markers with potential to segregate some groups e.g. C1 from C2 or C9 from C10 could be identified.
Figure 1. Approach for projecting transcriptomic class onto anatomical tissue sections.
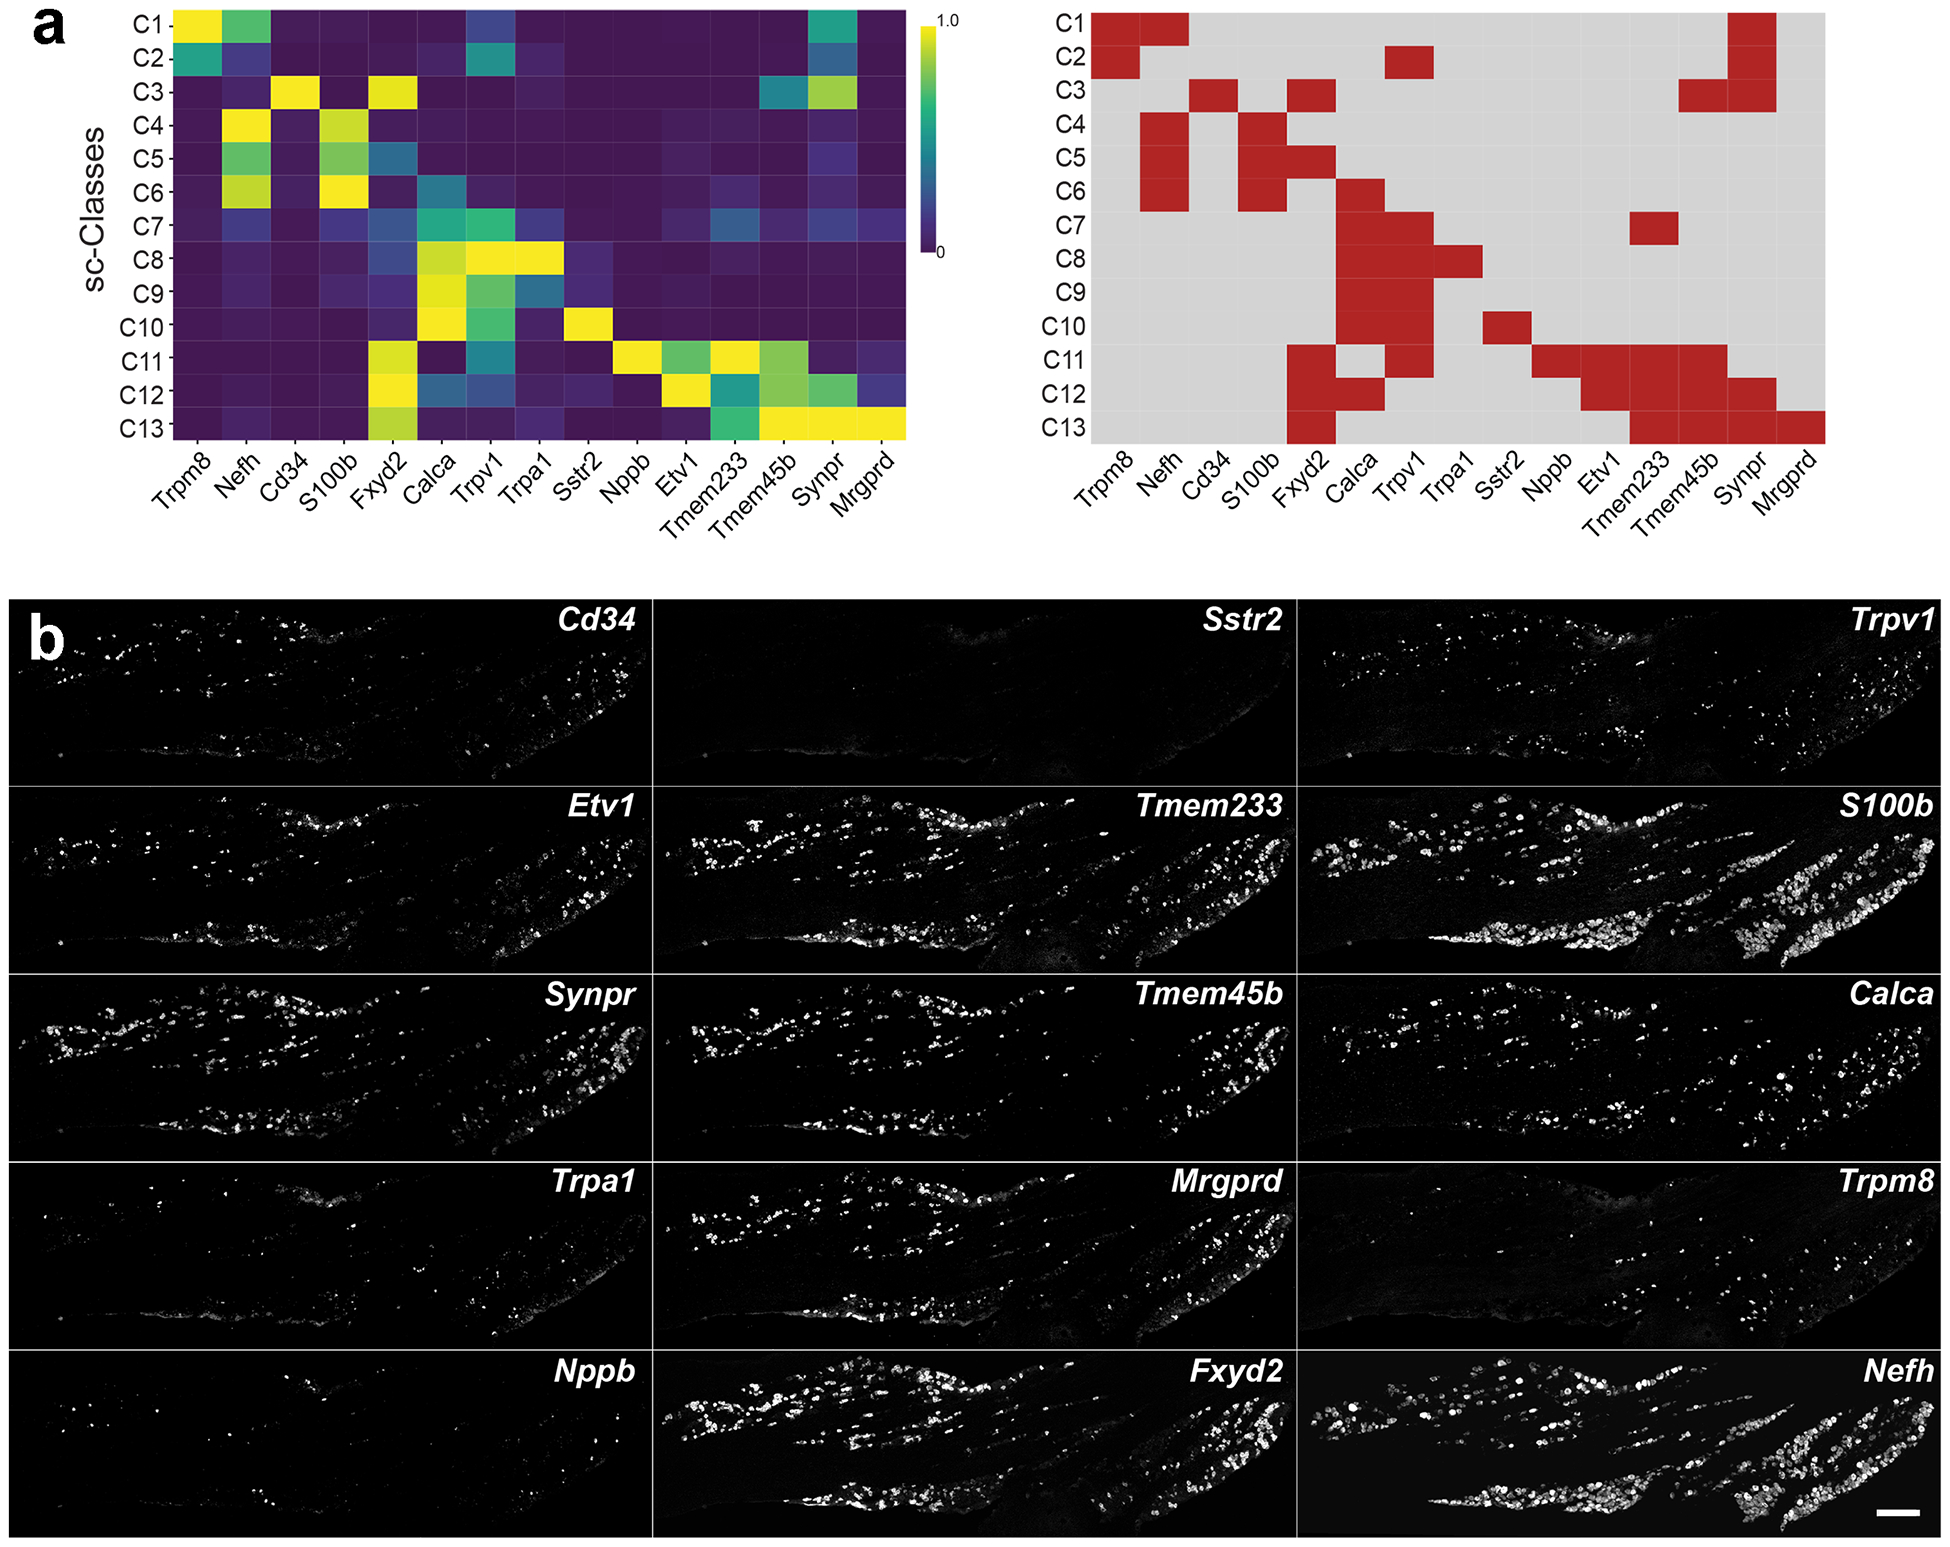
(a) Left, average expression levels of diagnostic markers in scRNA sequence analysis [32]; genes are: Transient receptor potential cation channel subfamily M (melastatin) member 8 (Trpm8), Neurofilament heavy (Nefh), the transmembrane phosphoglycoprotein Cd34, S100 calcium-binding protein B (S100b), FXYD Domain Containing Ion Transport Regulator 2 (Fxyd2), Calcitonin related polypeptide alpha (Calca), Transient receptor potential cation channel subfamily V member 1 (Trpv1), Transient receptor potential cation channel, subfamily A, member 1 (Trpa1), Somatostatin receptor 2 (Sstr2), Natriuretic polypeptide B (Nppb), ETS translocation variant 1 (Etv1), Transmembrane protein 233 (Tmem233), Transmembrane protein 45B (Tmem45b), Synaptoporin (Synpr) and Mas-related G-protein coupled receptor member D (Mrgprd). Right, a simplified binary analysis of their expression (red, positive; grey, negative) highlights their potential to combinatorially define trigeminal neural classes. (b) Images from three rounds of multiplexed ISH for a single section of a trigeminal ganglion from an FVB/N mouse are shown; the 5 probes used in each round of hybridization are displayed vertically. Note that for 14 probes clear positive and negative cells were identified; scale bar: 250 μm.
Mice and retrograde tracing
Animal experiments were carried out in strict accordance with the US National Institutes of Health (NIH) guidelines for the care and use of laboratory animals and were approved by the NIDCR or NINDS ACUCs. C57BL/6N and FVB/N mice were purchased from Harlan. Mas-related G-protein coupled receptor member A3 (Mrgpra3)-Cre mice [17] were crossed to Ai14 tdTomato reporter mice (Jackson Labs). Both male and female mice were used for experiments.
Wheat germ agglutinin (WGA) coupled to Alexa594 (Invitrogen) was injected into various target fields to retrogradely label trigeminal neurons from their terminal processes. All labeling procedures used WGA-Alexa594 at 1 mg/ml; mice were anesthetized with isoflurane. To label the eye, the cornea was first abraded with a beveled 30 g syringe needle; 0.5 – 1 μl WGA-Alexa594 was applied. To label the meninges, a midline incision into the skin allowed exposure of the skull, six 1 mm holes were drilled into the dorsal skull without perforating the meninges. Wells were built around each craniotomy with dental cement; 2 × 0.5 μl WGA-Alexa594 was applied to each well. Craniotomies were sealed with coverslips and dental cement and the skin incision was closed and sutured. In all cases, animals were euthanized 16–20 hours after WGA-Alexa594 application and trigeminal ganglia dissected.
WGA-Alexa594 fluorescence was imaged in ISH-imaging buffer using 594 nm laser stimulation and a 9 nm wavelength scan, which helped separate signal from broader autofluorescence of the tissue. Slides were washed 3 times in 2x SSC and processed further for ISH.
In situ hybridization
Hybridization chain reaction (HCR) version 3.0 [8] was used for all ISH. Buffers and probes against the mouse genes Cd34, Sstr2, Trpv1, Etv1, Tmem233, S100b, Synpr, Tmem45b, Calca, Trpa1, Mrgprd, Trpm8, Nppb, Fxyd2, Nefh, Piezo2, Tubb3, sodium channel protein type 1 subunit alpha (Scn1a), sodium channel protein type 8 subunit alpha (Scn8a), sodium channel protein type 10 subunit alpha (Scn10a), sodium channel protein type 11 subunit alpha (Scn11a) and against Cre recombinase and tdTomato (tdT) were purchased from Molecular Instruments as a mix of 10 or more oligonucleotide pairs per probe.
Trigeminal ganglia dissected from 2 – 6 months old C57BL/6N or FVB/N mice were embedded in optimal cutting temperature medium and frozen at −80 °C. 20 μm sections were cut along a horizontal axis through the ganglion and mounted on microscope slides. Sections were dried (1 h on a 37 °C hotplate), were fixed in on ice for 15 minutes 4% paraformaldehyde (Electron Microscopy Sciences) in phosphate buffered saline (PBS) and then were washed 6 times in PBS. Slides were dehydrated in an ethanol series (50%, 70%, 100%, 100% for 5 minutes each) and stored for up to one week. This preparation resulted in excellent retention of sections through multiple rounds of hybridization and detection of probes but was not specifically optimized for preservation of signal.
Slides were dried completely, washed 3 times in PBS, and pre-hybridized for 30 minutes at 37 °C in HCR hybridization solution (Molecular Instruments). Hybridization and amplification were performed as described previously [8] with minor modifications. Hybridization typically used 5 probes with adapters B1 - B5 at a concentration of 4 nM per probe in Coverwell incubation chambers (Grace Biolabs) and was carried out for 48 – 72 h at 37 °C. Washing and preparation of amplifier hairpins for adapters B1 - B5 conjugated to Alexa488, Alexa514, Alexa561, Alexa594 and Alexa647 was as described by the manufacturer. Amplification was carried out in a Coverwell chamber for 12 – 16 h at room temperature in the dark. Slides were washed 2 times for 15 minutes in 5 × saline sodium citrate (SSC) containing 0.1% Tween 20 and cover-slipped in Imaging Buffer (3 U / ml pyranose oxidase, 0.8 % D-glucose, 2 × SSC, 10 mM Tris HCl pH 7.4).
After imaging, sections were rinsed in 2 × SSC, and DNA probes and amplifiers were removed by incubation in 250 U / ml RNase-free DNase (Roche Diagnostics) for 90 minutes at room temperature. Sections were washed 6 times (5 min in 2 × SSC) and pre-hybridized for the next round of hybridization with the next 5 probes. This procedure was repeated for up to 4 rounds of hybridization.
Confocal imaging and signal unmixing
Imaging was carried out using a Zeiss LSM 880 confocal microscope with spectral detector using a 10x/0.45NA air objective with the pinhole opened to 132.9 μm to allow capture of the whole section and provide enough signal intensity at this comparatively low magnification. Alexa647 was stimulated with a 633 laser and emission was collected from 644–752 nm. Alexa546 and Alexa594 were stimulated with 561 and 594 lasers respectively and wavelength scans with 9nm windows were collected to allow unmixing signals from different fluorophores. To resolve Alexa488 from Alexa514, sequential wavelength scans with 3 nm windows were performed while stimulating with a 488 nm laser. Spectral unmixing was performed using Zeiss ZEN software.
Image series from consecutive hybridizations were combined by manually aligning transmitted light images from each imaging session using the TurboReg plugin in ImageJ/Fiji.
Unsupervised clustering of manually outlined cells
Data processing including the supervised versus unsupervised steps is schematically described in Fig. S1. As a starting-point, cell regions of interest (ROIs) in 4 complete ganglion sections were manually outlined in ImageJ (based on the individual ISH images) and mean fluorescence for each cell and probe was extracted using custom ImageJ macro scripts. Further processing was done using Python scripts: for subsequent clustering, local background in a ring around the cell was subtracted and the resulting values were standardized to mean 0 and variance 1 for each probe within a whole tissue section typically containing 1500 – 2000 cells.
The dimensionality of the data was then reduced from the 13 relevant probes (Cd34, Trpv1, Etv1, Tmem233, S100b, Synpr, Tmem45b, Calca, Trpa1, Mrgprd, Trpm8, Nppb, Fxyd2) to a 2- dimensional representation by t-stochastic neighbor embedding (tSNE). Cells clusters were identified using a density-based algorithm (https://github.com/alexandreday/fast_density_clustering) and mapped to the clusters derived from single cell sequencing based on their average expression of marker genes (see Fig. S1 for details).
Automatic detection of cell classes using supervised Deep Learning
To automatically detect cell classes in tissue section images, we performed semantic segmentation by designing a custom Fully Convolutional Neural Network that follows the popular U-Net architecture [38]. Several network designs and hyperparameters such as numbers of layers, learning rate, dropout rate, final activation function and loss function were evaluated before settling on the final model.
The multichannel ISH input image data was first tiled into 256 × 256 images, standardized to mean 0 and variance 1 for each probe channel and divided into training (96 images) and validation data (48 images). The desired output masks were generated as multi-hot encoded images (11 channels for 10 classes and background) from the hand-annotated ROIs and the cell class assignment from unsupervised clustering. To improve training performance, the available input data and their corresponding cell class masks were augmented by rotation and flipping. The final model closely mirrors the original U-Net architecture and contains 5 downward convolutional blocks with 2 layers each and 4 corresponding symmetric blocks for up-convolution. Image resolution was reduced to half in each consecutive block and number of channels was doubled starting from 16 in the first block. The output was a 256 × 256 × 11 matrix calculated by a softmax activation layer. The categorical cross-entropy loss function was optimized with an Adam optimizer at a learning rate of 0.0005 to convergence on the validation loss (~120 epochs).
In order to achieve good class separation with the minimal number of hybridizations, we trained a model that takes 8 channels (Tmem233, S100b, Calca, Trpa1, Mrgprd, Trpm8, Nppb, Fxyd2) as an input. This model was validated and used to predict cells and their classes in WGA tracing experiments. To determine cell class identity of manually outlined WGA-labeled cells, the mean probability for each cell class was calculated for the ROI and the most probable cell class was assigned to the cell. Cells with a maximum class probability of less than 0.1 were kept unassigned. Rare retrogradely labeled cell classes (< 5 % from any target site) were manually inspected and corrected on a cell by cell basis.
To automatically segment cells, probability predictions for each class were first blurred with a Gaussian filter (3×3 kernel) and discretized by choosing the most probable class for each pixel. After morphological opening of the foreground classes with a 6×6 circular kernel, cells were segmented by a distance transform watershed algorithm.
Expression level of sodium channels was determined automatically by measuring signal intensity in segmented and classified cells. For comparison purposes, violin plots of channel expression in sc- and sn-data [31;32] were generated. This representation is particularly useful for analyzing sparse transcriptomic data because it eliminates extremes (primarily from the zero values) thereby providing a valuable representation of gene expression across classes. The ISH data is not of this form, with no true zero value; we therefore calculated the relative standardized expression levels (mean = 0, variance =1) and used a histogram representation to approximate the violin plot of the transcriptomic data.
All computations were done either in Python using Keras/Tensorflow, sklearn, Numpy, Pandas, skimage, opencv and scipy libraries or in custom ImageJ macro scripts. All code is available in Github (https://github.com/lars-von-buchholtz/InSituClassification).
Results
Development of an ISH approach for classifying trigeminal neurons
scRNA sequencing of trigeminal neurons defined about a dozen neuronal classes that closely matched classes identified by transcriptomic analysis of DRG neurons [32]. More recent sn-analysis [31] distinguished most of the same cell populations but further subdivided classes of putative large diameter neurons, which were much more prominently represented in this study. However, some of the diversity amongst nociceptors was not observed in the nuclei-based sequencing. Thus only 10 of the 13 classes directly corresponded between studies. Here, we developed a simple, robust approach for mapping trigeminal neural classes to cells in tissue sections to expose their anatomical features including their distribution and projection targets as well as test predictions from these transcriptomic studies.
As a starting point, we carried out quantitative ISH using an array of 15 genes that we predicted should, in combination, identify all the sc-sequence defined classes. The chosen marker genes featured prominently in the dimensional reduction (principal components) used in the scRNA-sequence cluster analysis. In the single cell data, each of these genes is present in a distinct subset of trigeminal neural classes. Importantly, the chosen transcripts were generally very good markers of the clusters where they were present, i.e. because they were highly expressed genes, we were confident of their presence in the vast majority of cells whereas they were essentially absent from other types of neuron (Fig. 1a). Thus, the combinatorial expression pattern of these transcripts would be expected to allow trigeminal neural classes to be reliably distinguished, providing a framework for classifying cells in situ and a straightforward approach for testing predictions from the transcriptomic analyses.
Using the well characterized HCR protocol [8], we performed three rounds of 5 probe in situ hybridization and used spectral unmixing to resolve specific signals from the 15 diagnostic probes (Fig.1b). The HCR approach has the sensitivity and resolution to detect single transcripts when sections are imaged at high resolution [8;41]. Importantly, however, for studying genes that are highly expressed in subsets of neurons, we could use lower magnification imaging, saving time and reducing the complexity of data processing as well as maximizing the number of cells analyzed. Such integrated HCR signals have been shown to accurately quantify the relative expression level of a transcript between cells [8] and thus served to quantitate the diagnostic genes at a cellular level. It should be noted, however, that higher resolution imaging is also possible and may be useful for genes with lower expression level.
Fourteen of the fifteen probes clearly differentiated positive from negative cells but the probe to Sstr2 was not diagnostic at this magnification (Fig. 1b), thus clusters C9 and C10 cannot be resolved. These clusters also failed to segregate in sn-analysis [31] and few other distinguishing markers could be identified from the sc-data. Therefore, it is likely that C9 and C10 are broadly similar types of cells. In the future, higher resolution imaging and use of additional marker genes as well as increasing the gene coverage of the Sstr2-probe set may help resolve these two classes of neurons, which can be distinguished in transcriptomic analysis of DRG-neurons [24;42;48].
ISH images from the fourteen diagnostic probes could be aligned by simple translation and rotation (Fig. S2a). After alignment, the ISH data (Fig. 1b) are equivalent to 91 different double-label experiments (Movie S1) or 364 combinations of three markers applied to a single section. At the most basic analytical level, almost all the pairwise expression patterns that were predicted (Fig. 1a) were detected by ISH (Movie S1). However, the expected division of Trpm8-expressing cells into groups expressing or not expressing Nefh (Fig. 1a), was graded rather than binary (positive versus negative, see Fig. S3a). Although we might be able to divide two classes of Trpm8-neurons by thresholding Nefh-expression, this seemed arbitrary and subject to error. Thus, the Nefh-based ISH approach does not reliably distinguish classes C1 and C2. Interestingly, although this split was predicted by the cell-based analysis [32], it was not seen in nuclei-based sequencing [31]. A second distinguishing marker that was predicted to divide the C1 and C2 clusters in the sc-analysis [32], encodes the neuropeptide galanin (Gal). We therefore tested whether Gal expression subdivides the Trpm8-positive neurons into two groups using ISH (Fig. S3b). Our results indicated that Gal is not co-expressed with Trpm8 (Fig. S3b), again matching sn-data. Therefore, the ISH data indicate that variation amongst Trpm8-cells is more continuous that we had originally predicted [32] supporting more recent results [31], which indicate that these neurons although not homogeneous, in fact comprise a single transcriptomic class with graded expression differences between the cells.
Classifying trigeminal neurons in manually segmented sections defines transcriptomic class
Trigeminal sections from 4 mice were analyzed by multiplexed ISH and neurons were manually segmented to measure the cellular expression of marker genes. For three of these animals, the non-diagnostic probes for Nefh and Sstr2 were replaced with probes for other genes including neuronal β-tubulin (Tubb3, a pan-neuronal marker), providing a means to identify all somatosensory neurons in the sections. After alignment of images, all neurons in the sections were manually segmented using the signal in the 15 different ISH channels as a guide. The cellular expression levels of the thirteen diagnostic markers in these manually segmented cells were determined based on signal intensity (see methods for details). The resulting 13-dimensional expression data were subjected to t-distributed stochastic neighbor embedding (tSNE) followed by density-based cluster identification to classify neurons (Fig. 2a). The relative expression of each marker gene at a cellular level in the classified neurons is shown (Fig. 2b) highlighting a close match with predictions (Fig 1b) for ten trigeminal neuronal classes. Importantly, these classes of neurons match those that were detected in both the cell and nuclear-based analyses [31]. Nonetheless, cells with an expression profile corresponding to an eleventh class C7 that was only identified in the sc-study [32], expressing Trpv1 and Tmem233 but not Tmem45a, (Fig.1b) were also found using ISH (Fig. S3c). However, these neurons were rare and did not separate from C9/10 cells in the cluster analysis (Fig. 2).
Figure 2. Multiplexed ISH based classification of trigeminal neurons.
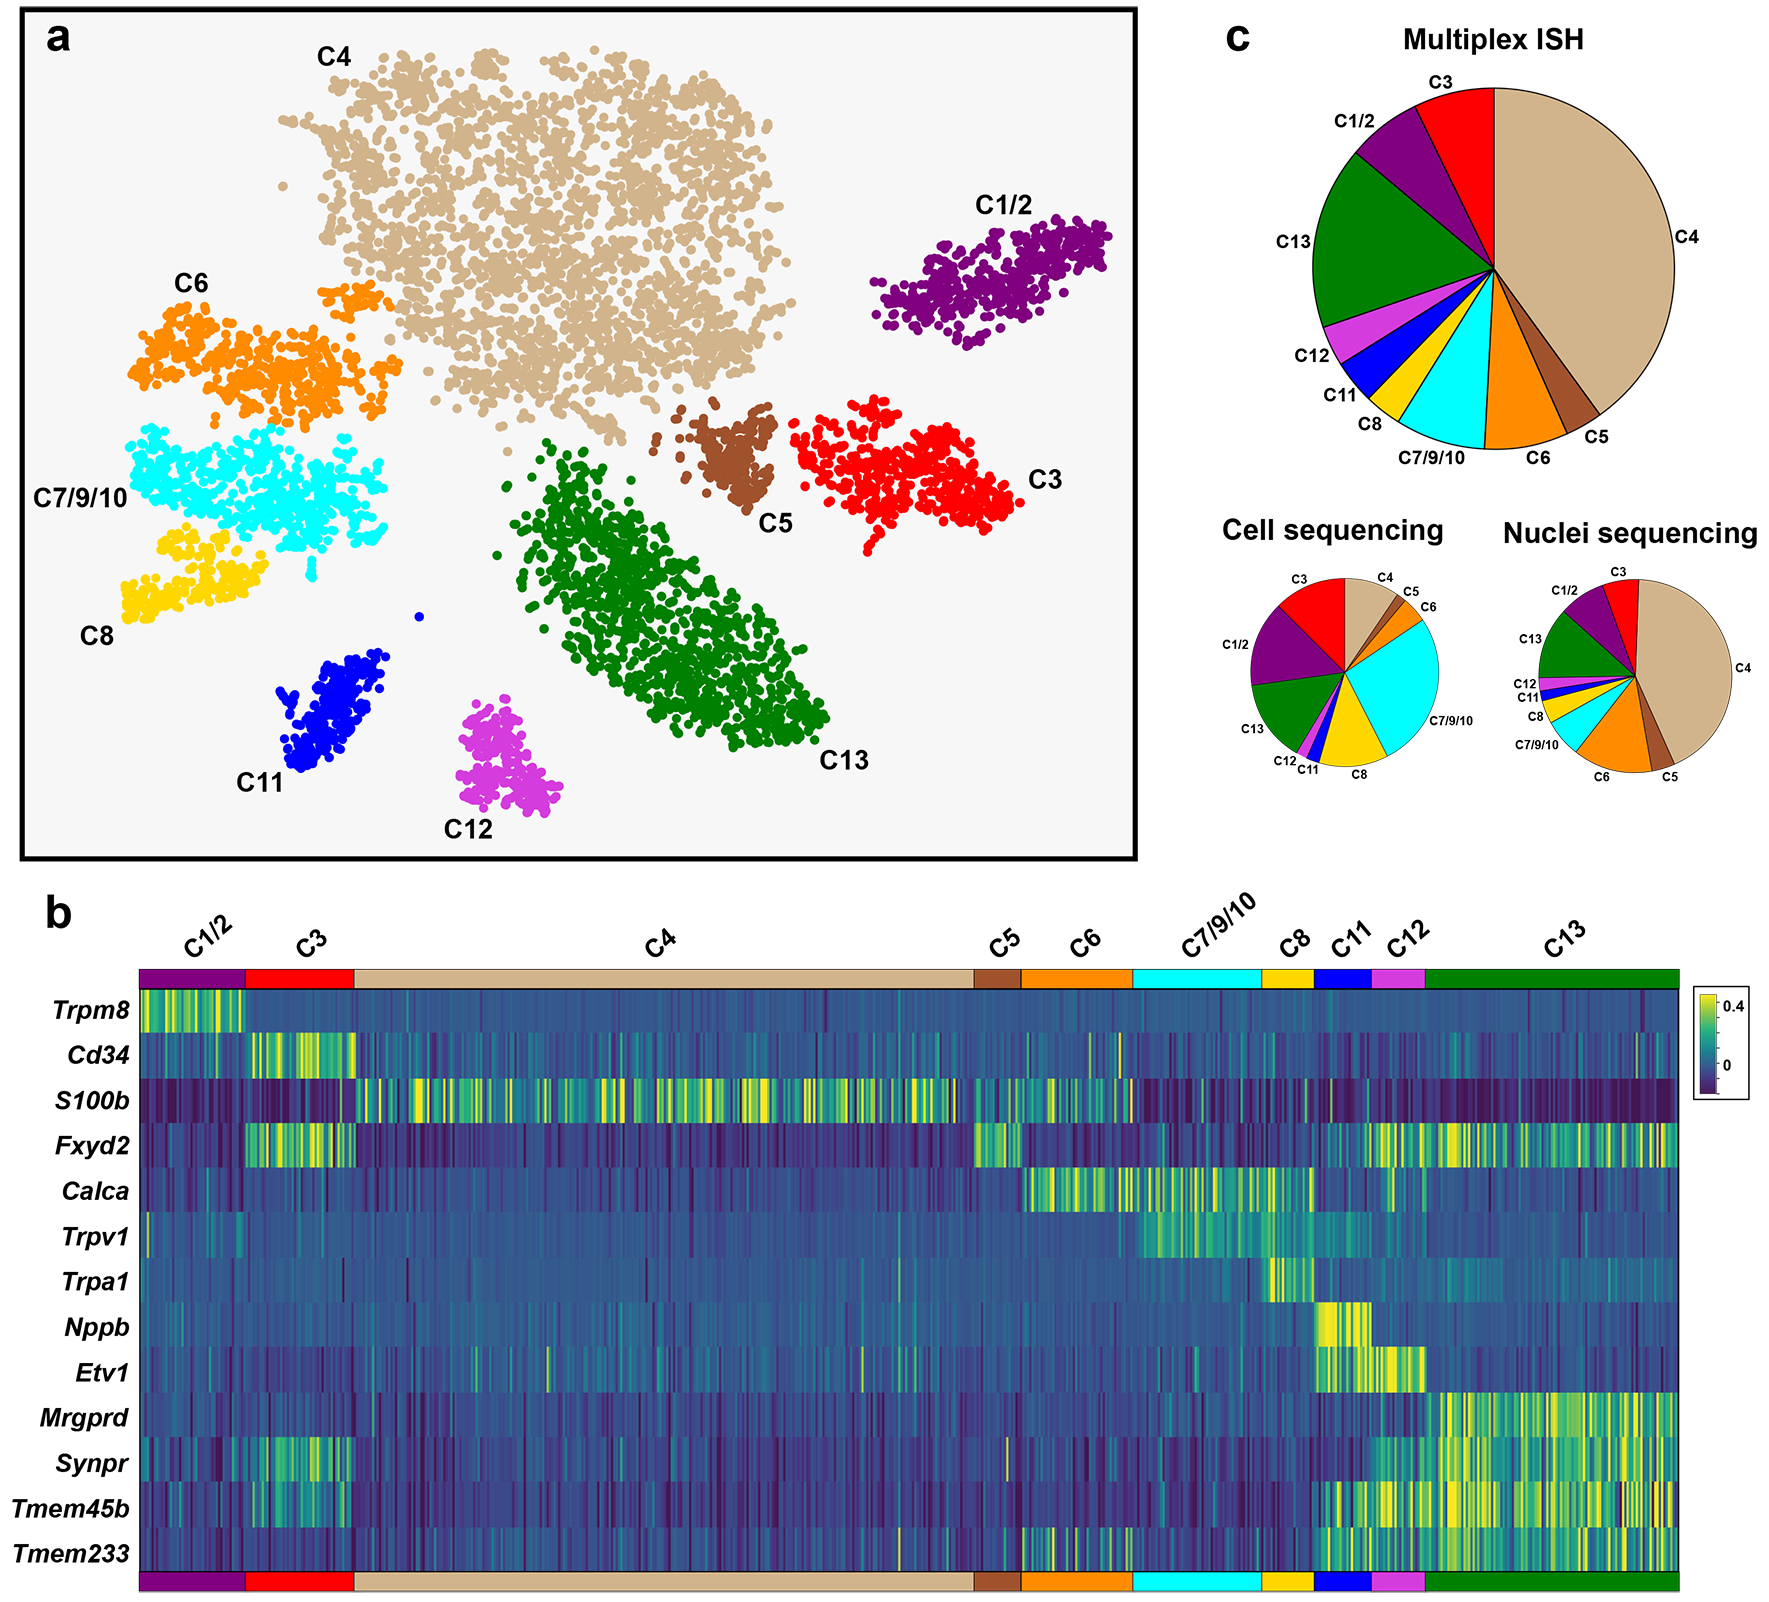
Sections through trigeminal ganglia from four mice were subjected to multiplex ISH. Neurons from a single section for each mouse were manually segmented to measure ISH signal intensity at a cellular level. (a) tSNE-representation and cluster analysis of ISH data for 13 probes showing that this approach segregated neurons into 10 groups. The correspondence of these groups with scRNA sequence defined transcriptomic classes (C1-C13) is indicated. (b) ISH signal intensity at a cellular level in the 7735 neurons; cells were ordered according to their cluster assignment with each vertical bar representing a different cell. (c) Pie charts comparing the proportions of trigeminal neurons assigned by class for multiplex ISH data, sc- and snRNA sequencing; note that cell sequencing under-represents large diameter neuronal classes C4-C6 relative to other cells.
Quantitative analysis of ISH based clustering revealed a high degree of consistency in representation of neural classes between sections from different mice (Fig. S4). Therefore, we are confident that distribution of neural classes (Fig. 2c) is representative of the ganglion as a whole. Notably, the combined ISH patterns of the thirteen diagnostic probes and the expression of the pan-neuronal marker Tubb3 were almost identical (Fig. S5a), confirming that the vast majority of trigeminal neurons were included in our classification. Thus, the multigene hybridization approach demonstrates the existence of at least eleven of the thirteen types of trigeminal neuron predicted by scRNA sequencing [32] and reveals their true representation in the ganglion.
Although primarily designed to identify the transcriptomic class of neurons in anatomical sections, the redundancy inherent in the probing strategy (Fig. 1a) meant that it could also be used to search for rare unexpected patterns of co-expression. In contrast, to single cell transcriptomic data where dropout and contamination generates ambiguity, the ISH approach allows an explicit check by visual examination. For instance, a small proportion of C6 neurons expressed the heat and capsaicin activated ion-channel Trpv1 (Fig. S5c). This expression profile likely identifies this group of neurons as the Aδ-thermal nociceptors that have been reported to trigger rapid, Trpv1-dependent, withdrawal from noxious heat [28]. Importantly, these Trpv1, Calca, S100b-positive cells that were not directly identified in single cell analyses [7;13;24;31;32;42;48] are predicted to play a distinct functional role from other C6 neurons.
A machine-learning based approach for segmenting neurons and assigning cell class
Although the manual segmentation approach (Fig. 2) allows classification of cells in tissue sections, it is slow and defining the cell boundaries is often somewhat subjective. Therefore, we reasoned that automation would greatly increase throughput, decrease bias and thus provide a versatile platform for answering questions about gene-expression and neuronal connectivity in the trigeminal ganglion.
Ideally, we wanted to develop a procedure that could take unprocessed aligned ISH images, define cell boundaries and assign transcriptomic class without relying on additional input about cell shape. Unfortunately, traditional methods used in automated segmentation [35] were not suitable for the ISH images where signal had variable intensity across positive cells and was often overlapping between neighboring cells as well as regionally localized with perinuclear versus cytoplasmic staining for different probes (Fig. 1b). However, since each ISH image contains both information about cell structure as well as gene expression, we predicted that the combined images might define both cell boundaries and neuronal transcriptomic class. Therefore, instead of segmenting individual cells, we set out to develop a custom semi-supervised Deep Learning algorithm using a fully convolutional Neural Net based on the U-Net architecture [38]. This approach uses the aligned individual ISH images as input and calculates the probability of each pixel being one of the ten major classes (or non-neuronal, i.e. not one of these classes; see Fig. S1 for a schematic description of all data-processing). The Neural Net was trained on the manually outlined (supervised) cells that were assigned a class based on the unsupervised clustering described above (see Methods for details). Although we began by using the full dataset, we realized that just a subset of the 13 genes (Trpm8, S100b, Fxyd2, Calca, Trpa1, Nppb, Tmem233 and Mrgprd, see Fig. 1a, Fig. S1) should be sufficient to define the 10 neural classes that were distinguished in the manually segmented cells (Fig. 2) and here report results based on this 8-gene panel.
Just as we had hoped, the Neural Net transformed the ISH data of this 8-gene probe-set into images where cells and their classes were immediately recognizable (Fig 3a). Indeed, cells were now easily segmented (Fig. 3b) using a standard watershed approach. Some of the ISH data, including the images shown (Fig. 3) had been manually segmented (revealing the “ground truth”) but had not been used to train the U-Net algorithm. The reliable segmentation and classification of neurons these test sections of the trigeminal ganglion (Fig. 3b, Table 1) validate the automated Deep-Learning approach; at a pixel level the prediction displayed an accuracy of approx. 95 %. One minor concern is that the neural net approach led to some distortion of cell size and shape that was most pronounced in areas where neurons were densely packed and ISH signals partially overlapped. This makes it difficult to assess how cell diameter varies across the various classes but does not alter conclusions about cellular identity (Table 1). Importantly, as demonstrated by comparing the combined predictions with Tubb3 expression (Fig. S5b), we found that almost all neurons were classified by the U-Net algorithm. Equally importantly, non-neuronal regions were also accurately reported. Notably, minor modifications to the code would make this U-Net based strategy generally applicable for analyzing other types of complex image-based datasets. Thus, we envision that analogous multiplexed ISH or antibody-based approaches coupled with automatic classification of cells could be easily adapted to other sc-datasets and serve as a simple platform for mapping cell class to anatomical sections.
Figure 3. Classification of neurons from ISH images using machine learning.
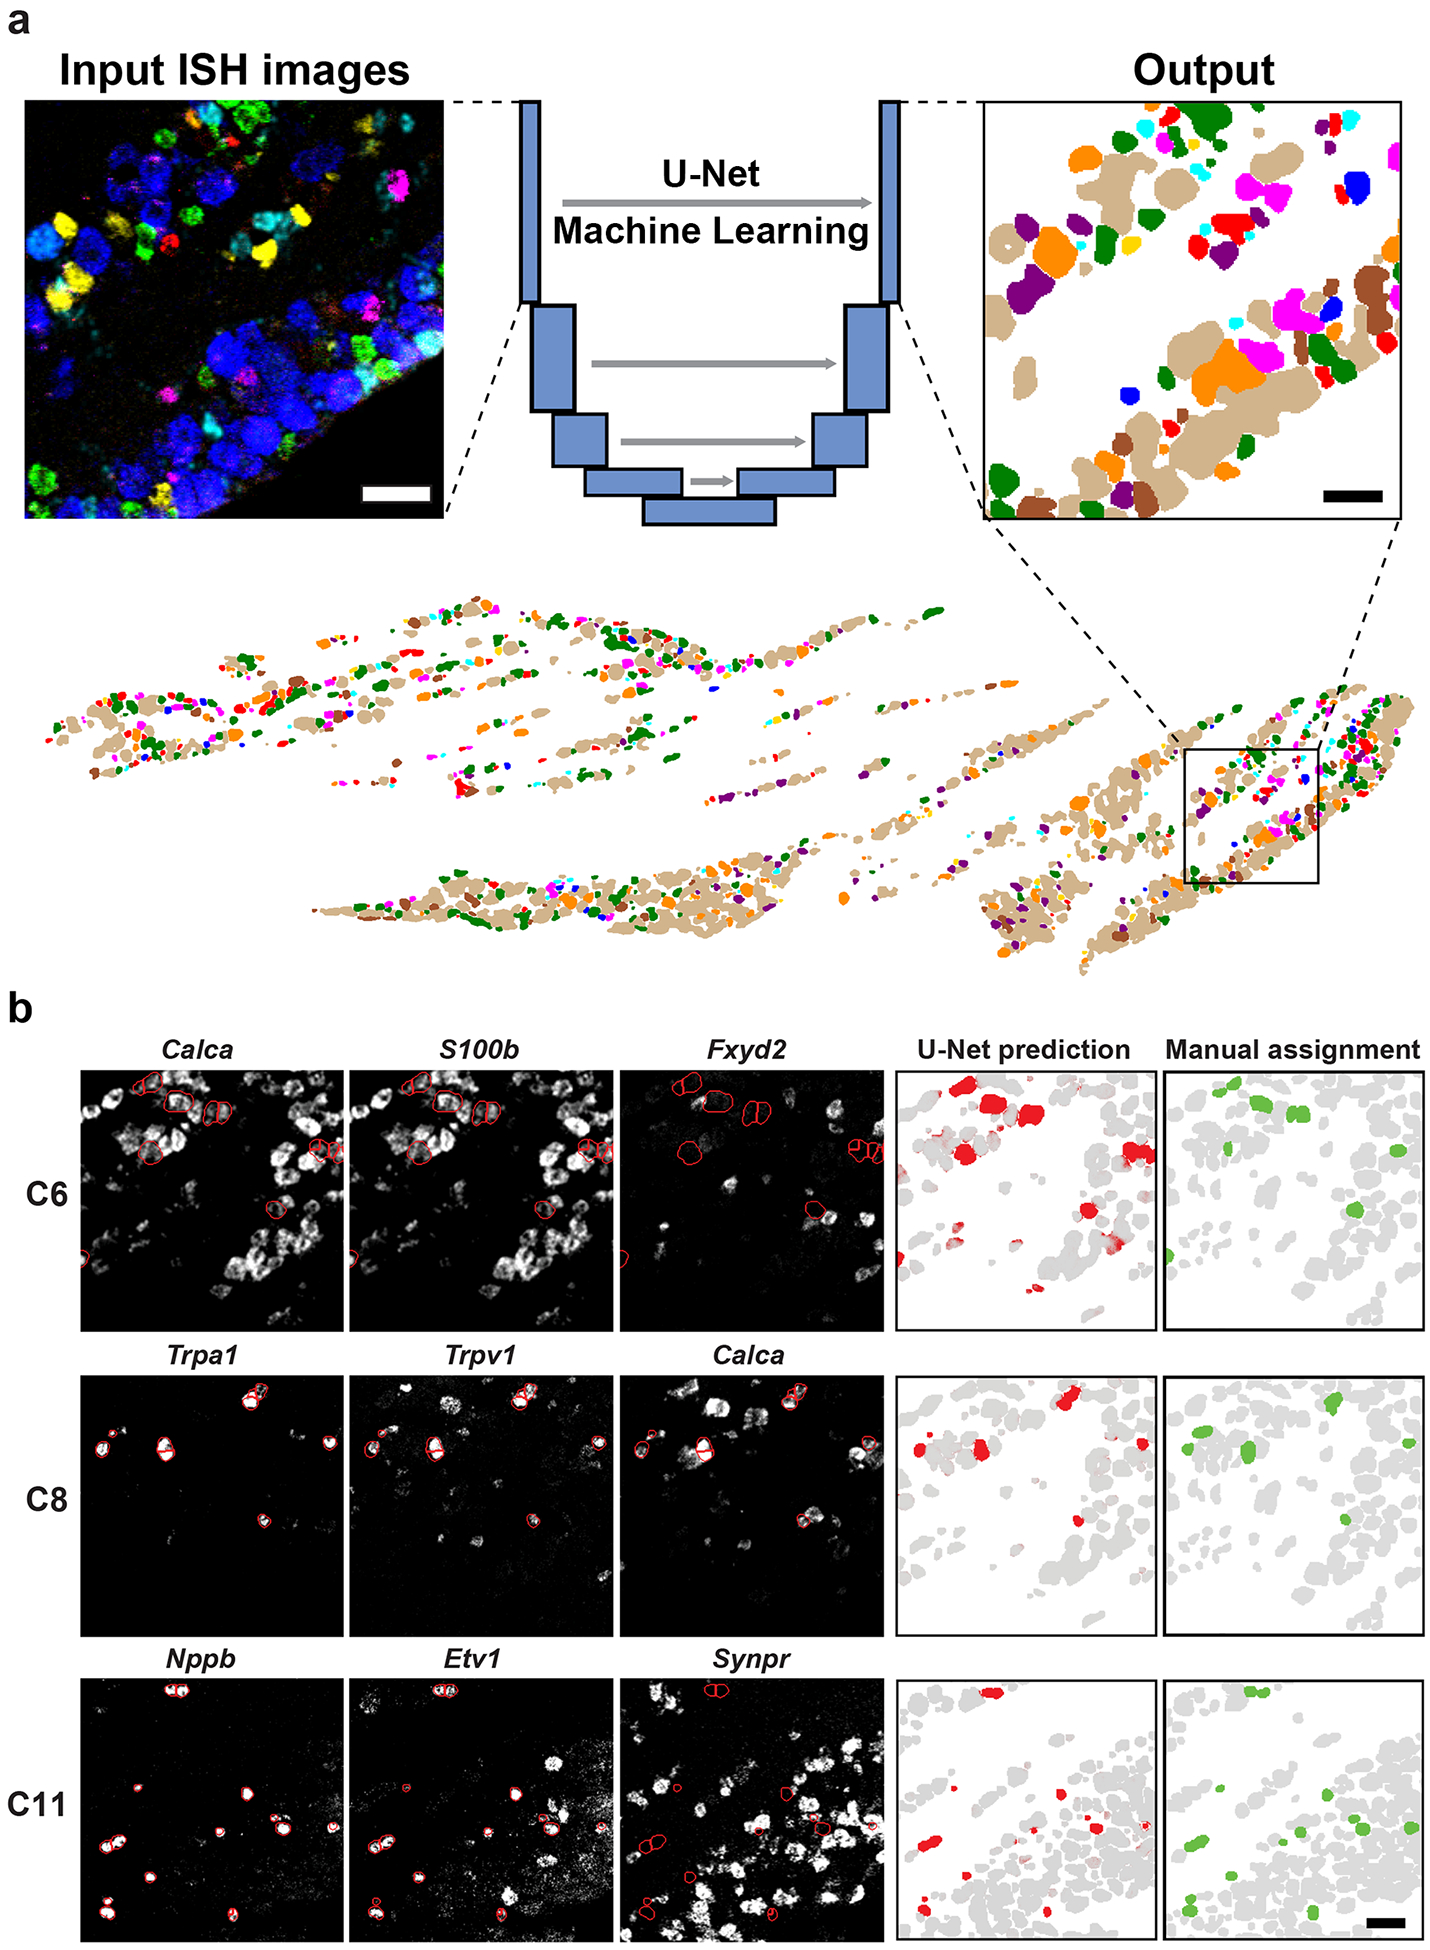
A U-Net Deep Learning algorithm was developed and trained to classify neurons directly from multiplexed ISH images. (a) Example of ISH image input to the U-Net (left panel, 6 non-overlapping probes shown) and the corresponding output (right panel, colored as in Fig. 3). The full ganglion prediction (lower panel) corresponds with the ISH images shown in Fig. 2. (b) Example predictions for 3 classes of trigeminal neurons. Key input ISH images (left three panels) overlaid with outlines of predicted cells (red) highlighting the expected patterns of gene expression: C6 cells express S100b and Calca but not Fxyd2; C8 cells express Trpa1, Trpv1 and Calca; C11 cells express Nppb and Etv1 but not Synpr. The right two panels compare the U-Net prediction probability (red) and the manually segmented and tSNE assigned class (green). Grey represents prediction of other neural classes; scale bars 50 μm.
Table 1.
Accuracy of U-Net based class predictions
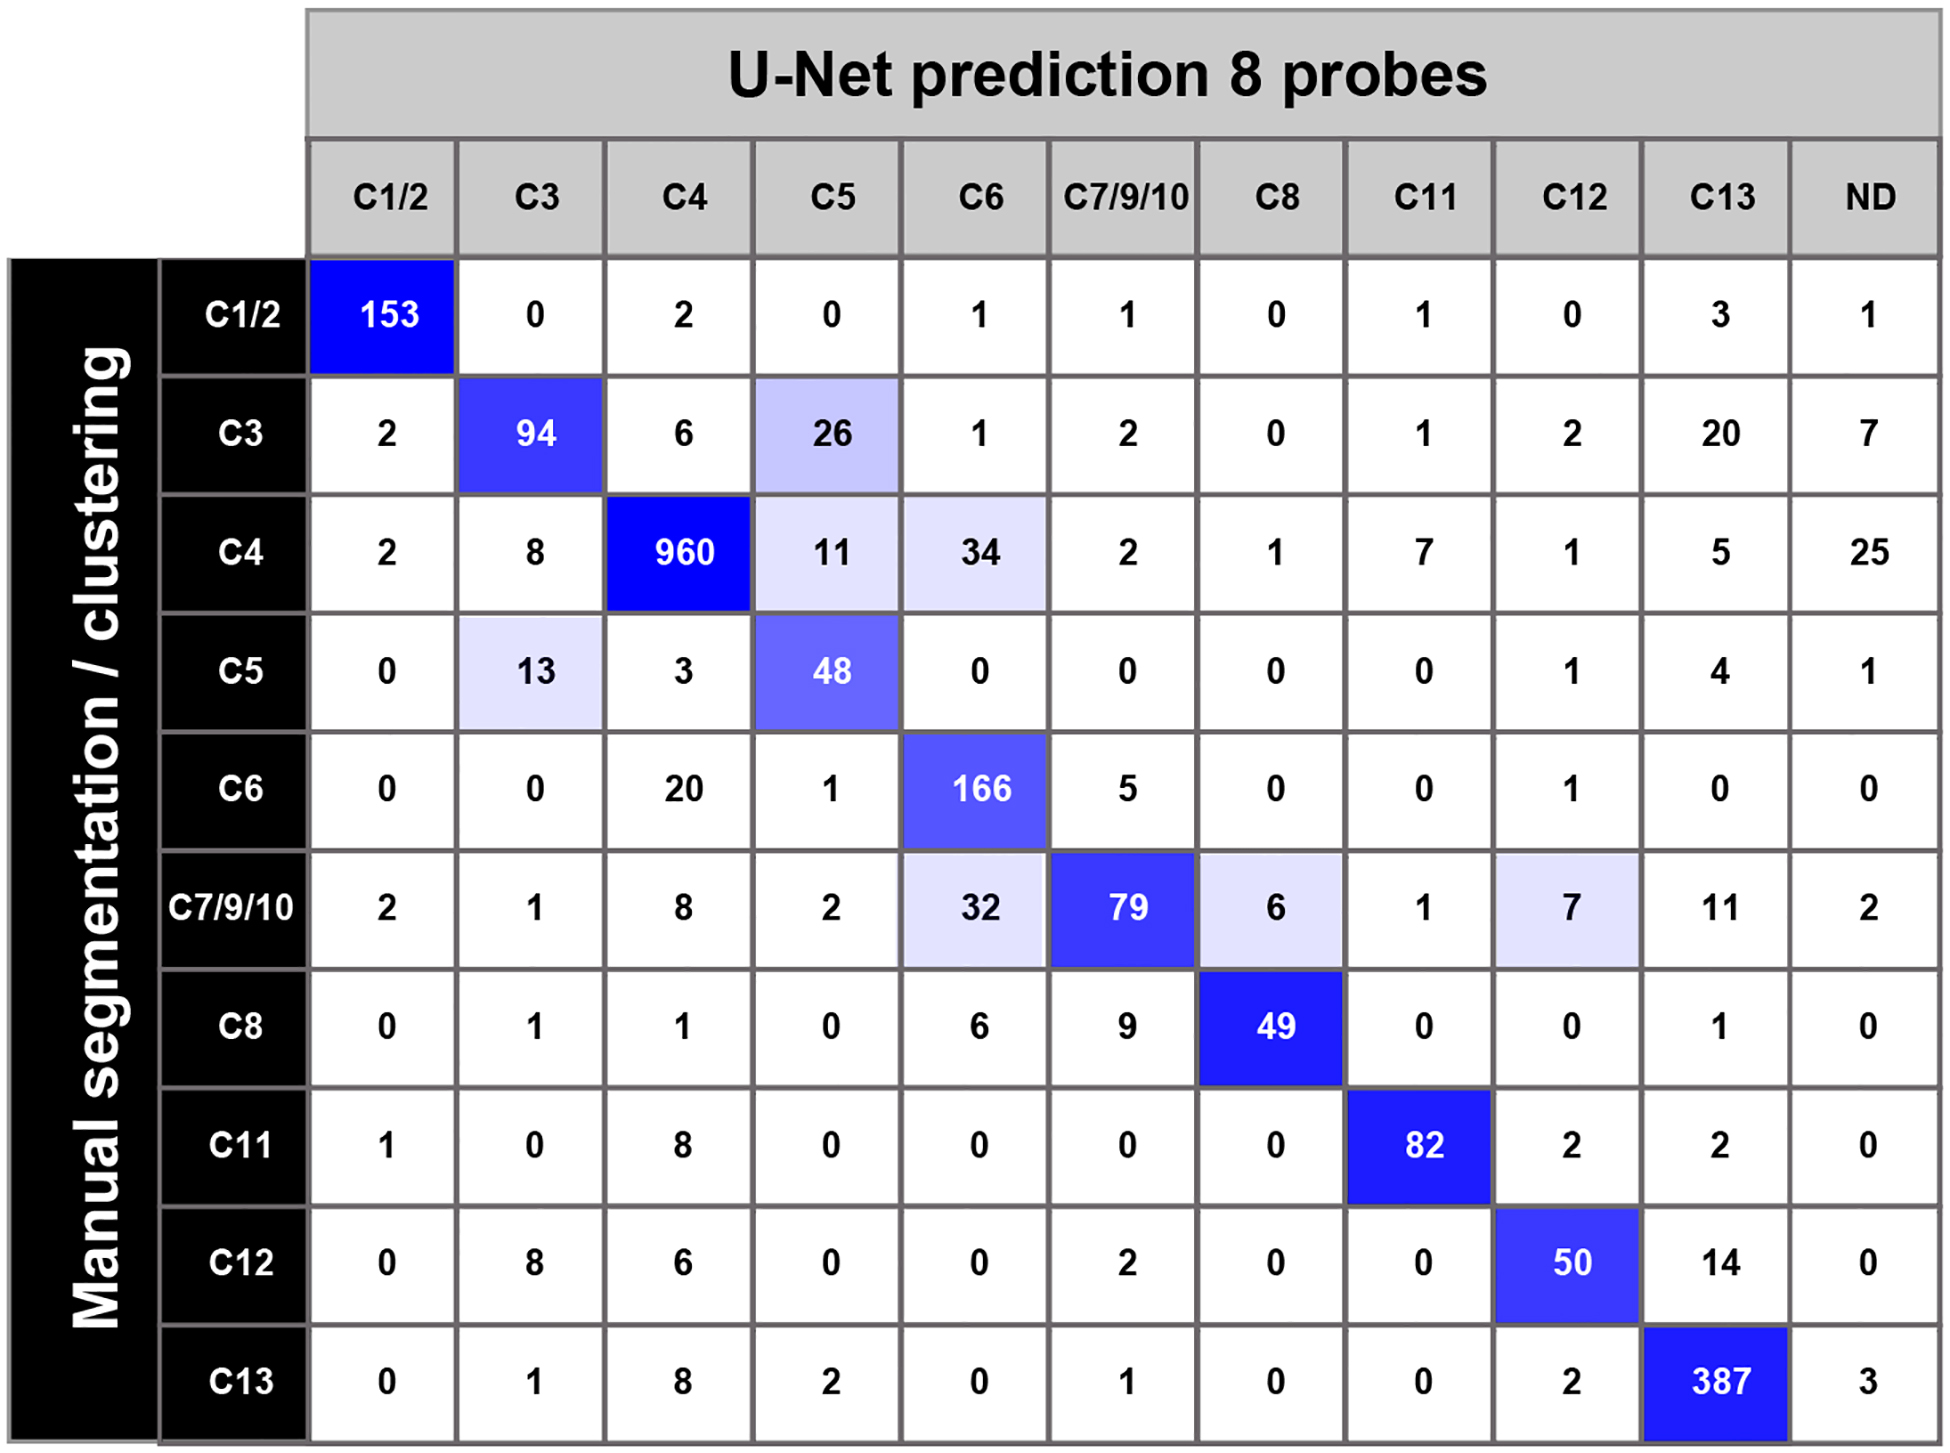 |
Prediction accuracy and errors for all classes of trigeminal neuron in the validation set. Columns are predicted classes (ND, not determined); rows are the manually segmented, clustering based classification. Shades of blue highlight the proportion of predicted neurons that fall into a cell. Overall prediction accuracy was 94.8 % at a pixel level and 84.9 % at the cellular level. It should be noted that when a subset of predicted neurons that did not match the manually segmented cells were examined, many turned out to have the gene expression profile of the predicted class rather than that of the manual segmentation approach. This is not surprising since manual segmentation relies on subjective assessment of cell boundaries and inaccuracies in this process are likely to affect classification for a subset of cells.
Expression of voltage-gated sodium channels in trigeminal neurons classes
Sc-transcriptomic analyses make use of many variable genes in clustering data and thus can tolerate the sparse nature of the underlying datasets, the consequent dropout of specific transcripts as well as occasional capture of false positives. However, the expression of any individual gene will be distorted by these artefacts. By contrast, ISH more accurately reflects the cellular level of mRNAs and thus, the multiplexed approach should provide a platform for measuring cellular expression of genes across cell classes. Here we illustrate the power of this approach by testing the expression profile of several voltage gated sodium channels that are known to be differentially expressed in somatosensory neurons [52] and play distinct roles in sensory detection [10;34;54]}.
The patterns of expression of Scn10a (Nav1.8, a tetrodotoxin [Ttx] insensitive channel) and Scn1a (a Ttx sensitive channel Nav1.1) were very similar across the major neural classes in the sc- and sn-analyses (Fig. 4a). Expression of Scn10a in U-Net classified trigeminal neurons very closely matched the overall predictions from the single cell data (Fig. 4b). Notably using the ISH approach, each class of sensory neurons appeared quite homogeneous in its expression pattern closely following a unimodal distribution but there were major differences in the mean expression level of the classes (Fig. 4b). By contrast, the sequence data were more ambiguous. This was particularly apparent for C3 or C7–10 cells where discontinuous violin plots (Fig. 4a) could be interpreted as only a subset of cells expressing this gene, or alternately as drop-out of a moderately expressed transcript because of the sparse nature of the sequence information. The ISH indicates that the majority of neurons in these classes express Scn10a but that the average level of expression is low (Fig. 4b). Importantly, this sodium channel, which plays a crucial role in detecting painful input, is absent from the C1/2 cooling sensing neurons as well as the large diameter C4 and C5 putative mechanosensors but is present albeit at very different levels in all other classes.
Figure 4. Analysis of voltage gated sodium channel expression in classified neurons.
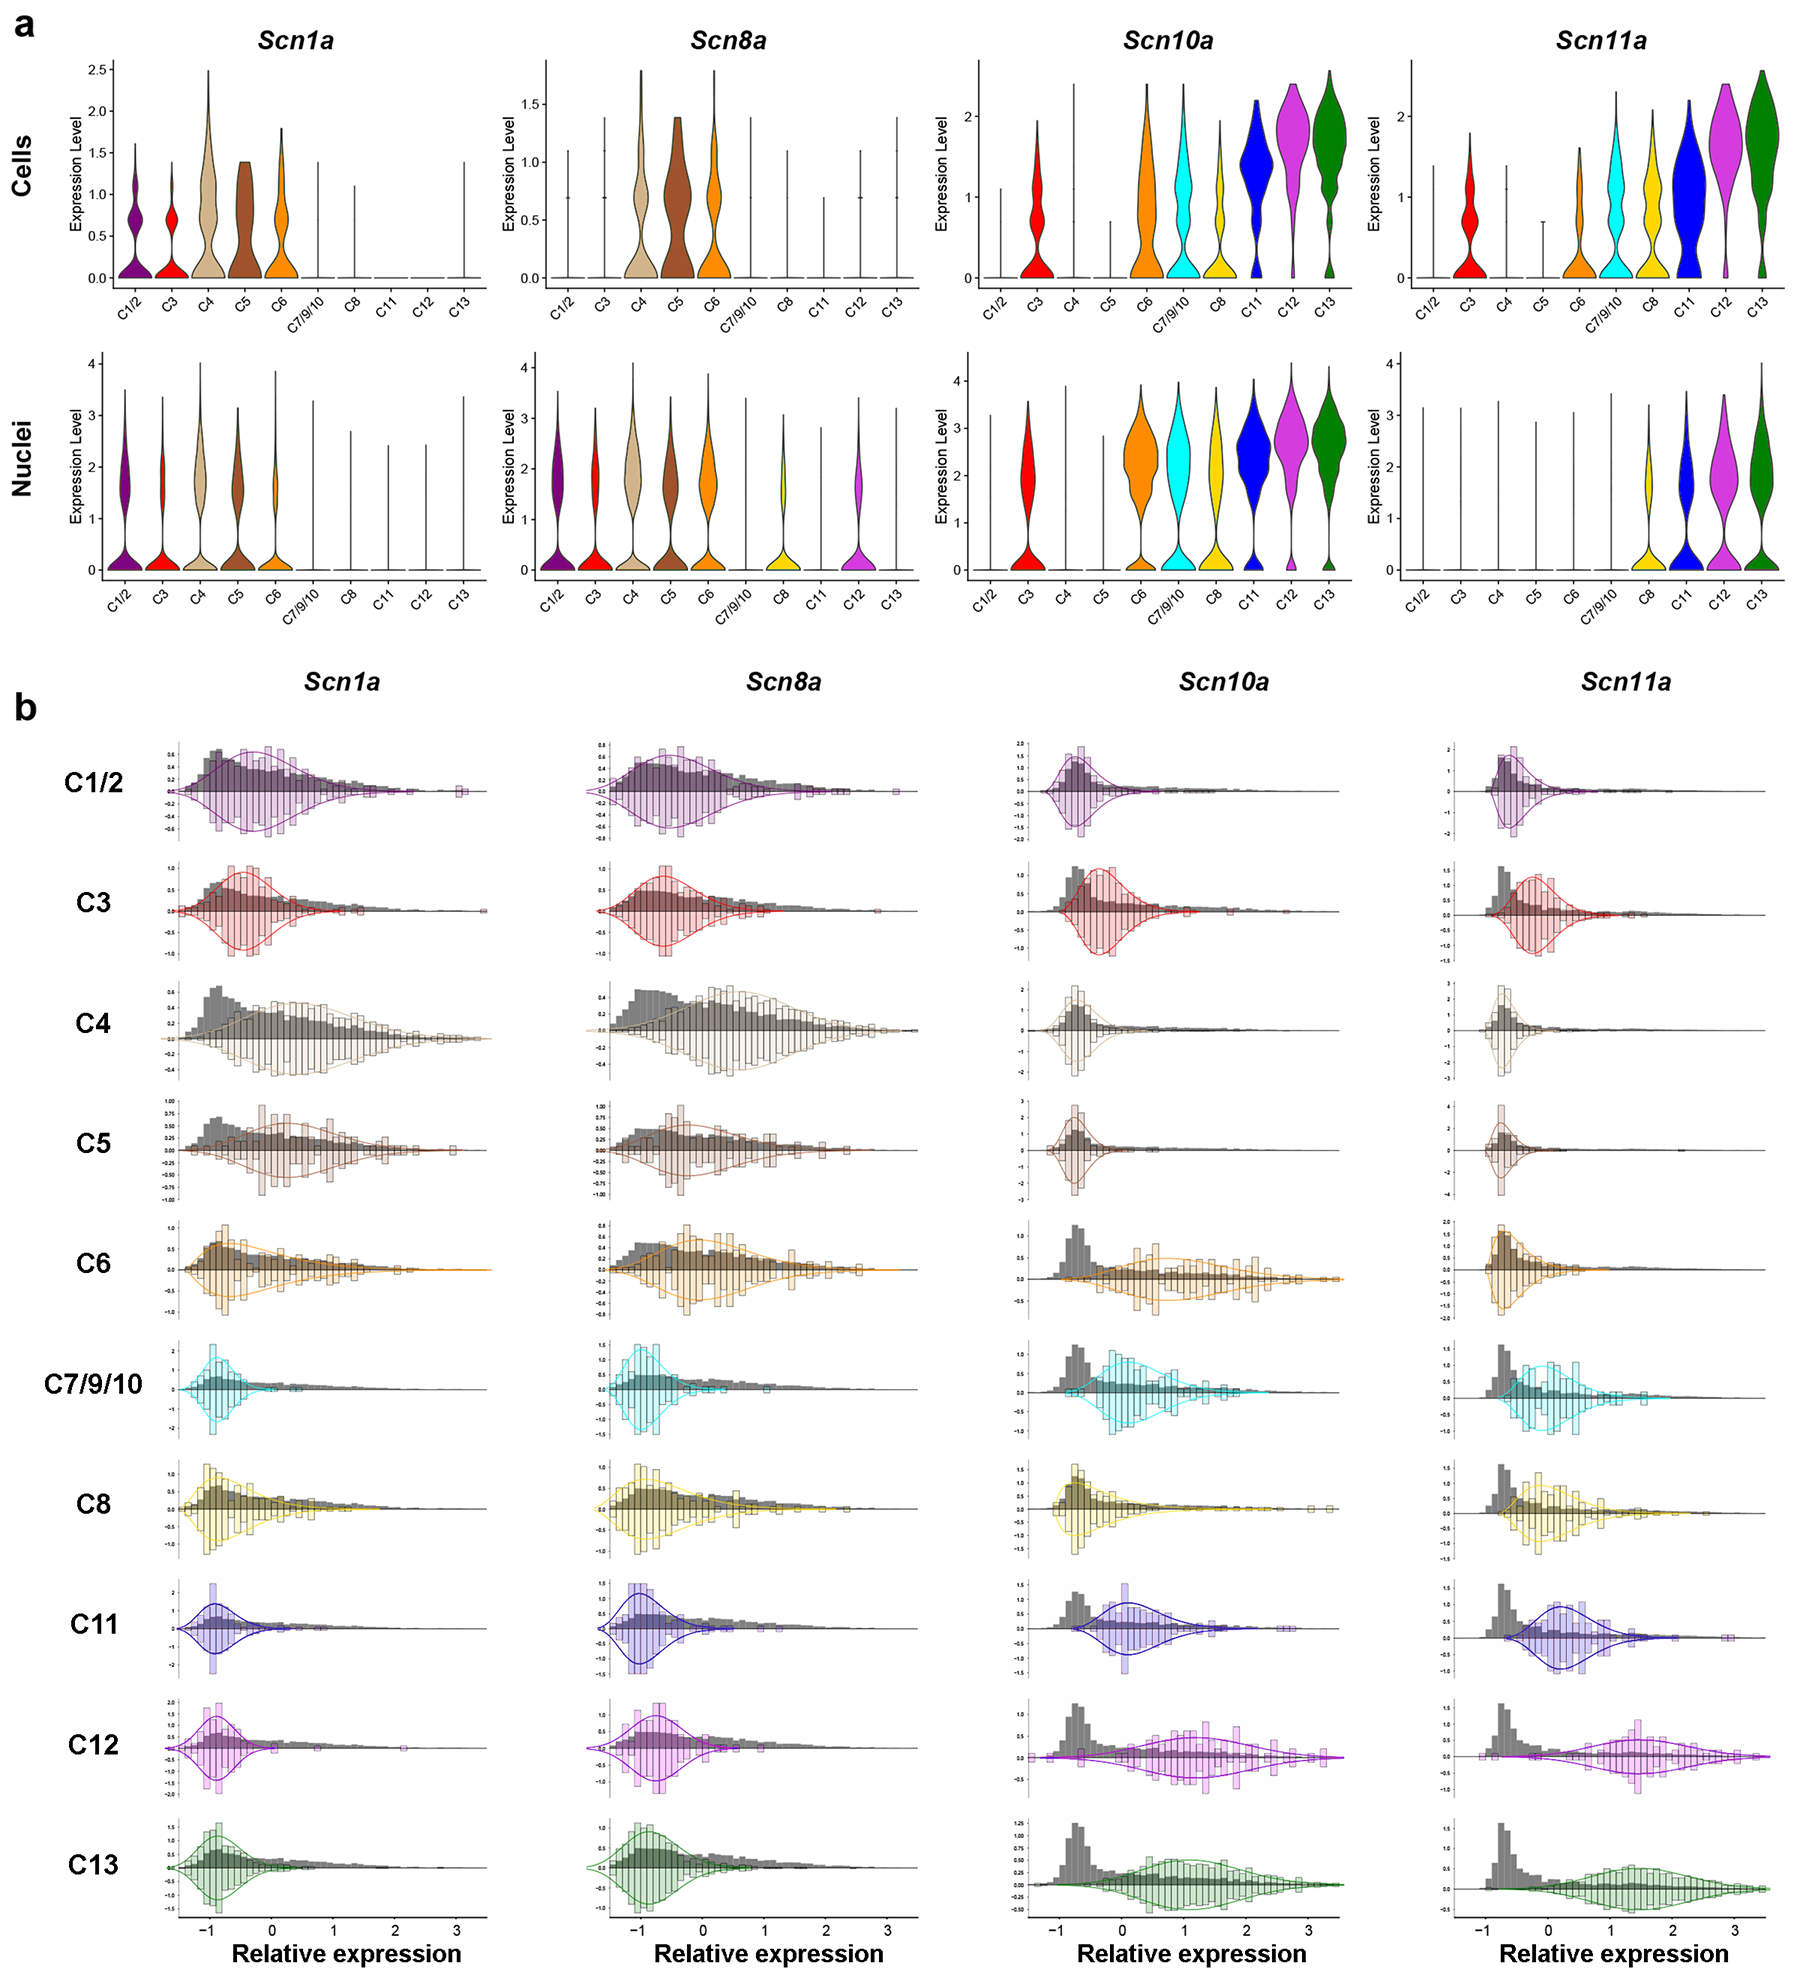
(a) Violin plots of the expression of four voltage gated ion channels across trigeminal neuronal classes in the (upper panels) cell based- [32] and (lower panels) nuclei based [31] analyses. The y axes indicate expression levels that were normalized as described previously [31;32] and the x axes approximate the relative abundance of these expression levels. (b) Histograms of expression data for these ion-channels across trigeminal neuronal classes identified using multigene ISH and the U-Net classification of neurons. Grey histograms depict the relative standardized expression levels (mean = 0, variance = 1) of the channel in all trigeminal neurons along the x-axis and relative abundance of expression levels along the y-axis; colored bars, its relative expression in cells of a particular class; colored curves are gamma distributions fitted to the expression data in a class; to help highlight the expression pattern of a channel in a defined class of cells, the class histograms and fitted curves have been reflected around the x-axis which was scaled to result in a total area under the curve of 1.
The classes of neurons expressing Scn1a in the three datasets (sc- and sn-transcriptomic and ISH based) were also highly concordant (Fig. 4), emphasizing the effectiveness of the minimal U-Net approach at projecting the transcriptomic trigeminal neuronal class onto anatomical sections. Again, just as for Scn10a, the expression of Scn1a appeared homogeneous in most (eight of the ten) neuronal classes (Fig. 4b). This contrasted starkly with transcriptomic data where even the classes with the highest overall expression showed major dropout presumably because of the low to moderate expression of this gene resulted in false negatives in the transcriptomic data. Thus, these ISH gene expression data (Fig. 4b) not only validate sc-predictions but also extend them. C1/2, C4 and C5 neurons all express this sodium channel at a relatively high level with less expression detected in C3 neurons. C7/9/10, C11, C12 and C13 neurons were negative for this channel, while expression in C6 and C8 cells appeared heterogeneous with some neurons in these classes being negative and others strongly positive.
Interestingly, other voltage gated sodium channels (Scn11a and Scn8a) were less consistent between the two transcriptomic datasets (Fig. 4a), probably reflecting their expression level, the depth of sequencing in the respective studies, instability of larger diameter neurons for the cell based analysis and perhaps differences in how these mRNAs are distributed in trigeminal neurons or regulated during cell isolation. By contrast, ISH analysis of Scn11a was diagnostic with each class exhibiting quite a homogeneous pattern of expression (Fig. 4b). The classes of neurons expressing this gene closely matched the expression profile of Scn10a except that Scn11a (a second Ttx-resistant channel that is selectively expressed in sensory neurons and involved in pain sensation) was not detected in the majority of C6 neurons that are predicted to represent Aδ-nociceptors [2;14;42]. Our ISH analysis revealed that Scn8a is primarily expressed in large diameter neurons with highest levels in C4, C5 and C6 cells (Fig. 4b), is also detectable in C1/2, C3 and C12 neurons and is essentially absent from other trigeminal neuronal classes. Taken together, these data further validate the minimal ISH approach for classifying trigeminal neurons in anatomical sections and reveal its power for quantitative expression analysis by exposing the stereotyped, strongly class-related, differential expression of Ttx-sensitive and insensitive sodium channels in the trigeminal neuronal classes.
Classifying trigeminal neurons innervating specialized sensory targets
The trigeminal nerves innervate diverse tissues and structures in the head and neck. Multiplex ISH based neural classification provides an opportunity to probe the transcriptomic identity of neurons innervating quite different types of specialized sensory environments. Here, we illustrate this using a retrograde tracer (fluorescently labeled WGA) to mark neurons projecting to the surface of the eye or the meninges (Fig. 5a). Following one round of imaging to identify the labeled neurons, the cells projecting to these targets were classified using the 8-probe U-Net approach (Fig. 5b). Our data, using a comprehensive and unbiased approach extend previous studies that have used candidate transgenes to label subsets of neurons innervating tissues [5;18;36].
Figure 5. The eye and meninges are both innervated by a broad array of sensory neuron types.
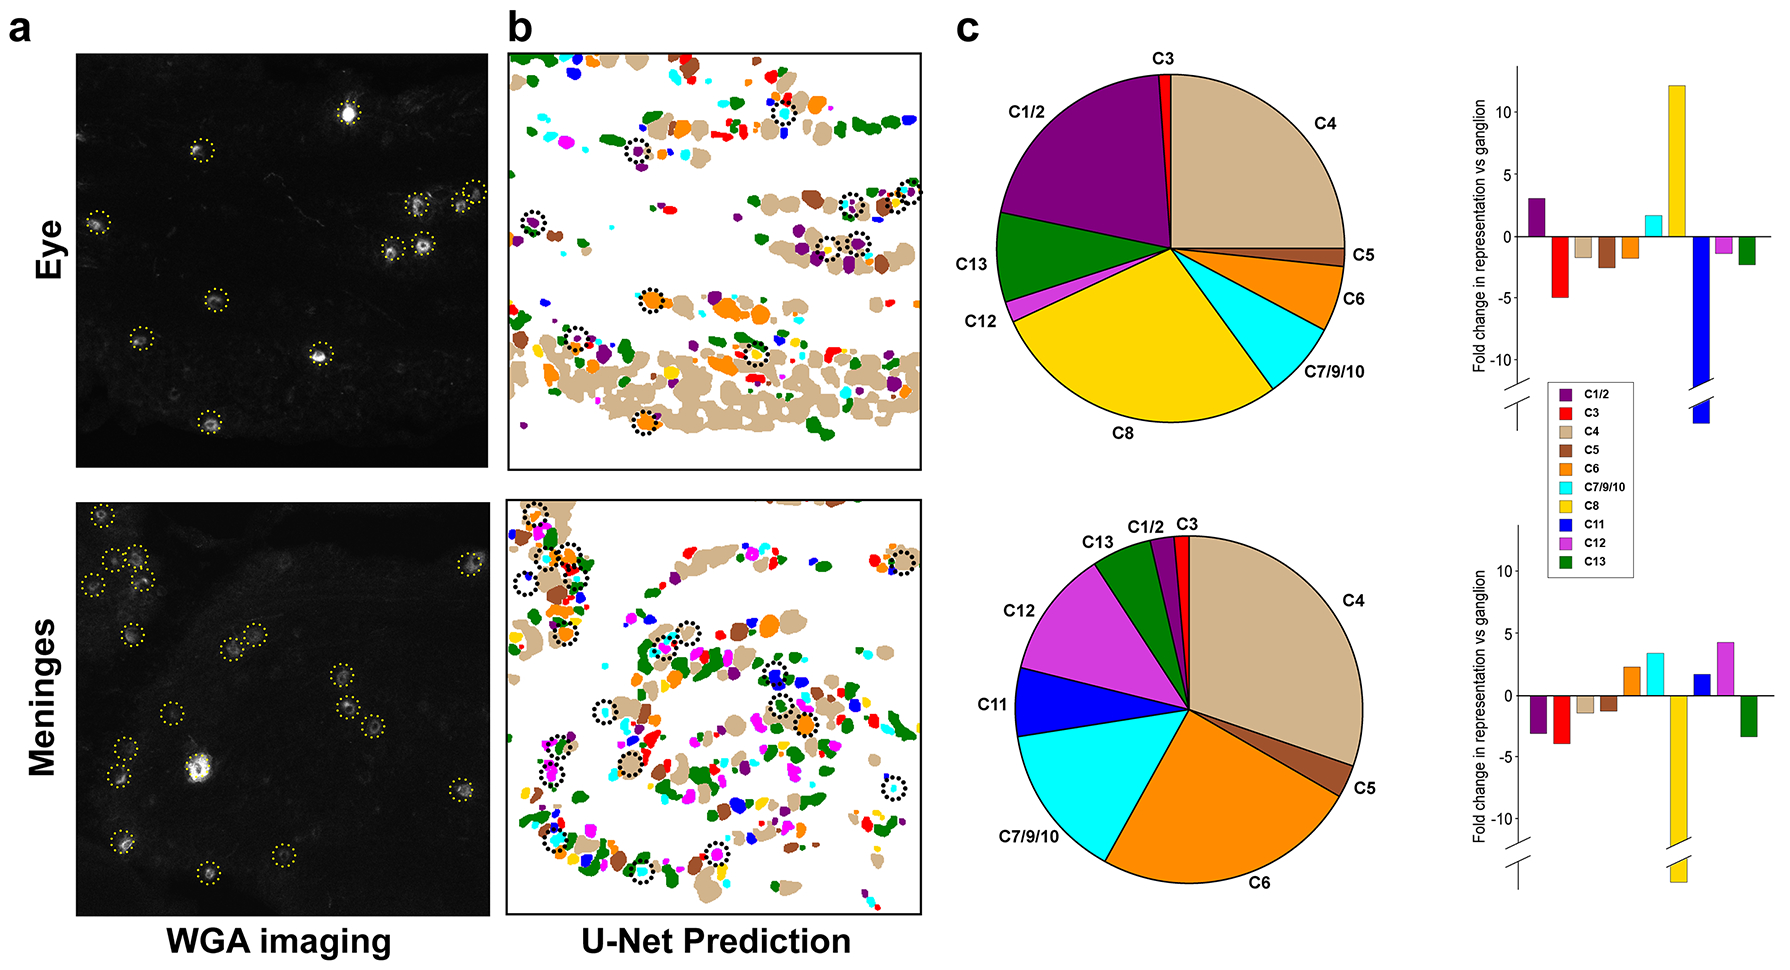
Fluorescently labeled WGA was used to retrogradely label neurons innervating peripheral sites. (a) Typical images of WGA tracing from the eye (primarily cornea) and meninges; yellow dotted lines highlight WGA-positive cells. (b) Cell classes assigned using the 8-probe U-Net approach with WGA-positive cells circled (black dotted lines; colors indicate cell class as defined in Fig. 3). (c) Left: pie charts representing innervation profiles of these two peripheral targets and right: bar graphs depicting the fold difference in the proportion of neurons labeled by tracer injection in a target site relative to the prevalence of those neurons in the ganglion assessed by the 8-probe U-Net method (see Table S1 for statistical analysis). Data are from a single section through the trigeminal ganglion of 4 mice for each peripheral target; scale bar = 100 μm.
An immediate surprise was that tracer applied to the surface of the eye labeled most classes of sensory neurons (Fig. 5c). However, the representation of these classes was dramatically different from the ganglion as a whole (Fig. 5c). The proportion of C8 cells (Trpv1/Trpa1 expressing nociceptors) innervating the eye was increased more than 10-fold. Based on their expression profile, including prominent expression of Trpa1, we expect C8 neurons to respond to irritants including the lachrymatory agent from onions, a volatile electrophile that activates Trpa1 [26]. C8-neurons also express Calca, consistent with previous studies demonstrating that CGRP-neurons innervate the cornea [5]. Other peptidergic c-fibers C7/9/10 (Trpv1-positive, Trpa1-negative nociceptors) were not significantly different from their distribution in the whole ganglion whereas C6 (CGRP-expressing Aδ-nociceptors) were slightly under-represented. A second class of cells that were particularly prominent and over-represented in neurons targeting the eye were the C1/2 (cool responsive) cells (Fig. 5c), supporting previous studies showing the cornea to be strongly innervated by Trpm8-expressing cells [18;36]. By contrast other types of sensory neurons rarely innervated the eye including C3 (putative c-fiber LTMRs) and the itch related class (C11). Since we did not exclusively target the cornea with our injections, some of the labeled neurons may innervate regions around the eye including the conjunctiva, which, unlike the cornea is known to be rich in Mrgpra3 (C12) fibers [18]. Major mechanosensory classes C4 (A-type LTMRs) and C13 (Mrgprd-expressing mechanonociceptors) were labeled at about 50% the expected frequency based on their distribution in the ganglion. Given the overall prominence of C4 and C13 neurons in the ganglion, this modest reduction still means that many putative mechanosensors target the eye. Since fast conducting mechanosensory neurons often make specialized connections in hairy and glabrous skin and exhibit select functions in gentle touch it will be interesting to determine the terminal structure of these neurons and to assess what contribution they provide in corneal sensation.
Our results revealed that the meninges are also targeted by a broad mix of neurons but with a very different representation of classes (Fig. 5c). Specifically, C1/2 neurons, which prominently innervate the eye, rarely targeted the meninges and C8 neurons were completely absent. Remarkably the two classes of itch neurons (C11 and C12) prominently targeted this internal sensory environment (Fig. 5c). Initially, we were concerned that problems with the model and class assignment might be responsible for suggesting itch neurons project to a sensory environment that cannot be scratched. However, manual examination of positive neurons revealed that they were not misassigned by the model, with prominent expression of Nppb, a very selective marker for C11 [32;48] in WGA labeled cells of this class (Fig. 6a). Since the classification of C12 cells in the eight-probe model relies on overlapping expression and absence of certain markers, we carried out additional retrograde labeling experiments to specifically confirm that C12 (Mrgpra3-positive) neurons also project to the meninges. To do this, we used a well characterized Mrgpra3-Cre transgenic mouse line [17] to drive reporter gene expression and demonstrated that Cre and the reporter gene were co-expressed in neurons retrogradely labeled from the meninges (Fig. 6b). Thus, both classes of sensory neurons that selectively trigger itch responses when stimulated via the skin also target the meninges.
Figure 6. Itch-related neural classes target the meninges.
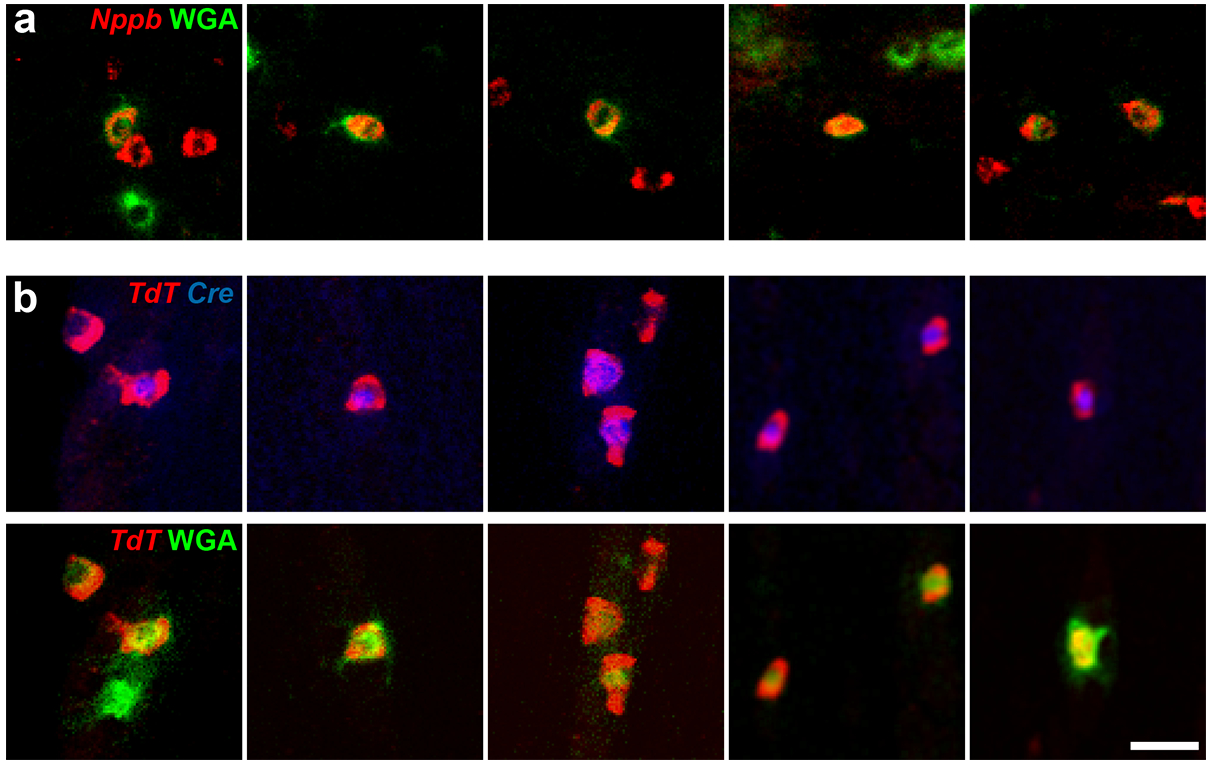
(a) Selected images of fluorescent-WGA tracing from the meninges (green) superimposed on ISH signal for Nppb (red) confirm that C11 neurons innervate the meninges. (b) Selected images from WGA-tracing in Mrgpra3-Cre transgenic mice crossed into an Ai14 TdTomato Cre-dependent reporter background showing co-expression of Cre (blue, upper panels) and TdTomato (red) in neurons labeled by fluorescent WGA tracing from the meninges (green, lower panels). Data are from single sections through the trigeminal ganglion of 4 mice for (a) and 3 mice for (b); scale bar, 40 μm.
The biggest differences in the innervation of the eye versus the meninges were the over-representation of C1/2 and C8 cells targeting the eye versus C11 and C12 cells projecting to the meninges. Intriguingly, the cell bodies of these four neuronal classes were differentially distributed within the trigeminal ganglion with this spatial segregation of classes conserved between animals (Fig. S6a). Similar segregation of these classes extended to areas that do not target the eye and meninges (Fig. S6b), perhaps hinting that other target-tissues share the same differential innervation patterns. However, although it is attractive to speculate that these differences in spatial representation reflect differences in peripheral targeting, the eye and meninges were represented by broad and partially overlapping fields. Thus, it is also possible that developmental processes (rather than projection per se) result in this topographic segregation of neuronal classes in the ganglion.
C3 and C4 neurons (c- and A-type LTMRs) were under-represented in meningeal projections as were C13 neurons (Mrgprd-expressing, non-peptidergic nociceptors) but still account for about a third of all neurons targeting this tissue. It will be interesting to determine the types of stimuli these putative mechanosensors respond to, examine their sensory termini in the meninges and assess if they play a specific role in types of migraine. Notably, the Calca-positive C6 and C7/9/10 (A- and c-type) peptidergic nociceptors were more than 2-fold enriched amongst the meningeal-labeled cells. Interestingly, we also discovered that all the meningeal C12 neurons (Fig. 6) expressed Calca even though this gene is normally present in just a fraction of the C12 cells in the whole ganglion (Fig. S7). Thus, almost half of the trigeminal neurons innervating the meninges are positive for Calca and consequently express the neuropeptide CGRP, which is well known to play an important role in certain types of migraine headache [15;43].
Discussion
Here, we set out to develop a simple but robust platform for assigning transcriptomic class to trigeminal ganglion neurons in anatomical sections. Just 8 probes were required to identify all the major classes of neurons that are consistently defined by cell and nuclear based scRNA sequence analyses [31;32]. Moreover, the hybridization images from these 8-probes were all that was needed for automated and rapid segmentation of cells and class assignment using a novel U-Net based approach that we developed. We demonstrate the power of this simple platform by determining the expression of functionally relevant sodium channels in the different classes of neuron and analyzing the neural classes innervating the eye and meninges. This approach provides a much more consistent view of gene expression, at a cellular level, than single cell transcriptomic analysis (Fig. 4) and is particularly valuable for moderately expressed genes where dropout in single cell sequencing is a major drawback. It also provides a rapid and unbiased means for linking anatomy to gene expression (Fig. 5).
A surprise from our study of tissue innervation was that transcriptomic class did not appear to be the sole predictor of a neuron’s sensory role. For example, in the skin, C11 and C12 neurons selectively respond to pruritogens and trigger itch [4;23]. We found that these cells also innervate the meninges where they must drive different perceptual and behavioral responses. One possibility is that these types of neurons have common sentinel-type roles e.g. as detectors of immune cell activity [44] or irritants in the different tissues. In this scenario, their differential central connectivity would then govern the consequences of their activation. Interestingly, it was recently shown that the lung is also innervated by C12 neurons [16], thus the meninges may not be unique in “repurposing” itch related cells. Analogously, the innervation of the surface of the eye by C1/2 cool sensing neurons [37] is most likely not related to the cornea being an important structure for sensing environmental temperature. Instead, the cooling effect of evaporation is probably the main sensory cue, acting as a selective driver for lacrimal-gland stimulation [36]. Analogously, corneal C8-neurons (Trpv1 / Trpa1 positive) probably play a specialized protective role by driving tear production in response to irritants, something familiar to most people as a rather painless but nonetheless dramatic side effect of chopping onions. Thus, a sensory neuron’s gene-expression profile provides just one dimension of its identity rather than a direct indication of its sensory role. Our results strongly suggest that the significantly divergent patterns of connectivity amongst transcriptomically-related neurons influence both their sensitivity and output. These conclusions about the functional flexibility of well-defined transcriptomic cell types are likely to be more widely applicable and not specific to peripheral sensory neurons.
Innervation of the meninges is particularly relevant in the context of headache and migraine. Thus, it was interesting that half the neurons targeting the meninges were from Calca (CGRP) positive classes in keeping with the role of this neuropeptide in certain types of migraine [15;43]. Perhaps surprisingly, other cell types expressing trigeminal genes with reported roles in driving headache e.g. Trpm8 [12] (in C1/2 neurons) and Trpa1 [21] (in C8 cells) minimally targeted the meninges (Fig. 5). For C1/2 neurons this is in line with previous reports of only very sparse innervation of the dura but does suggest that this gene that has been genetically linked to migraine in humans [12] may exert its effects at other target sites. Similarly, recent results suggest Trpa1-agonists act at non-meningeal sites to induce migraine [22;45]. For example, selective ablation of Trpv1-expressing trigeminal neurons projecting to the nasal cavity blocked Trpa1-agonist induced changes in meningeal blood flow [22] that are believed important in migraine induction. Moreover, Trpa1 was recently reported to be expressed in cerebral artery endothelial cells and to drive changes in blood flow to the brain in response to Trpa1 activation completely independent of the trigeminal system [45]. Since our data demonstrate that C8-neurons do not innervate the meninges, these mechanisms [22;45] likely dominate the migraine inducing effects of compounds like mustard oil that potently activate Trpa1.
The concept of neural class has been completely altered by recent large-scale scRNA sequencing efforts that have exposed new levels of transcriptomic diversity [46;51]. Whereas there is evidence that at least some of these groupings delineate differences between cells, it is unclear how homogeneous each of these classes is [33]. Just as importantly, many of these new transcriptomic classes share extensive similarity with each other and subdivide known types of neurons without obvious functional implication. Mapping class to cells in tissues will likely help address these issues and will provide important insight into neural diversity. Several groups have reported powerful approaches to identify many different genetic targets in anatomical sections that could greatly extend the power of scRNA sequencing [6;30;41;49]. However, these methods are generally complex, generate extremely large amounts of data and consequently represent a major undertaking that may limit their use. The basic approach that we describe here for classification of trigeminal neurons represents a compromise between these technically challenging methods and more standard ISH that is often anecdotal and limited to just identifying predicted co-expression patterns. Even if full characterization of the myriad new transcriptomic classes in tissues as complex as the cortex would require localization of more genes than the trigeminal ganglion, the approach we have taken is easily scalable. Moreover, careful selection of probes should make it possible to specifically focus on the most relevant cell types and to simplify the experimental platform. We envision that combining this type of ISH approach with viral tracing [50] will be particularly useful for exposing rules guiding long-range connectivity. Similarly, determining the transcriptomic class of functionally labeled neurons [9;29;39] could be highly informative.
Here we demonstrate how defining transcriptomic class of trigeminal neurons in situ reveals important aspects of their role in sensation. This approach should be easy to extend to DRG neurons simply by adding one additional gene (e.g. parvalbumin, Pvalb) to classify proprioceptors. In the future, this type of neuronal classification will be especially useful for examining changes in gene expression induced by pathological conditions that trigger chronic pain [20]. Fully annotated code is available in Github (https://github.com/lars-von-buchholtz/InSituClassification).
Supplementary Material
Acknowledgements
This work was supported by the Intramural program of the National Institutes of Health, National Institute of Dental and Craniofacial Research (N.J.P.R.) and National Center for Integrative and Complementary Health (A.T.C.) and included funding from Department of Defense in the Center for Neuroscience and Regenerative Medicine (A.T.C.). We are grateful to Dr. Xinzhong Dong for providing Mrgpra3-Cre reporter mice, to the NINDS Light Imaging Facility, and to other members of our labs for help and advice.
Footnotes
Declaration of Interests
The authors declare no competing interests.
Code availability
Fully annotated code is available in Github: (https://github.com/lars-von-buchholtz/InSituClassification)
References
- [1].Adelman PC, Baumbauer KM, Friedman R, Shah M, Wright M, Young E, Jankowski MP, Albers KM, and Koerber HR. Single-cell q-PCR derived expression profiles of identified sensory neurons. Molecular Pain 2019;15:174480691988449. [DOI] [PMC free article] [PubMed] [Google Scholar]
- [2].Arcourt A, Gorham L, Dhandapani R, Prato V, Taberner FJ, Wende H, Gangadharan V, Birchmeier C, Heppenstall PA, and Lechner SG. Touch Receptor-Derived Sensory Information Alleviates Acute Pain Signaling and Fine-Tunes Nociceptive Reflex Coordination. Neuron 2017;93(1):179–193. [DOI] [PubMed] [Google Scholar]
- [3].Bautista DM, Siemens J, Glazer JM, Tsuruda PR, Basbaum AI, Stucky CL, Jordt SE, and Julius D The menthol receptor TRPM8 is the principal detector of environmental cold. Nature 2007;448(7150):204–208. [DOI] [PubMed] [Google Scholar]
- [4].Bautista DM, Wilson SR, and Hoon MA. Why we scratch an itch: the molecules, cells and circuits of itch. Nature neuroscience 2014;17(2):175–182. [DOI] [PMC free article] [PubMed] [Google Scholar]
- [5].Bouheraoua N, Fouquet S, Marcos-Almaraz MT, Karagogeos D, Laroche L, and Chedotal A Genetic Analysis of the Organization, Development, and Plasticity of Corneal Innervation in Mice. J Neurosci 2019;39(7):1150–1168. [DOI] [PMC free article] [PubMed] [Google Scholar]
- [6].Chen KH, Boettiger AN, Moffitt JR, Wang S, and Zhuang X RNA imaging. Spatially resolved, highly multiplexed RNA profiling in single cells. Science (New York, NY) 2015;348(6233):aaa6090. [DOI] [PMC free article] [PubMed] [Google Scholar]
- [7].Chiu IM, Barrett LB, Williams EK, Strochlic DE, Lee S, Weyer AD, Lou S, Bryman GS, Roberson DP, Ghasemlou N, Piccoli C, Ahat E, Wang V, Cobos EJ, Stucky CL, Ma Q, Liberles SD, and Woolf CJ. Transcriptional profiling at whole population and single cell levels reveals somatosensory neuron molecular diversity. eLife 2014;3. [DOI] [PMC free article] [PubMed] [Google Scholar]
- [8].Choi HMT, Schwarzkopf M, Fornace ME, Acharya A, Artavanis G, Stegmaier J, Cunha A, and Pierce NA. Third-generation in situ hybridization chain reaction: multiplexed, quantitative, sensitive, versatile, robust. Development (Cambridge, England) 2018;145(12). [DOI] [PMC free article] [PubMed] [Google Scholar]
- [9].DeNardo LA, Liu CD, Allen WE, Adams EL, Friedmann D, Fu L, Guenthner CJ, Tessier-Lavigne M, and Luo L Temporal evolution of cortical ensembles promoting remote memory retrieval. Nature neuroscience 2019;22(3):460–469. [DOI] [PMC free article] [PubMed] [Google Scholar]
- [10].Dib-Hajj SD, Black JA, and Waxman SG. NaV1.9: a sodium channel linked to human pain. Nat Rev Neurosci 2015;16(9):511–519. [DOI] [PubMed] [Google Scholar]
- [11].Dong X, Han S-k, Zylka MJ, Simon MI, and Anderson DJ. A Diverse Family of GPCRs Expressed in Specific Subsets of Nociceptive Sensory Neurons. Cell 2001;106(5):619–632. [DOI] [PubMed] [Google Scholar]
- [12].Dussor G, and Cao Y-Q TRPM8 and Migraine. Headache: The Journal of Head and Face Pain 2016;56(9):1406–1417. [DOI] [PMC free article] [PubMed] [Google Scholar]
- [13].Gatto G, Smith KM, Ross SE, and Goulding M Neuronal diversity in the somatosensory system: bridging the gap between cell type and function. Curr Opin Neurobiol 2019;56:167–174. [DOI] [PMC free article] [PubMed] [Google Scholar]
- [14].Ghitani N, Barik A, Szczot M, Thompson JH, Li C, Le Pichon CE, Krashes MJ, and Chesler AT. Specialized Mechanosensory Nociceptors Mediating Rapid Responses to Hair Pull. Neuron 2017;95(4):944–954.e944. [DOI] [PMC free article] [PubMed] [Google Scholar]
- [15].Goadsby PJ, Reuter U, Hallstrom Y, Broessner G, Bonner JH, Zhang F, Sapra S, Picard H, Mikol DD, and Lenz RA. A Controlled Trial of Erenumab for Episodic Migraine. The New England journal of medicine 2017;377(22):2123–2132. [DOI] [PubMed] [Google Scholar]
- [16].Han L, Limjunyawong N, Ru F, Li Z, Hall OJ, Steele H, Zhu Y, Wilson J, Mitzner W, Kollarik M, Undem BJ, Canning BJ, and Dong X Mrgprs on vagal sensory neurons contribute to bronchoconstriction and airway hyper-responsiveness. Nature neuroscience 2018;21(3):324–328. [DOI] [PMC free article] [PubMed] [Google Scholar]
- [17].Han L, Ma C, Liu Q, Weng HJ, Cui Y, Tang Z, Kim Y, Nie H, Qu L, Patel KN, Li Z, McNeil B, He S, Guan Y, Xiao B, Lamotte RH, and Dong X A subpopulation of nociceptors specifically linked to itch. Nature neuroscience 2013;16(2):174–182. [DOI] [PMC free article] [PubMed] [Google Scholar]
- [18].Huang CC, Yang W, Guo C, Jiang H, Li F, Xiao M, Davidson S, Yu G, Duan B, Huang T, Huang AJW, and Liu Q Anatomical and functional dichotomy of ocular itch and pain. Nature medicine 2018;24(8):1268–1276. [DOI] [PMC free article] [PubMed] [Google Scholar]
- [19].Julius D TRP channels and pain. Annual review of cell and developmental biology 2013;29:355–384. [DOI] [PubMed] [Google Scholar]
- [20].Khoutorsky A, and Price TJ. Translational Control Mechanisms in Persistent Pain. Trends in neurosciences 2018;41(2):100–114. [DOI] [PMC free article] [PubMed] [Google Scholar]
- [21].Kunkler PE, Ballard CJ, Oxford GS, and Hurley JH. TRPA1 receptors mediate environmental irritant-induced meningeal vasodilatation. Pain 2011;152(1):38–44. [DOI] [PMC free article] [PubMed] [Google Scholar]
- [22].Kunkler PE, Ballard CJ, Pellman JJ, Zhang L, Oxford GS, and Hurley JH. Intraganglionic Signaling as a Novel Nasal-Meningeal Pathway for TRPA1-Dependent Trigeminovascular Activation by Inhaled Environmental Irritants. PLoS ONE 2014;9(7):e103086. [DOI] [PMC free article] [PubMed] [Google Scholar]
- [23].LaMotte RH, Dong X, and Ringkamp M Sensory neurons and circuits mediating itch. Nature reviews Neuroscience 2014;15(1):19–31. [DOI] [PMC free article] [PubMed] [Google Scholar]
- [24].Li CL, Li KC, Wu D, Chen Y, Luo H, Zhao JR, Wang SS, Sun MM, Lu YJ, Zhong YQ, Hu XY, Hou R, Zhou BB, Bao L, Xiao HS, and Zhang X Somatosensory neuron types identified by high-coverage single-cell RNA-sequencing and functional heterogeneity. Cell research 2016;26(1):83–102. [DOI] [PMC free article] [PubMed] [Google Scholar]
- [25].Lignell A, Kerosuo L, Streichan SJ, Cai L, and Bronner ME. Identification of a neural crest stem cell niche by Spatial Genomic Analysis. Nature communications 2017;8(1):1830. [DOI] [PMC free article] [PubMed] [Google Scholar]
- [26].Macpherson LJ, Dubin AE, Evans MJ, Marr F, Schultz PG, Cravatt BF, and Patapoutian A Noxious compounds activate TRPA1 ion channels through covalent modification of cysteines. Nature 2007;445(7127):541–545. [DOI] [PubMed] [Google Scholar]
- [27].Mishra SK, and Hoon MA. The cells and circuitry for itch responses in mice. Science (New York, NY) 2013;340(6135):968–971. [DOI] [PMC free article] [PubMed] [Google Scholar]
- [28].Mitchell K, Lebovitz EE, Keller JM, Mannes AJ, Nemenov MI, and Iadarola MJ. Nociception and inflammatory hyperalgesia evaluated in rodents using infrared laser stimulation after Trpv1 gene knockout or resiniferatoxin lesion. Pain 2014;155(4):733–745. [DOI] [PMC free article] [PubMed] [Google Scholar]
- [29].Moeyaert B, Holt G, Madangopal R, Perez-Alvarez A, Fearey BC, Trojanowski NF, Ledderose J, Zolnik TA, Das A, Patel D, Brown TA, Sachdev RNS, Eickholt BJ, Larkum ME, Turrigiano GG, Dana H, Gee CE, Oertner TG, Hope BT, and Schreiter ER. Improved methods for marking active neuron populations. Nature communications 2018;9(1):4440. [DOI] [PMC free article] [PubMed] [Google Scholar]
- [30].Moffitt JR, Bambah-Mukku D, Eichhorn SW, Vaughn E, Shekhar K, Perez JD, Rubinstein ND, Hao J, Regev A, Dulac C, and Zhuang X Molecular, spatial, and functional single-cell profiling of the hypothalamic preoptic region. Science (New York, NY) 2018;362(6416):eaau5324. [DOI] [PMC free article] [PubMed] [Google Scholar]
- [31].Nguyen MQ, Le Pichon CE, and Ryba N Stereotyped transcriptomic transformation of somatosensory neurons in response to injury. eLife 2019;8. [DOI] [PMC free article] [PubMed] [Google Scholar]
- [32].Nguyen MQ, Wu Y, Bonilla LS, von Buchholtz LJ, and Ryba NJP. Diversity amongst trigeminal neurons revealed by high throughput single cell sequencing. PLoS One 2017;12(9):e0185543. [DOI] [PMC free article] [PubMed] [Google Scholar]
- [33].Northcutt AJ, Kick DR, Otopalik AG, Goetz BM, Harris RM, Santin JM, Hofmann HA, Marder E, and Schulz DJ. Molecular profiling of single neurons of known identity in two ganglia from the crab Cancer borealis. Proc Natl Acad Sci U S A 2019. [DOI] [PMC free article] [PubMed] [Google Scholar]
- [34].Osteen JD, Herzig V, Gilchrist J, Emrick JJ, Zhang C, Wang X, Castro J, Garcia-Caraballo S, Grundy L, Rychkov GY, Weyer AD, Dekan Z, Undheim EA, Alewood P, Stucky CL, Brierley SM, Basbaum AI, Bosmans F, King GF, and Julius D Selective spider toxins reveal a role for the Nav1.1 channel in mechanical pain. Nature 2016;534(7608):494–499. [DOI] [PMC free article] [PubMed] [Google Scholar]
- [35].Pal NR, and Pal SK. A review on image segmentation techniques. Pattern Recognition 1993;26(9):1277–1294. [Google Scholar]
- [36].Parra A, Madrid R, Echevarria D, del Olmo S, Morenilla-Palao C, Acosta MC, Gallar J, Dhaka A, Viana F, and Belmonte C Ocular surface wetness is regulated by TRPM8-dependent cold thermoreceptors of the cornea. Nature medicine 2010;16(12):1396–1399. [DOI] [PubMed] [Google Scholar]
- [37].Pogorzala LA, Mishra SK, and Hoon MA. The cellular code for mammalian thermosensation. J Neurosci 2013;33(13):5533–5541. [DOI] [PMC free article] [PubMed] [Google Scholar]
- [38].Ronneberger O, Fischer P, and Brox T U-Net: Convolutional Networks for Biomedical Image Segmentation. eprint arXiv:150504597 2015:arXiv:1505.04597. [Google Scholar]
- [39].Sathyamurthy A, Johnson KR, Matson KJE, Dobrott CI, Li L, Ryba AR, Bergman TB, Kelly MC, Kelley MW, and Levine AJ. Massively Parallel Single Nucleus Transcriptional Profiling Defines Spinal Cord Neurons and Their Activity during Behavior. Cell reports 2018;22(8):2216–2225. [DOI] [PMC free article] [PubMed] [Google Scholar]
- [40].Satija R, Farrell JA, Gennert D, Schier AF, and Regev A Spatial reconstruction of single-cell gene expression data. Nat Biotechnol 2015;33(5):495–502. [DOI] [PMC free article] [PubMed] [Google Scholar]
- [41].Shah S, Lubeck E, Zhou W, and Cai L seqFISH Accurately Detects Transcripts in Single Cells and Reveals Robust Spatial Organization in the Hippocampus. Neuron 2017;94(4):752–758 e751. [DOI] [PubMed] [Google Scholar]
- [42].Sharma N, Flaherty K, Lezgiyeva K, Wagner DE, Klein AM, and Ginty DD. The emergence of transcriptional identity in somatosensory neurons. Nature 2020;577(7790):392–398. [DOI] [PMC free article] [PubMed] [Google Scholar]
- [43].Silberstein SD, Dodick DW, Bigal ME, Yeung PP, Goadsby PJ, Blankenbiller T, Grozinski-Wolff M, Yang R, Ma Y, and Aycardi E Fremanezumab for the Preventive Treatment of Chronic Migraine. The New England journal of medicine 2017;377(22):2113–2122. [DOI] [PubMed] [Google Scholar]
- [44].Solinski HJ, Kriegbaum MC, Tseng PY, Earnest TW, Gu X, Barik A, Chesler AT, and Hoon MA. Nppb Neurons Are Sensors of Mast Cell-Induced Itch. Cell reports 2019;26(13):3561–3573.e3564. [DOI] [PMC free article] [PubMed] [Google Scholar]
- [45].Sullivan MN, Gonzales AL, Pires PW, Bruhl A, Leo MD, Li W, Oulidi A, Boop FA, Feng Y, Jaggar JH, Welsh DG, and Earley S Localized TRPA1 channel Ca2+signals stimulated by reactive oxygen species promote cerebral artery dilation. Science Signaling 2015;8(358):ra2–ra2. [DOI] [PMC free article] [PubMed] [Google Scholar]
- [46].Tasic B, Yao Z, Graybuck LT, Smith KA, Nguyen TN, Bertagnolli D, Goldy J, Garren E, Economo MN, Viswanathan S, Penn O, Bakken T, Menon V, Miller J, Fong O, Hirokawa KE, Lathia K, Rimorin C, Tieu M, Larsen R, Casper T, Barkan E, Kroll M, Parry S, Shapovalova NV, Hirschstein D, Pendergraft J, Sullivan HA, Kim TK, Szafer A, Dee N, Groblewski P, Wickersham I, Cetin A, Harris JA, Levi BP, Sunkin SM, Madisen L, Daigle TL, Looger L, Bernard A, Phillips J, Lein E, Hawrylycz M, Svoboda K, Jones AR, Koch C, and Zeng H Shared and distinct transcriptomic cell types across neocortical areas. Nature 2018;563(7729):72–78. [DOI] [PMC free article] [PubMed] [Google Scholar]
- [47].Umans BD, and Liberles SD. Neural Sensing of Organ Volume. Trends in neurosciences 2018;41(12):911–924. [DOI] [PMC free article] [PubMed] [Google Scholar]
- [48].Usoskin D, Furlan A, Islam S, Abdo H, Lonnerberg P, Lou D, Hjerling-Leffler J, Haeggstrom J, Kharchenko O, Kharchenko PV, Linnarsson S, and Ernfors P Unbiased classification of sensory neuron types by large-scale single-cell RNA sequencing. Nature neuroscience 2015;18(1):145–153. [DOI] [PubMed] [Google Scholar]
- [49].Wang X, Allen WE, Wright MA, Sylwestrak EL, Samusik N, Vesuna S, Evans K, Liu C, Ramakrishnan C, Liu J, Nolan GP, Bava FA, and Deisseroth K Three-dimensional intact-tissue sequencing of single-cell transcriptional states. Science (New York, NY) 2018;361(6400). [DOI] [PMC free article] [PubMed] [Google Scholar]
- [50].Winnubst J, Bas E, Ferreira TA, Wu Z, Economo MN, Edson P, Arthur BJ, Bruns C, Rokicki K, Schauder D, Olbris DJ, Murphy SD, Ackerman DG, Arshadi C, Baldwin P, Blake R, Elsayed A, Hasan M, Ramirez D, Dos Santos B, Weldon M, Zafar A, Dudman JT, Gerfen CR, Hantman AW, Korff W, Sternson SM, Spruston N, Svoboda K, and Chandrashekar J Reconstruction of 1,000 Projection Neurons Reveals New Cell Types and Organization of Long-Range Connectivity in the Mouse Brain. Cell 2019;179(1):268–281 e213. [DOI] [PMC free article] [PubMed] [Google Scholar]
- [51].Zeisel A, Hochgerner H, Lonnerberg P, Johnsson A, Memic F, van der Zwan J, Haring M, Braun E, Borm LE, La Manno G, Codeluppi S, Furlan A, Lee K, Skene N, Harris KD, Hjerling-Leffler J, Arenas E, Ernfors P, Marklund U, and Linnarsson S Molecular Architecture of the Mouse Nervous System. Cell 2018;174(4):999–1014.e1022. [DOI] [PMC free article] [PubMed] [Google Scholar]
- [52].Zheng Y, Liu P, Bai L, Trimmer JS, Bean BP, and Ginty DD. Deep Sequencing of Somatosensory Neurons Reveals Molecular Determinants of Intrinsic Physiological Properties. Neuron 2019;103(4):598–616 e597. [DOI] [PMC free article] [PubMed] [Google Scholar]
- [53].Zimmerman A, Bai L, and Ginty DD. The gentle touch receptors of mammalian skin. Science (New York, NY) 2014;346(6212):950–954. [DOI] [PMC free article] [PubMed] [Google Scholar]
- [54].Zimmermann K, Leffler A, Babes A, Cendan CM, Carr RW, Kobayashi J, Nau C, Wood JN, and Reeh PW. Sensory neuron sodium channel Nav1.8 is essential for pain at low temperatures. Nature 2007;447(7146):855–858. [DOI] [PubMed] [Google Scholar]
Associated Data
This section collects any data citations, data availability statements, or supplementary materials included in this article.