



Abstract
Background:
ASA24 is a self-administered web-based tool designed to collect detailed dietary data at low cost in observational studies.
Objective:
The objectives were to describe, overall and by demographic groups, the performance and feasibility of ASA24-2011 recalls and compare Healthy Eating Index-2015 (HEI-2015) total and component scores to four-day food records (4DFRs) and food frequency questionnaires (FFQs).
Design:
Over 12 months participants completed up to six ASA24 recalls, two web-based FFQs, and two unweighed paper-and-pencil 4DFRs. Up to three attempts were made to obtain each ASA24 recall. Participants were administered doubly-labeled water to provide a measure of total energy expenditure and collected two 24-hour urines to assess concentrations of nitrogen, sodium, and potassium.
Participants/setting:
From January through September 2012, 1,110 adult members of AARP, 50-74 years of age, were recruited from the Pittsburgh, Pennsylvania area to participate in The Interactive Diet and Activity Tracking in AARP (IDATA) Study. After excluding 33 participants who had not completed any dietary assessments, 531 men and 546 women remained.
Main outcome measures:
Response rates, nutrient intakes compared to recovery biomarkers across each ASA24 administration day, and HEI-2015 total and component scores were measured.
Statistical analyses performed:
Means, medians, SDs, interquartile ranges, and HEI-2015 total and component scores computed using a multivariate measurement error model are presented.
Results:
Ninety-one percent of men and 86% of women completed ≥3 ASA24 recalls. Approximately three-quarters completed ≥5, higher than the completion rates for two 4DFRs and two FFQs. Approximately, three-quarters of men and 70% of women completed ASA24 on the 1st attempt; one in five completed it on the 2nd. Completion rates varied slightly by age and body mass index. Median time to complete ASA24-2011 (current version: 2020) declined with subsequent recalls from 55 to 41 minutes in men and from 58 to 42 minutes in women and was lowest in those <60 years. Mean nutrient intakes were similar across recalls. For each recording day, energy intakes estimated by ASA24 were lower than energy expenditure. Reported intakes for protein, potassium, and sodium were closer to recovery biomarkers for women, but not for men. Geometric means of reported intakes of these nutrients did not systematically vary across ASA24 administrations, but differences between reported intakes and biomarkers differed by nutrient. Of 100 possible points, HEI-2015 total scores were nearly identical for 4DFRs and ASA24 recalls and higher for FFQs (men: 61, 60, and 68; women: 64, 64, and 72, respectively).
Conclusions:
ASA24, a freely-available dietary assessment tool for use in large-scale nutrition research, was found to be highly feasible. Similar to previously reported data for nutrient intakes, HEI-2015 total and component scores for ASA24 recalls were comparable to those for 4DFRs, but not FFQs.
Keywords: ASA24, feasibility, food frequency questionnaire, 4-day food record
INTRODUCTION
Starting in the mid-1980s, food frequency questionnaires (FFQs) were the instrument of choice for large-scale dietary cohort studies. FFQs provide a practical and affordable means to capture a comprehensive estimate of “usual” dietary intakes (generally queried as “over the past year” on an FFQ), leading to an explosion of cohort studies internationally that include the collection of dietary intake data.1 In the mid-2000s, recovery biomarkers (such as doubly labeled water (DLW) for energy expenditure, and protein, sodium and potassium from 24-hour urine collections) began to be used as reference instruments to examine the measurement error structure of self-reported dietary assessment tools, and to quantify how etiologic analyses of diet and disease may be affected when such error-prone assessments are used.2-10 Across different versions of FFQs, 24-hour recalls (24HRs), and food records (FRs), such studies generally indicate that short-term tools, including 24HRs and FRs, are completed with less systematic bias than FFQs at the group and individual levels. The Validation Studies Pooling Project, which pooled data from five large recovery biomarker validation studies, showed that absolute energy estimates from FFQs were underreported by 24-33% for both men and women relative to DLW. However, the average level of energy intake underreported on 24HRs compared to DLW is lower: 12-13% for middle-aged men, 6-16% for young and middle-aged women, but 25% for a study of elderly women (for whom memory limitations may be a more significant factor affecting recall accuracy). In contrast to these findings for energy, these pooled data show that there is much less underreporting on 24HRs for absolute intakes of protein (5%) and potassium (3%) compared to recovery biomarkers.11,12
Consistent findings across biomarker-based studies showing that 24HRs and FRs capture dietary intake with less bias than do FFQs11,12 highlight the potential for improving the evidence on diet and health. Minimizing bias is an important goal because it can lead to erroneous findings and can only be adjusted for using reference instruments that measure the dietary components of interest with little to no error or correlated bias.13 Given the paucity of and burdens and costs associated with obtaining reference measures such as recovery biomarkers, they are not typically collected in cohort studies. Although 24HRs and FRs provide less-biased data than do FFQs, this comes at the expense of more within-person variation. Repeat administrations of 24HRs or FRs for at least a representative subset of the study sample, however, allow for statistical modeling that can be applied to remove the within-person variation and estimate distributions of usual intakes. More administrations over time do not reduce bias, but provide better estimates of usual intake distributions by dampening the within-person variation.14 Several methods, such as the National Cancer Institute (NCI) Method, have been developed and disseminated in recent years to facilitate such statistical modeling.15 Collectively, the evidence from recovery biomarker studies and the available mitigation strategies to address within-individual variation support the use of 24HRs and FRs in epidemiologic research.13
Collecting either 24HRs or FRs as the main instrument in large observational studies, however, has been impractical because of the feasibility and costs associated with scheduling, employing interviewers, and coding data, especially when multiple administrations are considered. Tackling this challenge, the NCI, along with multiple co-funding Institutes and Offices at NIH, developed the Automated Self-Administered 24-hour Dietary Assessment Tool (ASA24), a freely available, web-based, automatically coded, self-administered tool that can be used to collect 24HRs and FRs for research, educational, and clinical purposes.16 The use of ASA24 to collect 24HRs has been evaluated in adults with respect to equivalence to traditional interviewer-administered 24HRs and in two feeding studies in which true intakes were known. Results show that ASA24 and interviewer-administered recalls perform nearly identically in capturing true intakes,17-20 with somewhat lower accuracy among a sample of women with low incomes.21 Few studies have used recovery biomarkers to assess traditional 24HRs, FRs, or FFQs;2-6,8-10 only a few have assessed other online recall systems;22,23 and until recently,24 none had specifically evaluated ASA24 recalls.
This current recovery biomarker study, the Interactive Diet and Activity Tracking in AARP (IDATA) study, was designed to evaluate the structure of measurement error in 24HR data collected using ASA24, as well as 4-day FR (4DFR) and FFQ data.25 Detailed descriptive analyses of IDATA dietary data comparing absolute and energy-adjusted nutrient intakes from all dietary assessment tools to recovery biomarkers are published.24 This paper primarily focuses on the performance of ASA24 recalls overall and by subgroups with respect to feasibility, response rates, and data quality as compared to recovery biomarkers, with further comparisons of Healthy Eating Index-2015 (HEI-2015) total and component scores based on ASA24s, 4DFRs, and FFQs.
PARTICIPANTS AND METHODS
Study population and design
Detailed methods and design of the IDATA study are described elsewhere24 and the data are publicly available from the NCI.25 Briefly, AARP members living in the Pittsburgh, Pennsylvania area were invited between January and September 2012 by mail to visit a study website if interested in participation. Those pre-registered on the website or by phone were pre-screened via telephone interview and demographic data were obtained. Eligibility criteria included being able to read and speak English, not being on a weight loss diet, being reasonably mobile, being free of health conditions affecting metabolism, and having access to high-speed internet. Eligible individuals visited a study center and provided informed consent. After excluding 20 individuals who did not provide any data, 1,110 men and women aged 50-74 years were included in the IDATA analytic cohort. All data collection was completed in October 2013. The study was approved by the NCI Special Studies Institutional Review Board and is registered on ClinicalTrials.gov (Identifier: NCT03268577).
Participants were divided into four study groups to reduce the influence of seasonal variation in diet and for practical reasons related to study center visits. Data collection and activities were identical for each group, but timing of the various data collection activities varied (Figure 1). All participants visited the study center to have anthropometry measurements taken at months 1, 6, and 12. Participants were asked to complete self-reported dietary assessments and 24-hour urine collections at home.
Figure 1:

Timeline of dietary assessments and biomarker measurements in the Interactive Diet and Activity Tracking in AARP (IDATA) Study conducted in the US, March 2012 - October 2013
a FFQ = food frequency questionnaire
b FC = food checklist
c ASA24 = Automated Self-administered 24-hour Dietary Assessment Tool (2011 version)
d 4DFR = 4-day food record
e Urine = 24-hr urine
f DLW = doubly labeled water
g DLW-s = doubly labeled water repeated in a subset of participants
A study management system supported all operational activities, including managing participants’ study accounts, scheduling study center visits and at-home activities, tracking study activities, generating reports to track study progress, and capturing, backing up and storing data. The system also incorporated functions such as scheduling ASA24 recalls and tracking completion. Each participant was provided a single account for the study website, which was used to complete diet and physical activity tools (data on physical activity are not reported here) and to find instructions and answers to frequently asked questions, if needed. In addition, study center staff answered participants’ questions by telephone throughout the study period.
Participants were partially remunerated for their participation after each study center visit, totaling $400 upon completion. For this analysis, participants who did not complete any dietary assessment tools (n=33) were excluded, leaving a final analytic sample of 1,077 (531 men and 546 women).24
ASA24-2011
ASA2426 is a web-based dietary assessment tool that was modeled on the US Department of Agriculture’s (USDA’s) Automated Multiple-Pass Method (AMPM) for 24HRs. AMPM requires multiple passes and frequent detailed probe questions which, according to research conducted by USDA, lead participants to include and remember more foods/drinks, and report more accurately the types and preparation of foods/drinks consumed than when the probe questions are not included.27 IDATA used ASA24-2011 (current version: ASA24-2020), which prompted participants to recall and report all foods, drinks and supplements they consumed the previous day from midnight-to-midnight. ASA24-2011 included an animated penguin avatar, which could be turned off if desired, to instruct participants. ASA24 first asked participants to select a meal or snack; for each meal or snack reported, participants were asked the time of the meal/snack, location (e.g., home, restaurant, cafeteria), whether others were present, and whether a television or computer was in use. Next, participants reported all foods and drinks consumed as part of the meal/snack by browsing food categories or searching results which provided a list of user-friendly terms. A meal gap review then queried any foods/drinks consumed between reported eating occasions separated by ≥ 3 hours. This was followed by detailed questions about each reported food or drink, including food type (e.g., raw), preparation (e.g., grilled, roasted), additions (e.g., sugar, coffee cream, salad dressing), and portion size. Digital images were used to facilitate portion size estimation. Participants were then prompted to review a list of commonly forgotten items (e.g., water, snack foods, coffee, tea, cheese, fruits, vegetables) and report any omitted, and then completed a final review of all reported foods and drinks, during which further corrections could be made. Next, respondents reported on any dietary supplements they had taken. Finally, participants were asked whether the amount consumed on the reporting day was more than usual, usual, or less than usual. Details about ASA24, including a demonstration version, can be found on the NCI website.26
Over a 12-month period, participants were asked via email and robotic telephone call, approximately every other month, to complete six ASA24 recalls, each unannounced and on a randomly assigned day. If a participant did not complete a requested recall within 24 hours of the email, within one week, on a new randomly assigned day, a reminder email and robotic call were sent. Participants were provided three attempts to complete each recall (Figure 2). The random assignment worked well, and recalls were collected on weekend (Fri-Sun) and weekdays (Mon-Thurs) proportional to their weekly occurrence (approximately 43% and 57%, respectively). The ASA24 system electronically tracked time to complete all recalls. The ASA24-2011 database estimated nutrient and food group intakes using USDA’s Food and Nutrient Database for Dietary Studies, version 4.1,28 the MyPyramid Equivalents Database version 2.0,29 and the National Health and Nutrition Examination Survey Dietary Supplement Database 2007-2008.30
Figure 2.
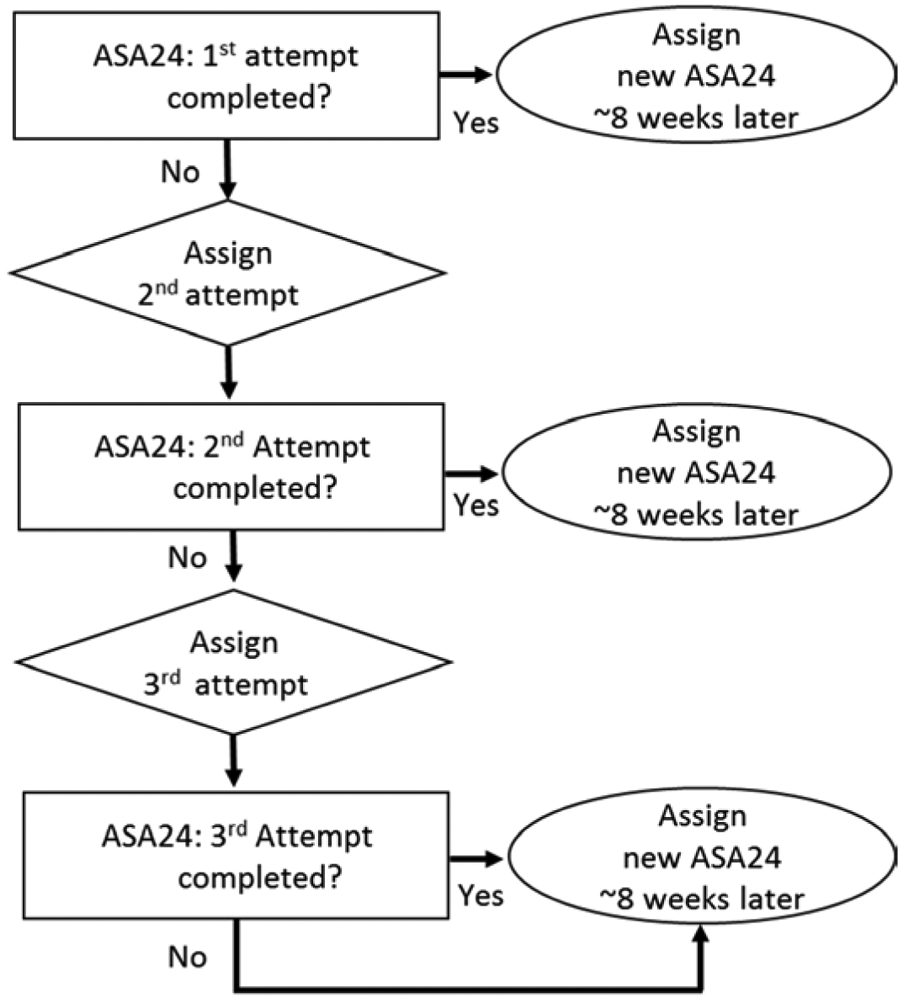
Automated Self-administered 24-hour Dietary Assessment Tool (ASA24) administration in the Interactive Diet and Activity Tracking in AARP (IDATA) Study conducted in the US, March 2012 - October 2013
Food frequency questionnaire and 4-day food record
An FFQ was administered at month 1 and 12. Participants could begin the web-based FFQ in the study center and complete it there or at home within 14 days. The FFQ used was the web-based Diet History Questionnaire (DHQ) II (most current version is DHQ III), developed by the NCI.31,32 It consists of 134 food items and 8 dietary supplement questions and queries frequency of consumption and portion sizes of foods consumed over the past 12 months. Frequency of intake is queried frequency using 10 predefined categories ranging from “never” to “6+ times per day” for beverages and from “never” to “2+ times per day” for foods. Three portion size categories were available. Time to complete the DHQ II was not available from the web-based system. More information about the DHQ II can be found on the NCI website.32
Participants were also asked to complete two paper-and-pencil unweighed 4DFRs, six months apart, in which foods and drinks consumed were recorded for four consecutive days (Figure 1). Dietary supplements were not queried or recorded for 4DFRs. Instructions on how to complete the record along with a serving size booklet were provided. An email reminder was sent to participants a day before the scheduled date. The 4DFRs were coded by trained coders using USDA’s Survey Net33 with linkage to the same databases for nutrient and food group estimation as those used for ASA24-2011.
Recovery biomarkers – doubly labeled water (DLW) and urinary nitrogen, potassium, and sodium
Participants were administered DLW to provide a measure of total energy expenditure (TEE) over a two-week period and collected two 24-hour urines to assess concentrations of nitrogen, sodium, and potassium as previously reported by Park et al.24
HEI-2015
The HEI-2015,34-36 a measure of diet quality that can be used to assess compliance with the Dietary Guidelines for Americans,37 was calculated for all three dietary assessment tools. For ASA24-2011, MyPyramid Equivalents were converted to Food Patterns Equivalents required for HEI-2015, using SAS code provided by NCI.38 Scores on the HEI range from 0-100, with 100 indicating the maximum score. Detailed information about the scoring and algorithms are provided elsewhere.39 Most of the HEI components are density based, that is, they are based on intake per 1000 kcal (e.g. total fruit cup equivalents/1000 kcal) per day.
Statistical analysis
Geometric means, medians, SDs, and the interquartile ranges for time to complete ASA24 and proportions for categorical variables were calculated. Because ASA24 allows respondents up to 30 minutes of inactivity prior to requiring them to log back in to finish by midnight of their reporting day, the longest completion time was truncated to 121 minutes (90th percentile) and medians and the interquartile range are reported.
Because the dietary guidelines are meant to apply to usual dietary intakes, a measurement error model that assumes that the self-report data are unbiased (not true), is recommended to adjust for within-person variation in intake when multiple days of intake are available.14 Mean total HEI and HEI component scores, were calculated using SAS code based on a multivariate measurement error model developed by NCI.15 Because intakes on any given day can be highly variable, no data collection days were excluded for ASA24s or 4DFRs. However, because FFQs are intended to measure usual intakes, for HEI analyses, FFQs were excluded if they had unusually high or low energy estimates based on cut points commonly used in epidemiologic studies (men: <800 or >4,200 kcal; women: <600 or >3,500 kcal).40
RESULTS
Table 1 outlines the demographic characteristics of the study population and response rates for all self-report dietary assessment tools. The mean age was 64 years for men and 62 years for women. Most participants were non-Hispanic whites, and 29% of men and 32% of women were obese as defined by a BMI ≥30.41
Table 1.
Characteristics of study participants and completion rates for ASA24a recalls, 4DFRsb, and FFQsc: the Interactive Diet and Activity Tracking in AARP (IDATA) Study conducted in the US, March 2012 – October 2013
| Men (n=531) |
Women (n=546) |
|
|---|---|---|
| Age (mean, SDd) | 64y (5.7) | 62y (6.0) |
| 50-59y | 24% | 35% |
| 60-69y | 56% | 51% |
| 70+y | 20% | 13% |
| Race/ethnicity, white non-Hispanic | 95% | 89% |
| Body mass index (kg/m2) | ||
| <25 | 22% | 34% |
| 25 -<30 | 50% | 34% |
| ≥30 | 29% | 32% |
| ASA24 completion | ||
| None | 4% | 6% |
| At least 2 | 94% | 91% |
| At least 3 | 91% | 86% |
| At least 4 | 84% | 80% |
| At least 5 | 81% | 74% |
| All six | 70% | 56% |
| Type of intake day reported | ||
| Weekday | 57% | 58% |
| Weekend | 43% | 42% |
| Season in which recall completed | ||
| Spring | 19% | 19% |
| Summer | 25% | 25% |
| Fall | 30% | 31% |
| Winter | 26% | 25% |
| 4DFR completion | ||
| None | 17% | 20% |
| 1st 4DFR | 80% | 78% |
| 2nd 4DFR | 69% | 65% |
| Both 4DFR | 66% | 63% |
| Day of week 4DFR completed | ||
| Weekday | 72% | 73% |
| Weekend | 28% | 27% |
| Season in which 4DFR completed | ||
| Spring | 19% | 22% |
| Summer | 37% | 37% |
| Fall | 31% | 27% |
| Winter | 13% | 14% |
| FFQ completion | ||
| None | 5% | 3% |
| 1st FFQ | 86% | 89% |
| 2nd FFQ | 78% | 74% |
| Both | 68% | 66% |
| Season in which FFQ completed | ||
| Spring | 32% | 38% |
| Summer | 57% | 52% |
| Fall | 6% | 4% |
| Winter | 5% | 5% |
ASA24 = Automated Self-administered 24-hour Dietary Assessment Tool
4DFRs = 4-day food records
FFQs = food frequency questionnaires
SD = standard deviation
Four percent, 17%, and 5% percent of men and 6%, 20%, and 3% of women never started an ASA24 recall, a 4DFR, or an FFQ, respectively. A total of 5,588 ASA24 recalls were collected; 222 (3.9%) were started but not completed and were therefore excluded. Among 1,572 4DFRs collected, 21 (1.3%) did not include 4 complete days and were excluded. One-thousand seven-hundred and fifty-seven FFQs were completed; those with unusually low or high energy estimates were excluded (n= 94 or 5.3%).
Most men (91%) and women (86%) completed at least three ASA24 recalls. Response rates declined over time with 70% of men and 56% of women completing all six requested recalls. Table 1 shows that the intended distribution of recalls over weekdays and weekend days was achieved and that there was a good balance of recalls across seasons. The first 4DFR was completed by 80% of men and 78% of women; 69% and 65% of men and women, respectively, completed the second 4DFR and 66% and 63% completed both records. Just over 70% of the consumption days recorded on the 4DFRs were weekdays (no attempt was made to include weekend versus weekdays in any predetermined proportion for the records). A higher number of 4DFRs were completed in the summer and fall than spring or winter because of the study design. The first FFQ was completed by 86% of men and 89% of women; 78% and 74% of men and women, respectively, completed a second FFQ and 68% and 66% completed both. Due to study design, there was no balance of FFQ administrations across seasons.
Table 2 shows the percentage of participants completing varying numbers of ASA24 recall administrations by sex (self-reported), age, and BMI groups. Those 70 years of age and older were more likely than those in other age groups not to complete any ASA24 recalls (nearly 5% of men and 11% of women in this group). Women categorized as obese were somewhat more likely than normal weight women or those characterized as overweight to complete no ASA24 recalls. Men characterized by overweight or obesity had somewhat better ASA24 completion rates compared to women in these weight categories. Otherwise, no clear patterns emerged for ASA24 completion by age or BMI. Men younger than 60 years and women older than 70 years had the highest non-response rates for the 4DFRs (23% and 24%). Generally, by age and BMI category, completion rates were lower for 4DFRs compared to recalls and FFQs, with normal weight men least likely to complete two 4DFRs than those in other BMI categories. Completion rates for the FFQs were lowest among those <60 years of age compared to other age groups for both men and women. Response rates for FFQs declined in a moderate stepwise fashion across BMI categories with 60-61% of men and women with obesity completing both FFQs compared to 71-73% of men and women characterized as normal weight.
Table 2.
Completion rates for ASA24a recalls, 4DFRsb, and FFQsc by sex, age group, and BMI41 groupd in the Interactive Diet and Activity Tracking in AARP (IDATA) Study conducted in the US, March 2012 – October 2013
| Men (n=531) |
Women (n=546) |
|||||
|---|---|---|---|---|---|---|
| Number completed |
50-59y (n=125) |
60-69y (n=299) |
70+y (n=107) |
50-59y (n=193) |
60-69y (n=280) |
70+y (n=73) |
| ASA24 | ||||||
| None | 2.4% | 4.4% | 4.7% | 5.7% | 5.7% | 11.0% |
| 1- 2 | 9.6% | 3.0% | 3.7% | 7.8% | 6.4% | 8.2% |
| 3-4 | 10.4% | 11.0% | 10.3% | 10.9% | 13.9% | 9.6% |
| 5-6 | 77.6% | 81.6% | 81.4% | 75.7% | 74.0% | 71.3% |
| 4DFR | ||||||
| None | 23.2% | 16.2% | 14.0% | 18.8% | 19.4% | 23.6% |
| 1 | 17.6% | 13.8% | 21.5% | 18.8% | 15.8% | 20.8% |
| 2 | 59.2% | 70.0% | 64.5% | 62.5% | 64.9% | 55.6% |
| FFQ | ||||||
| None | 8.8% | 4.3% | 0.9% | 5.3% | 3.4% | 6.6% |
| 1 | 27.2% | 28.4% | 24.3% | 36.8% | 23.2% | 27.6% |
| 2 | 64.0% | 67.2% | 74.8% | 57.9% | 73.4% | 65.8% |
| BMI group | BMI group | |||||
| Normal (n=114) |
Overweight (n=263) |
Obese (n=152) |
Normal (n=186) |
Overweight (n=184) |
Obese (n=173) |
|
| ASA24 | ||||||
| None | 5.3% | 2.7% | 5.3% | 5.4% | 4.9% | 9.3% |
| 1- 2 | 7.8% | 2.6% | 5.9% | 5.9% | 10.3% | 4.6% |
| 3-4 | 13.9% | 8.3% | 11.7% | 9.1% | 14.1% | 13.9% |
| 5-6 | 72.8% | 86.3% | 76.9% | 79.6% | 70.7% | 72.2% |
| 4DFR | ||||||
| None | 26.3% | 12.5% | 19.1% | 18.8% | 20.7% | 19.7% |
| 1 | 19.3% | 16.3% | 13.8% | 11.8% | 20.1% | 20.8% |
| 2 | 54.4% | 71.1% | 67.1% | 69.4% | 59.2% | 59.5% |
| FFQ | ||||||
| None | 3.1% | 2.9% | 5.5% | 2.2% | 4.3% | 3.5% |
| 1 | 26.4% | 32.1% | 34.2% | 24.7% | 30.4% | 35.8% |
| 2 | 70.5% | 65.0% | 60.3% | 73.1% | 65.2% | 60.7% |
ASA24 = Automated Self-administered 24-hour Dietary Assessment Tool
4DFRs = 4-day food records
FFQs = food frequency questionnaires
BMI = body mass index; BMI group = normal (BMI 18.5-24.9), overweight (BMI 25-29.9), and obese (BMI≥30)
Figure 3 reports the number of times, to a maximum of three, participants were contacted via emails and robotic calls to complete any of the six ASA24 administrations. The majority of men and women completed ASA24 after the first contact. Men <60 years of age were slightly more likely to require a second or third attempt; this was also true for women ≥70 years of age. Normal weight men were more likely to complete ASA24 on the first attempt compared to those categorized as overweight or obese; completion patterns by attempt were similar for women across BMI subgroups.
Figure 3.


Automated Self-administered 24-hour Dietary Assessment Tool (ASA24) completion pattern per attempta by sex, age, and body mass index (BMI41) group in the Interactive Diet and Activity Tracking in AARP (IDATA) Study conducted in the US, March 2012 - October 2013
a Total number of ASA24 recalls competed: 2,740 in men and 2,626 in women
b Normal (BMI 18.5-24.9); overweight (BMI 25-29.9); obese (BMI≥30)
Median time to complete the first ASA24-2011 administration was 55-58 min (Figure 4A); this declined to 40-44 minutes by the sixth administration. Participants younger than 60 years completed ASA24 in a shorter time than those 60 years of age and older (Figure 4B). Median completion time across all administrations of ASA24 was 40, 46, and 54 minutes in men less than 60 years of age, 60-69 years old, and 70 years of age and older, respectively. In women, the corresponding times were 42, 51, and 64 minutes.
Figure 4.


Median time (interquartile range)a to complete the Automated self-administered 24-hour Dietary Assessment Tool (ASA24) by sex, attempt, and age group in the Interactive Diet and Activity Tracking in AARP (IDATA) Study conducted in the US, March 2012 –October 2013
aBased on 2,602 ASA24 recalls completed in men and 2,484 ASA24 recalls competed in women.
Figures 5A-5D show geometric means of absolute intakes of energy, protein, potassium, and sodium based on reported food, beverage and supplement intakes for each of six ASA24 recalls compared to the respective recovery biomarkers, by sex. (Comparable data for each administration of a 4DFR and FFQ were previously published.24) Geometric means are traditionally used to compare agreement with recovery biomarkers, which are assumed to be reference instruments on the logarithmic scale. As previously shown by Park et al,24 energy intakes estimated by ASA24 were lower than energy expenditure for both men and women. Reported intakes for protein, potassium, and sodium were closer to recovery biomarkers for women, but not for men. This figure also indicates that the geometric means of reported intakes of these nutrients did not appear to systematically vary across ASA24 administrations and that the percentage differences between biomarker and self-report estimates differed by nutrient.
Figure 5.


Geometric mean energy, protein, potasium, and sodium intake based on the Automated Self-administered 24-hour Dietary Assessment Tool (ASA24) administration compared to recovery biomarkersa in the Interactive Diet and Activity Tracking in AARP (IDATA) Study conducted in the US in March 2012 –October 2013
aRecovery biomarkers: doubly labeled water for total energy (n=347 men and 356 women); urinary protein, sodium and potassium from 24-hour urine collections (protein calculated from nitrogen values, n=431 men and 439 women)
The ASA24 data were analyzed to assess differences in intakes by season of administration and weekday vs. weekend. Results (not shown) indicated no meaningful differences in mean intakes by season of administration, however, energy, fat and alcoholic beverage consumption tended to be somewhat higher on weekend days vs. weekdays.
HEI-2015 diet quality scores tended to be somewhat higher for women versus men for all instruments (Table 3). Total HEI-2015 scores were nearly identical for 4DFRs and ASA24 recalls (range: 60-64), while those for FFQs were 7-8 points higher (range: 68-72). Component scores were ≤ 0.5 point lower for ASA24 recalls/4DFRs compared to FFQs for Whole Fruits, Total Vegetables, Dairy, Seafood and Plant Proteins, and Added Sugars (women only), and were ≤ 0.5 point higher for ASA24 recalls/4DFRs compared to FFQs for Total Protein Foods and Added Sugars (men only). Whole Grains was the only HEI component for which ASA24 recalls/4DFRs compared to FFQs scores were >0.5 points higher. For Total Fruits, Greens and Beans, Fatty Acids, Refined Grains, Sodium, and Saturated Fats, HEI-2015 component scores for ASA24 recalls/4DFRs were all > 0.5 points lower than those for FFQs.
Table 3.
Healthy Eating Index (HEI)-2015 total and component scores based on ASA24a recalls, 4DFRsb, and FFQsc in men and women in the Interactive Diet and Activity Tracking in AARP (IDATA) Study conducted in the US, March 2012 – October 2013
| Men |
Women |
|||||||
|---|---|---|---|---|---|---|---|---|
| Component | Maxi- mum score |
Standard for maximum score (per 1,000kcal) |
Mean based on all ASA24 recalls |
Mean based on all 4DFRs |
Mean based on all FFQs |
Mean based on all ASA24 recalls |
Mean based on all 4DFRs |
Mean based on all FFQs |
| N | 510 | 439 | 506 | 511 | 438 | 528 | ||
| Total HEI-2015 Scored | 100 | 60.0 | 61.0 | 68.0 | 64.0 | 64.0 | 72.0 | |
| Adequacy components | ||||||||
| Total Fruits | 5 | ≥0.8 cup eq. | 3.2 | 3.3 | 3.9 | 3.7 | 3.7 | 4.3 |
| Whole Fruits | 5 | ≥0.4 cup eq. | 3.8 | 4.1 | 4.3 | 4.3 | 4.4 | 4.7 |
| Total Vegetables | 5 | ≥1.1 cup eq. | 3.8 | 3.7 | 4.0 | 4.3 | 4.4 | 4.5 |
| Greens and Beans | 5 | ≥0.2 cup eq. | 2.8 | 2.9 | 3.8 | 3.9 | 3.9 | 4.5 |
| Whole Grains | 10 | ≥1.5 oz eq. | 3.8 | 3.4 | 2.8 | 4.1 | 3.5 | 2.8 |
| Dairy | 10 | ≥1.3 cup eq. | 5.8 | 6.1 | 6.2 | 6.3 | 6.0 | 6.4 |
| Total Protein Foods | 5 | ≥2.5 oz eq. | 4.9 | 4.9 | 4.8 | 4.9 | 4.9 | 4.8 |
| Seafood and Plant Proteins | 5 | ≥0.8 oz eq. | 4.3 | 4.5 | 4.6 | 4.6 | 4.7 | 4.8 |
| Fatty Acids | 10 | (PUFAs+MUFAs) /SFAse ≥2.5 | 4.2 | 4.7 | 5.2 | 4.5 | 4.9 | 6.1 |
| Moderation componentsf | ||||||||
| Refined Grains | 10 | ≤1.8 oz eq. | 7.1 | 6.7 | 8.4 | 7.6 | 7.2 | 8.9 |
| Sodium | 10 | ≤1.1 g | 2.8 | 3.3 | 5.1 | 3.1 | 3.5 | 5.4 |
| Added Sugars | 10 | ≤6.5% energy | 8.1 | 8.2 | 8.0 | 7.9 | 8.0 | 8.0 |
| Saturated Fats | 10 | ≤8% energy | 5.3 | 5.2 | 6.5 | 5.1 | 4.8 | 6.5 |
ASA24 = Automated Self-administered 24-hour Dietary Assessment Tool
4DFRs = 4-day food records
FFQs = food frequency questionnaires
HEI-2015 = Healthy Eating Index – 2015; scores calculated using a multivariate measurement error model
PUFA = polyunsaturated fatty acids; MUFA = monounsaturated fatty acids; SFA = saturated fatty acids
Moderation components: lower intakes receive higher scores
DISCUSSION
This analysis reports on response rates for three commonly used dietary assessment tools by demographic groups, with a detailed exploration of ASA24 recalls. The findings provide useful practical information for those considering the use of such tools in dietary research, including cohort studies. With any questionnaire, response rates tend to drop with subsequent administrations, and this was certainly true for all the dietary assessment tools examined in this study. Comparing across instruments, however, is challenging given the varying levels of burden. There is very little published data on how long it takes to complete FFQs and given the variation across instruments, both in the number of items and details queried, and whether or not portion size is asked, it is not possible to estimate an overall average time of completion. Older data from the paper-based DHQ I, however, indicated a mean completion time of about 60 minutes. 42 In IDATA, two administrations were requested, and participants were given 14 days to complete each one. Two 4DFRs were also requested; however, recording of detailed intakes for four days likely posed a greater burden than recalls or FFQs though there are no metrics to assess this.
The completion of six ASA24 recalls was requested across a 12-month period (approximately every other month), each taking less than 60 minutes to complete for most (70%) respondents. In addition, most respondents (>80%) completed 4-5 ASA24 recalls, indicating feasibility in collecting multiple ASA24 recalls over long periods of time, across days of the week and seasons. Up to three attempts were made to complete each recall since, on any given day, a participant may not access their email, answer the phone or check messages, or have the time to complete a recall. Even though most participants completed a recall the first time they were asked, providing an additional two attempts led to sufficient additional completed recalls (24.2% for men and 28.4% for women) for each administration to make the effort worthwhile. Providing two to three total opportunities for completion is optimal, while gains beyond that are likely be minimal given that only an additional 6.6% of men and 7.5% of women completed recalls on the third attempt. Additionally, it appears that some demographic groups may require more support than others; women ≥70 years were less likely to complete ASA24 on the first attempt versus other age and BMI groups. Overall, however, completion rates for 4-5 ASA24 recalls were higher than for two 4DFRs and two FFQs.
The findings regarding time to complete indicate a learning curve for ASA24, a positive and common feature in using new applications and software.43 The learnability of ASA24 is evidenced by the drop in completion times from the first to subsequent administrations, with the biggest decline from the first to the second administration. Investigators should thus be prepared to address initial difficulties participants might experience. To assist investigators, the NCI ASA24 website26 advises on best practices and provides help guides that researchers can provide to participants. It is recommended that researchers and clinicians pilot test ASA24 in their populations prior to full scale use to assure that issues such as literacy and computer access do not override their ability to collect data.
Across all completed ASA24 recalls median time to complete ASA24-2011 was about 48 minutes. ASA24 usability, however, has improved with subsequent releases. The Beta version of ASA24 was released in 2009 and during the initial years of its development, smartphones, tablets, and wireless data service were not capable of handling the large graphic data (e.g., pictures of food) that ASA24 now incorporates. Since ASA24-2016 was released, the tool has been developed to be fully mobile-capable with a streamlined, modern interface meeting best practices for commonly used apps, and no longer includes an avatar. Current system-wide data show that the median time to complete ASA24-2016 and ASA24-2018 recalls is 24 minutes.26 A new version was released in Spring of 2020. With every new version, NCI strives to make improvements within the confines of budget and to keep the ASA24 “interview” as similar as possible to the AMPM interviewer-administered recall used in national surveillance.33
Previous research has shown a tendency for energy and nutrient intakes estimated based on FFQ to decline on second compared to first administrations.4,44-47 Findings for ASA24 in this study indicate no such systematic drift or demonstrable “fatigue” such that participants completed the recalls differently or less diligently over a year’s time. These findings do not mean, however, that ASA24 data are not subject to error and bias. Like all self-report dietary assessment tools, error is present as indicated by comparisons to recovery biomarkers as shown here and previously by Park et al.24 For the few nutrients for which recovery biomarkers have been identified, these data show that, based on geometric means, absolute intakes assessed by ASA24 were lower than recovery biomarker-measured intakes, particularly in men. As previously shown,24 however, energy-adjusted intakes show less reporting error than absolute intake estimates. Lower estimated nutrient intakes based on ASA24 recalls versus recovery biomarkers are likely due to issues related to memory, poor portion size estimation, and biased reporting.48 Researchers should be aware of the presence of measurement error in ASA24 and other self-report dietary data and interpret findings in the context of that error (even if not quantified in their research). When designing studies, including collection of recovery biomarkers in at least a subset of participants should be considered. Such data can be used to conduct sensitivity analyses to adjust for and assess the effect of measurement error on findings.13
These are the first findings that systematically compare HEI-2015 scores across multiple dietary assessment tools in the same participants. HEI-2015 scores for ASA24 recalls and 4DFRs are higher than those observed among adults based on NHANES.35 This is likely due to differences in the populations; IDATA was conducted with a select group of individuals willing to participate in an intensive study requiring multiple clinic visits and data collection over an entire year. The HEI-2015 scores based on ASA24 recalls and 4DFRs are more similar to one another and generally lower than scores based on FFQ data. These lower scores compared to FFQs are most pronounced ( >0.5 points) for the HEI components Total Fruits, Greens and Beans, Fatty Acids, Refined Grains, Sodium, and Saturated Fats. Although the study has no data as to why this is the case, previous studies have shown that compared to recalls or records, fruits and vegetables may be reported more often and desserts, snacks, and sweets less often on FFQs.49-52 Other important factors include the nature of the databases (nutrient values for FFQ line items represent composite values across multiple individual foods; nutrient values for 24HRs and FRs are based on individual foods), and the cognitive challenges in completing an FFQ versus recalls or records.48 Finally, because there was no adjustment for systematic error, it is not possible to determine which tool most accurately estimated an HEI score. If, however, the relative ranking (in terms of bias) of the three tools with respect to nutrients with recovery biomarkers holds for all foods and nutrients, it would indicate greater bias in the FFQ than the 24HRs and 4DFRs in the IDATA participants.
These findings indicate the feasibility and practicality of using ASA24 to collect recalls in large-scale dietary research. Some of the biggest challenges with respect to 24HRs relate to memory and portion size estimation.17,19,48,53 The multiple passes in AMPM, however, have been shown to increase the number of foods reported, indicating that it likely minimizes these issues compared to other less intensive recall methods27 and ASA24 employs the same strategy. Unweighed paper-and-pencil 4DFRs produced data similar to ASA24 in IDATA24 but, like any hand-written record, are impractical for population-based research because of significant time and expense associated with coding. Since the release of ASA24-2018, the tool includes the ability to collect food records (automatically coded and therefore providing an affordable alternative method for collecting dietary data). Care should be taken, however, given evidence that food records include significant bias related to reactivity (observation effect).54-57 FFQs are clearly practical and affordable in large-scale research but have been shown to be more biased than other modalities for absolute intakes of selected nutrients for which recovery biomarkers exist.11,12 In addition, they provide little or no detail on timing of meals, foods consumed in combination, fasting between meals, food preparation, etc. To advance nutrition science, collecting more detail is advisable, perhaps in conjunction with FFQs, which provide useful covariate information especially for episodically consumed foods. Having both types of instruments collected over time in large population-based studies would be a significant advance over collecting FFQs alone. 58
The current version of ASA24 (ASA24-2020) is a fully mobile web-based tool that is freely available for use by researchers, clinicians, and educators. It can be used to collect both 24HRs and FRs. It is important to note, however, that there are not as many detailed evaluations of FRs as there are for 24HRs. Country-specific versions exist for Canada and Australia. Participants completing the US version can do so in English or Spanish, and for the Canadian version, in English or French. Respondents can also report recipes and dietary supplements. When registering to use ASA24, researchers have multiple administration options, the most significant of which is choosing whether to use the tool as a 24HR or FR. For either, there are multiple options researchers can choose among, such as how many days of data to collect, number of attempts (for recalls), consecutive or non-consecutive days (for records), reports to participants, among others. From 2009 through January 2020, >6000 studies registered to use ASA24 and >521,000 recalls/records were collected. Since the tool has become mobile, on average, about 59 studies register to use it per month. Multiple resources and tools are available to assist researchers: Instructions, sample ethics documents, respondent help guides, a Helpdesk and Listserv. NCI also maintains and regularly updates a database of publications that detail studies that have used ASA24 to collect dietary intake data so that researchers can readily access information about how ASA24 has been used in different research settings and populations. ASA24 was developed and evaluated and is now supported by multiple Institutes and Offices at NIH because of their shared interest in providing grantees with high-quality, feasible and affordable tools to collect dietary data in research. More information can be found on the ASA24 website.26
CONCLUSIONS
These data show that multiple administrations of ASA24 are feasible in large scale population research and that mean intakes do not vary with time for up to six ASA24 recalls. HEI-2015 scores are comparable for multiple ASA24 recalls and 4-day food records and lower compared to FFQ. Research to evaluate differences in systematic error between dietary assessment methods with respect to the HEI are warranted.
Research Snapshot.
Research Question: Is collection of multiple dietary recalls using the web-based Automated Self-administered 24-hour Dietary Assessment Tool (ASA24) feasible in large population-based or clinical nutrition studies?
Key Findings: Most adults 50-74 years old (91% men, 86% women) completed ASA24 recalls at least three times over the course of one year, usually on the first of three attempts. Time to complete ASA24 declined steadily with each subsequent recall, with the biggest decline from the first to the second. Similar to previously reported data for nutrient intakes, Healthy Eating Index-2015 total and component scores for ASA24 were comparable to those for 4-day food records, but not food frequency questionnaires.
Acknowledgments
Funding: This study and ASA24 development were funded by the National Cancer Institute via contracts HHSN261201000087I, HHSN26100003, N02-PC-64406 with contributions from the Office of Dietary Supplements, the National Heart, Lung and Blood Institute, the National Institute of Diabetes and Digestive and Kidney Diseases, the Office of Behavioral and Social Science Research, the National Institute of Child Health and Human Development, and National Institute on Alcohol Abuse and Alcoholism (NIAAA), and via shared instrumentation grant RR020915 to University of Wisconsin for purchase of the isotope ratio mass spectrometer used in the urine analysis.
Footnotes
The study is registered on the ClinicalTrials.gov (https://clinicaltrials.gov), and the study identifier is NCT03268577
Conflict of interests: None
Publisher's Disclaimer: This is a PDF file of an unedited manuscript that has been accepted for publication. As a service to our customers we are providing this early version of the manuscript. The manuscript will undergo copyediting, typesetting, and review of the resulting proof before it is published in its final form. Please note that during the production process errors may be discovered which could affect the content, and all legal disclaimers that apply to the journal pertain.
Contributor Information
Amy F. Subar, National Cancer Institute, Division of Cancer Control and Population Sciences, 9609 Medical Center Drive, Room 4E140, Bethesda, MD 20814-9763.
Nancy Potischman, National Institutes of Health, Office of Dietary Supplements, 6100 Executive Blvd., Suite 3B01, MSC 7517, Bethesda, MD 20892-7517.
Kevin W. Dodd, National Cancer Institute, Division of Cancer Prevention, 9609 Medical Center Drive, Bethesda, MD 20814-9789.
Frances E. Thompson, National Cancer Institute, Division of Cancer Control and Population Sciences, 9609 Medical Center Drive, Bethesda, MD 20814-9763.
David J. Baer, US Department of Agriculture, Agricultural Research Service, 10300 Baltimore Avenue, Bldg 307-B BARC-East, Room 216, Beltsville , MD 20705-2350.
Dale A. Schoeller, Universtiy of Wisconsin, Biotech Center and Nutritional Sciences, 425 Henry Mall, Room 2102, Madison, WI 53706.
Douglas Midthune, National Cancer Institute, Division of Cancer Prevention, 9609 Medical Center Drive, Bethesda, MD 20814-9789.
Victor Kipnis, National Cancer Institute, Division of Cancer Prevention, 9609 Medical Center Drive, Bethesda, MD 20814-9789.
Sharon I. Kirkpatrick, University of Waterloo, 200 University Ave West, LHN 1713, Waterloo, Ontario, Canada N2L 3G1.
Beth Mittl, Westat, 1600 Research Boulevard, Rockville, MD 20850.
Thea P. Zimmerman, Westat, 1600 Research Boulevard, Rockville, MD 20850.
Deirdre Douglass, Westat, 1600 Research Boulevard, Rockville, MD 20850.
Heather R. Bowles, National Cancer Institute, Division of Cancer Prevention, 9609 Medical Center Drive, Bethesda, MD 20814-9789.
Yikyung Park, Washington University School of Medicine, Division of Public Health Sciences, Department of Surgery, St. Louis, MO.
References
- 1.Subar AF, Kushi LH, Lerman JL, Freedman LS. Invited Commentary: The Contribution to the Field of Nutritional Epidemiology of the Landmark 1985 Publication by Willett et al American journal of epidemiology. 2017;185(11):1124–1129. [DOI] [PubMed] [Google Scholar]
- 2.Day N, McKeown N, Wong M, Welch A, Bingham S. Epidemiological assessment of diet: a comparison of a 7-day diary with a food frequency questionnaire using urinary markers of nitrogen, potassium and sodium. International journal of epidemiology. 2001;30(2):309–317. [DOI] [PubMed] [Google Scholar]
- 3.Bingham SA, Gill C, Welch A, et al. Validation of dietary assessment methods in the UK arm of EPIC using weighed records, and 24-hour urinary nitrogen and potassium and serum vitamin C and carotenoids as biomarkers. International journal of epidemiology. 1997;26 Suppl 1:S137–151. [DOI] [PubMed] [Google Scholar]
- 4.Subar AF, Kipnis V, Troiano RP, et al. Using intake biomarkers to evaluate the extent of dietary misreporting in a large sample of adults: the OPEN study. American journal of epidemiology. 2003;158(1):1–13. [DOI] [PubMed] [Google Scholar]
- 5.Schatzkin A, Kipnis V, Carroll RJ, et al. A comparison of a food frequency questionnaire with a 24-hour recall for use in an epidemiological cohort study: results from the biomarker-based Observing Protein and Energy Nutrition (OPEN) study. International journal of epidemiology. 2003;32(6):1054–1062. [DOI] [PubMed] [Google Scholar]
- 6.Prentice RL, Mossavar-Rahmani Y, Huang Y, et al. Evaluation and comparison of food records, recalls, and frequencies for energy and protein assessment by using recovery biomarkers. American journal of epidemiology. 2011; 174(5) :591–603. [DOI] [PMC free article] [PubMed] [Google Scholar]
- 7.Arab L, Tseng CH, Ang A, Jardack P. Validity of a multipass, web-based, 24-hour self-administered recall for assessment of total energy intake in blacks and whites. American journal of epidemiology. 2011. ;174(11):1256–1265. [DOI] [PMC free article] [PubMed] [Google Scholar]
- 8.Moshfegh AJ, Rhodes DG, Baer DJ, et al. The US Department of Agriculture Automated Multiple-Pass Method reduces bias in the collection of energy intakes. The American journal of clinical nutrition. 2008;88(2):324–332. [DOI] [PubMed] [Google Scholar]
- 9.Neuhouser ML, Tinker L, Shaw PA, et al. Use of recovery biomarkers to calibrate nutrient consumption self-reports in the Women's Health Initiative. American journal of epidemiology. 2008;167(10):1247–1259. [DOI] [PubMed] [Google Scholar]
- 10.Huang Y, Van Horn L, Tinker LF, et al. Measurement error corrected sodium and potassium intake estimation using 24-hour urinary excretion. Hypertension. 2014;63(2):238–244. [DOI] [PMC free article] [PubMed] [Google Scholar]
- 11.Freedman LS, Commins JM, Moler JE, et al. Pooled results from 5 validation studies of dietary self-report instruments using recovery biomarkers for energy and protein intake. American journal of epidemiology. 2014;180(2):172–188. [DOI] [PMC free article] [PubMed] [Google Scholar]
- 12.Freedman LS, Commins JM, Moler JE, et al. Pooled results from 5 validation studies of dietary self-report instruments using recovery biomarkers for potassium and sodium intake. American journal of epidemiology. 2015;181(7):473–487. [DOI] [PMC free article] [PubMed] [Google Scholar]
- 13.Freedman LS, Schatzkin A, Midthune D, Kipnis V. Dealing With Dietary Measurement Error in Nutritional Cohort Studies. J Natl Cancer I. 2011;103(14):1086–1092. [DOI] [PMC free article] [PubMed] [Google Scholar]
- 14.Dodd KW, Guenther PM, Freedman LS, et al. Statistical methods for estimating usual intake of nutrients and foods: a review of the theory. J Am Diet Assoc. 2006;106(10):1640–1650. [DOI] [PubMed] [Google Scholar]
- 15.National Cancer Institute. Software for measurement error in nutrition research. Website: https://prevention.cancer.gov/research-groups/biometry/measurement-error-impact/software-measurement-error. Accessed June 2019.
- 16.Subar AF, Kirkpatrick SI, Mittl B, et al. The Automated Self-Administered 24-hour dietary recall (ASA24): a resource for researchers, clinicians, and educators from the National Cancer Institute. Journal of the Academy of Nutrition and Dietetics. 2012;112(8):1134–1137. [DOI] [PMC free article] [PubMed] [Google Scholar]
- 17.Kirkpatrick SI, Subar AF, Douglass D, et al. Performance of the Automated Self-Administered 24-hour Recall relative to a measure of true intakes and to an interviewer-administered 24-h recall. The American journal of clinical nutrition. 2014;100(1):233–240. [DOI] [PMC free article] [PubMed] [Google Scholar]
- 18.Thompson FE, Dixit-Joshi S, Potischman N, et al. Comparison of Interviewer-Administered and Automated Self-Administered 24-Hour Dietary Recalls in 3 Diverse Integrated Health Systems. American journal of epidemiology. 2015;181(12):970–978. [DOI] [PMC free article] [PubMed] [Google Scholar]
- 19.Kirkpatrick SI, Potischman N, Dodd KW, et al. The Use of Digital Images in 24-Hour Recalls May Lead to Less Misestimation of Portion Size Compared with Traditional Interviewer-Administered Recalls. The Journal of nutrition. 2016;146(12):2567–2573. [DOI] [PMC free article] [PubMed] [Google Scholar]
- 20.Pannucci TE, Thompson FE, Bailey RL, et al. Comparing Reported Dietary Supplement Intakes between Two 24-Hour Recall Methods: The Automated Self-Administered 24-Hour Dietary Assessment Tool and the Interview-Administered Automated Multiple Pass Method. Journal of the Academy of Nutrition and Dietetics. 2018;118(6):1080–1086. [DOI] [PMC free article] [PubMed] [Google Scholar]
- 21.Kirkpatrick SI, Guenther PM, Douglass D, et al. The Provision of Assistance Does Not Substantially Impact the Accuracy of 24-Hour Dietary Recalls Completed Using the Automated Self-Administered 24-H Dietary Assessment Tool among Women with Low Incomes. The Journal of nutrition. 2019;149(1):114–122. [DOI] [PMC free article] [PubMed] [Google Scholar]
- 22.Wark PA, Hardie LJ, Frost GS, et al. Validity of an online 24-h recall tool (myfood24) for dietary assessment in population studies: comparison with biomarkers and standard interviews. BMC Medicine. 2018;16(1):136. [DOI] [PMC free article] [PubMed] [Google Scholar]
- 23.Lafrenière J, Lamarche B, Laramée C, Robitaille J, Lemieux S. Validation of a newly automated web-based 24-hour dietary recall using fully controlled feeding studies. BMC Nutrition. 2017;3(1):34. [DOI] [PMC free article] [PubMed] [Google Scholar]
- 24.Park Y, Dodd KW, Kipnis V, et al. Comparison of self-reported dietary intakes from the Automated Self-Administered 24-h recall, 4-d food records, and food-frequency questionnaires against recovery biomarkers. The American journal of clinical nutrition. 2018;107(1):80–93. [DOI] [PMC free article] [PubMed] [Google Scholar]
- 25.National Cancer Institute. Cancer Access Data System, IDATA. Website: https://biometry.nci.nih.gov/cdas/idata/. Accessed June 2019.
- 26.National Cancer Institute. Automated Self-Administered 24-Hour (ASA24®) Dietary Assessment Tool. Website: https://epi.grants.cancer.gov/asa24/. Accessed June 2019. .
- 27.Steinfeldt L, Anand J, Murayi T. Food reporting patterns in the USDA Automated Multiple-Pass Method. Proc Food Sci. 2013;2:145–156. [Google Scholar]
- 28.US Department of Agriculture. Food and Nutrient Database for Dietary Studies. https://www.ars.usda.gov/northeast-area/beltsville-md-bhnrc/beltsville-human-nutrition-research-center/food-surveys-research-group/docs/fndds-download-databases/. Accessed June 2019.
- 29.US Department of Agriculture. Food Patterns Equivalents Database. Website: https://www.ars.usda.gov/northeast-area/beltsville-md-bhnrc/beltsville-human-nutrition-research-center/food-surveys-research-group/docs/fped-databases/. Accessed June 2019.
- 30.National Center for Health Statistics. National Health and Nutrition Examination Survey Dietary Data. Website: https://wwwn.cdc.gov/nchs/nhanes/Search/DataPage.aspx?Component=Dietary. Accessed June 2019.
- 31.National Cancer Institute. Diet History Questionnaire II (DHQ II) for U.S. & Canada. Website: https://epi.grants.cancer.gov/dhq2/. Accessed April 2019.
- 32.National Cancer Institute . Diet History Questionnaire II & Canadian Diet History Questionnaire II: Web-based DHQ, Website: https://epi.grants.cancer.gov/dhq2/webquest/. Accessed January 2020.
- 33.Raper N, Perloff B, Ingwersen L, Steinfeldt L, Anand J. An overview of USDA's dietary intake data system. J Food Compos Anal. 2004;17(3-4):545–555. [Google Scholar]
- 34.Krebs-Smith SM, Pannucci TE, Subar AF, et al. Update of the Healthy Eating Index: HEI-2015. Journal of the Academy of Nutrition and Dietetics. 2018;118(9):1591–1602. [DOI] [PMC free article] [PubMed] [Google Scholar]
- 35.Reedy J, Lerman JL, Krebs-Smith SM, et al. Evaluation of the Healthy Eating Index-2015. Journal of the Academy of Nutrition and Dietetics. 2018;118(9):1622–1633. [DOI] [PMC free article] [PubMed] [Google Scholar]
- 36.Kirkpatrick SI, Reedy J, Krebs-Smith SM, et al. Applications of the Healthy Eating Index for Surveillance, Epidemiology, and Intervention Research: Considerations and Caveats. Journal of the Academy of Nutrition and Dietetics. 2018;118(9):1603–1621. [DOI] [PMC free article] [PubMed] [Google Scholar]
- 37.Department of Health and Human Services and the US Department of Agriculture. Dietary Guidelines for Americans 2015-2020. Website: https://health.gov/dietaryguidelines/2015/guidelines/. Accessed January 2020.
- 38.National Cancer Institute. Healthy Eating Index, SAS Code. Website: https://epi.grants.cancer.gov/hei/sas-code.html. Accessed January 2020.
- 39.National Cancer Institute. Overview & Background of The Healthy Eating Index. Website: https://epi.grants.cancer.gov/hei/ Accessed April 2019.
- 40.Willett W. Nutritional Epidemiology. 3rd ed. New York: Oxford University Press; 2012. [Google Scholar]
- 41.World Health Organization. Physical Status: The Use and Interpretation of Anthropometry: Report of a World Health Organization (WHO) Expert Committee. Geneva, Switzerland: World Health Organization; In. Geneva, Switzerland: World Health Organization; 1995. [PubMed] [Google Scholar]
- 42.Subar AF, Ziegler RG, Thompson FE, et al. Is shorter always better? Relative importance of questionnaire length and cognitive ease on response rates and data quality for two dietary questionnaires. American journal of epidemiology. 2001;153(4):404–409. [DOI] [PubMed] [Google Scholar]
- 43.Coyle CL, Peterson M. Learnability Testing of a Complex Software Application 2016; In: Marcus A. (eds) Design, User Experience, and Usability: Novel User Experiences. DUXU 2016. Lecture Notes in Computer Science, vol 9747 Springer, Cham. [Google Scholar]
- 44.Rimm EB, Giovannucci EL, Stampfer MJ, Colditz GA, Litin LB, Willett WC. Reproducibility and Validity of an Expanded Self-Administered Semiquantitative Food Frequency Questionnaire among Male Health-Professionals. American journal of epidemiology. 1992;135(10):1114–1126. [DOI] [PubMed] [Google Scholar]
- 45.Pietinen P, Hartman AM, Haapa E, et al. Reproducibility and Validity of Dietary Assessment Instruments .1. A Self-Administered Food Use Questionnaire with a Portion Size Picture Booklet. American journal of epidemiology. 1988;128(3):655–666. [DOI] [PubMed] [Google Scholar]
- 46.Kesse-Guyot E, Castetbon K, Touvier M, Hercberg S, Galan P. Relative Validity and Reproducibility of a Food Frequency Questionnaire Designed for French Adults. Ann Nutr Metab. 2011;57(3-4):153–162. [DOI] [PubMed] [Google Scholar]
- 47.Willett WC, Sampson L, Stampfer MJ, et al. Reproducibility and Validity of a Semiquantitative Food Frequency Questionnaire. American journal of epidemiology. 1985;122(1):51–65. [DOI] [PubMed] [Google Scholar]
- 48.Thompson FE, Subar AF. Dietary Assessment Methodology Nutrition in the Prevention and Treatment of Disease, 4th Edition. 2017:5–48. [Google Scholar]
- 49.Feskanich D, Rimm EB, Giovannucci EL, et al. Reproducibility and Validity of Food-Intake Measurements from a Semiquantitative Food Frequency Questionnaire. J Am Diet Assoc. 1993;93(7):790–796. [DOI] [PubMed] [Google Scholar]
- 50.Mendez MA, Wynter S, Wilks R, Forrester T. Under- and overreporting of energy is related to obesity, lifestyle factors and food group intakes in Jamaican adults. Public Health Nutr. 2004;7(1):9–19. [DOI] [PubMed] [Google Scholar]
- 51.Millen AE, Tooze JA, Subar AF, Kahle LL, Schatzkin A, Krebs-Smith SM. Differences between Food Group Reports of Low-Energy Reporters and Non-Low-Energy Reporters on a Food Frequency Questionnaire. J Am Diet Assoc. 2009;109(7): 1194–1203. [DOI] [PMC free article] [PubMed] [Google Scholar]
- 52.Segovia-Siapco G, Singh P, Haddad E, Sabate J. Relative Validity of a Food Frequency Questionnaire Used to Assess Food Intake During a Dietary Intervention Study. Nutr Cancer. 2008;60(5):603–611. [DOI] [PubMed] [Google Scholar]
- 53.Subar AF, Crafts J, Zimmerman TP, et al. Assessment of the Accuracy of Portion Size Reports Using Computer-Based Food Photographs Aids in the Development of an Automated Self-Administered 24-Hour Recall. J Am Diet Assoc. 2010;110(1):55–64. [DOI] [PMC free article] [PubMed] [Google Scholar]
- 54.Kirkpatrick SI, Midthune D, Dodd KW, Potischman N, Subar AF, Thompson FE. Reactivity and Its Association with Body Mass Index across Days on Food Checklists. Journal of the Academy of Nutrition and Dietetics. 2012;112(1):110–118. [DOI] [PMC free article] [PubMed] [Google Scholar]
- 55.Buzzard IM, Faucett CL, Jeffery RW, et al. Monitoring dietary change in a low-fat diet intervention study: Advantages of using 24-hour dietary recalls vs food records. J Am Diet Assoc. 1996;96(6):574–579. [DOI] [PubMed] [Google Scholar]
- 56.Rebro SM, Patterson RE, Kristal AR, Cheney CL. The effect of keeping food records on eating patterns. J Am Diet Assoc. 1998;98(10):1163–1165. [DOI] [PubMed] [Google Scholar]
- 57.Vuckovic N, Ritenbaugh C, Taren DL, Tobar M. A qualitative study of participants' experiences with dietary assessment. J Am Diet Assoc. 2000;100(9):1023–1028. [DOI] [PubMed] [Google Scholar]
- 58.Carroll RJ, Midthune D, Subar AF, et al. Taking advantage of the strengths of 2 different dietary assessment instruments to improve intake estimates for nutritional epidemiology. American journal of epidemiology. 2012;175(4):340–347. [DOI] [PMC free article] [PubMed] [Google Scholar]