Abstract
Climbing fibers (CFs) from the inferior olive (IO) make strong excitatory synapses onto cerebellar Purkinje cell (PC) dendrites, and trigger distinctive responses known as complex spikes (CSs). We find that in awake mice, a CS in one PC suppresses conventional simple spikes (SSs) in neighboring PCs for several milliseconds. This involves a novel ephaptic coupling, in which an excitatory synapse generates large negative extracellular signals that nonsynaptically inhibit neighboring PCs. The distance dependence of CS-SS ephaptic signaling, combined with the known CF divergence, allows a single IO neuron to influence the output of the cerebellum by synchronously suppressing the firing of potentially over one hundred PCs. Optogenetic studies in vivo, and dynamic clamp studies in slice, indicate that such brief PC suppression, either as a result of ephaptic signaling or other mechanisms, can effectively promote firing in neurons in the deep cerebellar nuclei with remarkable speed and precision.
Introduction
Climbing fiber (CF) synapses onto Purkinje cells (PCs) are essential for cerebellar learning and function 1. PCs are the sole outputs of the cerebellar cortex; each receives a single powerful CF synapse from the inferior olive 2. Activation of a CF onto a PC evokes a complex spike (CS) 2 that results from strong depolarization, dendritic calcium electrogenesis, and a sodium action potential followed by spikelets 2. CSs occur at 1-2 Hz and are readily distinguished from conventional sodium spikes (simple spikes (SSs))2 that occur at frequencies of tens to over 100 Hz. Mossy fiber inputs to the cerebellar cortex activate granule cells (grCs). Tens of thousands of grCs form weak synapses onto each PC. It is thought that the cerebellum transforms mossy fiber inputs into PC outputs that predict behavioral outcome 3,4. CFs provide instructive signals that regulate those grC to PC synapses, as well as serving additional roles 1,5 . CSs are followed by a pause in SSs 6–8, allowing CFs to directly affect cerebellar output 2,9–13. In addition, CF to PC synapses release so much glutamate that it spills over to activate nearby molecular layer interneurons (MLIs) and Golgi cells (GCs) 14–18. Thus, the CF plays a central role in cerebellar learning, regulates activity within the cerebellar cortex, and controls the output of the cerebellar cortex.
Here we ask whether CF synapses can directly inhibit nearby PCs with just their extracellular potentials, an effect known as ephaptic signaling 19–27. Most ephaptic signaling described previously involves changes where action potential firing is initiated. At synapses between cerebellar basket cells and PCs, current flow through potassium channels of a presynaptic specialization known as a pinceau produces depolarizing extracellular signals near the axon, transiently inhibiting the target PC 21. Ephaptic coupling also occurs between PCs to promote synchronous firing. During a SS, sodium channels in the initial segment generate a hyperpolarizing extracellular signal that opens sodium channels in the axons of neighboring PCs to promote spike initiation 20. We hypothesized that CSs could also generate large extracellular signals that influence the firing of nearby PCs.
Using in vivo multielectrode recordings, we found that CSs immediately suppress SSs in neighboring cells for about two milliseconds. We found that this suppression was mediated by a novel form of ephaptic signaling whereby current flow through glutamate receptors generates dendritically-localized extracellular hyperpolarization that reduces the firing of neighboring PCs. Based on the observed spread of ephaptic signaling, the close spacing of PCs 28, and the divergence of IO neurons29, our findings suggest that each IO neuron can synchronously suppress firing in approximately 100 PCs. Dynamic clamp and optogenetic studies indicate that such brief suppression of PC firing leads to transient disinhibition that can be highly effective at promoting firing in the deep cerebellar nuclei (DCN).
Results
In order to assess whether CSs in one PC influence SSs in neighboring PCs, we used a multielectrode probe to record from pairs of PCs in awake animals (Fig. 1a, Extended Data Fig. 1). SSs occurred at much higher frequencies and had very different waveforms than CSs (Fig. 1b). Following a CS there was a characteristic pause of SS firing in that same PC (Extended Data Fig. 2). To our surprise, CSs in one cell also produced a short-latency transient decrease in SSs in neighboring PCs (Fig. 1c–g; Extended Data Fig. 2b). CSs recorded on one electrode (Fig. 1ca) were used to align recordings from a second site (Fig. 1cb). It was clear from superimposed trials, (Fig. 1cb), a raster plot (Fig. 1cc), and a histogram (Fig. 1cd) that spikes in PC2 were suppressed immediately after a CS in PC1. Analysis of many pairs of PCs revealed that the decrease in firing was distance dependent (Fig. 1d). Suppression was largest for neighboring contacts (25 μm), smaller for 50 μm separation, and absent for separations of 75 μm or more (Fig. 1e). Based on cells where the signal-to-noise ratio made such estimates reliable, we estimate the half width of pauses is 1.9 ± 0.2 ms (n=9) for neighboring contacts, and 1.8 ± 0.1 ms (n=5) for PC pairs separated by one site.
Fig. 1. Complex spikes in a Purkinje cell rapidly and transiently suppress simple-spike firing in neighboring PCs in awake mice.
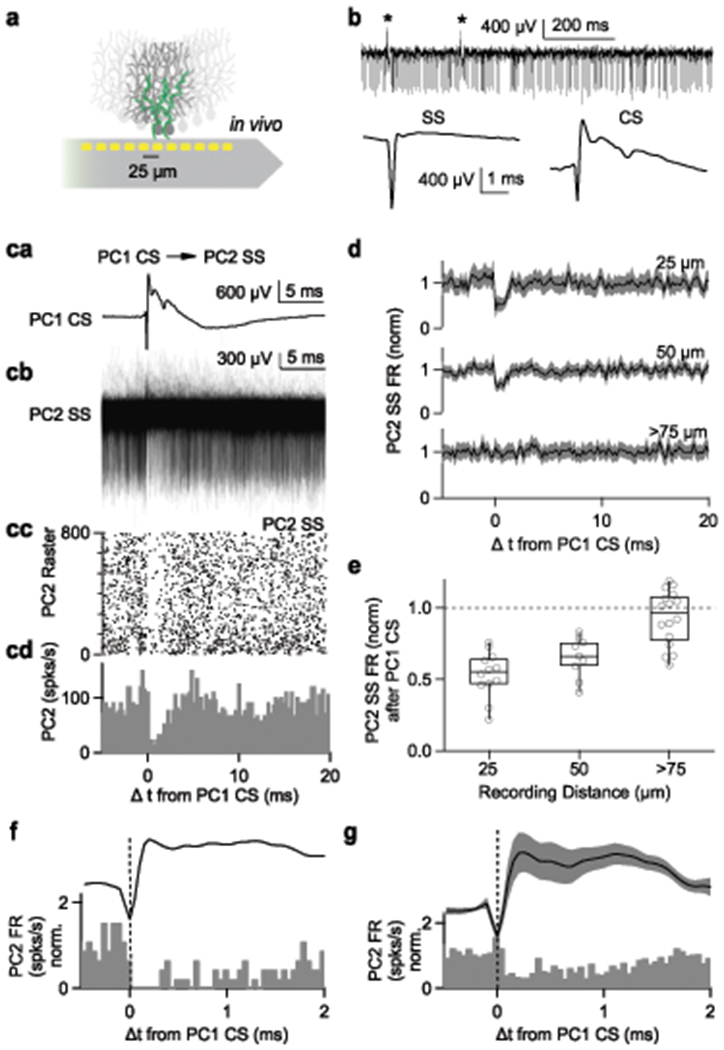
(a) Schematic showing recording probe near PCs innervated by climbing fibers (green).
(b) (top) Raw traces showing spikes recorded from single recording site. Asterisks indicate complex spikes. (bottom) Average simple spike (SS) and complex spike (CS), 10 minute recording.
(c, a) Average complex spike recorded on single site (PC1 CS).
(c, b) Simple spikes simultaneously recorded on a neighboring site (PC2 SS) are aligned to PC1 CS.
(c, c) Raster plot of simple spikes from (c, b).
(c, d) Histogram summarizing the data in (c, b)
(d) Average firing rate of simple spikes from neighboring PCs (PC2 SS) after complex spikes from PC1 (PC1 CS). Recording sites were separated by 25 μm (top, n=12 pairs), 50 μm (middle, n=9), and more than 75 μm (bottom, n=16). Shaded grey is mean ± s.e.m
(e) Summary of pre-CS-normalized PC2 SS firing rates after PC1 CS as a function of distance between recording sites. Box plots indicate median and interquartile range with the whiskers indicating the range. One sample, two sided t-test (25μm; p=0.0000006, 50μm; p=0.00008, 75μm; p=0.16)
(f) The CS waveform and the histogram of SSs recorded in a neighboring cell from (c) shown on an expanded time scale.
(g) The average CS waveform and the histogram of SSs recorded in nearest neighbor PCs are displayed to illustrate the relative timing. Shaded error bar indicates mean ± s.e.m.
CSs suppressed SSs in neighboring cells with remarkable speed. The SS suppression in neighboring cells begins at approximately the same time as the peak of the negative component of the CS (Fig. 1f). The average CS waveform and the average SS responses of neighboring cells showed similar timing (Fig. 1g). of suppression.
Mechanism of CS suppression of spiking in nearby PCs
We considered a number of mechanisms that could allow CSs to suppress SSs in neighboring cells. Gap junction coupling can allow neurons to inhibit other cells, but PCs are not electrically coupled 20. Alternatively, CF activation could evoke disynaptic inhibition in neighboring PCs. Both PCs and MLIs inhibit PCs 30–32. However, although PCs make collateral synapses onto other PCs, and can contact their nearest neighbors, our previous study suggests that only 10% of all neighboring PCs would be contacted, and the PC-to-PC synaptic delay is too slow to mediate the inhibition of nearby cells30. Finally, our observation that SSs promote synchronous firing in neighboring PCs, but CSs suppress SSs (Extended Data Fig. 4), is difficult reconcile with CS-associated suppression arising from PC collaterals. We also considered the possibility that CFs excite MLIs to produce rapid disynaptic inhibition. Glutamate spillover from CF to PC synapses excites MLIs that in turn inhibit nearby PCs, but the spillover current in MLIs begins 1-2 milliseconds after CF-EPSCs in PCs, has a rise time of 0.7 ms, and evokes IPSCs that begin approximately 3-5 milliseconds after CF-EPSC onset14. This slow response makes it unlikely that MLIs mediate the rapid CS-evoked suppression of nearby PCs. We also tested this possibility by examining the effect of MLI suppression on CS suppression of SSs on neighboring cells (Extended Data Fig. 3). We found that optogenetic suppression of MLI firing elevated PC firing, but did not prevent CSs from inhibiting neighboring cells. Thus, it is unlikely that electrical coupling or disynaptic inhibition accounts for the rapid CS-induced inhibition of SSs in neighboring PCs.
We next considered ephaptic coupling as a mechanism for CS inhibition of SSs. We have previously shown that ephaptic coupling allows PCs to promote synchronous firing in neighboring PCs 20. We found that for PCs in our study, SS activity for PC pairs was synchronized and that the larger the extent of SS synchronization the more strongly CSs suppress SSs in the neighboring PC (Extended Data Fig. 4). It is surprising that for a pair of neighboring PCs, CSs in one PC suppress SSs, whereas SSs elevate SSs 20. How can ephaptic coupling allow CSs to suppress and SSs to promote spiking in neighboring PCs?
SSs and CSs produce very different extracellular signals. For SSs, sodium influx near the axon initial segment (AIS) produces a hyperpolarizing extracellular potential that activates sodium channels in the axons of neighboring PCs 20. CSs are more complicated. CF activation initially opens AMPA receptors, depolarizing the PC. This triggers dendritic calcium entry, evokes a short-latency sodium spike followed by a series of smaller spikelets, and ultimately activates potassium channels.
As a first step in evaluating possible ephaptic signaling by CSs, we used a linear electrode array oriented to record from dendritic, somatic, and axonal compartments of a PC . We also measured extracellular signals associated with SSs (Fig. 2a, left), which were used to estimate the location of the AIS. As shown in this recording, the site at 0 μm shows SS and CS signals similar to what has been reported previously 33–35. The initial sodium spike component of the CS is narrower and smaller than a SS, and is preceded by an initial positive signal (Fig. 2b). These factors may limit the ability of the sodium spike component of the CS to mediate ephaptic excitation of PCs.
Fig. 2. Extracellular potentials generated by simple spikes and complex spikes from Purkinje Cells in vivo and in brain slice.
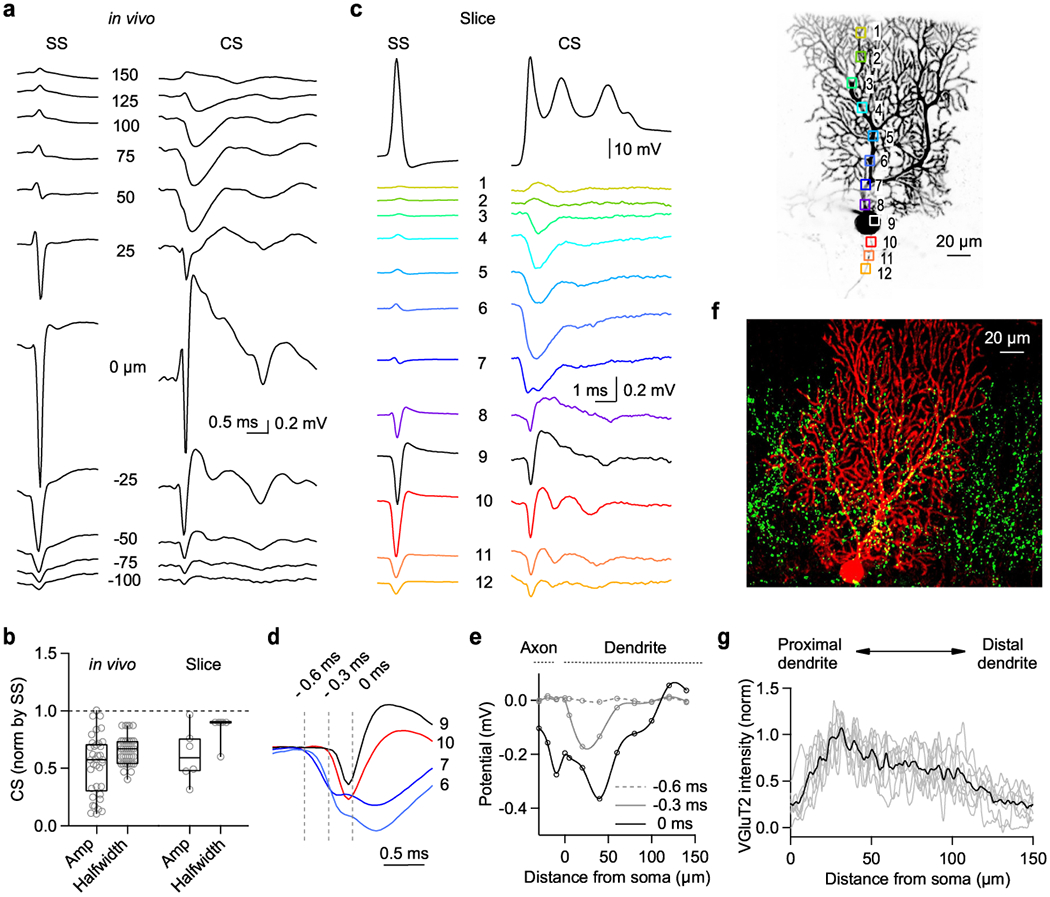
(a) Extracellular potentials recorded with a linear multielectrode array in a head-fixed awake mouse are shown for spontaneous simple spikes (SS) and complex spikes (CS).
(b) Amplitudes and halfwidths of the initial negative deflection of the extracellular CS were normalized by SS properties for in vivo and slice recordings. Box plots indicate median and interquartile range with the whiskers indicating the range.
(c) (top) SS (left) and CS (middle) responses measured by whole cell patch clamp in acute cerebellar slice for the fluorescently labeled cell (right). 8 times reproduced.
(bottom) Extracellular signals produced by SSs and CSs are color-coded, and were measured in the indicated regions dendrite (1-8), soma (9), and axon (10-12).
(d) Average extracellular voltage changes produced by a CS measured in (c) are superimposed for the indicated region to compare their time course and amplitude (n=8 cells).
(e) Summary of the amplitudes of extracellular potentials produced by a CS as a function of distance from soma at different time point indicated in (d) (n=8 cells).
(f) Representative image of a PC (biocytin, red) in a slice immunostained for VGluT2 (green). 8 times reproduced.
(g) Summary of VGluT2 immunostaining as a function of distance from the PC layer (average black, individual slices (grey) (n=8 slices).
Signals in dendritic region are very different for the CS than for the SS. SSs are strongly attenuated 50 μm from the AIS because most current flow associated with a sodium spike occurs in the AIS. For a CS, we observed a hyperpolarized extracellular potential throughout the proximal dendrite (50-125 microns) that flipped sign at the surface of the molecular layer and near the soma. This is consistent with current flow into the proximal dendrites and out of the distal dendrites and soma. Qualitatively similar results were obtained for 6 cells. However, it is very difficult to know the precise position of electrodes relative to the cell of interest for such in vivo recordings.
We therefore complemented in vivo recordings by measuring signals in acute brain slices using a fluorescent dye in PCs to guide electrode placement (Fig. 2c–e). We obtained whole-cell recordings from PCs, evoked CSs (Fig. 2c, top) as described (Extended Data Fig. 5), and recorded extracellular signals with a second electrode (Fig. 2c, right). Extracellular signals evoked by SSs and CSs in slice were qualitatively similar to those recorded in vivo (Fig. 2c middle, blue traces 3-7). Evoked CSs in slice also had a smaller and narrower extracellular negativity relative to the SS (Fig. 2b). The amplitudes of CSs and SSs were smaller in slice recordings than in vivo. This is consistent with the extracellular solution shunting signals in slice recordings20.
We examined the timing and found that extracellular signals near the proximal dendrite (regions 6 and 7) preceded signals near the soma and the AISs (regions 9 and 10) (Fig. 2d). This is also illustrated by the amplitudes of extracellular signals recorded at different times (Fig. 2e). These findings are consistent with the initial signal arising from current through dendritic AMPA receptors (−0.6 ms), followed by a large inward current at the soma (0 ms) consistent with a synaptically-driven sodium spike. Therefore, this dendritic extracellular signal is well suited to rapidly influence nearby PCs.
These findings suggest that the location of CF synapses could be an important determinant of the initial extracellular signals. We labelled individual PCs with biocytin and stained CF boutons with a VGluT2 antibody 36. CF boutons are most abundant in dendrites 30-50 μm from the soma, and the bouton density decreases towards the top of the molecular layer (Fig. 2f,g)36–38. These findings suggest that the high CF bouton density in the proximal dendrites accounts for the rapid fEPSPs seen in Fig. 2a,c (50 μm and region 6 respectively), and the lack of boutons in distal dendrites explains the positive signals at the top of the molecular layer (Fig. 2a,c).
To determine the mechanism of CS inhibition of SSs in nearby cells, we recorded from two neighboring PCs in voltage-clamp, and stimulated the CF onto one of the PCs (Fig. 3a). Synaptic inhibition was eliminated with the GABAAR antagonist GABAzine. We stimulated extracellularly at an intensity that stochastically activated the CF and subtracted average failures from successes (Fig. 3b, top). We used a similar approach to isolate the currents in PC2 the(Fig. 3b, bottom). We found that CF activation of a CF onto one PC evoked rapid short-latency outward currents in nearby PCs (Fig. 3b,c), that are suited to rapidly suppress SS activity.
Fig. 3. Climbing fiber stimulation evokes outward current in nearby Purkinje Cells regardless of whether axons are intact.
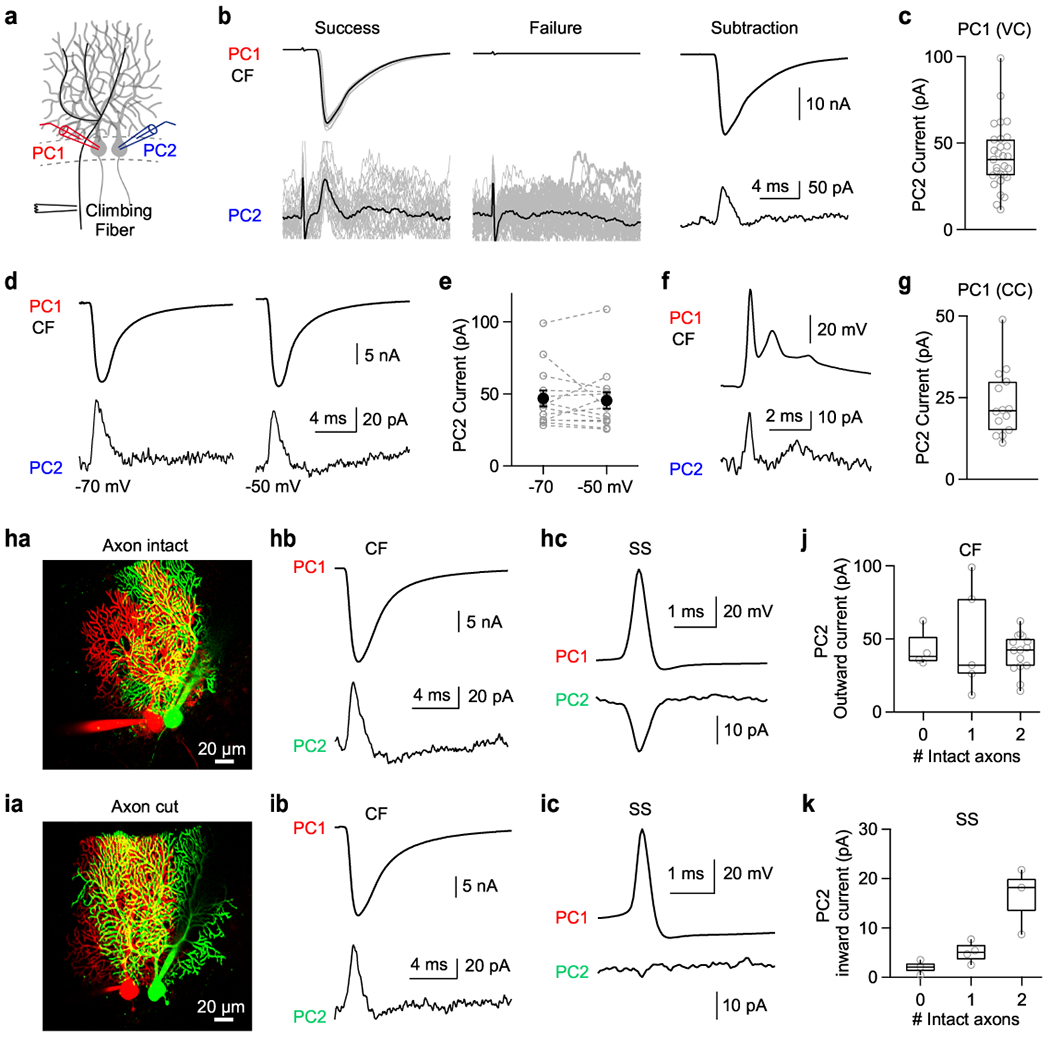
(a) Schematic of experimental configuration with whole-cell recordings from two neighboring PCs, and a stimulus electrode positioned to activate selectively a CF innervating PC1.
(b, top) Whole cell CF current measured from PC1 in voltage clamp mode at −70 mV. A threshold stimulus intensity was used that stochastically evoked successes (left) or failures (middle) (individual trials: grey and average: black). Average success – average failure is shown (right)
(b, bottom) Simultaneous recordings from a nearby PC2 showed that successful stimulation of the CF input to PC1 was accompanied by an outward current in PC2 (left), but no such current was observed in PC2 when stimulation failed to evoke a CF input to PC1 (middle). Average success – average failure is shown (right).
(c) Summary of outward current amplitudes recorded from PC2 when the CF innervating PC1 was activated and PC1 was voltage clamped at −70 mV.
(d) The CF EPSCs in PC1 (HP=−70 mV, top), and currents recorded from nearby PC2 voltage clamped at either −70 mV (bottom left) or −50 mV (bottom right).
(e) Summary of current amplitudes for PC2 at holding potentials of −70 mV and −50 mV. Paired two-sided t-test (p=0.69). Error bars indicate mean ± s.e.m.
(f) (top) Complex spike from PC1 recorded in current clamp.
(bottom) Outward current from PC2 voltage clamped at −70 mV.
(g) Summary of currents from PC2 accompanying complex spikes recorded in PC1 in current clamp (CC).
(h, a) Representative image showing PC pair with intact axons. 15 times reproduced.
(h, b) CF-EPSC measured in in PC1 in whole cell voltage clamp (top) and current from nearby PC2 measured in voltage clamp (HP=−70 mV).
(h, c) Spontaneous simple spike (SS) measured from PC1 in current clamp (top), and spike-triggered average current from PC2 in voltage clamp at −50 mV (bottom).
(i) Same as (h) but with two cut axons. 4 times reproduced.
(j) Summary of the magnitudes of outward currents in neurons as a function of the number of intact axons for climbing fiber EPSC in neighboring cells (PC2 HP=−70 mV).
(k) Same as (j) but inward currents by simple spikes (PC2 HP=−50 mV).
All box plots indicate median and interquartile range with the whiskers indicating the range.
In order to understand the currents evoked in neighboring PCs, we determined their voltage dependence. Previously, we showed that SSs in one PC promote firing in neighboring PCs by evoking a current mediated by voltage gated sodium channels that is much larger at −50 mV than at −70 mV 20. In contrast, outward currents in PCs evoked by CF stimulation were not voltage dependent (Fig. 3d,e). This suggests that CF inputs in one PC induce passive outward currents from nearby PCs.
We next recorded from PC1 in current clamp. In this configuration, the CF-elicited complex spike of PC1 also evoked an outward current in nearby PC2 that had a prominent transient short-latency component (Fig. 3f,g). Outward currents in neighboring PCs were smaller when PC1 was in current clamp as opposed to voltage clamp. This decreased amplitude in is consistent with the dendritic depolarization in current clamp lowering the driving force and reducing the amplitudes of inward currents.
We previously found that ephaptic coupling of SSs in nearby PCs requires intact axons. We tested whether this was also the case for CF suppression of neighboring PCs. Whole-cell recordings were obtained from PC pairs, and cells were fluorescently labeled to determine if their axons were intact (Fig. 3ha,ia). Both PCs were held at −70 mV in voltage clamp mode, and a CF input onto PC1 was activated. This evoked outward currents in neighboring PCs regardless of the number of intact axons (Fig. 3hb,ib). In contrast, for the same pairs of PCs, SSs evoked large inward currents in neighboring PCs held at −50 mV, but only for PC pairs with two intact axons (Fig. 3hc,ic). Thus, intact axons are required for inward currents generated by SSs (Fig. 3k), but not for outward currents generated by CFs (Fig. 3j).
To test whether AMPAR activation is required for CF-induced outward currents in nearby PCs, we recorded from neighboring PCs and stimulated the CF onto one PC, and washed in NBQX, which eliminated the CF stimulation-elicited EPSC and the outward current from nearby PCs (Fig. 4a,b). Cyclothiazide, a drug that prevents AMPAR desensitization, increased the AMPA response during CF stimulation and increased the outward current in neighboring PCs (Fig. 4c,d). Based on the experiments thus far, we hypothesize that AMPA receptor-mediated synaptic currents flowing into PCs produce a negative extracellular signal that in turn evokes a passive outward current in neighboring PCs. If this is the case, the extracellular signal and the resulting current in the second PC should be reversed by voltage clamping the first PC at positive potentials. To test this, we obtained whole-cell recordings from PCs with a CsF-based internal solution containing QX314 to block Na+ channels, and we simultaneously recorded extracellular signals (Fig. 4e). This approach allowed us to isolate the synaptic component associated with CF activation. Large negative extracellular signals were detected near proximal dendrites (Fig. 4f, left, Fig. 4g), and changing the holding potential to +30 mV reversed the extracellular signals (Fig. 4f, right, Fig. 4g). We also recorded from pairs of PCs with the same CsF-based internal solution containing QX314 (Fig. 4h). When both PCs were voltage-clamped at −70 mV, the CF-triggered outward current was present in PC2 (Fig. 4i, left, Fig. 4j). This suggests that voltage-dependent Na+ or K+ channels are not required for this outward current. When the holding potential of PC1 was changed to +30 mV, currents in both PC1 and PC2 reversed (Fig. 4i, right, Fig. 4j). These observations are consistent with the extracellular voltage producing a passive current in neighboring PCs with a direction dictated by the direction of the extracellular signal.
Fig. 4. Reversing the climbing fiber EPSC by AMPARs activation in one Purkinje cell reverses extracellular currents and currents in neighboring cells.
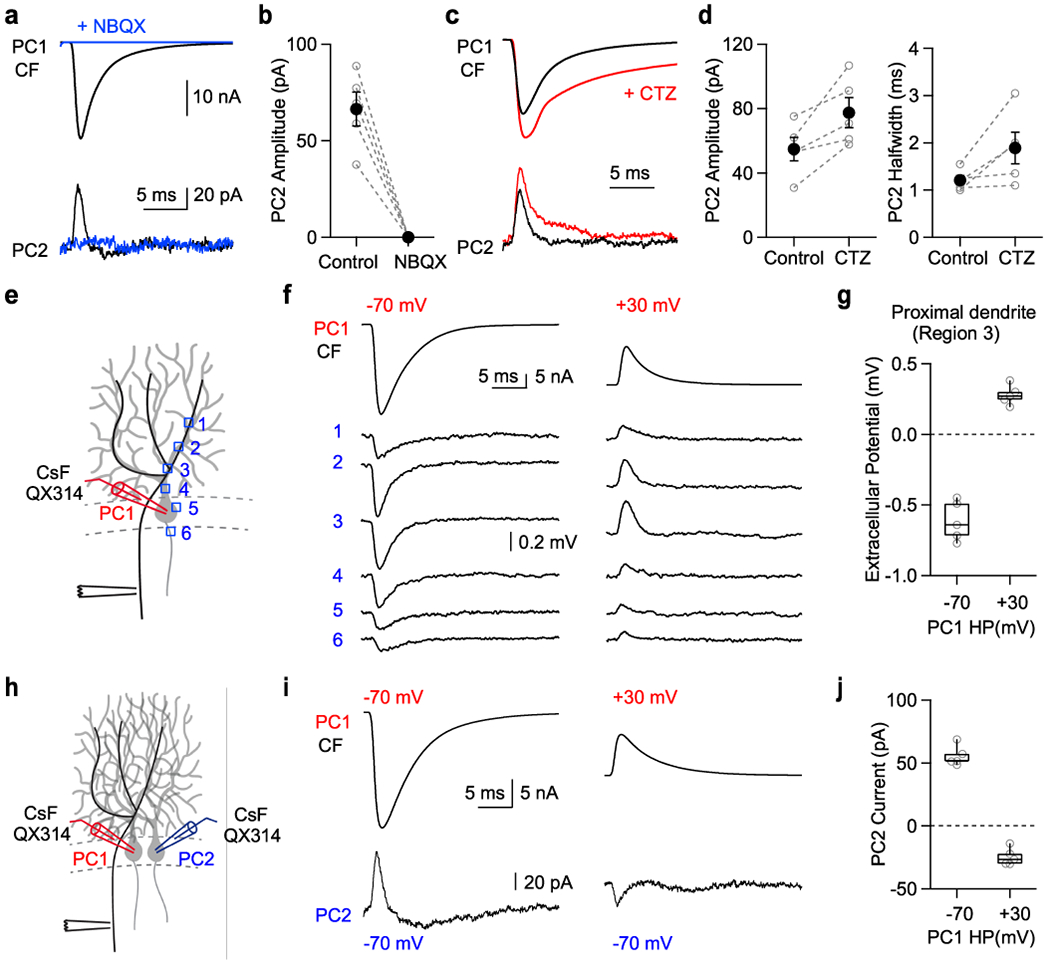
(a) The CF EPSCs in PC1 and currents recorded from nearby PC2 before (black) and after NBQX (5 μM, blue).
(b) Summary of current amplitudes for PC2.
(c) The CF EPSCs in PC1 and currents recorded from nearby PC2 before (black) and after cyclothiazide (100 μM CTZ, red).
(d) Summary of current amplitude (left) and halfwidth (right) for PC2. Two-sided paired t-test (amp;p=0.02, halfwidth;p=0.06)(e) Schematic showing climbing fiber stimulation, whole cell voltage clamp recording and extracellular recording sites.
(f) (top) Whole cell current from PC1 in voltage clamp at −70 mV (left) and +30 mV (right). (bottom) Extracellular voltage change was measured at dendrite (1-4), soma (5), and axon initial segment (6) indicated in (E).
(g) Summary of the extracellular potential at the proximal dendrite (region 3).
(h) Schematic showing paired recording with cesium fluoride (CsF) internal solution supplemented with the intracellular sodium channel antagonist QX314 (1 mM).
(i) Climbing fiber EPSC from PC1 in voltage clamp at −70 mV (left) and +30 mV (right), and corresponding whole cell currents from nearby PC2 (HP=−70 mV).
(j) Summary of the effects of the holding potential in PC1 on the currents measured in PC2 following climbing fiber activation of PC1.
Error bars indicate mean ± s.e.m. Box plots indicate median and interquartile range with the whiskers indicating the range.
Here we see that negative extracellular signals near the dendrite evoke an outward current in PCs, whereas negative extracellular signals near the AIS evoke inward currents 20. To clarify the discrepancy between axonal and dendritic stimulation (Fig. 5a), we stimulated extracellularly and measured the resulting whole-cell currents and changes in SS firing in nearby PCs. The stimulus waveform was a Gaussian with a 1.2 ms (Fig. 5b, top). Positive stimulation near the dendrite induced an inward current, and negative stimulation induced an outward current. The amplitude of the evoked current was linearly related to the stimulus amplitude (Fig. 5c, top), and signals were insensitive to the holding potential (Fig. 5b,c), as expected for a passive response. In contrast, for stimulation near the axon at −70 mV, depolarizing extracellular stimulation evoked inward currents and hyperpolarizing extracellular stimulation evoked outward currents (Fig. 5b, bottom blue, Fig. 5c, bottom blue), and holding potential had a large influence on evoked currents. At −50 mV the direction of the intracellular signal was reversed (Fig. 5b, bottom red, Fig. 5c, bottom red). Differences between dendritic and axonal stimulation are consistent with dendrites having a low Na-channel density, and axons having a high Na-channel density.
Fig. 5. Differential effects of extracellular dendritic and axonal stimulation.
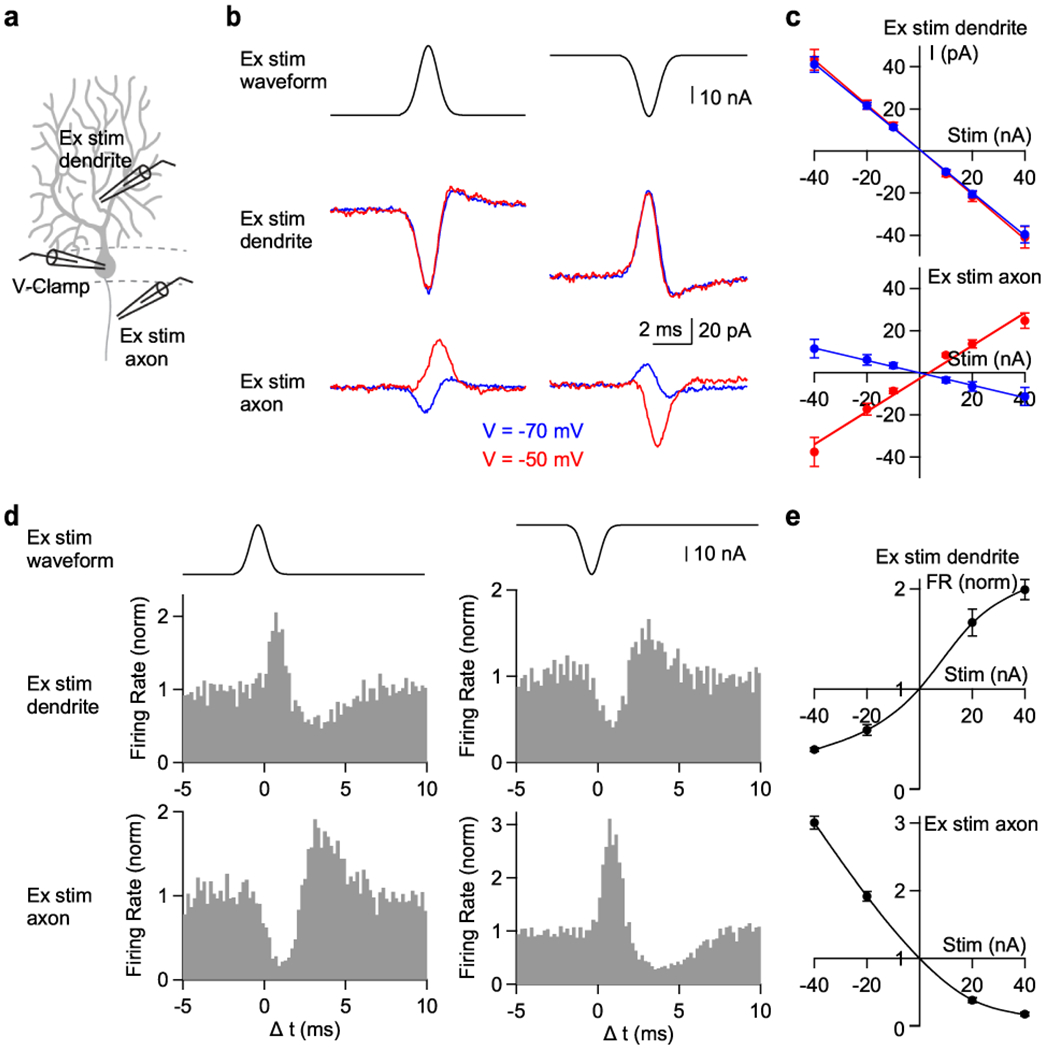
(a) Schematic showing whole-cell voltage clamp recording from a PC and extracellular current injection near the dendrite (40 μm from soma) or near the axon (30 μm from soma) used in (b) and (c). In (d) and (e) the somatic recording is an on-cell recording to monitor SSs.
(b) The waveform used for extracellular stimulation (Ex stim, top) and the resulting currents measured at the holding potential of −70 mV (blue) and −50 mV (red) by extracellular stimulation near the dendrites or near the axon.
(c) The relationship between the evoked currents and the intensity of extracellular stimulation near the dendrite (top) or axon (bottom) in voltage clamp at −70 mV (blue) and −50 mV (red).
(d) Experiments similar to (b) but examining the effect of extracellular stimulation on spontaneous SSs measured with on-cell recordings. Histograms of firing rate in response to extracellular stimulation near the dendrites or the axon.
(e) The relationship between firing rate and the intensity of extracellular stimulation near the dendrites (top) or the axon (bottom).
Data are mean ± s.e.m.
We then measured the effects of extracellular stimulation on spontaneous PC firing (Fig. 5d,e). Depolarizing dendritic current stimulation rapidly elevated spiking, which was followed by a suppression of spiking (Fig. 5d, middle left). Hyperpolarizing dendritic stimulation transiently suppressed spiking, which was followed by increased spiking (Fig. 5d, middle right). In contrast, depolarizing current stimulation near the axon suppressed spiking and hyperpolarizing stimulation transiently elevated spiking (Fig. 5d, bottom). Extracellular stimulation near dendrites or axons exerted opposite effects on PC firing. (Fig. 5e).
We extended this approach to determine the effects of extracellular signals arising from a CS. We stimulated in four different ways using measured extracellular waveforms (Fig. 6a). Extracellular stimulation of the axon with a waveform produced by a SS evoked an inward current in a PC clamped at −50 mV and a small outward current at −70 mV (Fig. 6bc). Stimulation with the extracellular signal produced by a CS near an axon evoked a much smaller inward component at −50 mV and small responses at −70 mV (Fig. 6bc). Stimulation with the extracellular waveforms produced by a CS near the dendrites evoked large inward currents that were similar at −50 mV and −70 mV (Fig. 6bc). Stimulation of both axons and dendrites with CS waveforms evoked responses that were slightly larger and more temporally precise than those evoked by dendritic stimulation alone (Fig. 6bc).
Fig. 6. Mimicking extracellular signals that accompany a complex spike evokes outward currents and inhibits simple spikes.
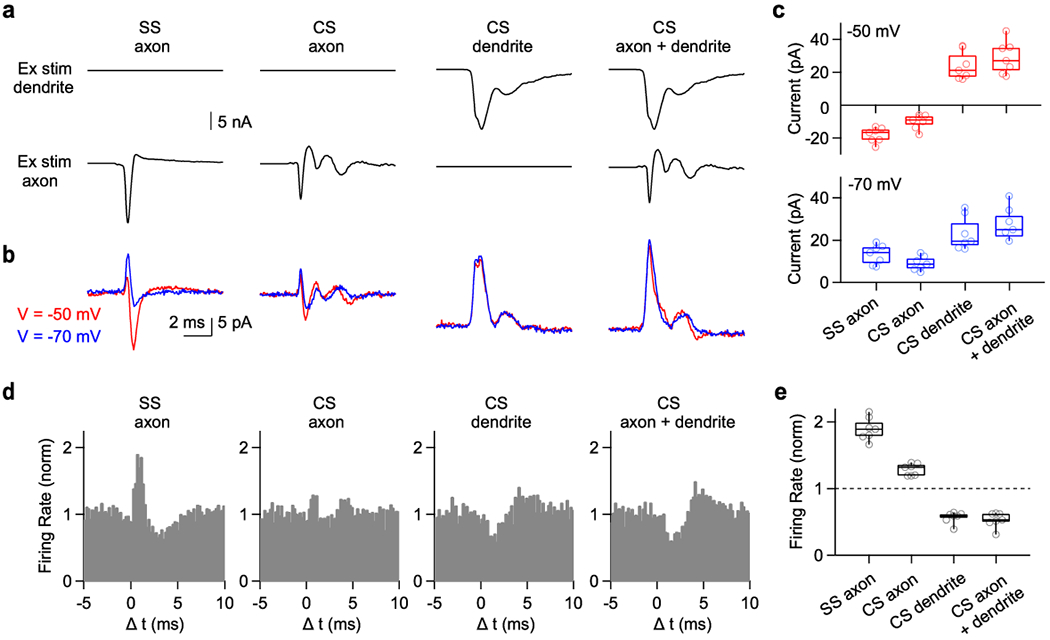
Experiments were performed similar to those in Fig. 5, but using waveforms based on extracellular signals accompanying complex spikes.
(a) Stimulus waveforms corresponding to the waveform near the axon initial segment accompanying a SS (SS axon), the waveform near the axon initial segment associated with a complex spike (CS axon), the waveform near the dendrite associated with a complex spike (CS dendrite), and simultaneous axonal and dendritic stimulation with the appropriate CS waveform. Each waveform was injected into extracellular regions near the dendrite (top) and the axon (bottom).
(b) Whole-cell currents evoked by the corresponding extracellular stimuli in (a) and recorded at a holding potential of either −70 mV (blue) or −50 mV (red).
(c) (top) Summary of the current elicited by extracellular stimulation. (bottom) Same as (top) but −70 mV holding potential.
(d) Normalized histogram summaries of simple spikes in response to the corresponding stimuli in (a).
(e) Summary of normalized firing rate changes (0-2 ms after stimulation) evoked by extracellular stimulation using the indicated waveforms.
Box plots indicate median and interquartile range with the whiskers indicating the range.
We then examined the effects of these stimuli (Fig. 6a) on spontaneous SS firing (Fig. 6d,e). The SS extracellular waveform evoked a large transient increase in firing, the CS axonal waveform had a very small influence on firing (Fig. 6d). Dendritic stimulation and simultaneous axonal and dendritic stimulation with CS extracellular waveforms transiently pauses SS firing similarly to the pause observed in vivo (Fig. 6d). In our slice experiments this brief pause is followed by transient elevations in spiking that are not apparent in vivo. This may reflect our inability to perfectly mimic the extracellular signals evoked by a CS with just two electrodes.
Functional implications
In order to evaluate the functional relevance of transient suppression of PC firing, it is necessary to consider the properties of PC outputs. PC activity is conveyed to the rest of the brain primarily by target neurons in the DCN. PCs are spontaneously active at high frequencies, and many PCs converge onto DCN neurons (see Methods). Previous studies found that synchronous firing of a fraction of PCs can promote firing of DCN neurons 20. Here we examine whether a transient decrease in PC firing, as would result from CS-induced suppression of neighboring PCs, can promote firing in the DCN.
We first addressed this question with dynamic clamp. Similar to previous studies examining the effects of synchronized PC spiking on DCN firing, we assume there are 40 10 nS PC inputs to a DCN neuron39. We found that suppressing firing for 2 ms in a fraction of PCs (Fig. 7a), promoted short-latency spiking in DCN neurons (Fig. 7b). The transient suppression of PC firing promoted short-latency DCN neuron firing that became increasingly reliable as the percentage of suppressed PCs was increased (Fig. 7c). Suppressing 10% transiently increased DCN neuron firing by approximately a factor of 2, and suppressing all PCs increased firing 10 fold (Fig. 7d). There was an approximately linear relationship between the percentage of PCs suppressed and the increase in the DCN neuron firing (Fig. 7e).
Fig. 7. Dynamic clamp studies indicate that brief pauses in PC firing can effectively promote firing of neurons in the DCN.
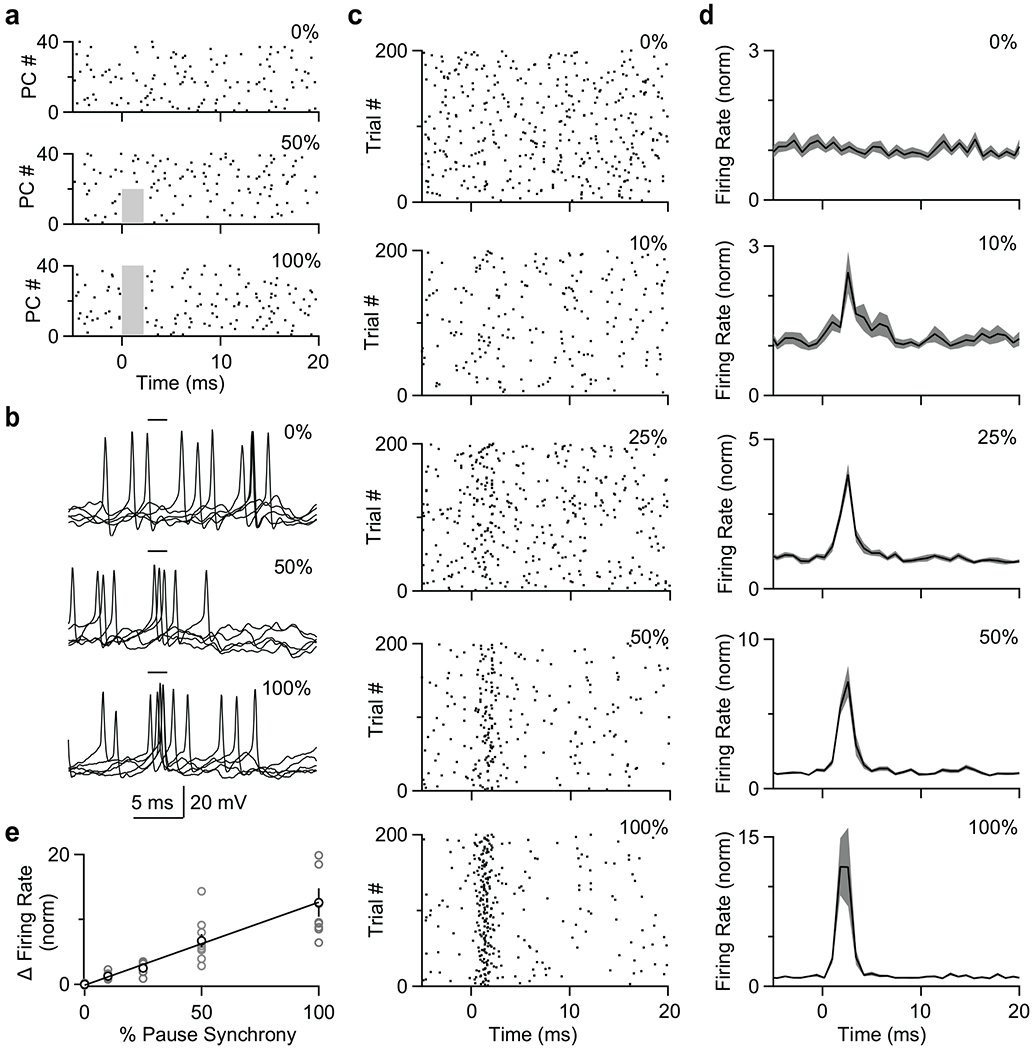
Dynamic clamp recordings were made from DCN neurons, with inhibition provided by 40 PC neurons with simple spike firing patterns as recorded in vivo (see Methods). PC spiking was suppressed for the indicated percentage of PCs, and the effect on DCN neuron spiking was determined.
(a) Example spiking patterns are shown for 40 PCs for spikes eliminated in a 2 ms period (grey regions) in none of the PCs (top), half of the PCs (middle), or all of the PCs (bottom).
(b) Examples show 10 superimposed traces for the same cell for no suppression (top), 50% of PCs (middle) and suppression in all PCs (bottom) for the two milliseconds indicated.
(c) Raster plots for the same DCN neuron recorded when PC firing was suppressed for 2 ms in 0, 10, 25, 50, and 100% of PCs. Suppressing firing in 0% of PCs indicates the pause was not at all synchronized among simulated PCs, while suppressing in 100% of PCs indicates the pause was fully synchronized among simulated PCs.
(d) Summary of normalized histograms for DCN neurons when PC firing was suppressed for 2 ms in 0, 10, 25, 50, and 100% of PCs.
(e) Summary of the effect of suppressing firing in a percentage of PCs on the normalized increase in DCN neuron firing frequency.
Data are mean ± s.e.m.
To test whether such pauses are also effective in vivo, we used optogenetics to transiently suppress PC firing and recorded responses in DCN neurons. We used light to suppress PC firing in a mouse that selectively expressed halorhodopsin in PCs (Fig. 8a). We recorded the resulting activity in PCs, in DCN neurons, and in the motor thalamus (Fig. 8b). A 0.5 ms stimulus suppressed PC firing for approximately 2 ms (Fig. 8c), similar to that for CS-inducted suppression of neighboring cells (Fig. 1). Light suppressed firing of most PCs below the craniotomy (Fig. 8f), but the firing of most PCs are unlikely to be significantly suppressed because they will be exposed to much lower light levels. Nonetheless, firing was transiently elevated in all DCN neurons we recorded from (Fig. 8d,f). Remarkably, 14 of 30 neurons also responded in the motor thalamus (Fig. 8e,f, Extended Data Fig. 6). The latencies of the responses are consistent with rapid light-evoked inhibition of PCs in ~2 ms, followed 1 ms later by excitation of the DCN, and an additional 2.5 ms later in the motor thalamus (Fig. 8g). The suppression of spiking was brief (halfwidths of 2 ms for PCs, 2 ms in the DCN and 5 ms in the thalamus). These findings suggest that CS-induced pauses in PCs can be highly effective at influencing the spiking in the DCN.
Fig. 8. Brief suppression of Purkinje cell simple spikes increases firing in the DCN and thalamus.
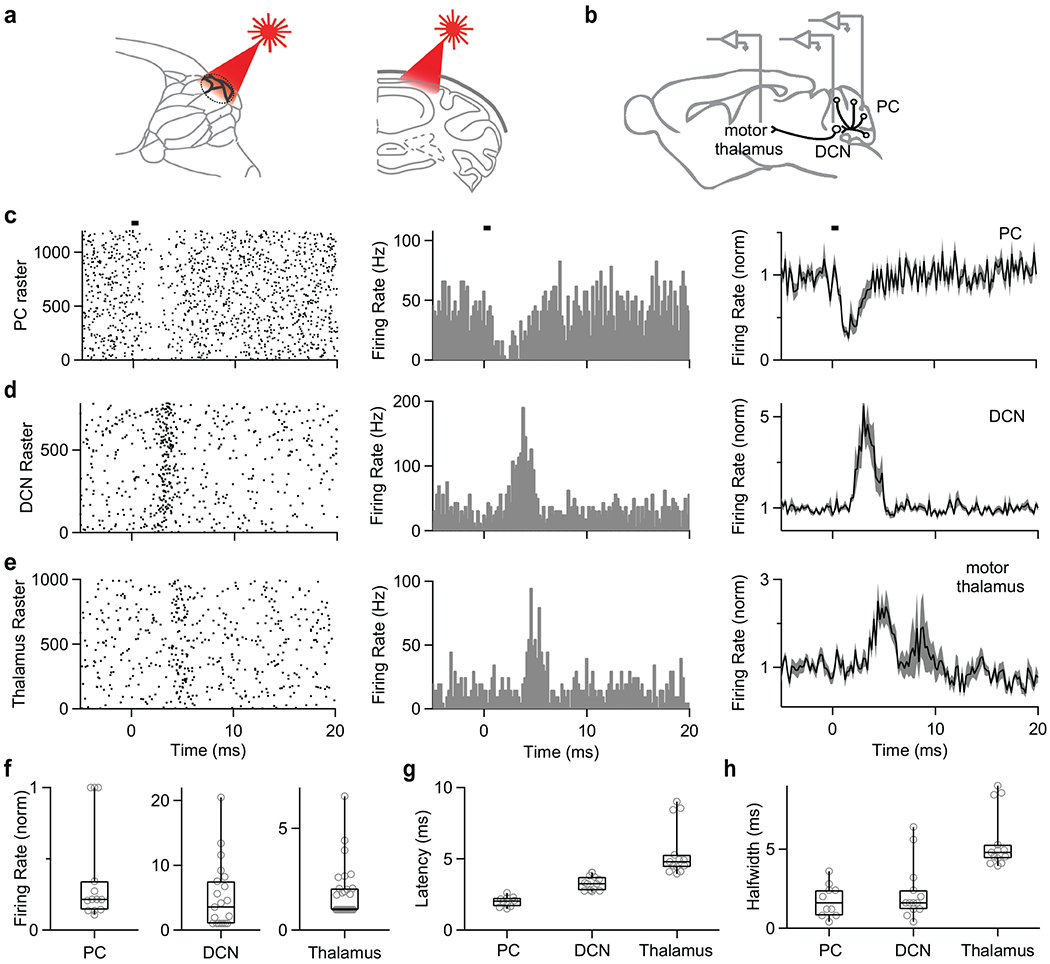
(a) Schematics showing craniotomy and illumination of a region of the cerebellar cortex.
(b) Schematics showing in vivo recording in PC, DCN, and thalamus.
(c) Raster plot of simple spikes from single PC (left). Histogram summarizing the data from left raster plot (middle). Average firing rate of simple spikes from PC by light stimulation (n=13 cells). Shaded grey is SEM (right). Bar indicates 0.5 ms light stimulation at 0 ms.
(d) Same as (c) but in the DCN. Average histogram is for all of the 21 cells in the DCN.
(e) Same as (c) but in the thalamus (average histogram is for the 14 of 30 cells that responded to simulation).
(f, g, h) Summary of normalized firing rates (f), latencies (g), and halfwidths (h) for PCs, DCN neurons, and thalamic neurons.
Data are mean ± s.e.m. Box plots indicate median and interquartile range with the whiskers indicating the range.
Discussion
Our main finding is that when a CF activates a PC it simultaneously suppresses firing in all neighboring PCs. It is remarkable that a powerful glutamatergic excitatory synapse can rapidly and transiently inhibit spiking. We find that spiking is suppressed by a novel type of ephaptic signaling in which a single CF generates synaptic currents and extracellular signals of sufficient size to directly hyperpolarize neighboring cells.
A novel type of ephaptic signaling
The CS-induced suppression we describe here represents a novel form of ephaptic coupling. Previously, it was shown that the collective extracellular signals associated with the activity of many cells leads to slow correlations in firing 19,22. It had also been shown that single cells can generate sufficiently large extracellular signals to influence the axons of target cells in order to influence their excitability 20,21,23,26. Positive extracellular signals near the axon associated with activation of MLI pinceaux suppressed PC firing whereas negative extracellular signals produced by sodium influx into an axon, opened sodium channels in nearby PC axons to promote firing. The ephaptic signaling we describe here differs in that it reflects primarily the current flow through ionotropic channels of a single synapse consisting of hundreds of release sites. This type of signaling is particularly effective for CSs in PCs because CF synapses are extremely powerful, their dendritic arbors are large and well suited to detecting extracellular signals, and PC dendrites are in close proximity.
Artificially changing the location of these extracellular signals with extracellular stimulation had a profound influence on PC responses. When PCs were voltage clamped at −70 mV, extracellular stimulation of either dendrites or axons evoked currents that were in the same direction: positive stimuli promoted inward currents and negative stimuli promoted outward currents. This is consistent with passive effects of extracellular stimulation. The signals were larger for dendritic stimulation, as expected from the large surface area of dendrites. At a holding potential of −50 mV, currents evoked by extracellular dendritic stimulation were unchanged, but axonal stimulation evoked large signals in the opposite direction, which is consistent with the involvement of voltage-gated sodium channels in the axon initial segment 40.
Spatiotemporal extent of ephaptic inhibition
The finding that CFs ephaptically inhibit neighboring PCs adds to the many ways that CFs can influence the cerebellar cortex. Our findings suggest that ephaptic signaling allows each IO neuron to simultaneously suppress firing in many PCs. When an IO neuron fires it evokes CSs in target PCs. Based on our observed extent and magnitude of suppression (Figure 1), and assuming for simplicity a hexagonal close packing, we estimate that 6 nearest neighbors will be suppressed by ~45% and 12 additional cells by 35% (Extended Data Fig. 7). An IO neuron gives rise to an average of 7 CFs onto different PCs 29, and therefore we estimate that a single IO neuron will simultaneously suppress firing in over 100 PCs. In terms of spiking, during the initial 1.5 ms a CF will evoke an axonal spike in directly targeted PCs, as ephaptic signaling suppresses firing in nearby PCs (Figure 1g). For an IO neuron targeting 7 PCs, 7 axonal spikes are evoked in directly targeted PCs are evoked, and a total of 7 spikes are suppressed in neighboring PCs (spiking at 100 Hz). This suggests that ephaptic signaling simultaneously suppresses approximately the same number of spikes in neighboring PCs as the number evoked in directly targeted PCs.
On longer time scales, additional processes and circuit elements are engaged. CFs evoke a burst of 2-5 action potentials in target PC axons followed by a pause in simple spikes (Extended Data Fig. 2B). Glutamate spillover from CFs can evoke MLI firing within a few milliseconds14,16,32, but because of MLI-to-MLI inhibition the net effect on PC excitability can be either inhibitory or excitatory14,32,41. Similarly, activation of PCs leads to disynaptic inhibition of other PCs and MLIs30,31. Ephaptic suppression of neighboring PCs suppresses their collateral activation, and thereby prolongs the influence of ephaptic suppression on activity in the cerebellar cortex. It is remarkable that with so many circuit elements engaged, in our recordings there was no net influence on neighboring PCs beyond several milliseconds after a CS.
Recent studies found that during some visuomotor tasks and motor learning tasks CFs coincidently activate most PCs within parasagittal microzones 42,43. If CFs onto neighboring PCs are activated coincidently with submillisecond precision, direct CF activation would likely overwhelm ephaptic signals from neighboring PCs within a microzone, although ephaptic signaling could suppress the firing of PCs within nearby microzones. However, the timing of CF activation is based on calcium imaging of complex spikes in PCs that provide poor temporal resolution. If CF activation of neighboring PCs are separated by more than a millisecond, then the CF that is activated first will suppress SSs in neighboring PCs prior to CF activation of that cell.
Influence of IO neurons on cerebellar output
The influence of an IO neuron on firing in the DCN depends on the degree of convergence of directly activated PCs, ephaptically suppressed PCs, and axon collaterals from IO neurons. In adults, each DCN neuron receives weak excitatory inputs from about 8 IO neurons44,45. On rapid time scales, directly targeted PCs will inhibit DCN neurons, while IO collaterals and ephaptically-suppressed PCs will excite them. If these three types of inputs converge onto the same DCN neuron, then IO collaterals and suppressed PCs will counteract the effects of directly targeted PCs. Alternatively, if neighboring PCs target different DCN neurons, then a CS-induced burst in a PC would inhibit some DCN neurons, whereas other DCN neurons would be excited by ephaptically inhibited PCs and IO collaterals. This latter scenario might lead to a small excitation of a large population of DCN neurons. Simultaneous recordings from connected PCs and DCN neurons in vivo provide an important step in assessing possible contributions of ephaptic signaling to DCN responses11,13,46. Such studies found that CSs in a PC were often associated with an excitation-inhibition sequence in DCN neurons. Recordings from the DCN during a conditioned eyeblink task also suggest that CF activity can also trigger strong excitation in the DCN and that this could contribute to fine tuning conditioned responses47. Although these studies attributed excitatory responses to IO collaterals, our findings suggest that ephaptic suppression of neighboring PCs could also be important. Based on the relative strengths and divergence of PC and IO synapses onto DCN neurons, it is likely that ephaptic suppression of PC firing will have a larger influence than IO collateral synapses. PC to DCN synapses are 10s-100s of nS 48 with a reversal potential of −75 mV, whereas IO to DCN synapses are less than 1 nS45 with a reversal potential of 0 mV. Extending simultaneous PC/DCN recordings to behaving animals with sufficient trials to allow histogram binning at 0.2 ms will make it possible to better assess the influence of ephaptic suppression of PCs on DCN neuron firing.
Functional significance of pauses in PC firing
Our dynamic clamp studies and optogenetic suppression studies have important implications more generally for any mechanism that briefly and synchronously pauses PC firing. It has long been appreciated that PCs undergo pauses lasting for tens to hundreds of milliseconds7,49, which disinhibit DCN neuron firing50. Here we establish that two millisecond pauses in PC firing are highly effective at elevating the firing of DCN neurons. Our dynamic clamp studies suggest that a brief pause in spiking in just 10% of the PC inputs (Fig. 7), doubles DCN neuron spiking. Based on the large number of PCs expected to be inhibited by a single spike in an IO neuron, this suggests that a single IO neuron could promote firing in many DCN neurons by suppressing PC firing. Moreover, any mechanism that synchronously inhibits PCs could also be effective at increasing spiking in the DCN, such as the synchronous inhibition of many PCs by MLIs32.
One of the most remarkable features of the cerebellum is that the output of the cerebellar cortex provides ongoing spontaneous inhibition to DCN neurons at an estimated 4 kHz (40 PCs firing at 100 Hz). Our findings establish that this allows decreases in firing to rapidly promote firing in DCN neurons. Just one millisecond after pause onset in PC firing there is a large increase in DCN neuron firing (Fig. 8). This is much more rapid than the stimulus to spike latency of 5-10 ms that is observed following synchronous PC firing 39. The precision of firing evoked in the DCN by a pause is striking, with a 2 ms suppression of PC spiking leading to an increase in DCN firing lasting 2 ms. These findings illustrate that brief synchronous pauses in PC firing can be highly effective in driving postsynaptic spiking in the DCN.
Methods
Mice
All animal experiments were performed according to NIH guidelines and protocols approved by Harvard University. P30-P45 C57BL/6 mice (Charles River) of either sex were used for acute slice experiments, and P50-P90 C57BL/6 mice (Charles River) of either sex used for in vivo experiments. We used Pcp2-cre mice (Jackson Laboratory, stock number 010536) crossed to eNpHR3.0-EYFP (Halo) mice (Ai39 Jackson Laboratory, 014539) for brief inhibition of Purkinje Cell activity in vivo. cKit-Cre mice (generous gift from J. Christie) were used for optogenetic inhibition of molecular layer interneurons.
In vivo recording
In vivo recordings from PCs were made from awake, head-restrained mice using an acutely inserted silicon probe. To prepare for recordings, mice were anesthetized with 2% isoflurane and implanted with a head-restraint bracket using metabond (Parkell, Edgewood, NY). A craniotomy (~ 0.5 mm diameter) was made over the vermis (centered on the midline −6.8 mm posterior to bregma). Craniotomies were sealed with kwik-sil (World Precision Instruments, Sarasota, FL) until the day of the recording. After surgery, mice were given the analgesic buprenorphine. Mice were head-fixed over a cylindrical treadmill to allow for free locomotion. All animals were acclimated for at least one session prior to the recording session. Recordings were made primarily along the anterior vermis of the cerebellum, along lobules 2, 3, and 4/5.
To measure the inhibition of PC firing after complex spikes in nearby cells, recordings were made using either the P or H2 style silicon probes from Cambridge Neurotech (Cambridge, England). The P style probe consists of two rows of 8 contacts, separated by approximately 25 μm (center to center distance). The H2 style consisted of a single row of 16 contacts, also separated by 25 μm. PCs were identified by their complex spikes. Care was taken to have clear, discernable, and individual spiking with minimal signal overlap in neighboring channels during simultaneous recordings. To clearly resolve the effect of complex spike activity on neighboring PCs, recordings lasted for at least 10 minutes. 6 of 37 PC pairs in Fig. 1 were reanalyzed from our previous paper’s dataset 20.
Exclusively H2 style probes with the linear arrangement of recording sites were used for measurements of extracellular action potential waveform shapes across the PC’s longitudinal axis (Fig. 2a). To sample PCs along this direction, care was taken to insert the probe perpendicularly to the surface of the cerebellum, and thus, many of the underlying PC layers. When positioned correctly, the simple spike waveform transitions from a predominantly negative waveform near the axon initial segment to one with an initial prominent positivity at the soma/proximal primary dendrite. We used this characteristic transition across the linearly arranged recording sites to determine whether our probe was positioned perpendicular to the PC layer. Furthermore, the absence of significant PC activity in neighboring channels was also a clear indicator that only one contact on the probe was situated in the PC layer, and the others were above or below it. The PCs were positioned such that they were “centered” on the silicon probe, with at least 5 contacts above and 5 contacts below the central recording site.
Acute slice preparation
Acute parasagittal cerebellar slices of 200~250 μm thickness were prepared from the vermis. Mice were anesthetized with an intraperitoneal injection of a ketamine (100 mg/kg) and xylazine (10 mg/kg) mixture, and transcardially perfused with an ice-cold solution containing the following (in mM): 110 Choline Cl, 7 MgCl2, 2.5 KCl, 1.25 NaH2 PO4, 0.5 CaCl2, 25 Glucose, 11.6 Na-ascorbate, 2.4 Na-pyruvate, and 25 NaHCO3 equilibrated with 95% O2 and 5% CO2. The cerebellum was dissected, and slices were made using a VT1200s vibratome (Leica, Buffalo Grove, IL) in ice-cold solution as above. Slices were then transferred to a submerged chamber with artificial cerebral spinal fluid (ACSF) composed of (in mM): 125 NaCl, 26 NaHCO3, 1.25 NaH2PO4, 2.5 KCl, 1 MgCl2, 1.5 CaCl2, and 25 glucose, equilibrated with 95% O2 and 5% CO2, and allowed to recover at 32°C for 20 min before cooling to room temperature.
Acute slice electrophysiology
Cerebellar slices were transferred to the recording chamber, and constantly perfused with ACSF containing the following (in mM): 125 NaCl, 26 NaHCO3, 1.25 NaH2 PO4, 2.5 KCl, 1 MgCl2, 1.5 CaCl2, and 25 glucose, equilibrated with 95% O2 and 5% CO2 at 32°C. PCs were visually identified with infrared differential interference optics. Patch pipettes of 1-3 MΩ resistance pulled from borosilicate capillary glass (Sutter Instrument, Novato, CA) with a Sutter P-97 horizontal puller. For whole-cell recordings, electrodes were filled with an internal solution containing (in mM): 150 K-Gluconate, 3 KCl, 10 HEPES, 0.5 EGTA, 3 Mg-ATP, 0.5 Na-GTP, 5 Phosphocreatine-tris2, and 5 Phosphocreatine-Na2 adjusted to pH 7.2 with KOH. The osmolarity was adjusted to 310 mOsm. The internal solution for Fig. 5 contained (in mM): 100 CsCl, 35 CsF, 10 EGTA, 10 HEPES, and 1 QX314 adjusted to pH 7.2 with CsOH, and 310 mOsm. For on-cell recordings, glass pipettes were filled with ACSF. Electrophysiology data were acquired using a Multiclamp 700A amplifier (Axon Instruments, San Jose, CA) and an ITC-18 (Heka instruments Inc. Holliston, MA), filtered at 10 kHz, sampled at 20 kHz, and saved using software custom written in Igor Pro (Lake Oswego, OR).
Biocytin labeling and Immunohistochemistry
Recordings of at least 20 minutes duration were obtained as described above, but with an internal solution supplemented with 0.2% biocytin. Slices were fixed overnight in 4% PFA at 4°C. Free-floating slices were then blocked for 4-6 hrs (5% Normal Goat Serum in 0.5% Triton X-100) at room temperature, followed by incubation overnight at 4°C with primary antibody (Guinea Pig anti-VGluT2, synaptic systems, 1:1000). Secondary antibodies (Streptavidin Alexa 568, Thermo Fisher Scientific, 1:1000; Alexa 488 goat anti-guinea pig IgG, Abcam, 1:1000) were then applied for 1 hr at room temperature. Slices were mounted using #1.5 coverslips and Prolong Diamond Antifade mounting medium. Z stacks (0.5 μm/section) were collected on an Olympus Fluoview1000 confocal microscope with FluoView software using a 60X 1.42 NA oil immersion objective.
Purkinje cell labeling
Nearby PC pairs were whole-cell patched using an internal solution that included 50 μM of either Alexa-488 or Alexa-594 hydrazide (Thermo Fisher Scientific, Waltham, MA Alexa dye was allowed to diffuse into the cell for 10-15 min. Cells were then imaged with a custom built two-photon microscope, with image acquisition controlled by custom software written in Matlab (Mathworks, Natick, MA). Cells were imaged in 100-150 image planes and Z-spacing of 0.5 μm. Image contrast, brightness and Z-projection of images were processed in ImageJ (NIH, Bethesda, MA)
Extracellular stimulation
The amplitudes and shape of extracellular current injection in Figure 6 were based on recorded extracellular voltage responses of SS and CS measured at the axon initial segment and dendrite. The waveforms for extracellular SS and CS stimulation near the axon were from Fig. 2c (region 10), and the waveforms for extracellular stimulation at the proximal dendrites were from Fig. 2c (region 6). The waveform was injected into extracellular space after convolution with a Poisson spike train (20 Hz) of unitary amplitude.
Optogenetic Inhibition of Interneurons
CKit-Cre mice (generous gift from J. Christie) were used for in vivo inhibition of molecular layer interneurons. Mice were injected with 250 nl of AAV9-Ef1a-DIO eNpHR 3.0-EYFP (Addgene) at nine sites in the cerebellum and in vivo recordings were performed 2-3 weeks later. A 647 nm laser (Opto Engine, Midvale, UT) delivered via a 400 μm 0.39 NA optical fiber (Thorlabs, Newton, NJ) was focused to a spot of 2 mm2 centered over the recording site at an estimated power density of (40 mW/mm2). A silicon probe was lowered into the brain (P-series, Cambridge Neurotech, Cambridge, England), to find pairs of neighboring PCs within Halo-expressing regions. Once a pair was located, the posterior vermis was illuminated for 5 s on and 5s off for at least 30 minutes. Recorded PC pairs were screened for an increase in activity in response to inhibition of MLIs. For analysis, complex spikes were sorted into laser on trials and laser off trials, and otherwise analyzed as previously discussed.
Dynamic clamp
Sagittal slices of the DCN (180-200 μm) were cut from P30-P40 C57/BL6 mice of both sexes. Animals were anesthetized with ketamine/xylazine and transcardially perfused with warmed51 choline-ACSF solution containing (mM): 110 Choline Cl, 2.5 KCl, 1.25 NaH2PO4, 25 NaHCO3, 25 glucose, 0.5 CaCl2, 7 MgCl2, 3.1 Na-Pyruvate, 11.6 Na-Ascorbate, 0.005 NBQX, and 0.0025 (R)-CPP, oxygenated with 95% O2 / 5% CO2. Slices were transferred for 10-12 minutes to a standard ACSF solution (mM: 127 NaCl, 2.5 KCl, 1.25 NaH2PO4, 25 NaHCO3, 25 glucose, 1.5 CaCl2, and 1 MgCl2) and then allowed to rest at room temperature for 20-30 minutes before recordings. The same ACSF solution was used for recordings, with the addition of synaptic blockers (5 μM NBQX, 5 μM gabazine, 2.5 μM R-CPP, and 1 μM strychnine.) The same K-gluconate-based internal used for earlier current clamp experiments was used. Recordings were performed at 36°C.
Dynamic clamp recordings were made at 20 kHz with an ITC-18 computer interface (Heka, Holliston, MA) controlled by mafPC in Igor Pro (Wavemetrics, OR). 40 PC inputs with firing rates between 30 and 113 Hz based on our in vivo PC recordings. The number of PC inputs was chosen based on previous studies 39,52. The intervals between spikes were randomized and convolved with a unitary synaptic conductance set at 3.7 nS conductance (10 nS inputs with a depression of 0.37 (Turecek et al, 2016) with a 0.1 ms rise time and a single exponential τdecay of 2.4 ms (based on a fit to a recorded IPSC)). 2 ms pauses of PC firing were administered every 250 ms before convolving with the unitary PC conductance. EInhibitory was set at −75 mV, accounting for a 7 mV liquid junction potential.
Brief optogenetic inhibition of PC activity in vivo
Pcp2-cre mice crossed to eNpHR3.0-EYFP (Halo) mice were used to transiently inhibit PC activity in vivo. After preparing the mice for in vivo recordings, a craniotomy of approximately 1.5 mm diameter was made above the DCN. A 647 nm laser of approximately 2 mm in diameter was centered on the craniotomy. Steady state power density from the laser was measured to be 80 mW/mm2. Flashes of 0.5 ms were delivered to the region at approximately 2 sec intervals while recordings were made in the PCs above the targeted cerebellar nuclei, the nuclei themselves, or thalamic motor regions. PCs were identified by their characteristic firing rate, presence of complex spikes, and appearance in layers. DCN neurons were identified by depth, firing rate, and absence of complex spikes, Thalamic recordings were made targeting the motor subnuclei (ventrolateral aspect primarily) and confirmed by coating the recording electrode with DiI, followed by post-hoc histology. Recordings were made from head-restrained, awake mice, using E-series silicon probes (Cambridge Neurotech, Cambridge, England).
Statistics
Data analysis was performed using custom scripts in Matlab (Mathworks, Natick MA). Unpaired or paired Student’s t test were used when there were two groups in the dataset. The statistical analysis used in each experiment, p-values, and the definitions of n are stated in the figure legends. A summary of number of experiments and statistics is provided in Supplementary Table 1. No statistical methods were used to pre-determine sample sizes but our sample sizes are similar to those reported previously 20. Data distribution was assumed to be normal but this was not formally tested.
Data collection and analysis were not performed blind to the conditions of the experiments, and animals or data points were not excluded from the analyses.
Analysis of In vivo electrophysiology
Data were acquired at 20 or 30 kS/s (1 Hz to 10 or 15 kHz bandpass respectively) using an Intan acquisition system (Intantech). Data collection was randomized. Spikes were sorted and aligned in Offline Sorter (Plexon). All further analysis and alignment between recordings (such that each complex spike associated timepoint was triggered on the same point on the complex spike waveform) was done in Matlab (Mathworks). Complex spikes from raw traces were subtracted for analysis of SS pause (Extended Data Fig. 1). Inhibition of simple spikes by the neighboring complex spike was quantified from neighboring complex spike-triggered peristimulus firing rate histograms: the average firing rate was taken between 0.5 and 1 ms after the complex spike and divided by the average firing rate of the cell (from the 100 ms prior to complex spike). Simple spike synchrony was calculated similar to reported previously 20. Briefly, simple-spike triggered averages were normalized to the average event rate. A window between 0.6 ms before and after zero-lag was taken and averaged to determine the amount of synchrony.
Quantification of DCN and thalamic responses
To quantify the latency of responses in DCN and moto thalamus to PC inhibition, resulting firing rate PSTHs were baseline subtracted, and fit to a Gaussian function. Offset, amplitudes, and the width at half-max were calculated from the fitted data. Poorly fit responses (r2 < 0.2) were considered non-responders.
Data availability
The data that support the findings are available upon reasonable request from the corresponding author.
Code availability
Analyses used in this study are largely standard approaches for this type of data. The code that supports these findings are available upon request from the corresponding author.
Extended Data
Extended Data Fig. 1. Subtraction of complex spikes from raw traces.
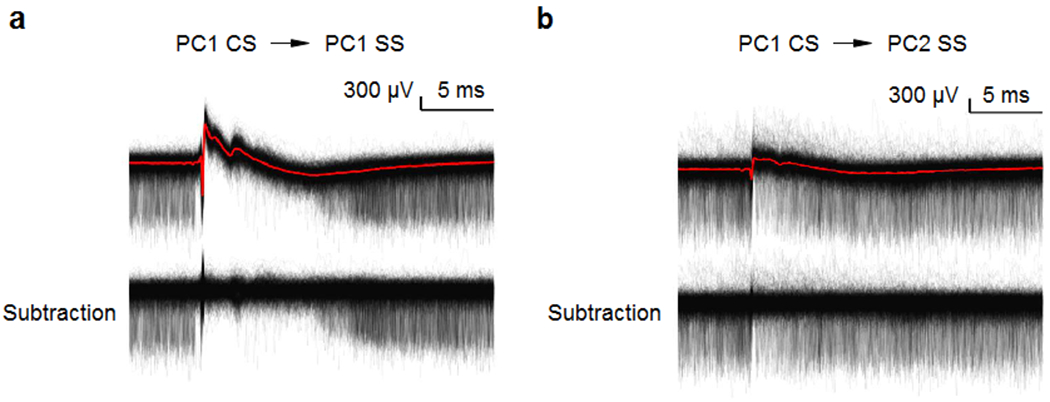
(a) (top) Simple spikes and complex spikes recorded on a same cell (PC1 SS) are aligned to PC1 CS (red). (bottom) Complex spikes from PC1 were subtracted.
(b) (top) Simple spikes simultaneously recorded on a neighboring site (PC2 SS) are aligned to PC1 CS. Complex spikes from PC1 (PC1 CS, red) were detected in neighboring site (PC2). (bottom) Complex spikes from PC1 were subtracted.
Extended Data Fig. 2. Complex spikes in a Purkinje cell inhibit simple spikes in the same PCs in awake mice.
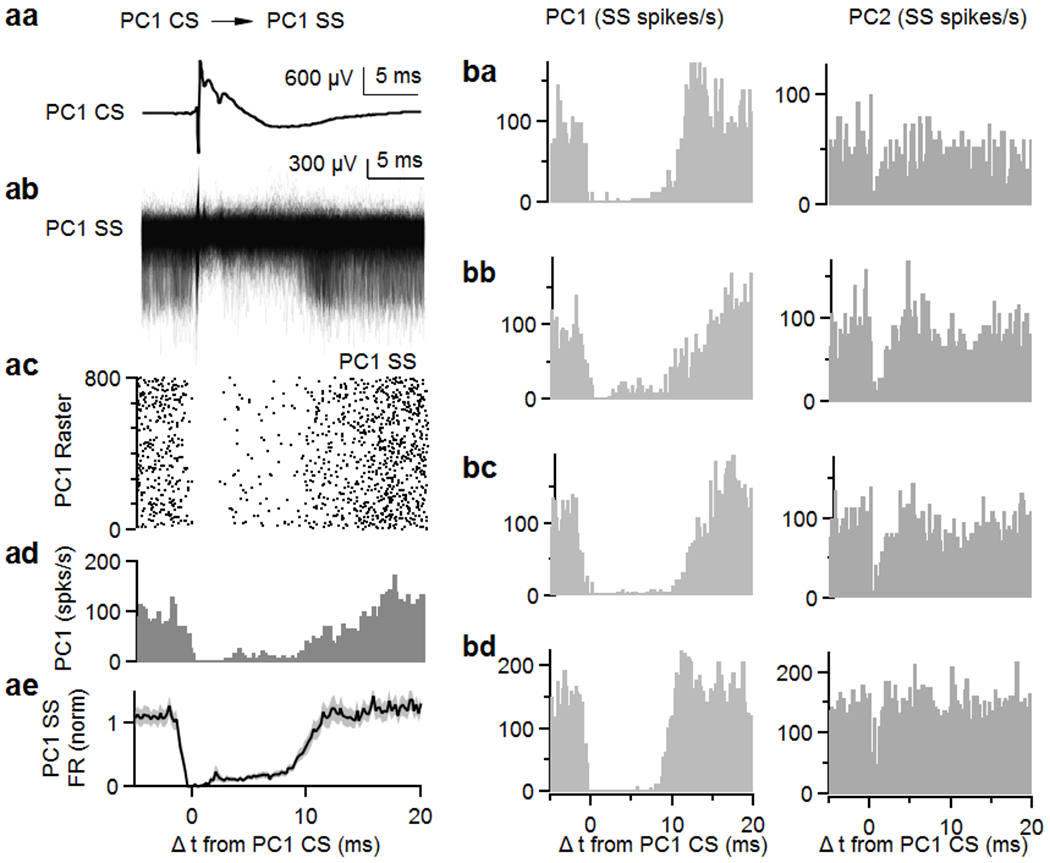
(a, a) Average complex spike recorded on a single site (PC1 CS).
(a, b) Simple spikes simultaneously recorded on the same cell (PC1 SS) are aligned to PC1 CS.
(a, c) Raster plot of simple spikes from (a, b).
(a, d) Histogram summarizing the data in (a, b).
(a, e) Average of firing rate of simple spikes from the same PCs (PC1 SS) after complex spikes from PC1 (PC1 CS). Shaded grey is SEM.
(b, a-d) Four example pairs of nearest neighbor cells showing histograms of PC1 and PC2 SSs relative to CSs in PC1. Data are mean ± s.e.m.
Extended Data Fig. 3. Optogenetic silencing of MLIs does not disrupt CS suppression of SSs in neighboring cells.
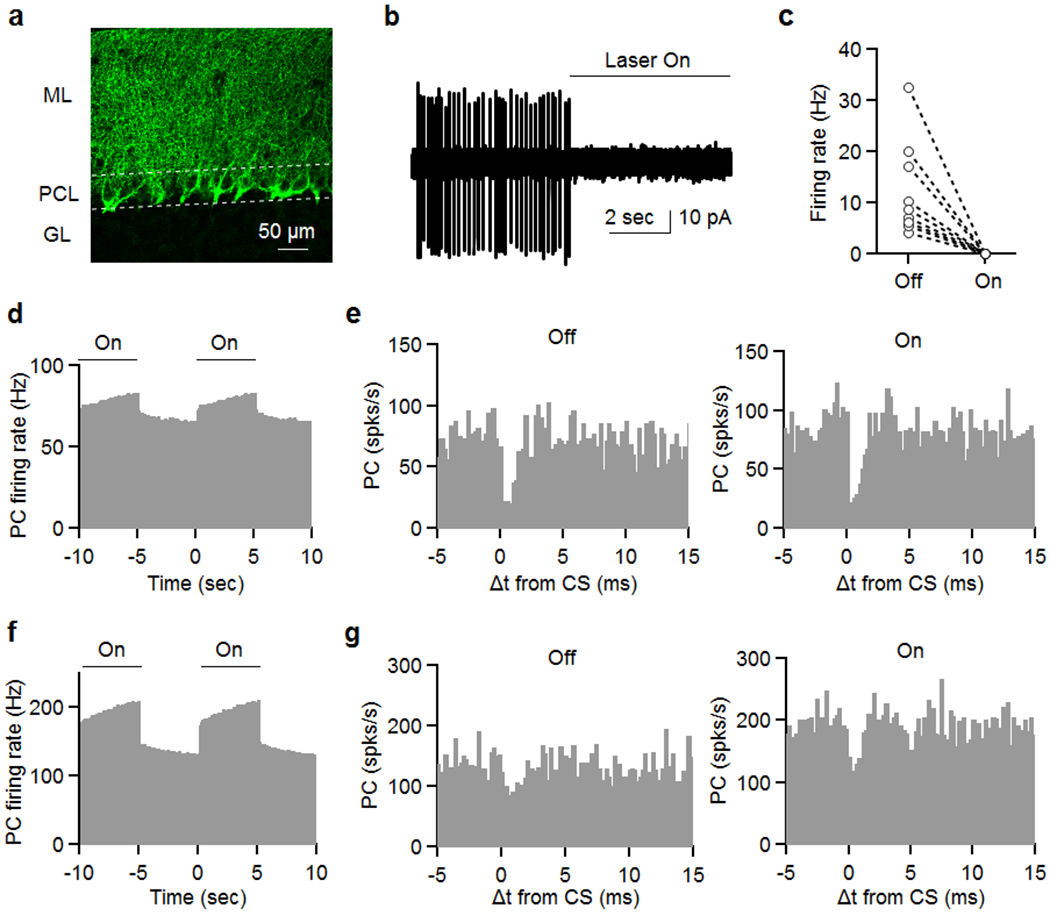
CKit cre mice53 were injected with 250 nl of AAV9-Ef1a-DIO eNpHR 3.0-EYFP nine sites in the cerebellum. Experiments were conducted 2-3 weeks later (see Methods). Slices were cut in order to evaluate expression and or ability to suppress MLI firing (a, b).
(a) Image of eNpHR 3.0-EYFP labelling showing an expression pattern that is characteristic of membrane labelling of MLIs, including the pinceaux associated with basket cells. 3 times reproduced.
(b, c) On cell recordings were used to assess the effect of light on MLI firing, and we found that firing was eliminated in all MLIs.
After waiting for 2-3 weeks, in vivo recordings proceeded similarly to experiments shown in Fig. 1. Once a pair was located, 5 s illumination was alternated with 5 s of no light, and this continued for at least 30 minutes in order to record sufficient complex spikes for each condition.
(d) Light increased PC firing of a pair of closely spaced (25 μm) cells.
(e) CS induced decreases in SS firing rate are shown for control condition (no light, left) and when MLI firing was suppressed with light (right).
(f) The effects of light on PC firing is shown for another pair of cells (50 μm).
(g) CS induced decreases in SS firing rate are shown for control condition (no light, left) and when MLI firing was suppressed with light (right).
Extended Data Fig. 4. Simple spikes promote synchrony whereas complex spikes suppress firing for neighboring cells.
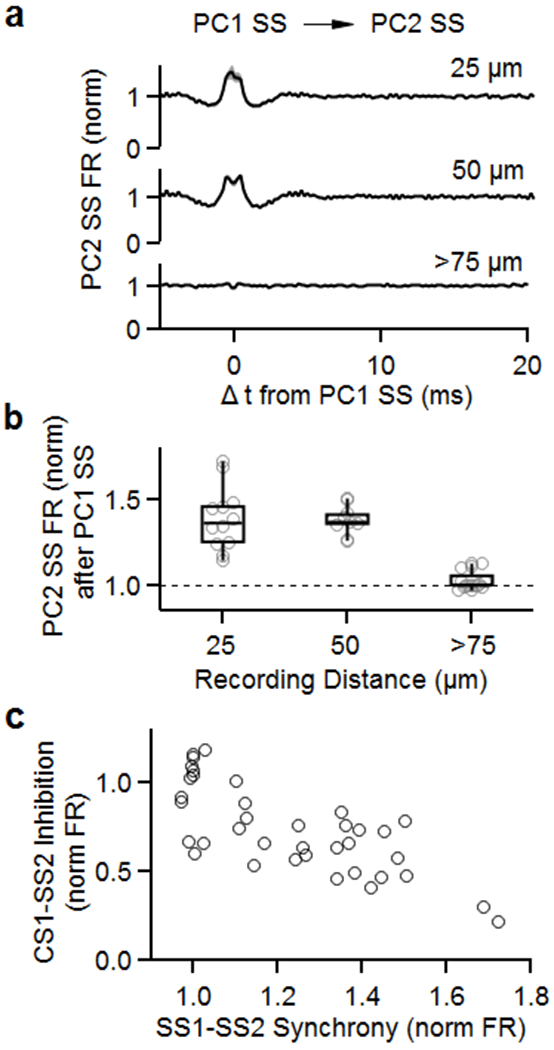
The CC firing of the PC pairs of Fig. 1 were analyzed as described previously 20.
(a) Average firing rate of simple spikes from neighboring PCs (PC2 SS) after simple spikes from PC1 (PC1 SS). Recording sites were separated by 25 μm (top), 50 μm (middle), and more than 75 μm (bottom).
(b) Summary of normalized firing rates of PC2 SS after PC1 SS as a function of distance between recording sites.
(c) Summary of inhibition of PC2 SS by PC1 CS (from Fig. 1) as a function of synchrony between PC1 SS and PC2 SS.
Box plots indicate median and interquartile range with the whiskers indicating the range.
Extended Data Fig. 5. Subtracted extracellular voltage responses by complex spikes.
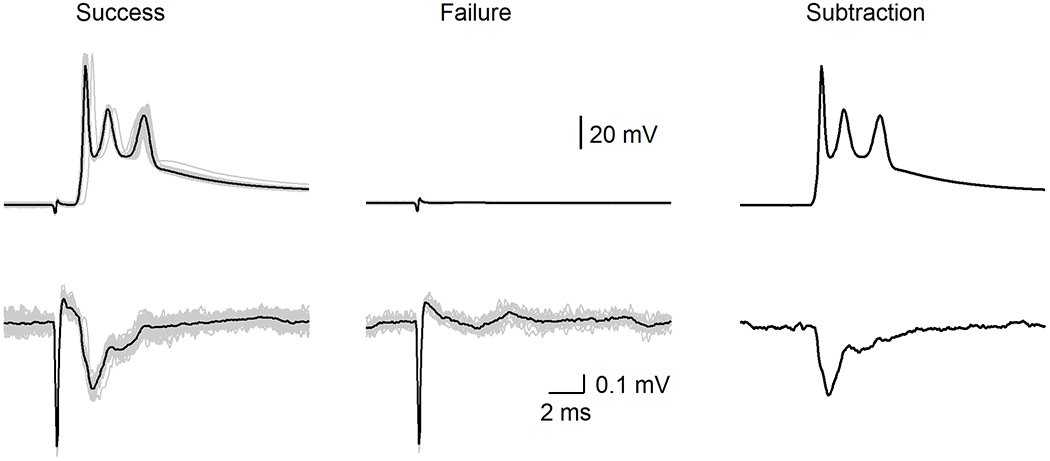
(top) Complex spikes by CF stimulation. A threshold stimulus intensity was used that stochastically evoked successes (left) or failures (middle) (individual trials: grey and average: black). Average success – average failure is shown (right)
(bottom) Extracellular signals near proximal dendrite by successful stimulation of the CF input (left), but no extracellular signals were observed when stimulation failed to evoke complex spikes (middle). Average success – average failure is shown (right).
Extended Data Fig. 6. Example light-evoked responses in PCs (a), DCN neurons (b), and in the motor thalamus (c).
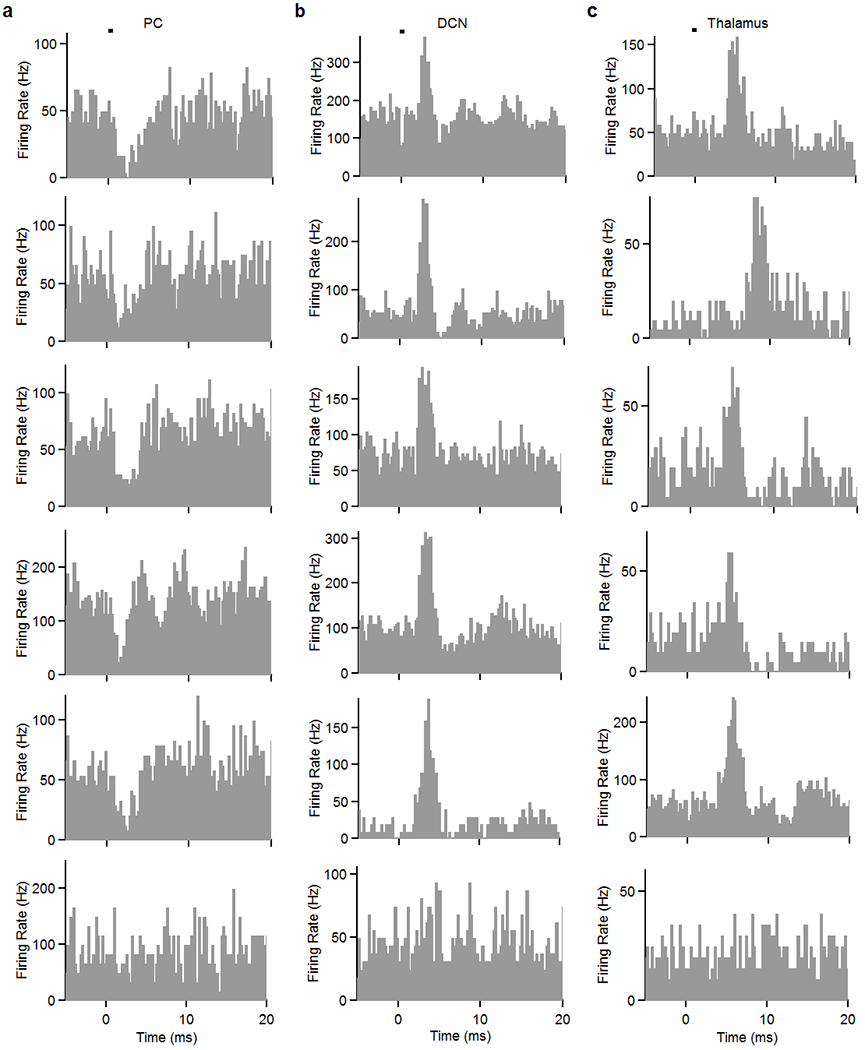
The bottom row shows example cells in each area that did not respond significantly to stimulation.
Extended Data Fig. 7. Schematic of PCs affected by CS inputs.
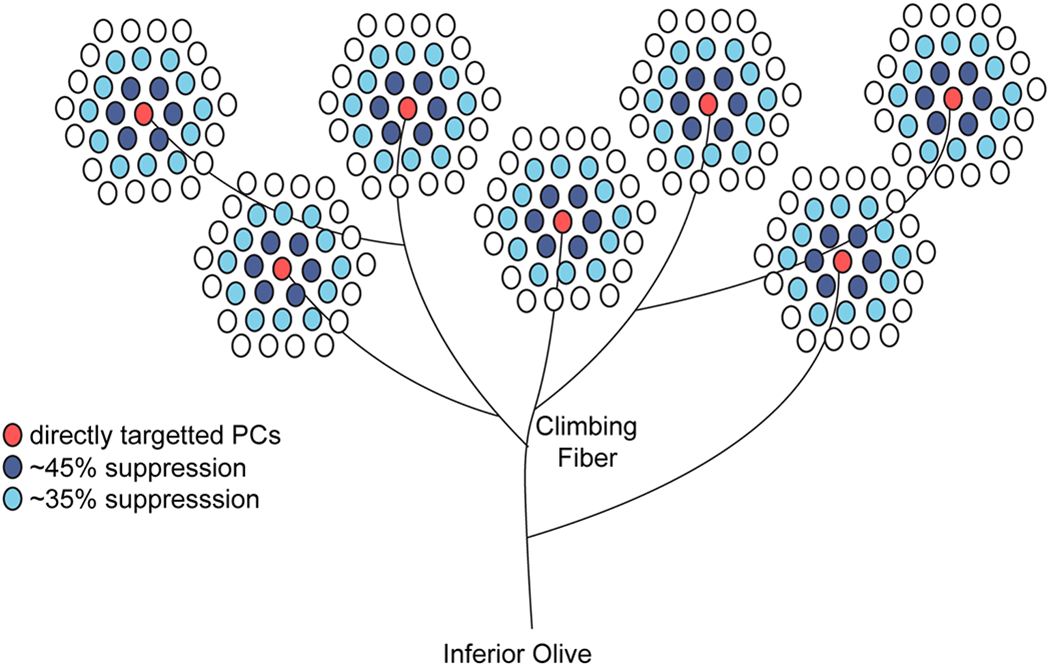
Model showing how PCs are affected by a single inferior olive neuron. Climbing fibers typically have 7 different branches and each contacts a single PC. Based on PC packing density 54–56, a hexagonal packing pattern, each individual branch will ephaptically inhibit about 18 neighboring PCs while directly exciting 7 PCs.
Supplementary Material
Supplementary Table 1 - Data summary and statistics
Acknowledgments
This work was supported by National Institutes of Health Grant R35NS097284 to WR, an NIH postdoctoral fellowship F32NS101889 to C.H.C., the Stuart & Victoria Quan Fellowship in Neurobiology to C.G, and a National Science Foundation Graduate Research Fellowship under Grant No. (1745303) to M.M.K. We thank the Neurobiology Imaging Facility for consultation and instrument availability that supported this work. This facility is supported in part by the Neural Imaging Center as part of an NINDS P30 Core Center grant #NS072030. We thank T. Osorno for the slice two-photon imaging. We thank B. Bean, L. Witter, and S. Rudolph for comments on the manuscript and thank Matthew Xu-Friedman for help with dynamic clamp.
Footnotes
Competing Interests
The authors declare no competing interests.
References (for main text only)
- 1.Hull C Prediction signals in the cerebellum: beyond supervised motor learning. Elife 9, doi: 10.7554/eLife.54073 (2020). [DOI] [PMC free article] [PubMed] [Google Scholar]
- 2.Eccles JC, Llinas R & Sasaki K The excitatory synaptic action of climbing fibres on the Purkinje cells of the cerebellum. J Physiol 182, 268–296, doi: 10.1113/jphysiol.1966.sp007824 (1966). [DOI] [PMC free article] [PubMed] [Google Scholar]
- 3.Medina JF The multiple roles of Purkinje cells in sensori-motor calibration: to predict, teach and command. Curr Opin Neurobiol 21, 616–622, doi: 10.1016/j.conb.2011.05.025 (2011). [DOI] [PMC free article] [PubMed] [Google Scholar]
- 4.Keller GB & Mrsic-Flogel TD Predictive Processing: A Canonical Cortical Computation. Neuron 100, 424–435, doi: 10.1016/j.neuron.2018.10.003 (2018). [DOI] [PMC free article] [PubMed] [Google Scholar]
- 5.Ito M, Yamaguchi K, Nagao S & Yamazaki T Long-term depression as a model of cerebellar plasticity. Prog Brain Res 210, 1–30, doi: 10.1016/B978-0-444-63356-9.00001-7 (2014). [DOI] [PubMed] [Google Scholar]
- 6.Granit R & Phillips CG Excitatory and inhibitory processes acting upon individual Purkinje cells of the cerebellum in cats. J Physiol 133, 520–547, doi: 10.1113/jphysiol.1956.sp005606 (1956). [DOI] [PMC free article] [PubMed] [Google Scholar]
- 7.Bell CC & Grimm RJ Discharge properties of Purkinje cells recorded on single and double microelectrodes. J Neurophysiol 32, 1044–1055 (1969). [DOI] [PubMed] [Google Scholar]
- 8.Barmack NH & Yakhnitsa V Cerebellar climbing fibers modulate simple spikes in Purkinje cells. J Neurosci 23, 7904–7916 (2003). [DOI] [PMC free article] [PubMed] [Google Scholar]
- 9.Apps R et al. Cerebellar Modules and Their Role as Operational Cerebellar Processing Units: A Consensus paper [corrected]. Cerebellum 17, 654–682, doi: 10.1007/s12311-018-0952-3 (2018). [DOI] [PMC free article] [PubMed] [Google Scholar]
- 10.Bengtsson F, Ekerot CF & Jorntell H In vivo analysis of inhibitory synaptic inputs and rebounds in deep cerebellar nuclear neurons. PLoS One 6, e18822, doi: 10.1371/journal.pone.0018822 (2011). [DOI] [PMC free article] [PubMed] [Google Scholar]
- 11.Lang EJ & Blenkinsop TA Control of cerebellar nuclear cells: a direct role for complex spikes? Cerebellum 10, 694–701, doi: 10.1007/s12311-011-0261-6 (2011). [DOI] [PMC free article] [PubMed] [Google Scholar]
- 12.Sudhakar SK, Torben-Nielsen B & De Schutter E Cerebellar Nuclear Neurons Use Time and Rate Coding to Transmit Purkinje Neuron Pauses. PLoS Comput Biol 11, e1004641, doi: 10.1371/journal.pcbi.1004641 (2015). [DOI] [PMC free article] [PubMed] [Google Scholar]
- 13.Tang T, Blenkinsop TA & Lang EJ Complex spike synchrony dependent modulation of rat deep cerebellar nuclear activity. Elife 8, doi: 10.7554/eLife.40101 (2019). [DOI] [PMC free article] [PubMed] [Google Scholar]
- 14.Coddington LT, Rudolph S, Vande Lune P, Overstreet-Wadiche L & Wadiche JI Spillover-mediated feedforward inhibition functionally segregates interneuron activity. Neuron 78, 1050–1062, doi: 10.1016/j.neuron.2013.04.019 (2013). [DOI] [PMC free article] [PubMed] [Google Scholar]
- 15.Jorntell H & Ekerot CF Receptive field plasticity profoundly alters the cutaneous parallel fiber synaptic input to cerebellar interneurons in vivo. J Neurosci 23, 9620–9631 (2003). [DOI] [PMC free article] [PubMed] [Google Scholar]
- 16.Mathews PJ, Lee KH, Peng Z, Houser CR & Otis TS Effects of climbing fiber driven inhibition on Purkinje neuron spiking. J Neurosci 32, 17988–17997, doi: 10.1523/JNEUROSCI.3916-12.2012 (2012). [DOI] [PMC free article] [PubMed] [Google Scholar]
- 17.Szapiro G & Barbour B Multiple climbing fibers signal to molecular layer interneurons exclusively via glutamate spillover. Nat Neurosci 10, 735–742, doi: 10.1038/nn1907 (2007). [DOI] [PubMed] [Google Scholar]
- 18.Nietz AK, Vaden JH, Coddington LT, Overstreet-Wadiche L & Wadiche JI Non-synaptic signaling from cerebellar climbing fibers modulates Golgi cell activity. Elife 6, doi: 10.7554/eLife.29215 (2017). [DOI] [PMC free article] [PubMed] [Google Scholar]
- 19.Anastassiou CA, Perin R, Markram H & Koch C Ephaptic coupling of cortical neurons. Nat Neurosci 14, 217–223, doi: 10.1038/nn.2727 (2011). [DOI] [PubMed] [Google Scholar]
- 20.Han KS et al. Ephaptic Coupling Promotes Synchronous Firing of Cerebellar Purkinje Cells. Neuron 100, 564–578 e563, doi: 10.1016/j.neuron.2018.09.018 (2018). [DOI] [PMC free article] [PubMed] [Google Scholar]
- 21.Blot A & Barbour B Ultra-rapid axon-axon ephaptic inhibition of cerebellar Purkinje cells by the pinceau. Nat Neurosci 17, 289–295, doi: 10.1038/nn.3624 (2014). [DOI] [PubMed] [Google Scholar]
- 22.Anastassiou CA, Perin R, Buzsaki G, Markram H & Koch C Cell type- and activity-dependent extracellular correlates of intracellular spiking. J Neurophysiol 114, 608–623, doi: 10.1152/jn.00628.2014 (2015). [DOI] [PMC free article] [PubMed] [Google Scholar]
- 23.Furukawa T & Furshpan EJ Two inhibitory mechanisms in the Mauthner neurons of goldfish. J Neurophysiol 26, 140–176, doi: 10.1152/jn.1963.26.1.140 (1963). [DOI] [PubMed] [Google Scholar]
- 24.Weiss SA & Faber DS Field effects in the CNS play functional roles. Front Neural Circuits 4, 15, doi: 10.3389/fncir.2010.00015 (2010). [DOI] [PMC free article] [PubMed] [Google Scholar]
- 25.Su CY, Menuz K, Reisert J & Carlson JR Non-synaptic inhibition between grouped neurons in an olfactory circuit. Nature 492, 66–71, doi: 10.1038/nature11712 (2012). [DOI] [PMC free article] [PubMed] [Google Scholar]
- 26.Korn H & Faber DS An electrically mediated inhibition in goldfish medulla. J Neurophysiol 38, 452–471, doi: 10.1152/jn.1975.38.2.452 (1975). [DOI] [PubMed] [Google Scholar]
- 27.Anastassiou CA & Koch C Ephaptic coupling to endogenous electric field activity: why bother? Current Opinion in Neurobiology 31, 95–103, doi: 10.1016/j.conb.2014.09.002 (2015). [DOI] [PubMed] [Google Scholar]
- 28.Altman J & Winfree AT Postnatal development of the cerebellar cortex in the rat. V. Spatial organization of purkinje cell perikarya. J Comp Neurol 171, 1–16, doi: 10.1002/cne.901710102 (1977). [DOI] [PubMed] [Google Scholar]
- 29.Sugihara I, Wu HS & Shinoda Y The entire trajectories of single olivocerebellar axons in the cerebellar cortex and their contribution to Cerebellar compartmentalization. J Neurosci 21, 7715–7723 (2001). [DOI] [PMC free article] [PubMed] [Google Scholar]
- 30.Witter L, Rudolph S, Pressler RT, Lahlaf SI & Regehr WG Purkinje Cell Collaterals Enable Output Signals from the Cerebellar Cortex to Feed Back to Purkinje Cells and Interneurons. Neuron 91, 312–319, doi: 10.1016/j.neuron.2016.05.037 (2016). [DOI] [PMC free article] [PubMed] [Google Scholar]
- 31.Orduz D & Llano I Recurrent axon collaterals underlie facilitating synapses between cerebellar Purkinje cells. Proc Natl Acad Sci U S A 104, 17831–17836, doi: 10.1073/pnas.0707489104 (2007). [DOI] [PMC free article] [PubMed] [Google Scholar]
- 32.Arlt C & Hausser M Microcircuit Rules Governing Impact of Single Interneurons on Purkinje Cell Output In Vivo. Cell Rep 30, 3020–3035 e3023, doi: 10.1016/j.celrep.2020.02.009 (2020). [DOI] [PMC free article] [PubMed] [Google Scholar]
- 33.Ebner TJ & Bloedel JR Correlation between activity of Purkinje cells and its modification by natural peripheral stimuli. J Neurophysiol 45, 948–961, doi: 10.1152/jn.1981.45.5.948 (1981). [DOI] [PubMed] [Google Scholar]
- 34.de Solages C et al. High-frequency organization and synchrony of activity in the purkinje cell layer of the cerebellum. Neuron 58, 775–788, doi: 10.1016/j.neuron.2008.05.008 (2008). [DOI] [PubMed] [Google Scholar]
- 35.Bell CC & Kawasaki T Relations among climbing fiber responses of nearby Purkinje Cells. J Neurophysiol 35, 155–169, doi: 10.1152/jn.1972.35.2.155 (1972). [DOI] [PubMed] [Google Scholar]
- 36.Fremeau RT Jr. et al. The expression of vesicular glutamate transporters defines two classes of excitatory synapse. Neuron 31, 247–260 (2001). [DOI] [PubMed] [Google Scholar]
- 37.Miyazaki T, Fukaya M, Shimizu H & Watanabe M Subtype switching of vesicular glutamate transporters at parallel fibre-Purkinje cell synapses in developing mouse cerebellum. Eur J Neurosci 17, 2563–2572 (2003). [DOI] [PubMed] [Google Scholar]
- 38.Hioki H et al. Differential distribution of vesicular glutamate transporters in the rat cerebellar cortex. Neuroscience 117, 1–6, doi: 10.1016/s0306-4522(02)00943-0 (2003). [DOI] [PubMed] [Google Scholar]
- 39.Person AL & Raman IM Purkinje neuron synchrony elicits time-locked spiking in the cerebellar nuclei. Nature 481, 502–505, doi: 10.1038/nature10732 (2011). [DOI] [PMC free article] [PubMed] [Google Scholar]
- 40.Carter BC, Giessel AJ, Sabatini BL & Bean BP Transient sodium current at subthreshold voltages: activation by EPSP waveforms. Neuron 75, 1081–1093, doi: 10.1016/j.neuron.2012.08.033 (2012). [DOI] [PMC free article] [PubMed] [Google Scholar]
- 41.Bloedel JR, Ebner TJ & Yu QX Increased responsiveness of Purkinje cells associated with climbing fiber inputs to neighboring neurons. J Neurophysiol 50, 220–239, doi: 10.1152/jn.1983.50.1.220 (1983). [DOI] [PubMed] [Google Scholar]
- 42.Kostadinov D, Beau M, Blanco-Pozo M & Hausser M Predictive and reactive reward signals conveyed by climbing fiber inputs to cerebellar Purkinje cells. Nat Neurosci 22, 950–962, doi: 10.1038/s41593-019-0381-8 (2019). [DOI] [PMC free article] [PubMed] [Google Scholar]
- 43.Heffley W et al. Coordinated cerebellar climbing fiber activity signals learned sensorimotor predictions. Nat Neurosci 21, 1431–1441, doi: 10.1038/s41593-018-0228-8 (2018). [DOI] [PMC free article] [PubMed] [Google Scholar]
- 44.Lu H, Yang B & Jaeger D Cerebellar Nuclei Neurons Show Only Small Excitatory Responses to Optogenetic Olivary Stimulation in Transgenic Mice: In Vivo and In Vitro Studies. Front Neural Circuits 10, 21, doi: 10.3389/fncir.2016.00021 (2016). [DOI] [PMC free article] [PubMed] [Google Scholar]
- 45.Najac M & Raman IM Synaptic excitation by climbing fibre collaterals in the cerebellar nuclei of juvenile and adult mice. J Physiol 595, 6703–6718, doi: 10.1113/JP274598 (2017). [DOI] [PMC free article] [PubMed] [Google Scholar]
- 46.Blenkinsop TA & Lang EJ Synaptic action of the olivocerebellar system on cerebellar nuclear spike activity. J Neurosci 31, 14708–14720, doi: 10.1523/JNEUROSCI.3323-11.2011 (2011). [DOI] [PMC free article] [PubMed] [Google Scholar]
- 47.Ten Brinke MM et al. Dynamic modulation of activity in cerebellar nuclei neurons during pavlovian eyeblink conditioning in mice. Elife 6, doi: 10.7554/eLife.28132 (2017). [DOI] [PMC free article] [PubMed] [Google Scholar]
- 48.Turecek J, Jackman SL & Regehr WG Synaptotagmin 7 confers frequency invariance onto specialized depressing synapses. Nature 551, 503–506, doi: 10.1038/nature24474 (2017). [DOI] [PMC free article] [PubMed] [Google Scholar]
- 49.Bloedel JR & Roberts WJ Action of climbing fibers in cerebellar cortex of the cat. J Neurophysiol 34, 17–31, doi: 10.1152/jn.1971.34.1.17 (1971). [DOI] [PubMed] [Google Scholar]
- 50.Gauck V & Jaeger D The control of rate and timing of spikes in the deep cerebellar nuclei by inhibition. J Neurosci 20, 3006–3016 (2000). [DOI] [PMC free article] [PubMed] [Google Scholar]
Methods only References
- 51.Huang S & Uusisaari MY Physiological temperature during brain slicing enhances the quality of acute slice preparations. Front Cell Neurosci 7, 48, doi: 10.3389/fncel.2013.00048 (2013). [DOI] [PMC free article] [PubMed] [Google Scholar]
- 52.Wu Y & Raman IM Facilitation of mossy fibre-driven spiking in the cerebellar nuclei by the synchrony of inhibition. J Physiol 595, 5245–5264, doi: 10.1113/JP274321 (2017). [DOI] [PMC free article] [PubMed] [Google Scholar]
- 53.Amat SB et al. Using c-kit to genetically target cerebellar molecular layer interneurons in adult mice. PLoS One 12, e0179347, doi: 10.1371/journal.pone.0179347 (2017). [DOI] [PMC free article] [PubMed] [Google Scholar]
- 54.Woodruff-Pak DS Stereological estimation of Purkinje neuron number in C57BL/6 mice and its relation to associative learning. Neuroscience 141, 233–243, doi: 10.1016/j.neuroscience.2006.03.070 (2006). [DOI] [PubMed] [Google Scholar]
- 55.Hadj-Sahraoui N, Frederic F, Delhaye-Bouchaud N & Mariani J Gender effect on Purkinje cell loss in the cerebellum of the heterozygous reeler mouse. J Neurogenet 11, 45–58 (1996). [DOI] [PubMed] [Google Scholar]
- 56.Doulazmi M et al. Cerebellar Purkinje cell loss during life span of the heterozygous staggerer mouse (Rora(+)/Rora(sg)) is gender-related. J Comp Neurol 411, 267–273 (1999). [PubMed] [Google Scholar]
Associated Data
This section collects any data citations, data availability statements, or supplementary materials included in this article.
Supplementary Materials
Supplementary Table 1 - Data summary and statistics
Data Availability Statement
The data that support the findings are available upon reasonable request from the corresponding author.


