Abstract
The ability to directly measure acetylcholine (ACh) release is an essential step towards understanding its physiological function. Here, we optimized the GRABACh (GPCR-Activation‒Based-ACh) sensor to achieve substantially improved sensitivity in ACh detection, as well as reduced downstream coupling to intracellular pathways. The improved version of the ACh sensor retains the sub-second response kinetics, physiological-relevant affinity and precise molecular specificity to ACh of its predecessor. Using this sensor, we revealed compartmental ACh signals in the olfactory center of transgenic flies in response to external stimuli including odor and body shock. Using fiber photometry recording and two-photon imaging, our ACh sensor also enabled sensitive detection of single-trial ACh dynamics in multiple brain regions in mice in a variety of behaviors.
Introduction
Cholinergic signals mediated by the neurotransmitter ACh are involved in a wide range of physiological processes, including muscle contraction, cardiovascular function, neural plasticity, attention and memory1–3. Previously, cholinergic activity in vivo was mainly measured by electrophysiology to record nicotinic receptor-mediated currents4, 5, by microdialysis followed with biochemical purification and identification6, or recently by cell-based sensors such as CNiFERs that convert extracellular ACh dynamics to intracellular Ca2+ signaling for detection7. However, these methods generally lack both cell-type specificity and the spatiotemporal resolution needed to precisely dissect cholinergic signals in the complex nervous system. Combining the type 3 muscarinic ACh receptor (M3R) with circularly permutated GFP (cpGFP), we recently developed GACh2.0 (short as ACh2.0), a genetically encoded GRAB (GPCR-Activation Based) ACh sensor that converts the ACh-induced conformational change on M3R into a sensitive fluorescence response8. The ACh2.0 sensor responds selectively to physiological concentrations of ACh with a half maximal effective concentration (EC50) of 2 μM, and has been used in several model organisms to detect the endogenous release and regulation of cholinergic signals9, 10. Here, we optimized the GRABACh sensor using site-directed mutagenesis and cell-based screening to further improve its performance in ACh detection.
Results
Engineering and characterization of ACh3.0 in cultured cells
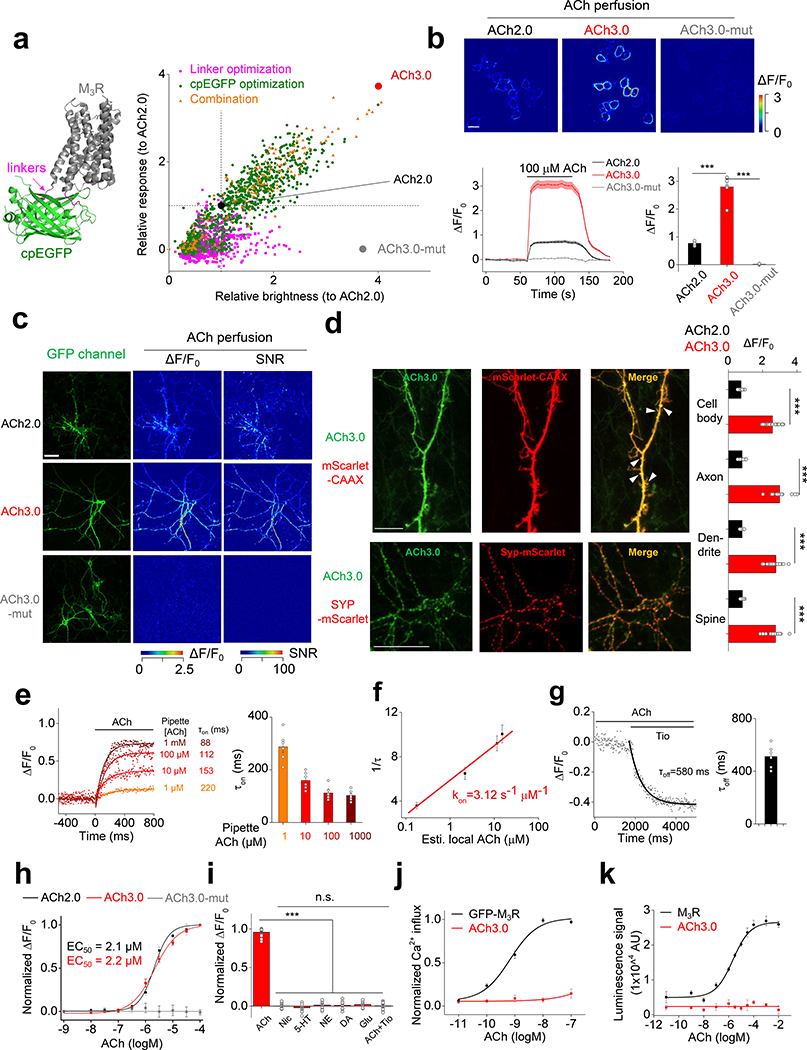
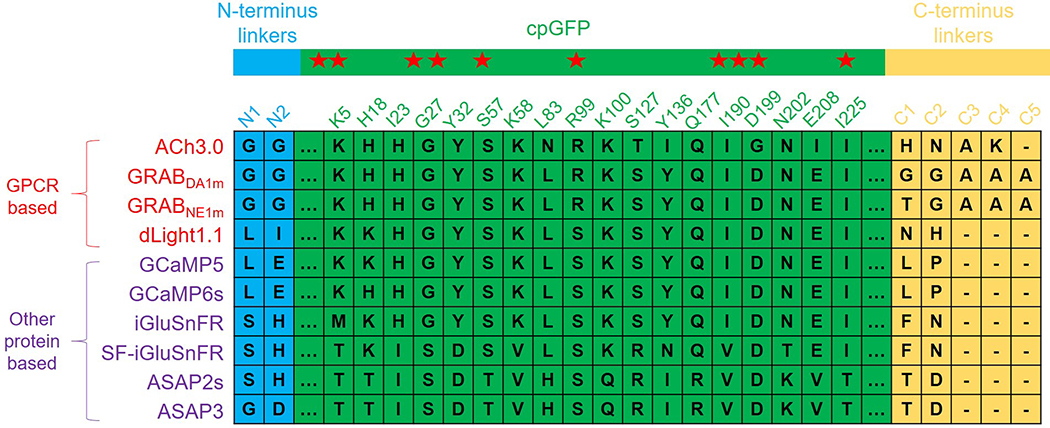
To improve the sensitivity of the GRABACh sensor, we focused on the interface between M3R and cpGFP, including the receptor’s third intracellular loop (ICL3) and linker peptides, as well as critical residues in cpGFP that contribute to its fluorescence intensity (Fig. 1a; Extended Data Figures 1 and 2). Our initial screening based on medium-throughput imaging on HEK293T cells identified several variants with improved performance; we subsequently verified these variants using confocal microscopy (see Methods for details). We selected the sensor with the largest ACh-induced fluorescence response for further study and named it GRABACh3.0 or ACh3.0 (Fig. 1a). We also generated a ligand-insensitive form of ACh3.0 (ACh3.0-mut) by introducing the W200A mutation into the receptor11 (Fig. 1a; Extended Data Figure 1e). When expressed in HEK293T cells or cultured neurons, the ACh3.0 sensor localized to the plasma membrane of the soma, and trafficked to dendrites and axons in neurons (Fig. 1b-d). Moreover, compared to ACh2.0, the ACh3.0 sensor had a significant larger fluorescence change in response to 100 μM ACh (ΔF/F0 ~280% and ~76% for ACh3.0 and ACh2.0 in HEK293T cells, respectively, p=6.26E-6, two-sided Student’s t test) (Fig. 1b-d; Extended Data Figure 3a-e); in contrast, the ACh-induced fluorescence change for the ACh3.0-mut sensor (ΔF/F0 ~1.8%) was less than 0.6% as large as that for ACh3.0, even at the highest ACh concentration tested (100 μM) (Fig. 1b-d; Extended Data Figure 1f). To probe the response kinetics of ACh3.0, we locally puffed different concentrations of ACh, and obtained a rate constant to ACh of kon = 3.12 s−1 μM−1 for ACh3.0 based on the kinetics of fluorescence change and ACh concentration (Fig. 1e-g; Extended Data Figure 3f). We similarly calculated the disassociation rate constant (koff = 1.72 s−1) of ACh3.0 to ACh by puffing antagonist (tiotropium, Tio12, 10 μM) to cells bathed in ACh (100 μM) ( Fig. 1e-g; Extended Data Figure 3g). The kinetic properties of ACh3.0 are similar to endogenous muscarinic ACh receptors13, 14. Importantly, ACh3.0 shared similar EC50 (~2 μM) with ACh2.0 when characterizing the dose-dependent response to different concentrations of ACh, and did not respond to nicotine and other major neurotransmitters (Fig. 1h, i). Using multiple assays including intracellular Ca2+ imaging, the Gq-dependent luciferase complementary assay15, and the β-arrestin‒dependent TANGO assay16, we confirmed that ACh3.0 has negligible coupling with major GPCR-mediated downstream pathways (Fig. 1j, k; Extended Data Figure 4a-e). We also tested that expressing ACh3.0 does not affect the physiological properties of neurons, as odorant-evoked Ca2+ transients in Drosophila expressing both ACh3.0 and jRCaMP1a17 were similar to those in flies expressing only jRCaMP1a (Extended Data Figure 4f, g).
Figure 1:
Optimization and in vitro characterization of next-generation GRABACh sensors.
a: Left: cartoon illustration showing the predicted structure of GRABACh sensors. Right: site-directed random mutagenesis is performed in linkers between the receptor and cpEGFP (magenta), cpEGFP (green), or both (orange), and the performance of each variant (relative to ACh2.0, black) is calculated and plotted. The final optimized sensor, ACh3.0 is indicated in red, and the ligand-insensitive ACh3.0-mut sensor (with W200A mutation) is indicated in gray. Each data point represents the average response measured in >100 cells per candidate. The “relative response” is calculated by considering ΔF/F0 of ACh2.0 as 1 and normalizing ΔF/F0 of each candidate to that. The “relative brightness” is calculated similarly. The crystal structures are from the protein database (PDB) archive (PDB ID: 4DAJ for M3R; PDB ID: 3EK4 for cpGFP).
b: The performance of the ACh2.0, ACh3.0, and ACh3.0-mut sensors expressed in HEK293T cells in response to 100 μM ACh upon confocal imaging. Top: pseudocolor images of the peak response (ΔF/F0) in the presence of 100 μM ACh. Bottom: representative traces and group data; n=5, 7, and 4 coverslips for ACh2.0, ACh3.0, and ACh3.0-mut, respectively, with an average of >20 cells per coverslip, p=6.2E-6 for ACh2.0 and ACh3.0; p=9.9E-6 for ACh3.0 and ACh3.0-mut.
c: The performance of the ACh2.0, ACh3.0 and ACh3.0-mut sensors expressed in cultured rat cortical neurons in response to 100 μM ACh. The raw GFP fluorescence and pseudocolor images of the peak response to ACh (ΔF/F0) and signal-to-noise ratio (SNR) are shown. Similar results as the representative images were observed for more than 10 neurons.
d: Left: representative images of ACh3.0 expressed together with synaptophysin (Syp) or CAAX fused to mScarlet. Dendritic spines are indicated by white arrowheads. Right: group data summarizing the fluorescence response of ACh2.0 (black bars) and ACh3.0 (red bars) to 100 μM ACh measured in the indicated neuronal compartments (cell body: n=11 cells for ACh2.0 and n=18 cells for ACh3.0, p=5.1E-14; axon: n=8 cells for ACh2.0 and n=14 cells for ACh3.0, p=2.3E-13; dendrite: n=18 cells for ACh2.0 and n=26 cells for ACh3.0, p=4.6E-15; spine: n=10 cells for ACh2.0 and n=16 cells for ACh3.0, p=1.5E-13).
e: The raising kinetics of ACh3.0 fluorescence signal in HEK293T cells to locally puffed ACh at the indicated concentrations in the puffing pipette. The actual concentrations reaching the cell are calibrated in Extended Data Fig. 3g based on the peak fluorescence response of ACh3.0. Representative traces and group data are shown (n=6 cells for 1 μM ACh; n=6 cells for 10 μM ACh; n=8 cells for 100 μM ACh; n=6 cells for 1000 μM ACh).
f: The association rate constant of the ACh3.0 sensor to ACh. Local ACh concentrations are estimated based on the dose-dependent fluorescence response of ACh3.0 (n=6 cells for 1 μM ACh; n=6 cells for 10 μM ACh; n=8 cells for 100 μM ACh; n=6 cells for 1000 μM ACh; ACh concentrations here indicate those in the puffing pipette).
g: The decay kinetics of the ACh3.0 fluorescence signal when locally puffed with antagonist Tio (10 μM) to cells bathed in ACh (100 μM). Representative traces and group data are shown (n=6 cells from 6 coverslips).
h: Dose-response relations for the fluorescence response of ACh2.0 (black), ACh3.0 (red), and ACh3.0-mut (gray) to ACh, with corresponding EC50 values (n=11,12 and 16 neurons for ACh2.0, ACh3.0 and ACh3.0-mut, respectively).
i: The fluorescence response of ACh3.0 to the indicated compounds (n=12 neurons each). ACh: 100 μM; nicotine (Nic): 50 μM; 5-HT: 1 μM; norepinephrine (NE): 10 μM; dopamine (DA): 20 μM; glutamate (Glu): 10 μM; and tiotropium (Tio): 2 μM, p=3.5E-14; 2.0E-14; 2.3E-14; 7.2E-14; 6.9E-14; 7.5E-14 between ACh and Nic, 5-HT, NE, DA, Glu, ACh+Tio, respectively.
j: The normalized Ca2+ response to ACh in HEK293T cells expressing GFP-M3R or ACh3.0. Each data point is averaged from n=10 cells.
k: The β-arrestin dependent luminescence signal in HEK293T cells expressing GFP-M3R or ACh3.0 in response to ACh at the indicated concentration (n=6 wells in each group, with >100 cells per well).
All data are shown as mean value +/− SEM, with the error bars or shaded regions indicating SEM. Scale bars represent 10 μm, except 20 μm in c. Two-sides Student’s t test performed in (b), (d) and (i); ***p<0.001 and n.s., not significant.
Detecting cholinergic activity in acute brain slices and in vivo in Drosophila with ACh3.0
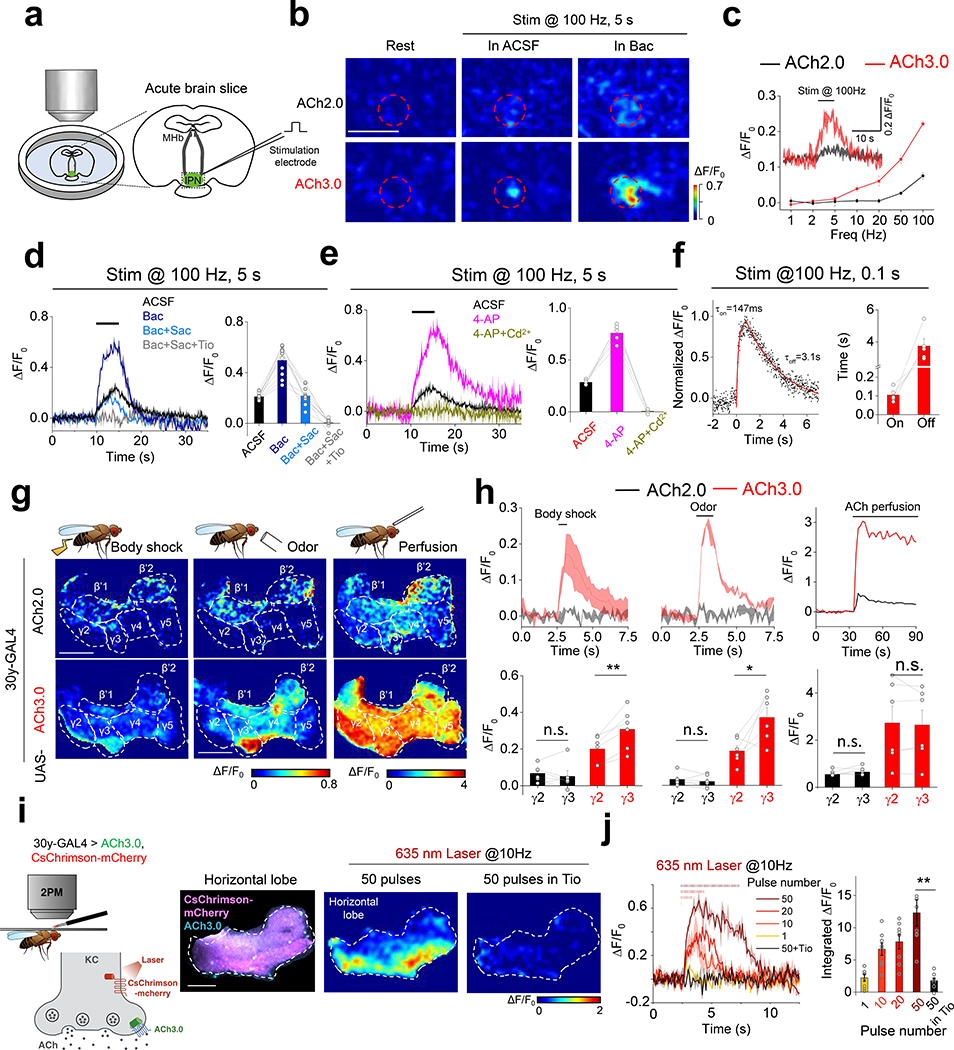
We previously reported that the ACh2.0 sensor could be used to record endogenous ACh dynamics, including the GABABR-dependent potentiation of ACh release in the MHb-IPN (medial habenula-interpeduncular nucleus) projection in acute mouse brain slices8, 18. We next tested whether ACh3.0 had better performance than ACh2.0 in reporting ACh release evoked by electrical stimulation in MHb-IPN slices (Fig. 2a). Consistent with our in vitro results, the ACh3.0 sensor has a significantly larger fluorescence increase compared to ACh2.0 in response to high-frequency (>10 Hz) electrical stimulation of the cholinergic fibers, both in control ACSF solution and in the presence of the GABABR agonist baclofen (Bac) (p=7.21E-11 in ACSF and p=6.69E-6 in Bac, all at 100Hz, two-sided Student’s t-test) (Fig. 2b, c; Extended Data Figure 5a-f). Application of the GABABR antagonist saclofen (Sac) reversed the baclofen-induced potentiation, and further adding Tio eliminated the stimulation-evoked response (Fig. 2d). Moreover, the electrically evoked signal was increased by the K+ channel blocker 4-AP and eliminated by Cd2+, consistent with Ca2+-dependent ACh release (Fig. 2e; Extended Data Figure 5g-i). Using a 100-ms electrical stimulation, we then measured the kinetics of the fluorescence response, yielding τon and τoff values of ~105 ms and 3.7 s, respectively (Fig. 2f).
Figure 2: Probing ACh dynamics in acute mouse brain slices and in vivo in Drosophila.
a: Schematic illustration depicting the two-photon imaging of acute MHb-IPN brain slices prepared from mice expressing ACh2.0 or ACh3.0 in the IPN. A bipolar electrode placed in the IPN is used to evoke endogenous ACh release.
b: Pseudocolor images of the fluorescence response (ΔF/F0) of ACh2.0 and ACh3.0 to electrical stimuli (100 Hz for 5 s) in ACSF or 2 μM baclofen (Bac). The red dashed circles indicate the regions of interest (30 μm in diameter) used for quantification. Data are representative of 5–10 slices from 3–7 mice.
c: Group summary of the fluorescence response of ACh2.0 and ACh3.0 to electrical stimuli at the indicated frequencies (n=11 slices from 8 mice). The inset shows representative traces of ACh2.0 and ACh3.0 in response to 100-Hz electrical stimulation.
d: Representative traces and group summary of the fluorescence response of ACh3.0 to electrical stimulation in either ACSF or the indicated drugs; n=5 slices from 5 mice per group. Baclofen (Bac): 2 μM; saclofen (Sac): 100 μM; and tiotropium (Tio): 10 μM.
e: Representative traces and group summary of the fluorescence response of ACh3.0 to electrical stimulation in ACSF, 4-AP (100 μM), or 4-AP with Cd2+ (100 μM); n=5 slices from 5 mice per group.
f: Fluorescence traces of ACh3.0 in response to 100-ms electrical stimulation. The rise and decay phases of the fluorescence signals are fitted to a single-exponential function, and the time constants are summarized on the right; n=5 slices from 5 mice per group.
g: Pseudocolor images of the peak fluorescence response in the mushroom body horizontal lobe in transgenic flies expressing ACh2.0 or ACh3.0 during body shock (left), odorant application (middle), and exogenous ACh perfusion (right). Similar results as the representative images were observed for more than 5 flies.
h: Top: fluorescence traces measured in the mushroom body in transgenic flies expressing ACh2.0 (black) or ACh3.0 (red); where indicated, body shock, odorant stimulation, or ACh is applied. Bottom: group summary of the fluorescence responses measured in the γ2 and γ3 lobes in the mushroom body; n=6 flies per group, p=0.47 between γ2 and γ3 in ACh2.0 to shock; p=0.004 between γ2 and γ3 in ACh3.0 to shock; p=0.39 between γ2 and γ3 in ACh2.0 to odor; p=0.04 between γ2 and γ3 in ACh3.0 to odor. p=0.23 between γ2 and γ3 in ACh2.0 to ACh perfusion; p=0.61 between γ2 and γ3 in ACh3.0 to ACh perfusion.
i: Left: schematic illustration depicting the experimental setup; CsChrimson-mCherry and ACh3.0 sensors are expressed in Kenyon cells (KCs) in the mushroom body, and 635-nm laser light is used to activate cholinergic KCs, the fly brain is bathed in AHLS containing 100 μM nicotinic acetylcholine receptor blocker mecamylamine (Meca). Right: fluorescence images and pseudocolor images of ACh3.0 sensors in response to 635-nm laser stimulation in the absence or presence of Tio (10 μM). Similar results as the representative images were observed for 8 flies.
j: Representative traces and group summary of the fluorescence response of ACh3.0 to the indicated number of 635-nm laser pulses applied at 10 Hz; n=8 flies per group, p=0.006.
All data are shown as mean value +/− SEM, with the error bars or shaded regions indicating SEM. Scale bars represent 50 μm (b) and 25 μm (g and i). Two-sides Student’s t test performed in (h) and (j); *, p<0.05, **, p<0.01, and n.s., not significant.
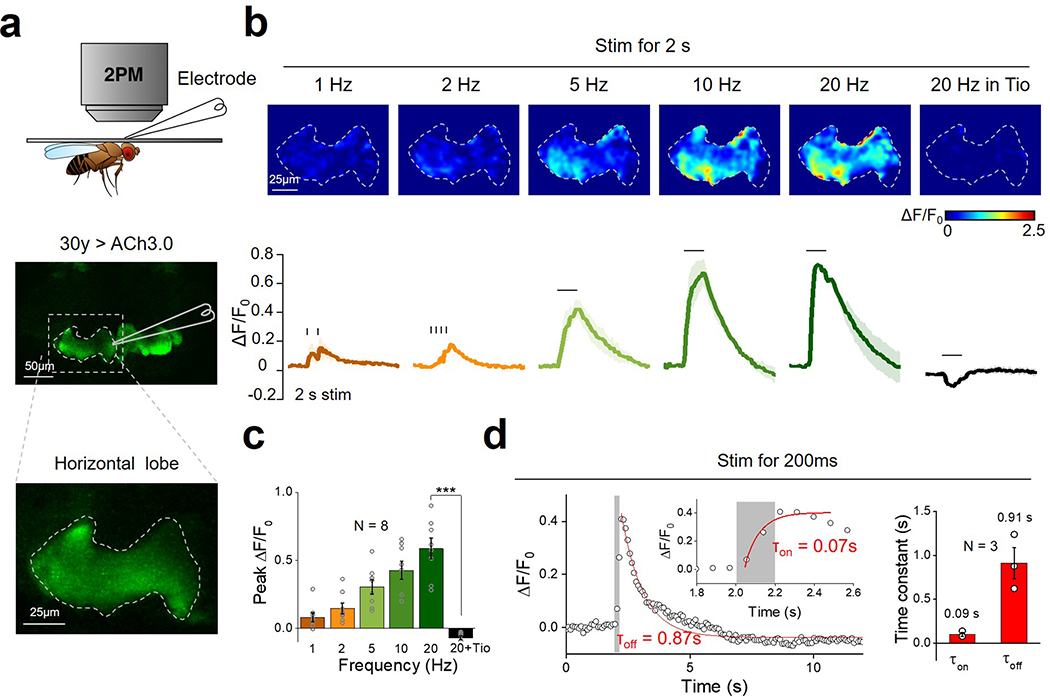
Next, we used in vivo two-photon imaging to compare the performance of ACh3.0 and ACh2.0 in transgenic Drosophila expressing the ACh sensors in Kenyon cells (KCs) of the olfactory mushroom body19 (Fig. 2g). Physiologically relevant stimuli, including body shock to the abdomen and odor stimulation, elicited only a minor fluorescence signal in the horizontal lobe of the mushroom body in ACh2.0-expressing flies. In contrast, the same stimuli induced a significantly larger response in ACh3.0-expressing flies (p=0.038 for body shock and p=1.26E-7 for odor, two-sided Student’s t test), and this increase was higher in the γ3 lob compared to the adjacent γ2 lobe, which revealed compartment-specific release of ACh (Fig. 2g, h). In addition, we monitored ACh dynamics in response to direct neuronal activation of KCs via CsChrimson-mediated optogenetics20 or electrical stimulation. A single 635-nm laser pulse evoked a clear increase in ACh3.0 fluorescence, and multiple pulses applied at 10 Hz induced a progressive response increase that was largely eliminated by Tio application (Fig. 2i, j). Electrical stimulation of KCs confirmed the frequency-dependent fluorescence increase in the ACh3.0 sensor, with rapid kinetics (τon ~0.09 s and τ0ff ~0.91 s) (Extended Data Figure 6). Taken together, these data show that the ACh3.0 sensor can reliably detect ACh release with high sensitivity and spatiotemporal resolution.
Recording of ACh dynamics in behaving mice in vivo
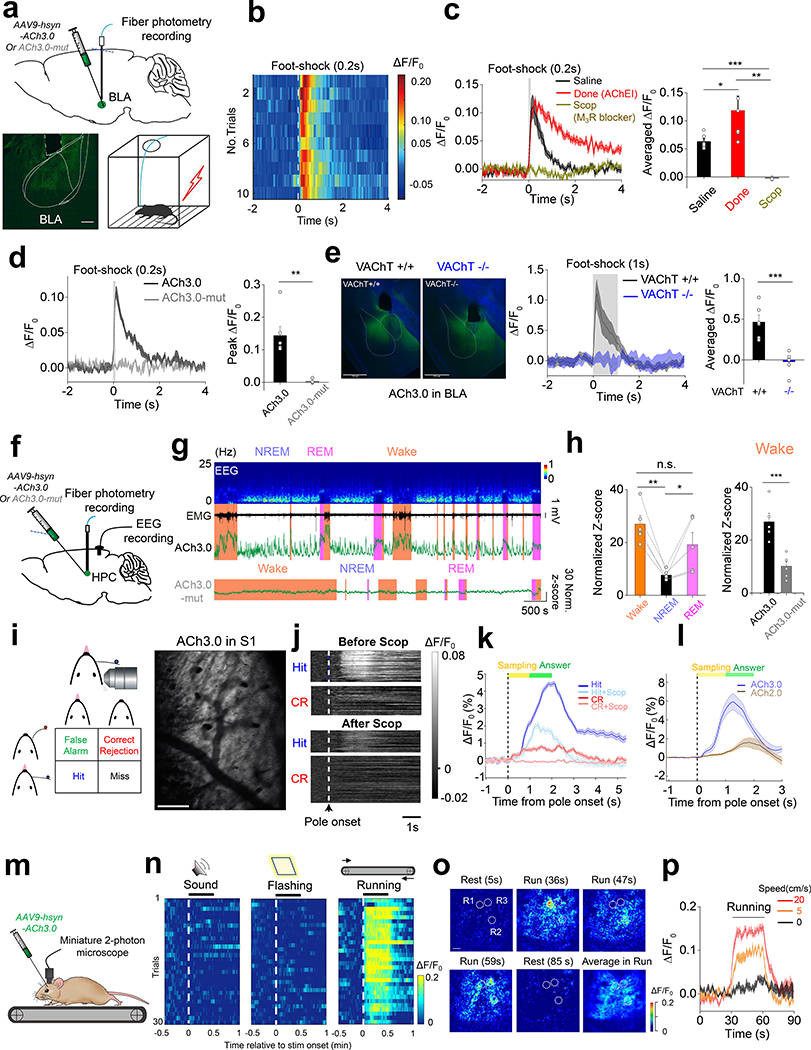
Cholinergic signaling plays a key role in modulating a variety of physiological processes, including plasticity and arousal21–24. We therefore examined whether ACh3.0 can be used in vivo to monitor ACh release in behaving mice. In the mouse brain, basal forebrain cholinergic neurons project to the amygdala, hippocampus and cortical regions25. We measured foot shock-evoked cholinergic signals in the basolateral amygdala (BLA), which is important for aversive associate learning24. A brief foot shock induced a reproducible and time-locked increase in ACh3.0 fluorescence (Fig. 3a, b). We then combined pharmacological and genetic manipulations to confirm the signal’s specificity. Treating the mice with the acetylcholinesterase inhibitor (AChEI) donepezil26 (Done) slowed the fluorescence decay, while the M3R antagonist scopolamine (Scop) abolished the foot shock-induced fluorescence response (Fig. 3c). As a control, we did not observed a response in mice expressing ACh3.0-mut (Fig. 3d) or in mice lacking the vesicular ACh transporter (VAChT−/−)27, suggesting a synaptic origin of the ACh release (Fig. 3e; Extended Data Figure 7a-c). Foot shocks induced much a larger fluorescence response in the ACh3.0 sensor compared to ACh2.0 (ΔF/F0 = 88.4% and 49.4% for ACh3.0 and ACh2.0, respectively, Extended Data Figure 7d, e) in the BLA. Taken together, these in vivo data indicate that the ACh3.0 sensor can reliably and sensitively report foot shock-induced cholinergic signaling in the BLA. Next, we examined whether ACh3.0 could stably report ACh signaling over a longer time period by recording ACh dynamics in the mouse hippocampus during the sleep-wake cycle. We simultaneously recorded EEG and EMG to monitor the animal’s sleep status (Fig. 3f). We found that the average fluorescence signal was larger during wakefulness and REM sleep, but lower during non-REM sleep (Fig. 3g, h; Extended Data Figure 8, consistent with our previous optrode-based recordings of the firing rate of basal forebrain cholinergic neurons28. As a control, we observed significantly smaller fluorescence changes during sleep-wake cycles using the ACh3.0-mut sensor when compared to ACh3.0 (p=0.0009 in wake; p=0.049 in NREM; p=0.008 in REM, two-sided Student’s t test) (Fig. 3h; Extended Data Figure 8). ACh3.0 was also able to detect ACh increases induced by micro-arousal events during NREM sleep (Fig. 3g), illustrating its precise temporal resolution in ACh detection. Overall, these data illustrate that ACh3.0 has the high sensitivity, rapid kinetics and stability needed to reliably track long-term physiological cholinergic signals in vivo.
Figure 3: Monitoring in vivo ACh dynamics in mice.
a: Top: schematic diagram depicting the injection of an AAV encoding the ACh3.0 or ACh3.0-mut sensor into the basolateral amygdala (BLA); the fluorescence response is recorded using fiber-photometry. Bottom: fluorescence of the ACh3.0 sensor expressed in the BLA (left) and a cartoon illustration of the foot shock experiments (right).
b: Pseudocolor fluorescence responses of ACh3.0 in the BLA to ten 0.2-s foot-shock stimuli at 0.4 mA. Similar results as the representative result were observed for 6 mice.
c: Representative traces and group summary of the fluorescence response of ACh3.0 in the BLA of mice following an i.p. injection of saline (black), the acetylcholinesterase inhibitor donepezil (Done, red, 3 mg/kg body weight), or the M3R antagonist scopolamine (Scop, gray, 6 mg/kg body weight). The average fluorescence response is calculated using the 1-s mean fluorescence after the initiation of foot shock (n=6 mice per group), p=0.046 between Saline and Done; p=0.0047 between Done and Scop; p=4E-5 between Saline and Scop.
d: Similar to (c), showing the fluorescence response of ACh3.0 and ACh3.0-mut to a 0.2-s foot-shock; n=6 and 4 mice for ACh3.0 and ACh3.0-mut, respectively, p=0.004.
e: Left: fluorescence images of ACh3.0 expressed in the BLA of control mice (VAChT+/+, black) and VAChT forebrain knockout mice (VAChT−/−, blue). Middle and right: representative traces and group summary of the response measured in the BLA of VAChT+/+ and VAChT−/− mice to 1-s foot-shock; n=6 mice per group, p=0.0008. Scale bars represent 750 μm.
f: Schematic diagram depicting the injection of an AAV resulting in the expression of ACh3.0 or ACh3.0-mut into the mouse hippocampus (HPC); fluorescence is recorded in the mice during the sleep-wake cycle. The placement of intracranial EEG recording electrodes is also indicated.
g: Representative recording of EEG, EMG and ACh3.0 (upper) or ACh3.0-mut (bottom) fluorescence response during the sleep-wake cycle. The mouse’s sleep/wake status (wake, NREM sleep, or REM sleep) is determined using the EEG and EMG data and is indicated. The standard deviation of the signal during NREM sleep when there was no apparent fluctuation in the signal is used for normalization to calculate the normalized Z-score (see Methods for detail).
h: Left, group summary of the ACh3.0 fluorescence response (expressed as a normalized Z-score) in mice while awake and during NREM and REM sleep; n=5 mice per group. Right, the comparison of fluorescence response between ACh3.0 and ACh3.0-mut in wake status (n=5 mice for ACh3.0 and n=6 mice for ACh3.0-mut) of mice. P=0.0025 between wake and NREM; p=0.045 between NREM and REM; p=0.19 between wake and REM; p=0.0009 between ACh3.0 and ACh3.0-mut. The comparison of ACh3.0 and ACh3.0-mut in other sleep status is summarized in Extended Data Figure 8.
i: Left, cartoon illustration of the head-fixed whisker-guided object localization task. Right, two-photon imaging of ACh sensors expressed in layer 2 of S1 cortex. Scale bar, 100 μm. Similar results as the representative images were observed for 3 mice.
j: Pseudocolor images showing the representative fluorescence response of ACh3.0 on Hit and Correct Rejection (CR) trials during the task, before and after i.p. injection of scopolamine (Scop, 5mg/kg). Similar results as the representative images were observed for 3 mice.
k: Average fluorescence response of ACh3.0 on Hit and Correct Rejection (CR) trials, before and after scopolamine (Scop) injection (n=3 mice).
l: Average fluorescence response comparing the ACh2.0 or ACh3.0 sensors on Hit trials (n=3 mice per group).
m: Schematic illustration depicting the experiment in which mice expressing ACh3.0 in the visual cortex are placed on a treadmill and ACh3.0 fluorescence is recorded using the miniature two-photon microscope.
n: Pseudocolor fluorescence responses of ACh3.0 to an auditory stimulus (30 s of a 7000-Hz tone, left), a visual stimulus (30-s of flashing light at 2 Hz, middle), or running on the treadmill (right). The responses of 30 consecutive trials are recorded and are plotted relative to the onset of each stimulus.
o: Pseudocolor images showing the spatial-temporal distribution of ACh3.0 fluorescence during locomotion from a single trial. R1, R2 and R3 are three representative ROIs (40 μm in diameter) indicating spatially selective ACh signals at indicated time point during running. The averaged fluorescent signal during entire running process is also shown. Scale bar, 50 μm. Similar results as the representative images were observed for 5 mice.
p: Representative traces of ACh3.0 fluorescence in mice recorded while running on a treadmill at the indicated speeds; each trace is averaged from 10 trials.
All data are shown as mean value +/− SEM, with the error bars or shaded regions indicating SEM.
Two-sides Student’s t test performed in (c), (d), (e) and (h); *p<0.05, **p<0.01, ***p<0.001, and n.s., not significant.
Next, to demonstrate the applicability of ACh3.0 in tracking cholinergic signaling with high spatiotemporal resolution during volitional behavior, we performed two-photon imaging of ACh3.0 in primary somatosensory cortex (S1) of head-fixed mice performing a Go/No-go whisker-guided object location discrimination task29 (Fig. 3i, see Methods for detail). Briefly, Mice explored a presented pole with a whisker during the sampling period. During the answer period, mice licked for water reward when the pole was proximal (Hit trials) and withheld licking when the pole was distal (Correct Rejection trials). The presentation of a pole triggered a modest increase in ACh in both Hit and Correction Rejection trials during the sampling period (Fig. 3j, k). Furthermore, correct licking during the answer period (Hit trials) drove large increases in ACh, which were sustained at a more modest level until the end of the trial (Fig. 3j, k; Extended Data Figure 9. Application of scopolamine (5mg/kg, i.p.) largely reduced the fluorescence response on both Correct Rejection (ΔF/F0 = 0.56% before Scop; 0.01% after Scop) and Hit trials (ΔF/F0 = 4.35% before Scop; 1.91% after Scop) (Fig. 3j, k). Note the Scop does not completely block the response on Hit trial, likely due to the unsaturated concentration of Scop applied, as mice treated with higher concentration fail to perform this behavioral task. Under the same experimental settings, ACh3.0 also showed larger fluorescence responses during Hit trials than ACh2.0 (ΔF/F0 = 5.93% and 1.61% for ACh3.0 and ACh2.0, respectively) (Fig. 3l), consistent with our observations in cultured cells and in flies. Overall, ACh3.0 allowed mapping of spatially heterogeneous release patterns of ACh across S1 with sub-second resolution during sensorimotor discrimination.
Finally, we expressed the ACh3.0 sensor in the mouse visual cortex and monitored the fluorescence signal using a miniature two-photon microscope attached to the head of the mouse30 (Fig. 3m; Extended Data Figure 9). During two-photon imaging, we placed the mouse on a treadmill and measured the ACh3.0 signal in response to auditory or visual stimuli or during the animal’s locomotion. We observed a robust increase in ACh3.0 fluorescence when the mouse was running, but not during the application of visual or auditory stimulation (Fig. 3n). We could also reveal spatially selective ACh signals at certain time points during running in a single imaging trial, indicating the ACh3.0 has high spatial and temporal resolution to resolve ACh patterns (Fig. 3o). Moreover, the fluorescence response positively correlated with the running speed of the mice (Fig. 3p; Extended Data Figure 9). The running-related increase in the ACh3.0 signal was abolished by the M3R antagonist Scop, but not the nAChR blocker mecamylamine (Meca), indicating a high specificity of the measured fluorescence signal (Extended Data Figure 9).
Discussion
Here, we here engineered GRABACh3.0 with higher sensitivity than GRABACh2.0 while maintaining specificity, precise temporal and spatial resolution and high photo-stability in detecting ACh. The improved sensor provides a robust tool for testing hypotheses about the dynamics of cholinergic activity under both physiological and pathophysiological conditions. With respect to studying physiological processes, the ACh3.0 sensor allows the real-time visualization of compartment-specific ACh release in the Drosophila olfactory system and cholinergic dynamics during the sleep-wake cycle in mice, shedding light on how cholinergic signaling is regulated. The improved ACh sensor, together with other GPCR-based neurotransmitter sensors recently developed8, 31–35, will help to address fundamental biological questions on neuromodulation in the future.
Online Methods
Animals
Male and female P0 Sprague–Dawley rats were used to prepare cultured cortical neurons; P28–48 wild-type C57BL/6N mice were used to prepare the acute brain slices and for two-photon in vivo imaging. C57BL/6J mice were used for fiber photometry recording. Mice lacking the vesicular acetylcholine transporter in the forebrain were generated as previously described36 by crossing VAChTflox/flox mice (Chat/Slc18a3tm1.2Vpra generated in a mixed C57BL/6J × 129/ SvEv background, backcrossed to C57BL/6J for 10 generations) with Nkx2.1-Cre mice (The Jackson Laboratory, stock no. JAX008661), yielding VAChT−/− offspring and control (VAChTflox/flox) littermates (referred to here as VAChT+/+). All rodents were either family-housed or pair-housed in a temperature-controlled room with a 12-h/12-h light/dark cycle. All procedures for animal surgery and experimentation were performed using protocols approved by the Animal Care & Use Committees at the Chinese Institute for Brain Research, the Peking University, the Chinese Academy of Sciences (CAS), Huazhong University of Science and Technology, the University of Southern California (20732–009) and the University of Western Ontario (2016–104), and were performed in accordance with the guidelines established by US National Institutes of Health. To generate transgenic Drosophila melanogaster, the two plasmids 10xUAS-IVS-ACh3.0-p10 and 10xLexAop2-IVS-ACh3.0-p10 were constructed and integrated into attp40 or VK00005 of fly genome mediated by PhiC31. The embryo injections were performed at Core Facility of Drosophila Resource and Technology, Shanghai Institute of Biochemistry and Cell Biology, CAS. Transgenic flies were raised on conventional corn meal at 25°C, with ∼70% humidity, under 12-h/12-h light/dark cycle. The fly lines used in this study: 30y-GAL4 (BDSC: 30818) from Yi Rao (Peking University), UAS-CsChrimson-mcherry and UAS-jRCaMP1a (BDSC: 64427) from Chuan Zhou (Institute of Zoology, CAS), and MB247-LexA from Yi Zhong (Tsinghua University).
Molecular biology
Plasmids were generated using the Gibson assembly method37. DNA fragments were generated using PCR amplification using primers (Thermo Fisher Scientific) with 30-bp overlap. The fragments were then assembled using T5-exonuclease (New England Biolabs), Phusion DNA polymerase (Thermo Fisher Scientific), and Taq ligase (iCloning). All sequences were verified using Sanger sequencing at the Sequencing Platform in the School of Life Sciences of Peking University. For screening in HEK293T cells, the ACh sensor constructs were cloned in the pDisplay vector (Invitrogen) followed by the IRES-mCherry-CAAX sequence, which served as a membrane marker to calibrate the signal intensity. Site-directed mutagenesis of the linker sequences and residues in cpEGFP was performed using primers containing randomized NNB codons (48 codons in total, encoding all 20 amino acids; Thermo Fisher Scientific). For AAV package, the ACh3.0 sensor and mutant ACh3.0-mut sensor were cloned into an AAV vector under the control of the human synapsin promoter. To generate transgenic Drosophila lines, the ACh3.0 sensor was cloned into the pJFRC28 vector, which was then used to generate transgenic flies via PhiC31-mediated site-directed integration into attp40.
Cell culture, transfection, and imaging
HEK293T cells (ATCC cell line CRL-3216) were cultured at 37°C in 5% CO2 in DMEM (GIBCO) supplemented with 10% (v/v) fetal bovine serum (GIBCO) and 1% penicillin-streptomycin (GIBCO). HEK293 cells stably expressing a tTA-dependent luciferase reporter and a β-arrestin2-TEV fusion construct were a gift from Bryan L. Roth (University of North Carolina). Rat cortical neurons were prepared from P0 Sprague‒Dawley rat pups (both male and female; Beijing Vital River). In brief, the brains were dissected, and cortical neurons were dissociated in 0.25% Trypsin-EDTA (GIBCO), plated on 12-mm glass coverslips coated with poly-D-lysine (Sigma-Aldrich), and cultured at 37°C in 5% CO2 in neurobasal medium containing 2% B-27 supplement, 1% GlutaMax, and 1% penicillin-streptomycin (all from GIBCO). HEK293T cells were transfected using the polyethylenimine (PEI) method (with a typical ratio of 1 μg DNA to 4 μg PEI); the media was replaced 4–6 h later, and cells were imaged 24 h after transfection. Cultured neurons were transfected at 7–9 days in vitro using the calcium phosphate transfection method, and experiments were performed 48 h after transfection. For screening candidate sensors, cultured HEK293T cells expressing the various candidate sensors were first imaged using the Opera Phenix High-Content Screening System (PerkinElmer) equipped with a 60 × /1.15 NA water-immersion objective, a 488-nm laser, and a 561-nm laser; the ACh sensor’s signal was obtained using a 525/50-nm emission filter, and the mCherry-CAAX signal was obtained using a 600/30-nm emission filter. The ratio between green (G) and red (R) fluorescence was calculated before and after application of 100 μM ACh, and the change in the G/R ratio was used as the fluorescence response; the peak G/R ratio was used as a brightness index. Candidate sensors with the best performance were subsequently imaged using a Ti-E A1 inverted confocal microscope (Nikon) equipped with a 40 × /1.35 NA oil immersion objective, a 488-nm laser, and a 561-nm laser. Drugs were prepared in Tyrode’s solution containing (in mM): 150 NaCl, 4 KCl, 2 MgCl2, 2 CaCl2, 10 HEPES, and 10 glucose (pH 7.4) and perfused into the imaging chamber. The ACh sensor’s signal was obtained using a 525/50-nm emission filter, and the mCherry signal was obtained using a 595/50-nm emission filter. Cultured neurons expressing the ACh sensor were similarly imaged using the inverted confocal microscope with drugs added by perfusion. To measure the kinetics of ACh3.0 sensor, the confocal line scanning mode (2600Hz) was used to record the fluorescence response when locally puffed with different concentrations of ACh in the pipette. The dose-dependent relationship between fluorescence response and ACh concentration in line scanning mode was further calibrated by bath application of ACh at different concentrations. The maximum fluorescence response at the steady-state after local ACh puffing was used to estimate the real local ACh concentration reaching the cell. The estimated local ACh concentration and the time constant of the fluorescence response were used to calculate the associate rate constant between ACh3.0 and ACh. Similarly, the decay kinetics was measured by locally puffing of antagonist Tio to cells bathed in ACh, and the disassociate rate constant was calculated as 1/τoff.
Slice preparation and imaging
Adeno-associated viruses (AAVs) expressing either ACh2.0 or ACh3.0 were packaged by Vigene Biosciences, and were injected into the mouse interpeduncular nucleus (IPN) (500 nl per mice, titer: 1×10^13 vg/ml). Two weeks after virus injection, the animals were anesthetized with an i.p. injection of Avertin (250 mg/kg body weight), and the heart was perfused with 5ml slicing buffer containing (in mM): 110 choline-Cl, 2.5 KCl, 1.25 NaH2PO4, 25 NaHCO3, 7 MgCl2, 25 glucose, and 2 CaCl2. The mice were then decapitated and brains were removed immediately and placed directly in cold oxygenated slicing buffer. The brains were first blocked at an ~45° angle relative to the horizontal plane and then sectioned into 250-μm thick slices using a VT1200 vibratome (Leica); the sections were transferred to oxygenated Ringer’s buffer containing (in mM): 125 NaCl, 2.5 KCl, 1.25 NaH2PO4, 25 NaHCO3, 1.3 MgCl2, 25 glucose, and 2 CaCl2. The slices were then recovered at 34°C for at least 40 min. For two-photon fluorescence imaging, slices were transferred to an imaging chamber and placed in an FV1000MPE two-photon microscope (Olympus) equipped with a 40 × /0.80 NA water-immersion objective and a mode-locked Mai Tai Ti:Sapphire laser (Spectra-Physics) tuned to 920 nm for excitation and a 495∼540-nm filter for signal collection. For electrical stimulation, a bipolar electrode (cat#WE30031.0A3, MicroProbes) was positioned near the IPN region under the fluorescence guidance, and the imaging and stimulation were synchronized using an Arduino board with a custom program. The stimulation voltage was set at ~4 V, and the duration of each stimulation pulse was set at 1 ms. Drugs were added by perfusion or were bath-applied.
Two-photon imaging in Drosophila
Female Drosophila melanogaster within 3 weeks after eclosion were used for imaging experiments. The fly was mounted on a customized chamber by tape, in a way the antenna and abdomen exposed to the air. The cuticle between compound eyes, as well as air sacs and fat bodies were removed to expose the brain which was then bathed in the saline, i.e. adult hemolymph-like solution (AHLS): (in mM) 108 NaCl, 5 KCl, 5 HEPES, 5 Trehalose, 5 sucrose, 26 NaHCO3, 1 NaH2PO4, 2 CaCl2 and 2 MgCl2. The same Olympus two-photon microscope as well as electrical stimulation equipment used for brain slices imaging was also used here. 920 nm laser was used for excitation. 495~540 nm filter was used for ACh2.0 or ACh3.0 imaging, and 575~630 nm filter was used for jRCaMP1a imaging. For odor stimulation, the odorant isoamyl acetate (Sigma-Aldrich, Cat#306967) was first diluted by 200-fold in mineral oil in a bottle and second diluted by 5-fold in air, which was then delivered to the fly’s antenna at a rate of 1000 ml/min. For body shock, two wires were attached to the abdomen of the fly, and a 60~80 V electrical pulse were delivered for 500 ms during stimulation. For ACh application, a patch of blood-brain-barrier of the fly was carefully removed by tweezers before imaging, and the saline containing ACh was delivered to the brain to 20 mM final concentration. For optogenetic stimulation, the 635 nm laser (1 ms pulses at 10 Hz) were delivered through optical fibers placed near the fly brain. Flies were fed with corn meal containing 10 μM β-carotene (Sigma-Aldrich) 3 days before optogenetics experiments. For electrical stimulation, a glass electrode (resistance ~0.2 MΩ) was placed in the region of the Mushroom Bodies and the stimulation voltage was set at 20~80 V. Tiotropium was added directly to the saline to the final concentration, and the following experiments were performed 10 min after application. The nicotinic receptor blocker mecamylamine (100 μM) was bath applied in electrical stimulation and optogenetic stimulation experiments. The sampling rates of imaging were set at 7 Hz during odor or body shock stimulation, 0.5 Hz during ACh application, 10 Hz during optogenetic stimulation and 12 Hz during electrical stimulation. Arduino was used to synchronized stimulation delivery and imaging with a custom program.
Fiber photometry, EEG and EMG recordings in mice
The AAV carrying ACh3.0 was injected into the basolateral amygdala (AP −1.4 mm, ML 3.1 mm, DV 4.1 mm) by a microsyringe pump, or into the hippocampus dorsal CA1 (AP −2.2 mm, ML 1.5 mm, DV 1.2 mm) using Nanoject II (Drummond Scientific) via a glass pipette. An optic fiber (230 μm, 0.37NA or 400 μm, 0.48 NA for BLA recording; 200 μm, 0.39NA for hippocampus recording) was inserted into the same coordinate used for virus injection. For the recording in BLA, the f-scope fiber photometry system (BiolinkOptics, China) with laser power adjust at 20–30 μW, or the fiber photometry system from Doric Lense (Quebec, Canada) with 465nm LED power set at 20–25 μW were used to record fluorescence signals. For recording in the hippocampus, an optic fiber (Thorlabs, FT200UMT) was attached to the implanted ferrule via a ceramic sleeve and recorded emission fluorescence using fiber photometry. The photometry rig was constructed using parts from Doric Lens, including a fluorescence optical mini cube (FMC4_AE(405)_E(460–490)_F(500–550)_S), a blue LED (CLED_465), a LED driver (LED_2) and a photoreceiver (NPM_2151_FOA_FC). For recordings containing an isosbestic channel (405-channel), we used a fluorescence optical mini cube FMC4_IE(400–410)_E(460–490)_F(500–550)_S, a blue LED (CLED_465), a deep blue LED (CLED_405), a LED driver (LED_2) and two photoreceivers (NPM_2151_FOA_FC). During recording, a software-controlled lock-in detection algorithm was implemented in the TDT RZ2 system using the fiber photometry ‘Gizmo’ of the Synapse software (modulation frequency: 459 Hz for single-channel recording, and 271 or 459 Hz for the 2nd channel in the two-channel mode; low-pass filter for demodulated signal: 20Hz, 6th order). The intensity of the excitation light was measured as 10 −20 μW from the tip of the optical fiber. The photometry data was stored using a sampling frequency of 1017 Hz. Data collected by the Quebec system were first filtered at 6-Hz low-pass and analyzed. Data from the hippocampus recording were first binned the raw data into 1 Hz and subtracted the background autofluorescence. We calculated the dF/F0 using a baseline obtained by fitting the autofluorescence-subtracted data with a 2nd order exponential function. To identify fast components or remove the slow drift of the photometry signal, we used a MATLAB script ‘BEADS’ with a cut-off frequency of 0.0005 cycles/sample (https://www.mathworks.com/matlabcentral/fileexchange/49974-beads-baseline-estimation-and-denoising-with-sparsity). To reduce artifact induced by movement or hemodynamic change, we scaled signal of the 405-channel to best-fit signal of the green channel using linear regression, and then subtracted the scaled signal from the green signal to obtain the artifact-corrected recording. To quantify the change in the photometry signal across multiple animals or conditions, the Z-score transformed dF/F0 was further normalized (norm. Z-score) using the standard deviation of the signal during NREM sleep when there was no apparent fluctuation in the signal. The normalized Z-score was used for all analyses in the sleep-wake recording.
To implant EEG and EMG recording electrodes, mice were anesthetized with isoflurane (5% induction; 1.5 – 2% maintenance) and placed on a stereotaxic frame with a heating pad. Two stainless steel screws for EEG were inserted into the skull above the visual cortex, two other screws were inserted into the skull above the frontal cortex, two insulated EMG electrodes were inserted into the neck muscle, and reference electrode was attached to a screw inserted into the skull above the cerebellum. The implant was secured to the skull with dental cement. All the experiments were carried out at least one week after the surgery. The EEG/EMG signals were recorded using TDT system-3 amplifiers (RZ2 + PZ5) with a high-pass filter at 0.5 Hz and digitized at 1500 Hz. Spectral analysis was carried out using fast Fourier transform (FFT) with a frequency resolution of 0.18 Hz. The brain states were scored every 5 seconds semi-automatically using a MATLAB GUI and validated manually by trained experimenters. Wakefulness was defined as desynchronized EEG and high EMG activity; NREM sleep was defined as synchronized EEG with high-amplitude delta activity (0.5 – 4 Hz) and low EMG activity; REM sleep was defined as high power at theta frequencies (6 – 9 Hz) and low EMG activity.
For ACh recording during foot-shock, mice were first habituated to the behavioral chamber set at 65db background noise and under infrared light for video visualization for 4 sessions (10 min per session, twice/day). Then, mice were habituated for 5 min before receiving foot-shock stimuli (10 trials of 0.2s or 1s long, 0.4 mA foot-shock intensity, 20s inter-trial intervals). Each foot-shock was coupled to the delivery of a 10ms long TTL output for synchronization with the fiber photometry recordings.
Two-photon imaging in mice
To express ACh3.0, the mice were initially anesthetized with an injection of Avertin or isoflurane (3% induction, 1–1.5% maintenance), the skin was retracted from the head, and a metal recording chamber was affixed. On the second day, the mice were anesthetized again, the skull above the visual cortex was opened, and ~400–500 nl of AAV was injected at the depth of 0.5 mm. A 2 mm × 2 mm or a 4 mm × 4 mm square coverslip was used to replace the skull. For the imaging in barrel cortex, all whiskers except C2 were trimmed before ISI and remained trimmed throughout the experiments, and mice were water restricted for around 1 week after the cranial window surgery. After cranial window surgery, mice were put on a whisker-guided Go/Nogo location task while doing two-photon imaging in barrel cortex. During the behavior, Mice explored a presented pole with a whisker during the sampling period. During the answer period, mice licked for water reward when the pole was proximal (Hit trials) and withheld licking when the pole was distal (Correct Rejection trials). Two-photon imaging using a miniature microscope in the visual cortex was performed 3 weeks after virus injection. In brief, the mice were first attached with the baseplate and allowed to habituate for 2–3 days before the experiment. During the experiment, the miniature two-photon microscope was placed on the baseplate, and the mice were head-fixed on a treadmill controlled by an electric motor. The output trigger from the computer was used to synchronize the imaging with the treadmill. The speed of the treadmill was adjusted by the motor and was calibrated. Visual and auditory stimuli were generated using MATLAB. The visual stimulation was delivered to the mice by a video screen placed ~30 cm from the contralateral eye relative to the virus-expressing hemisphere. The visual and auditory stimuli were synchronized with the imaging using an Arduino board. Where indicated, drugs were injected i.p. 30 minutes before the experiment.
Immunohistochemistry and immunofluorescence
Immunohistochemistry was performed as previously described38. In brief, the mice were anesthetized, the heart was perfused, and the brain was extracted and post-fixed overnight in 4% paraformaldehyde. The fixed brains were then transferred into a PBS-azide solution, and a vibratome was used to cut 45-μm sections. After slicing, free-floating sections were rinsed in washing buffer (PBS containing 0.15% Triton X-100), pre-incubated in 1% hydrogen for 30 minutes, and then rinsed in washing buffer. Sections were blocked for 1 h in washing buffer containing 5% (w/v) bovine serum albumin and 5% (v/v) normal goat serum. After blocking, the sections were incubated overnight in washing buffer containing the rabbit anti-VAChT antibody (Synaptic Systems, #139103; 1:250) plus 2% normal goat serum. After overnight incubation in primary antibody, the sections were rinsed in washing buffer and then incubated for 1 h in an anti-rabbit biotinylated antibody (Vector Laboratories, #ba-9400; 1:200) in washing buffer containing 2% normal goat serum. The sections were then rinsed in washing buffer and incubated with the VECTASTAIN ABC kit (Vector Laboratories) in accordance with the manufacturer’s instructions. The substrate diaminobenzidine (Vector Laboratories) was added as a chromogen, and the sections where counterstained with 0.5% methyl green solution. The sections were then cleared in xylene and mounted on glass slides. For immunofluorescence, slices were prepared as described above and incubated in Tris-buffered saline (TBS) containing 1.2% Triton X-100 for 20 minutes. The sections were rinsed with TBS and blocked for 1 h in TBS containing 5% (v/v) normal goat serum. After blocking, the sections were rinsed twice with TBS, and then incubated for 24 h at 4°C with chicken anti-GFP (Abcam, #ab13970, 1:500) in TBS containing 0.2% Triton X-100 and 2% normal goat serum. After 24 hours, the sections were washed twice for 10 min each in TBS. The sections were then incubated for 1 h in Alexa 488 goat anti-chicken antibody (Life Technologies, #A11039; 1:500) in TBS containing 0.2% Triton X-100 and 2% normal goat serum. The sections were washed twice in TBS for 10 minutes, and then incubated in Hoechst 33342 (ThermoFischer, #H3570; 1:500) to counterstain the nuclei. The EVOS FL Auto 2 Cell Imaging System (Invitrogen) was used to visualize the sections.
Statistics and reproducibility
Except where indicated otherwise, all summary data are reported as the mean ± s.e.m. Imaging data are processed by ImageJ (1.49V) or matlab software (matlab2013), and plotted by Origin 9.1 (Originlab). The signal-to-noise ratio (SNR) was calculated as the peak response divided by the standard deviation of the baseline fluorescence. Group differences were analyzed using the two-sided Student’s t-test, and differences with a p-value <0.05 were considered significant. For all representative images and traces, similar results were repeatable from more than 5 independent experiments.
Data Availability
The plasmid pAAV-hsyn-ACh3.0 and pAAV-hsyn-DIO-ACh3.0 have been deposited to addgene (#121922 and #121933) and are available. The transgenic Drosophila and related materials have been deposited to Bloomington Drosophila Stock Center (Flies: #FBti0210605; FBti0210606; FBti0210607; FBti0210608. Plasmids: #FBtp0140745; FBtp0140746; FBtp0140747; FBtp0140748) and are available. Source data are provided with this paper.
Code availability
The custom-written MATLAB, Arduino, and TDT programs will be provided upon request.
Extended Data
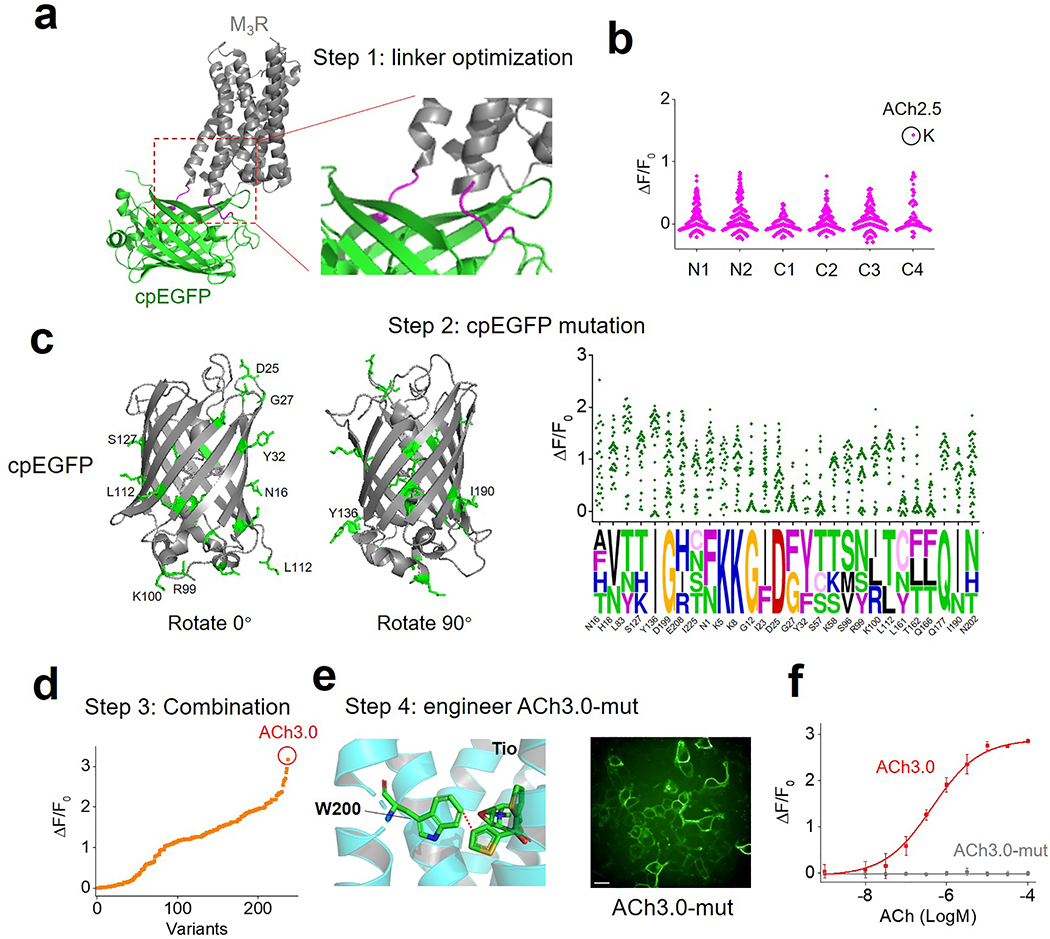
Extended Data Fig. 1. The engineering process leading to the GRABACh3.0 sensor.
a: Schematic illustration depicting the predicted structure of the generic GRABACh sensor, with the linker region between the receptor (M3R) and cpEGFP magnified at the right and shown in magenta. The crystal structures are from protein database (PDB) archive (PDB ID: 4DAJ for M3R; PDB ID: 3EK4 for cpGFP).
b: Site-directed mutagenesis of residues in the N and C termini of the linker region. The numbers indicate amino acid positions in the linker region (the first on N-terminus as N1, and the first on C-terminus as C1). The candidate with the best response is shown in a black circle and is called ACh2.5, with the C4 residue mutated to K; this candidate is used for further engineering steps.
c: Left: crystal structure of the cpEGFP moiety in the ACh3.0 sensor; targeted residues for mutagenesis screening are indicated in green and the corresponding amino acid labeled on the structure. Right, the fluorescence response of the indicated mutant candidate sensors is shown on top, with the sequences of the bestperforming candidates on the bottom; the relative size of each letter reflects the probability of that amino acid in the sequence. The residues are named by the amino acid followed by the position in cpGFP (the first amino acid in cpGFP as N1). The crystal structures are from protein database (PDB) archive (PDB ID: 3EK4 for cpGFP).
d: The fluorescence response of each candidate ACh sensor with combined mutations from the bestperforming sites in the linker and cpEGFP. Each point is calculated from the average of >100 cells.
e: left, illustration of the ligand binding pocket in M3R, which was mutated from W to A. Right, fluorescence image of HEK293T cells expressing ACh3.0-mut.
f: The fluorescence response of ACh3.0 and ACh3.0-mut to indicated concentration of ACh applied (n=3 wells for each point, with each well averaging >100 cells). Scale bar represents 10 μm.
All data are shown as mean value +/− SEM, with the error bars or shaded regions indicating SEM.
Extended Data Fig. 2. The summary of amino acids in linkers and critical residues within cpGFP in different genetically encoded sensors, including GPCR-based sensors and other protein backbone-based sensors.
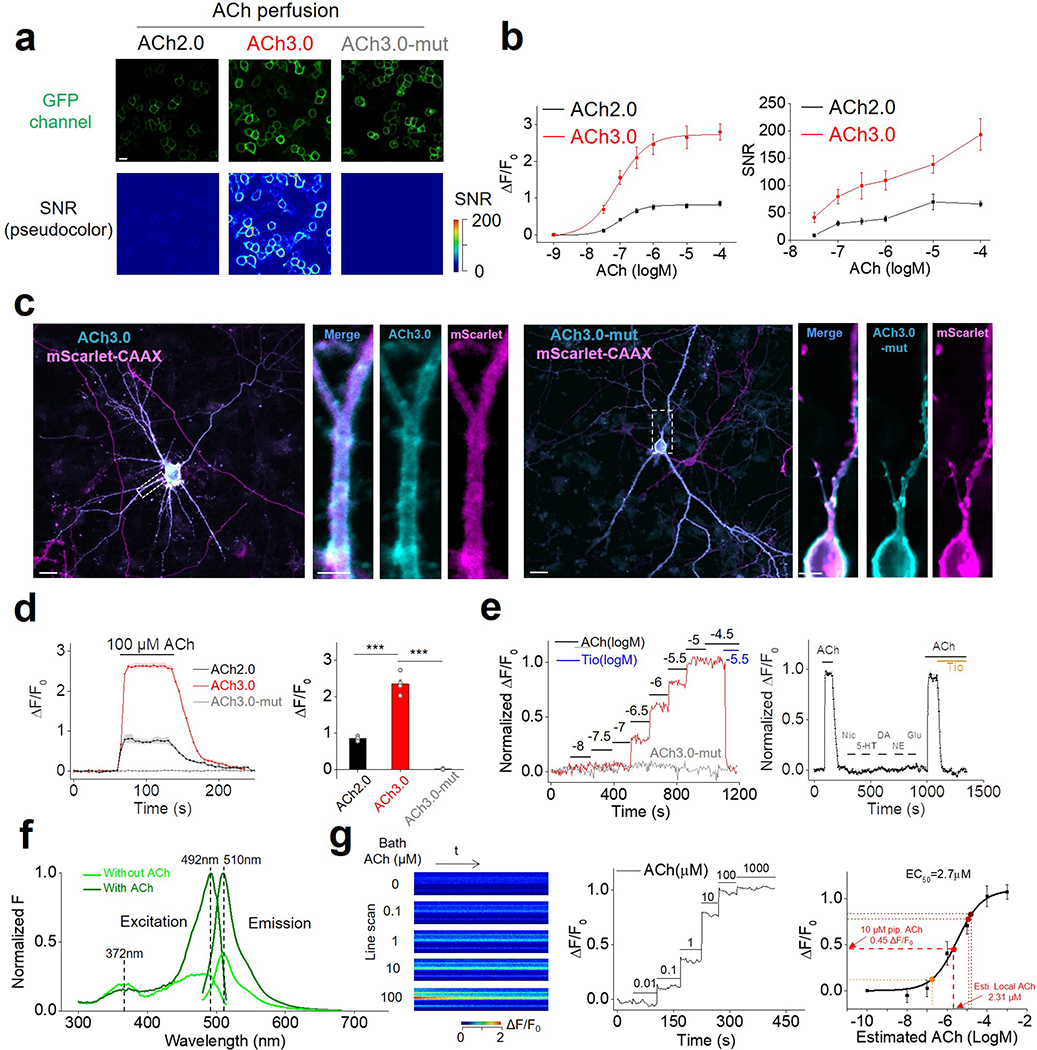
Extended Data Fig. 3. Characterization of ACh2.0 and ACh3.0.
a: The fluorescence response of ACh2.0, ACh3.0, and ACh3.0-mut to 100 μM ACh in HEK293T cells. The fluorescence images are shown on top, and corresponding pseudocolor images representing the signal-to-noise ratio (SNR) are shown at the bottom. Similar results as the representative images were observed for more than 7 cells. Scale bars represent 10 μm.
b: The peak fluorescence response (ΔF/F0, left) and SNR (right) of ACh2.0 (black) and ACh3.0 (red) are measured with the indicated concentrations of ACh; n=8 and 7 cells for ACh2.0 and ACh3.0, respectively.
c: Example fluorescence images of ACh3.0 (left) and ACh3.0-mut (right) expressed in cultured rat cortical neurons. Membrane-targeted mScarlet-CAAX is coexpressed and used to confirm expression at the plasma membrane. Similar results as the representative images were observed for more than 5 neurons. Scale bars represent 10 μm in the original image and 5 μm in the magnified images.
d: Representative traces (left) and group summary (right) of the fluorescence response of ACh2.0, ACh3.0, and ACh3.0-mut expressed in cultured neurons; where indicated, 100 μM ACh is applied to the cells (n=4, 5, and 7 neurons for ACh2.0, ACh3.0, and ACh3.0-mut, respectively), p=9.45E-5 between ACh2.0 and ACh3.0; p=6.42E-5 between ACh3.0 and ACh3.0-mut.
e: Left, representative traces of the normalized fluorescence change in ACh3.0 (red) and ACh3.0-mut (gray) in response to application of the indicated concentrations of ACh. Note that the ACh-induced fluorescence response in ACh3.0 is blocked by the M3R antagonist tiotropium (Tio, 3 μM). Right, representative trace of the normalized fluorescence change in ACh3.0 in response to indicated compounds. ACh: 100 μM; nicotine (Nic): 50 μM; 5-HT: 1 μM; norepinephrine (NE): 10 μM; dopamine (DA): 20 μM; glutamate (Glu): 10 μM; and Tio: 2 μM. Similar results as the representative images were observed for more than 5 neurons.
f: The excitation and emission spectra of ACh3.0 sensor in the absence (light green) and presence of ACh (100 μM, dark green).
g: Left, pseudocolor images showing the fluorescence response of ACh3.0 in confocal line scanning mode, with indicated concentrations of ACh applied by bath application. Middle, exemplar fluorescence response trace of ACh3.0 to different concentrations of ACh applied. Right, group data of the ACh3.0 dose-dependent fluorescence response in line scanning mode (from n=4 coverslips), which is used to estimate the local ACh concentration reaching the cells during kinetics experiments. The steady-state fluorescence response of ACh3.0 to puffed ACh are shown and calibrated based on the curve, with the detail numbers of 10 μM pipette ACh list as an example (pipette short as pip.; Estimated short as Esti.)
All data are shown as mean value +/− SEM, with the error bars or shaded regions indicating SEM. Two-sides Student’s t test performed in (d); ***p<0.001.
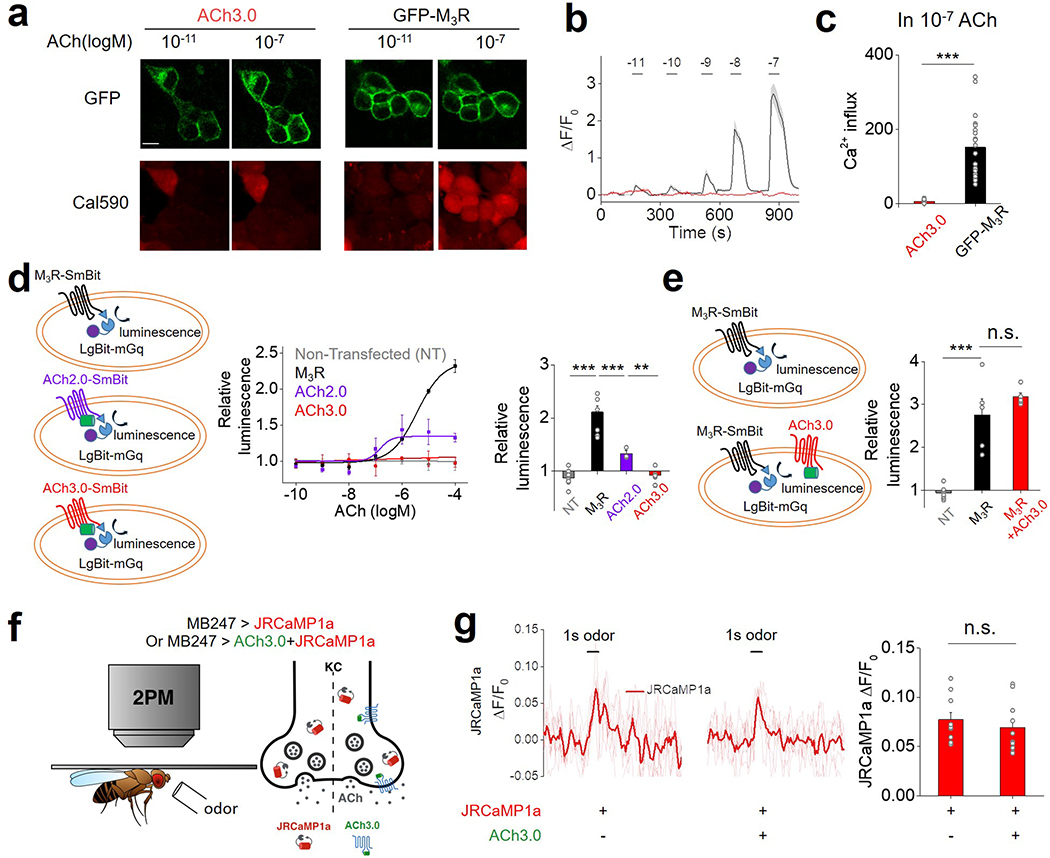
Extended Data Fig. 4. The GRABACh3.0 sensor produces negligible downstream signaling.
a-c: HEK293T cells expressing either a GFP-tagged M3R construct or ACh3.0 are loaded with the red Ca2+ dye Cal590 (a), and the change in Cal590 fluorescence is measured in response to various concentrations of ACh (b). The Ca2+ influx is calculated as the integration of Cal590 fluorescent signal (ΔF/F0) to ACh application. The group summary data for Ca2+ influx measured in response to 0.1 μM ACh are shown in panel c; n=21 and 15 cells for GFP-M3R and ACh3.0, respectively, p=1.06E-7.
d: Left, cartoon illustrating the experimental design of the luciferase complementation assay, in which cells expressed M3R-SmBit or ACh2.0/3.0-SmBit together with LgBit-mGq. Middle, the luminescence signal measured in non-transfected HEK293T cells (NT), cells expressing ACh2.0/ACh3.0-SmBit, or cells expressing M3R-SmBit in response to application of the indicated concentrations of ACh, normalized to the signal measured in control buffertreated cells (n=6 wells for NT; n=6 wells for M3R; n=3 wells for ACh2.0; n=6 wells for ACh3.0, with >100 cells in each well). Right, group summary of the luminescence signal measured in response to 100 μM ACh (n=6 wells for NT; n=6 wells for M3R; n=3 wells for ACh2.0; n=6 wells for ACh3.0, with >100 cells in each well; p=7.11E-7 between NT and M3R; p=9.95E-7 between M3R and ACh2.0; p=0.003 between ACh2.0 and ACh3.0).
e: Similar to (d), except the luminescence signal is measured in HEK293T cells expressing M3R-SmBit or cells expressing both M3R-SmBit and ACh3.0. The group summary at the right shows the luminescence signal in response to 100 μM ACh; n=5–8 wells per group, with each group averaging >100 cells, p=7.95E-5 between NT and M3R; p=0.33 between M3R and M3R+ACh3.0.
f: Schematic cartoon depicting two-photon imaging of transgenic flies in response to odorant stimulation. Ca2+ influx is measured by expressing jRCaMP1a either alone or together with ACh3.0 in the Kenyon cells (KC) of the mushroom body.
g: Representative fluorescence traces (left) and group summary (right) of jRCaMP1a fluorescence measured in response to odorant application in flies expressing jRCaMP1a either alone or together with ACh3.0; n=10 flies per group, p=0.49.
All data are shown as mean value +/− SEM, with the error bars or shaded regions indicating SEM. Scale bar represents 10 μm. Two-sides Student’s t test performed in (c), (d), (e) and (g); ***p<0.001 and n.s., not significant.
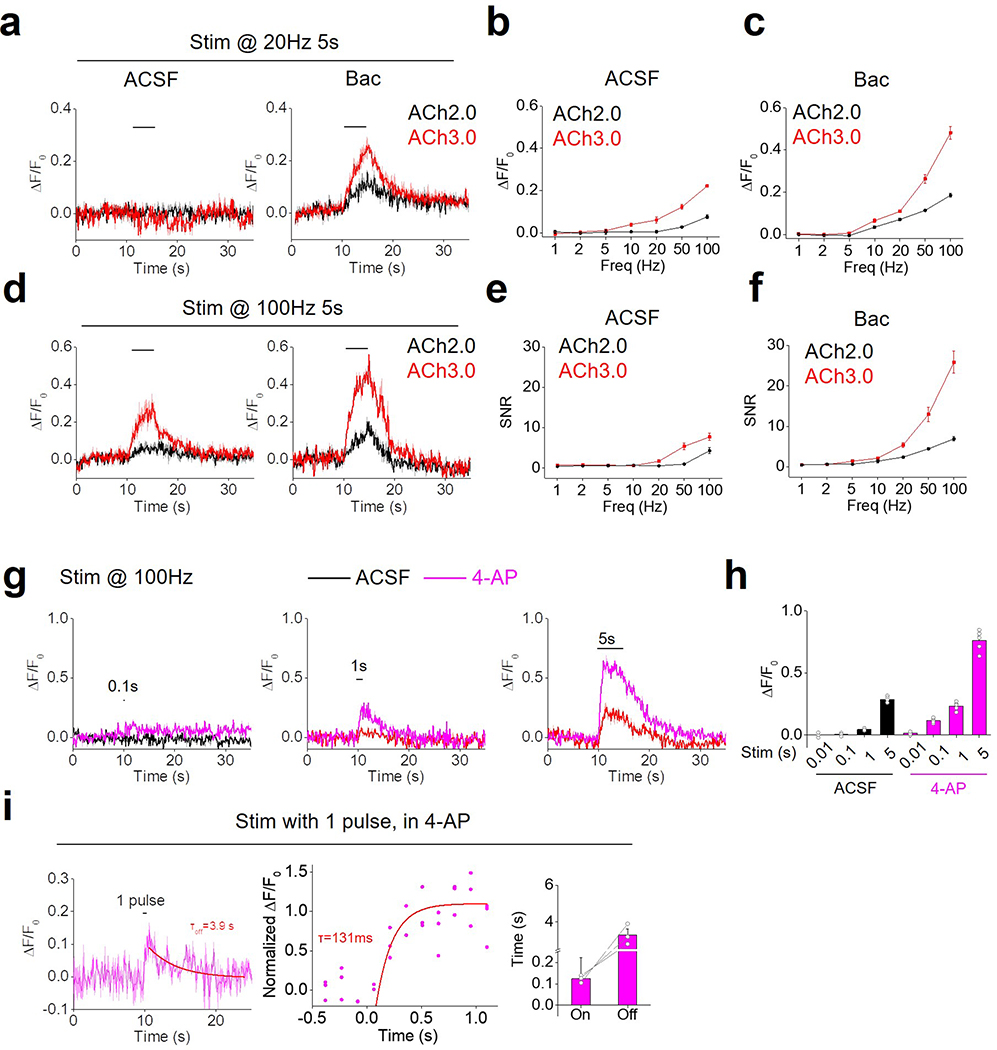
Extended Data Fig. 5. Probing endogenous ACh release in mouse brain slices.
a-f: Representative fluorescence traces (a, d) and group summary (b, c, e, f) of the fluorescence change (ΔF/F0 and SNR) in neurons expressing either ACh2.0 or ACh3.0 in response to electrical stimulation in MHb-IPN brain slices. The slices are bathed in either ACSF or 2 μM baclofen (Bac). N=5 slices from 3 mice for ACh2.0, and n=10 slices from 7 mice for ACh3.0.
g-h: The representative fluorescence traces (g) and group data (h) of ACh3.0-expressing neurons in response to 100-Hz electrical stimulation with different stimulation times in MHb-IPN brain slices. The response in either ACSF or 100 μM 4-AP is measured and summarized; n=5 slices from 5 mice.
i: The kinetics of fluorescence response of ACh3.0 to a single pulse (2ms) of electrical stimulation in the presence of 100 μM 4-AP. The response in three independent experiments are normalized and plotted together in the middle. The group data of on and off response time constants are summarized on the right (n=3 slices from 3 mice).
All data are shown as mean value +/− SEM, with the error bars or shaded regions indicating SEM.
Extended Data Fig. 6. Monitoring in vivo Ach release induced by electrical stimulation in Drosophila.
a: Schematic illustration depicting the experiment in which a transgenic fly expressing ACh3.0 in the KC cells in the mushroom body is placed under a two-photon microscope, and a glass electrode is placed near the mushroom body and used to deliver electrical stimuli. The fly brain is bathed in AHLS containing 100 μM nicotinic acetylcholine receptor blocker mecamylamine (Meca).
b: Pseudocolor images (top) and representative traces (bottom) of the fluorescence change in ACh3.0 in response to 2 s of electrical stimulation at the indicated frequencies. Where indicated, the M3R antagonist tiotropium (Tio, 10 μM) is applied to the bath solution. Similar results as the representative images were observed for 8 flies.
c: Group summary of the data shown in panel (b); n=8 flies, p=0.0004.
d: ACh3.0 fluorescence is measured before and after a 200-ms electrical stimulation, and the rise and decay phases are fitted with a single-exponential function; the time constants are indicated and summarized on the right; n=3 flies.
All data are shown as mean value +/− SEM, with the error bars or shaded regions indicating SEM. Two-sides Student’s t test performed in (c); ***p<0.001.
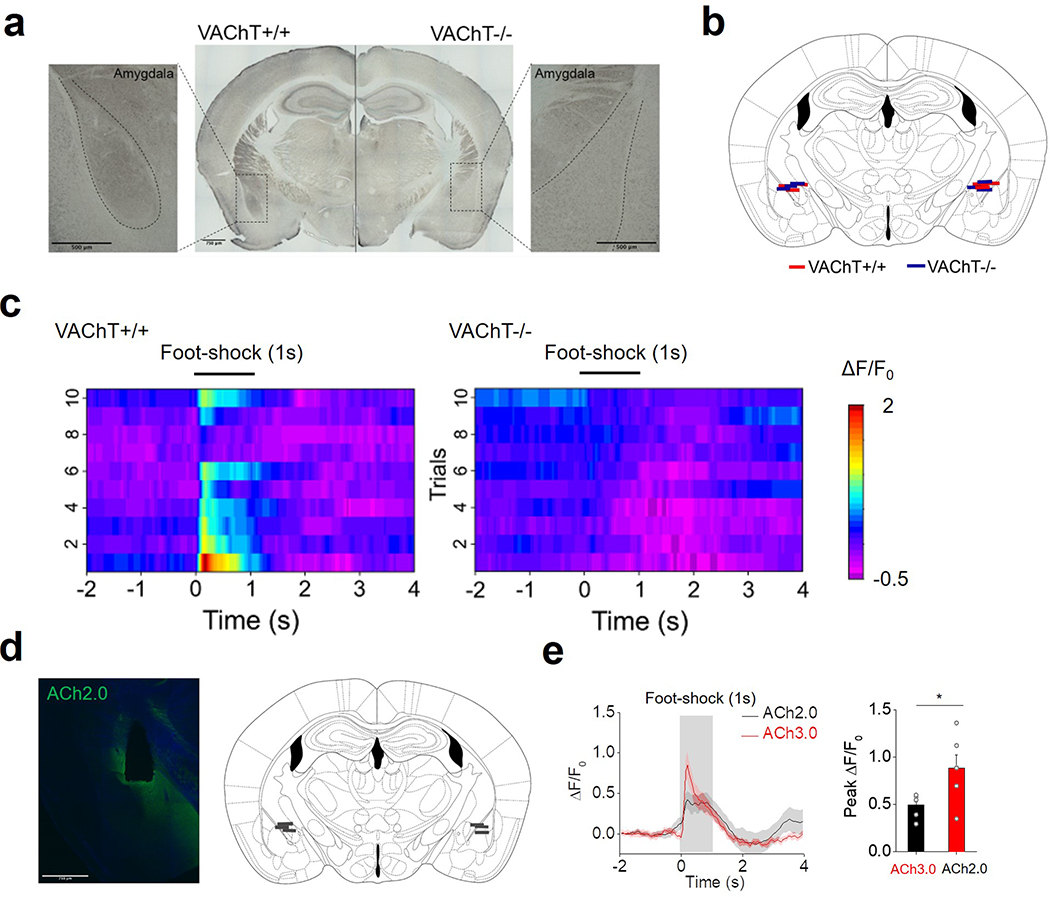
Extended Data Fig. 7. Monitoring endogenous cholinergic signals in BLA of mice in vivo.
a: VAChT immunohistochemistry is performed in coronal mouse sections obtained from a control (VAChT+/+) mouse (left) and a VAChT−/− mouse (right). The insets show magnified views of cholinergic terminals in the basolateral amygdala (BLA). Similar results as the representative images were observed for 6 mice. Scale bars represent 500 μm.
b: Diagram summarizing the location of the optic fiber terminals in the BLA of VAChT+/+ (red) and VAChT−/− mice (blue); n=6 mice per group. This image is modified from the brain map in Allen mouse brain atlas (Allen Mouse Brain Atlas (2004), Allen Institute for Brain Science).
c: Pseudocolor image showing the change in ACh3.0 fluorescence measured in the BLA of VAChT+/+ mice (left) and VAChT−/− mice (right) in response to a 1-s footshock; ten consecutive trials are shown.
d, e: The comparison of ACh2.0 and ACh3.0 fluorescence response in BLA of mice to foot-shock stimuli. The fluorescence signal showing the expression of ACh2.0 and the fiber photometry recording sites are shown in (d). Fluorescence traces and group data of the 1s foot-shock induced fluorescence response in ACh2.0 (black) and ACh3.0 (red) are shown in (e) (n=6 mice each for ACh3.0 and ACh2.0, p=0.04). Scale bar: 750 μm.
All data are shown as mean value +/− SEM, with the error bars or shaded regions indicating SEM. Two-sides Student’s t test performed in (e); *, p<0.05.
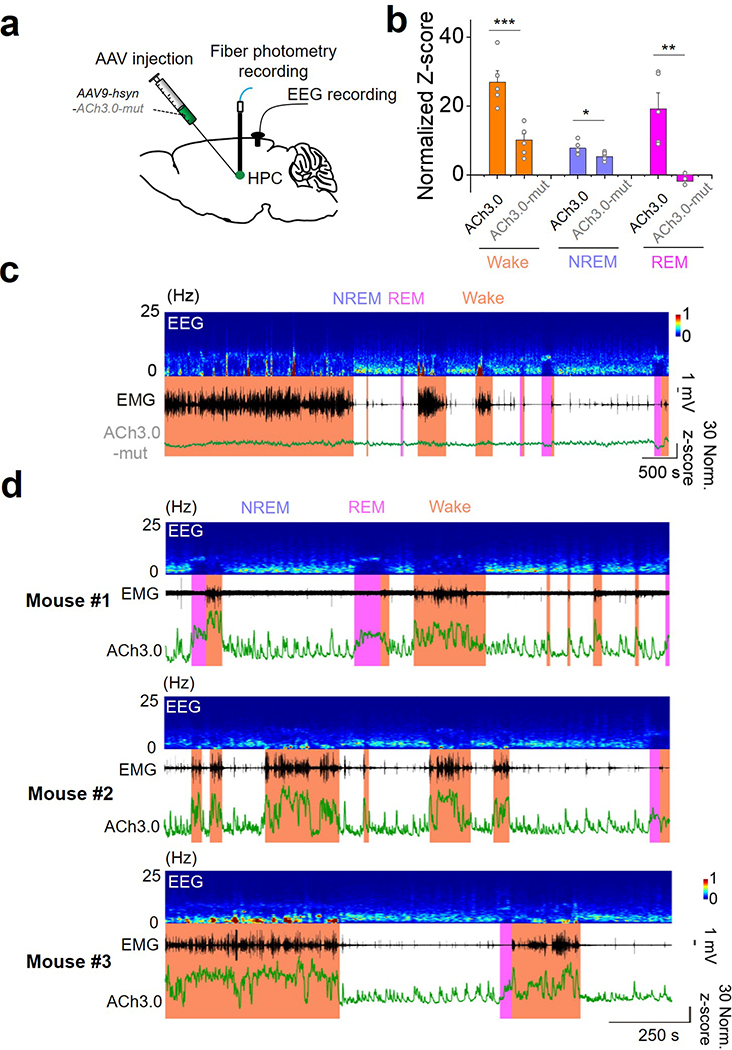
Extended Data Fig. 8. Recording of Ach signal during sleepwake cycle.
a: The schematic illustration and representative recording data of ACh3.0-mut sensor during the sleep-wake cycle in mice.
b: The group data of the fluorescence response of ACh3.0 and ACh3.0-mut sensors in different sleep-wake status (n=5 mice for ACh3.0 and n=6 mice for ACh3.0-mut, p=0.0009 in wake; p=0.049 in NREM; p=0.008 in REM).
c: The representative recording data of ACh3.0-mut sensor during the sleep-wake cycle in mice. Similar results as the representative images were observed for 6 mice.
d: Multiple recording traces of the ACh3.0 sensor during the sleep-wake cycle (from 3 mice, additional to the representative one in Fig. 3g).
All data are shown as mean value +/− SEM, with the error bars or shaded regions indicating SEM.
Two-sides Student’s t test performed in (b); *, p<0.05; **, p<0.01; ***, p<0.001.
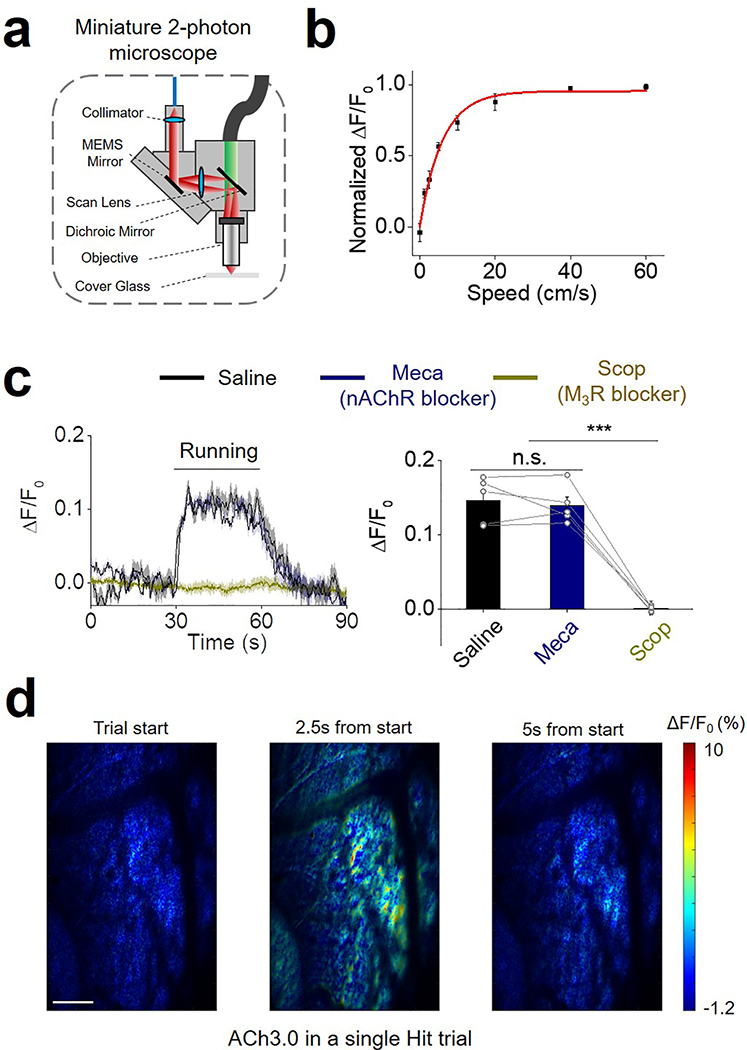
Extended Data Fig. 9. Imaging of ACh signal in the cortex.
a: Cartoon illustration of the miniature two-photon microscope.
b: Group data of ACh3.0 fluorescence in mice recorded while running on a treadmill at indicated speeds (n=5 mice).
c: Representative traces and group summary of ACh3.0 fluorescence measured in mice while performing the running task; where indicated, the mice receive an i.p. injection of saline (black), the nAChR blocker mecamylamine (Meca, 2 mg/kg body weight, blue), or theM3R antagonist scopolamine (Scop, 20 mg/kg body weight, dark yellow); each trace is averaged from 10 trials; n=5 mice per group, p=0.54 between Saline and Meca; p=0.0002 between Meca and Scop.
d: Pseudocolor images showing the ACh3.0 fluorescence response in the S1 in the Hit trial of the whisker-guided object location discrimination task. The left, middle and right image showing the response during baseline, peak in the answer period and after response. Similar results as the representative images were observed for 3 mice. Scale bar: 100 μm.
All data are shown as mean value +/− SEM, with the error bars or shaded regions indicating SEM. Two-sides Student’s t test performed in (c); *p<0.05, **p<0.01, ***p<0.001, and n.s., not significant.
Acknowledgments
We thank Y. Rao (Peking University) for generously sharing a two-photon microscope and X. Lei (Peking University) for providing support of the Opera Phenix High-content Screening System at PKU-CLS. We thank Dr. W. Inoue (University of Western Ontario) for kindly sharing the Multi Conditioning System foot-shocker. Work at the University of Western Ontario was supported by the Canada First Research Excellence Fund (CFREF, to L.M.S, V.F.P, T.J.B. and M.A.M.P.) and CIHR (PJT 159781 TO V.F.P.). O.K. was supported by an OGS PhD Fellowship and the Jonathan and Joshua Graduate Scholarship. M.S. was supported by CFREF. This work was supported by the General Research Program of National Natural Science Foundation of China (project 31671118 to Y.L.L. and 31327901 to H.C.), the NIH BRAIN Initiative (grant U01NS103558 to Y.L.L.), the Beijing Brain Initiative of Beijing Municipal Science & Technology Commission (Z181100001518004 to Y.L.L.), the Junior Thousand Talent Program of China, and by grants from the Peking-Tsinghua Center for Life Sciences and the State Key Laboratory of Membrane Biology at Peking University School of Life Science (to Y.L.L.).
Footnotes
Competing interests
M.J. and Y.L.L. have filed patent applications, the value of which could be affected by this publication.
References
- 1.Dale HH The action of certain esters and ethers of choline, and their relation to muscarine. Journal of Pharmacology and Experimental Therapeutics 6, 147–190 (1914). [Google Scholar]
- 2.Hasselmo ME The role of acetylcholine in learning and memory. Current opinion in neurobiology 16, 710–715 (2006). [DOI] [PMC free article] [PubMed] [Google Scholar]
- 3.Winkler J, Suhr S, Gage F, Thal L & Fisher L Essential role of neocortical acetylcholine in spatial memory. Nature 375, 484 (1995). [DOI] [PubMed] [Google Scholar]
- 4.KrnjeviĆ K & Miledi R Acetylcholine in Mammalian Neuromuscular Transmission. Nature 182, 805–806 (1958). [DOI] [PubMed] [Google Scholar]
- 5.Magleby KL & Stevens CF A quantitative description of end-plate currents. The Journal of Physiology 223, 173–197 (1972). [DOI] [PMC free article] [PubMed] [Google Scholar]
- 6.Marrosu F et al. Microdialysis measurement of cortical and hippocampal acetylcholine release during sleep-wake cycle in freely moving cats. Brain research 671, 329–332 (1995). [DOI] [PubMed] [Google Scholar]
- 7.Nguyen Q-T et al. An in vivo biosensor for neurotransmitter release and in situ receptor activity. Nature neuroscience 13, 127–132 (2010). [DOI] [PMC free article] [PubMed] [Google Scholar]
- 8.Jing M et al. A genetically encoded fluorescent acetylcholine indicator for in vitro and in vivo studies. Nature Biotechnology 36, 726 (2018). [DOI] [PMC free article] [PubMed] [Google Scholar]
- 9.Zhang X, Noyes NC, Zeng J, Li Y & Davis RL Aversive Training Induces Both Presynaptic and Postsynaptic Suppression in Drosophila. The Journal of Neuroscience 39, 9164–9172 (2019). [DOI] [PMC free article] [PubMed] [Google Scholar]
- 10.Zhu PK et al. Nanoscopic Visualization of Restricted Nonvolume Cholinergic and Monoaminergic Transmission with Genetically Encoded Sensors. Nano Letters 20, 4073–4083 (2020). [DOI] [PMC free article] [PubMed] [Google Scholar]
- 11.Tautermann CS et al. Molecular Basis for the Long Duration of Action and Kinetic Selectivity of Tiotropium for the Muscarinic M3 Receptor. Journal of Medicinal Chemistry 56, 8746–8756 (2013). [DOI] [PubMed] [Google Scholar]
- 12.Disse B et al. Ba 679 BR, a novel long-acting anticholinergic bronchodilator. Life Sci 52, 537–544 (1993). [DOI] [PubMed] [Google Scholar]
- 13.Falkenburger BH, Jensen JB & Hille B Kinetics of M1 muscarinic receptor and G protein signaling to phospholipase C in living cells. J Gen Physiol 135, 81–97 (2010). [DOI] [PMC free article] [PubMed] [Google Scholar]
- 14.Ziegler N, Bätz J, Zabel U, Lohse MJ & Hoffmann C FRET-based sensors for the human M1-, M3-, and M5-acetylcholine receptors. Bioorganic & Medicinal Chemistry 19, 1048–1054 (2011). [DOI] [PubMed] [Google Scholar]
- 15.Wan Q et al. Mini G protein probes for active G protein-coupled receptors (GPCRs) in live cells. J Biol Chem 293, 7466–7473 (2018). [DOI] [PMC free article] [PubMed] [Google Scholar]
- 16.Barnea G et al. The genetic design of signaling cascades to record receptor activation. Proceedings of the National Academy of Sciences 105, 64 (2008). [DOI] [PMC free article] [PubMed] [Google Scholar]
- 17.Dana H et al. Sensitive red protein calcium indicators for imaging neural activity. eLife 5, e12727 (2016). [DOI] [PMC free article] [PubMed] [Google Scholar]
- 18.Zhang J et al. Presynaptic excitation via GABAB receptors in habenula cholinergic neurons regulates fear memory expression. Cell 166, 716–728 (2016). [DOI] [PubMed] [Google Scholar]
- 19.Yao Yang M, Armstrong JD, Vilinsky I, Strausfeld NJ & Kaiser K Subdivision of the drosophila mushroom bodies by enhancer-trap expression patterns. Neuron 15, 45–54 (1995). [DOI] [PubMed] [Google Scholar]
- 20.Klapoetke NC et al. Independent optical excitation of distinct neural populations. Nature Methods 11, 338 (2014). [DOI] [PMC free article] [PubMed] [Google Scholar]
- 21.Marrosu F et al. Microdialysis measurement of cortical and hippocampal acetylcholine release during sleep-wake cycle in freely moving cats. Brain Res 671, 329–332 (1995). [DOI] [PubMed] [Google Scholar]
- 22.Vazquez J & Baghdoyan HA Basal forebrain acetylcholine release during REM sleep is significantly greater than during waking. Am J Physiol Regul Integr Comp Physiol 280, R598–601 (2001). [DOI] [PubMed] [Google Scholar]
- 23.Picciotto Marina R., Higley Michael J. & Mineur Yann S. Acetylcholine as a Neuromodulator: Cholinergic Signaling Shapes Nervous System Function and Behavior. Neuron 76, 116–129 (2012). [DOI] [PMC free article] [PubMed] [Google Scholar]
- 24.Jiang L et al. Cholinergic Signaling Controls Conditioned Fear Behaviors and Enhances Plasticity of Cortical-Amygdala Circuits. Neuron 90, 1057–1070 (2016). [DOI] [PMC free article] [PubMed] [Google Scholar]
- 25.Li X et al. Generation of a whole-brain atlas for the cholinergic system and mesoscopic projectome analysis of basal forebrain cholinergic neurons. Proceedings of the National Academy of Sciences 115, 415 (2018). [DOI] [PMC free article] [PubMed] [Google Scholar]
- 26.Seltzer B Donepezil: a review. Expert Opinion on Drug Metabolism & Toxicology 1, 527–536 (2005). [DOI] [PubMed] [Google Scholar]
- 27.Martins-Silva C et al. Novel Strains of Mice Deficient for the Vesicular Acetylcholine Transporter: Insights on Transcriptional Regulation and Control of Locomotor Behavior. PLOS ONE 6, e17611 (2011). [DOI] [PMC free article] [PubMed] [Google Scholar]
- 28.Xu M et al. Basal forebrain circuit for sleep-wake control. Nat Neurosci 18, 1641–1647 (2015). [DOI] [PMC free article] [PubMed] [Google Scholar]
- 29.Cheung J, Maire P, Kim J, Sy J & Hires SA The Sensorimotor Basis of Whisker-Guided Anteroposterior Object Localization in Head-Fixed Mice. Current Biology 29, 3029–3040.e3024 (2019). [DOI] [PMC free article] [PubMed] [Google Scholar]
- 30.Zong W et al. Fast high-resolution miniature two-photon microscopy for brain imaging in freely behaving mice. Nature Methods 14, 713–719 (2017). [DOI] [PubMed] [Google Scholar]
- 31.Patriarchi T et al. Ultrafast neuronal imaging of dopamine dynamics with designed genetically encoded sensors. Science 360, eaat4422 (2018). [DOI] [PMC free article] [PubMed] [Google Scholar]
- 32.Feng J et al. A Genetically Encoded Fluorescent Sensor for Rapid and Specific In Vivo Detection of Norepinephrine. Neuron 102, 745–761.e748 (2019). [DOI] [PMC free article] [PubMed] [Google Scholar]
- 33.Liang R, Broussard GJ & Tian L Imaging Chemical Neurotransmission with Genetically Encoded Fluorescent Sensors. ACS Chemical Neuroscience 6, 84–93 (2015). [DOI] [PubMed] [Google Scholar]
- 34.Jing M, Zhang Y, Wang H & Li Y G-protein-coupled receptor-based sensors for imaging neurochemicals with high sensitivity and specificity. Journal of Neurochemistry 151, 279–288 (2019). [DOI] [PMC free article] [PubMed] [Google Scholar]
- 35.Sun F et al. A Genetically Encoded Fluorescent Sensor Enables Rapid and Specific Detection of Dopamine in Flies, Fish, and Mice. Cell 174, 481–496.e419 (2018). [DOI] [PMC free article] [PubMed] [Google Scholar]
- 36.Al-Onaizi MA et al. Regulation of Cognitive Processing by Hippocampal Cholinergic Tone. Cereb Cortex 27, 1615–1628 (2017). [DOI] [PubMed] [Google Scholar]
- 37.Gibson DG et al. Enzymatic assembly of DNA molecules up to several hundred kilobases. Nature Methods 6, 343–345 (2009). [DOI] [PubMed] [Google Scholar]
- 38.Janickova H et al. Selective decrease of cholinergic signaling from pedunculopontine and laterodorsal tegmental nuclei has little impact on cognition but markedly increases susceptibility to stress. FASEB J 33, 7018–7036 (2019). [DOI] [PubMed] [Google Scholar]
Associated Data
This section collects any data citations, data availability statements, or supplementary materials included in this article.
Data Availability Statement
The plasmid pAAV-hsyn-ACh3.0 and pAAV-hsyn-DIO-ACh3.0 have been deposited to addgene (#121922 and #121933) and are available. The transgenic Drosophila and related materials have been deposited to Bloomington Drosophila Stock Center (Flies: #FBti0210605; FBti0210606; FBti0210607; FBti0210608. Plasmids: #FBtp0140745; FBtp0140746; FBtp0140747; FBtp0140748) and are available. Source data are provided with this paper.


