

Abstract
Wnt signaling dysregulation promotes tumorigenesis in colorectal cancer (CRC). We investigated the role of PTPRF, a receptor-type tyrosine phosphatase, in regulating Wnt signaling in CRC. Knockdown of PTPRF decreased cell proliferation in patient-derived primary colon cancer cells and established CRC cell lines. In addition, the rate of proliferation as well as colony formation ability were significantly decreased cells in tumor organoids grown in 3D, whereas the number of differentiated tumor organoids were markedly increased. Consistently, knockdown of PTPRF resulted in a decrease in the expression of genes associated cancer stem cells downstream of Wnt/β-catenin signaling. Treating PTPRF knockdown cells with GSK3 inhibitor rescued the expression of Wnt target genes suggesting that PTPRF functions upstream of the β-catenin destruction complex. PTPRF was found to interact with LRP6 and silencing PTPRF largely decreased the activation of LRP6. Interestingly, this PTPRF-mediated activation of Wnt signaling was blocked in cells treated with clathrin endocytosis inhibitor. Furthermore, knockdown of PTPRF inhibited xenograft tumor growth in vivo and decreased the expression of Wnt target genes. Taken together, our studies identify a novel role of PTPRF as an oncogenic protein phosphatase in supporting the activation of Wnt signaling in CRC.
Keywords: PTPRF, Wnt signaling, endocytosis, tumor organoids, colorectal cancer
INTRODUCTION
Colorectal cancer (CRC) is the second leading cause of cancer deaths with the fourth highest cancer incidence in the US [1]. The incidence and mortality rates have decreased for the past several decades in adults ≥ 50 years old but have increased in those < 50 years old where tumors are more aggressive and conventional treatment are less effective [2, 3]. This increase in incidence has been concerning making the development of novel therapeutic targets a priority.
A common pathway for CRC development through the adenoma-carcinoma sequence is the dysregulation of the Wnt signaling pathway. Wnt is named after its simultaneous discovery in Drosophila segment polarity gene Wingless and murine proto-oncogene Int-1 [4]. The Wnt signaling pathway is a highly conserved pathway known to regulate cell migration, polarity, differentiation, proliferation, embryonic development and stem cell renewal [5-7]. Commonly, dysregulation in cancer occurs through the canonical or β-catenin dependent pathway [4]. This pathway consists of Wnt ligand binding to a transmembrane complex including the Frizzled family of Wnt receptors and co-receptor LRP5/6, and subsequent activation through the formation and endocytosis of the Wnt signalosome [8]. Wnt activation leads to inhibition of the β-catenin destruction complex, which includes Axin1, adenomatous polyposis coli (APC), the Ser/Thr kinases GSK-3 and CK1, protein phosphatase 2A (PP2A), and the E3-ubiquitin ligase β-TrCP, causing accumulation of cytoplasmic β-catenin to allow for the transcriptional activation of Wnt target genes (ie AXIN2, TCF7, CCND1 and MYC) [4, 5, 9, 10]. The Wnt signaling pathway is immeasurably complex with a multitude of components being discovered that can become potential targets for therapy.
Protein tyrosine phosphatases (PTP) act in conjunction with protein tyrosine kinases to modulate a large number of signaling pathways that are important in cancer. Whereas protein kinases have been extensively evaluated as translational targets in cancer treatment [11], significant knowledge gaps exist on the role of protein phosphatases in regulating oncogenic signaling [12]. The PTP superfamily consists of 107 members that are subdivided into four classes. The class I-III PTPs are cysteine-based phosphatases that use a similar catalytic mechanism despite having different substrate specificities; while the class IV PTPs are aspartate-based phosphatases [13]. Protein tyrosine phosphatase receptor type F (PTPRF) belongs to the classical subfamily of class I PTPs with PTPRD and PTPRS as close relatives [13]. Developmental biology studies using Drosophila models have demonstrated that loss-of-function mutations of PTPRF (initially named LAR for Leukocyte Common Antigen Related) disrupt normal axon guidance of neurons [14] and inhibits planar cell polarity signaling in epithelial cells [15]. Studies of PTPRF in cancer have yielded conflicting results showing that PTPRF functions as either an oncogene or a tumor suppressor in different cancer types [16-21]. A gene expression analysis study showed that PTPRF expression is downregulated in a small numbers of adenocarcinoma samples of CRC compared to normal samples; however, no mechanistic studies have been performed [22].
In this study we determined the role of PTPRF in regulating CRC cell growth through modulation of the Wnt signaling pathway. Using primary patient derived colon cancer cells and mouse tumor organoid models, we showed that knockdown of PTPRF inhibited cell proliferation both in 2D cell culture and 3D organoids. Importantly, loss of PTPRF expression inhibited the activation of Wnt signaling in vitro and tumorigenesis in vivo. Together, results from our study identified a novel oncogenic function of PTPRF via promoting Wnt signaling upstream of the destruction complex.
RESULTS
Knockdown of PTPRF inhibits cell proliferation
To determine the functional role of PTPRF in CRC, we silenced PTPRF expression in two CRC cell lines, including HCT116 and patient-derived PT130 [23], using lentivirus-mediated RNAi with two different targeting sequences. As previously described, PTPRF consists of an extracellular domain (E-domain), a single transmembrane domain (TM) and an intracellular phosphatase domain (P-domain) (Fig 1A) [24]. The E-domain of PTPRF contains three immunoglobulin (Ig)-like and eight fibronectin type-III motifs, and a post-translational proteolytic cleavage separates the E-domain but it remains attached to the TM domain and the rest of the protein. The P-domain of PTPRF is comprised of a catalytically active D1 domain and a pseudophosphatase D2 domain [25]. The expression of PTPRF was downregulated in both stable knockdown cells as detected by two different antibodies raised against either the E-domain or the P-domain of the protein (Fig 1B). In contrast to previous studies performed in other cancer types in which PTPRF has been demonstrated to be a tumor suppressor [16, 17], we found that knockdown of PTPRF significantly decreased growth of both HCT116 and PT130 cells cultured in regular 2D growth conditions (Fig 1C) and in 3D Matrigel (Fig 1D). Collectively, these results provide the first evidence supporting that PTPRF plays a positive role in promoting cell growth and proliferation in CRC.
Figure 1. Knockdown of PTPRF inhibits cell proliferation in colon cancer cells.
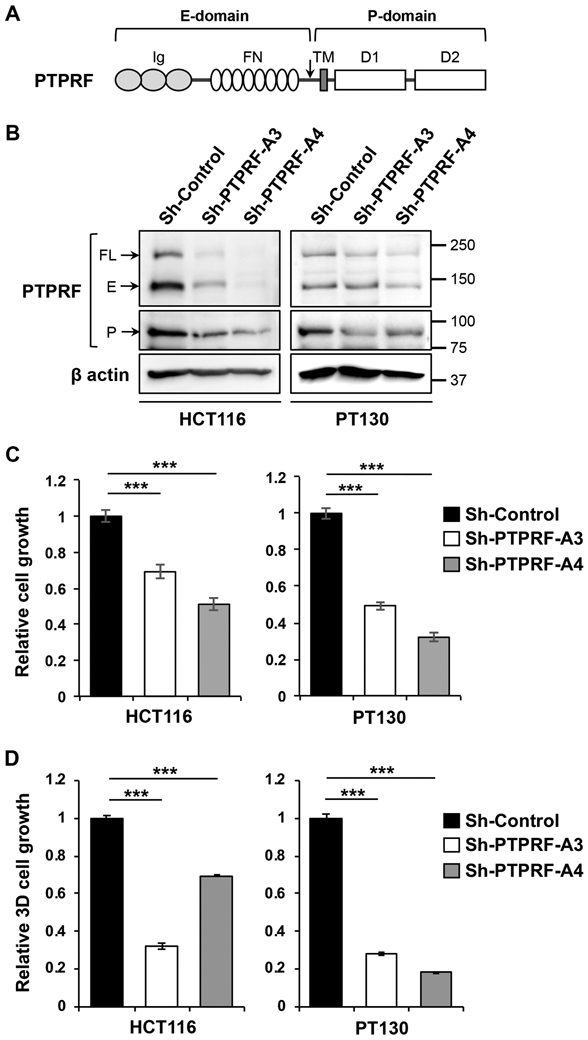
(A) A diagram showing the domain structure of PTPRF. The full-length (FL) PTPRF protein contains an extracellular domain (E-domain) consisting of three Ig-like domains and eight fibronectin (FN) domains, a single transmembrane domain, and an intracellular phosphatase domain (P-domain) consisting of a functional D1 phosphatase and a D2 pseudophosphatase domain. The arrow indicates the putative proteolytic cleavage site. (B) The expression of PTPRF was analyzed in stable control and PTPRF knockdown HCT116 and PT130 cells using Western blotting. Two different shRNA targeting sequences (A3 and A4) were used to silence PTPRF in each cell line. β-actin was used as loading controls. The FL protein and E-domain of PTPRF were detected by the anti-LAR mAb whereas the P-domain was detected by the anti-PTPRF mAb. (C) Knockdown of PTPRF decreased the growth of HCT16 and PT130 cells cultured in 2D. Equal number of control and PTPRF knockdown HCT16 and PT130 cells were allowed to grow for 3 and 5 days, respectively, and the relative cell growth was determined using crystal violet staining. Data represent the mean ± SD (n=3, *** p<0.0001). (D) Knockdown of PTPRF decreased the growth of HCT16 and PT130 cells cultured in 3D Matrigel. Equal number of control and PTPRF knockdown HCT16 and PT130 cells were seeded into 50% Matrigel and allowed to grow for 7 days. The relative cell growth was determined using Cell Titer Glo 3D Viability Assay. Data represent the mean ± SD (n=3, *** p<0.0001).
PTPRF expression suppresses colony formation in tumor organoids
We next evaluated the effect of silencing PTPRF using intestinal tumor organoids derived from Apc/Kras double mutant mice [26]. Control and PTPRF knockdown tumor organoids grown in 3D Matrigel were generated using lentiviral shRNA. Single cell suspension of Apc/Kras mouse tumor organoids were seeded in 3D Matrigel and the number of colonies (organoids) formed was determined after 6 days (Fig 2A). We found that the ability of PTPRF knockdown cells to form colonies in 3D was significantly decreased (Fig 2B). Interestingly, while a majority of control tumor cells formed spherical organoids in 3D, increasing numbers of PTPRF knockdown organoids showed branching phenotype (Fig 2C). In this tumor organoid model, branching phenotype is associated with decreased stem-like properties as measured by subsequent colony formation assays. Moreover, control and PTPRF knockdown organoids were labeled with EdU to assess the number of proliferating cells. Results showed that the relative levels of EdU positive cells were largely decreased in PTPRF knockdown organoids compared to the control group (Fig 2D). Quantitative real time PCR (RT-PCR) analysis demonstrated that the expression of Lgr5 and Ccnd1, a marker of stem cells and cell proliferation, respectively, was decreased in PTPRF knockdown tumor organoids (Fig 2E). Additionally, single cells of control and PTPRF knockdown HCT116 cells were cultured in suspension stem cell medium, a condition known to enrich tumor initiating cells [27], and numbers of spheroids (colonies) formed were counted after 6 days. We found that the numbers of spheroids formed were significantly decreased in PTPRF knockdown cells suggesting inhibition of colony formation (Supplemental Fig S1). Taken together, our results suggest that knockdown of PTPRF may decrease tumor formation.
Figure 2. Knockdown of PTPRF decreases tumor organoid formation.

(A). Single cell suspensions of control and Prprf knockdown mouse Apc/Kras tumor cells were seeded in 3D Matrigel. Representative images of control and Ptprf knockdown tumor organoids are shown after 6 days in culture. Scale bar, 100 μm. (B) The relative numbers of tumor organoids formed and (C) the percentage of organoids showed branched phenotype were quantified (total 1,000 cells were seeded per group). Data represent the mean ± SD (n=3, ** p < 0.001). (D) Stable control and Ptprf knockdown tumor organoids grown in 3D Matrigel for 3 days were labeled with EdU to mark proliferating cells. The EdU positive cells were visualized using Click-iT EdU Alexa 488. Scale bar, 50 μm. The EdU-positive cells in tumor organoids were quantified and compared between two groups. Data represents mean ± SD (** p<0.001). (E) Control and Prprf knockdown tumor organoids were subseeded and grown in 3D Matrigel for 3 days. The mRNA expression of Ptprf as well as target genes of Wnt/β-catenin [including Lgr5 and Ccnd1 (cyclin D1)] was determined using qRT-PCR. Data represent the mean ± SD (n=3, *** p<0.0001 and ** p < 0.001).
PTPRF suppression reduces Wnt signaling
Since the tumorigenesis process in CRC is largely controlled by Wnt signaling, we determined the effect of PTPRF downregulation on the expression of Wnt target genes. Results from RT-PCR analysis revealed that the levels of AXIN2, TCF7 and CCND1 were significantly decreased in both HCT116 and PT130 PTPRF knockdown cells (Fig 3A-B). Similar results were obtained in SW480 cells where silencing PTPRF decreased cell proliferation and Wnt target gene expression (Supplemental Fig S2). Moreover, we determined the effect of silencing PTPRF on the activation of Wnt signaling using TOP-Flash reporter assays in 293T cells. While stimulation with Wnt-conditioned media markedly increased TOP-Flash luciferase activity over time, silencing PTPRF prevented the activation of Wnt signaling (Fig 3C). Western blot analysis of 293T cells used for TOP-Flash assays showed ~50% reduction in active β-catenin levels in PTPRF knockdown cells (Fig 3D-E). Furthermore, we found that overexpression of PTPRF in 293T resulted in an increase in Wnt activation as measured by TOP-Flash reporter activity (Fig 3F). Consistently, the levels of active β-catenin were increased in PTPRF overexpressing cells (Fig 3G-H). Together, these results indicate that PTPRF positively regulates Wnt signaling.
Figure 3. The expression of PTPRF positively regulates Wnt signaling.

(A-B) Knockdown of PTPRF reduced the expression of Wnt target genes in HCT16 (A) and PT130 (B) cells. The relative expression of AXIN2, TCF7, CCND1 and PTPRF mRNA was determined using qRT-PCR in control and PTPRF knockdown cells. Data represent the mean ± SD (n=3, *** p<0.0001, ** p < 0.001 and * p < 0.05). (C) HEK293 cells stably expressing the TOP-Flash Firefly luciferase reporter and control Renilla luciferase expression constructs were infected with sh-PTPRF-A3 lentivirus. Cells were then treated with the Wnt3A-conditioned media and the relative luciferase reporter activities were measured after Wnt treatment for 4, 6 and 24 h. Data represent the mean ± SD (n=3, *** p<0.0001 and ** p < 0.001). (D) Western blot analysis of PTPRF, active β-catenin and total β-catenin in control and PTPRF knockdown cells used in (C). The expression of PTPRF was detected using the anti-PTPRF mAb. (E) The relative levels of active β-catenin were quantified by normalizing to actin and compared to control cells. Data represent the mean ± SD (n=3, ** p < 0.01). (F) HEK293 cells expressing the Wnt luciferase reporter as described in (C) were transfected with PTPRF. Cells were treated with the Wnt3A-conditioned medium for 6 h and the relative luciferase reporter activities were measured. Data represent the mean ± SD (n=3, *** p<0.0001). (G) Western blot analysis of PTPRF, active β-catenin and total β-catenin in control and PTPRF overexpressing cells used in (F). The expression of PTPRF was detected using the anti-PTPRF mAb. (H) The relative levels of active β-catenin were determined by normalizing to actin and compared to control cells. Data represent the mean ± SD (n=3, * p < 0.05).
PTPRF regulates Wnt signaling at the level upstream of the destruction complex
To begin elucidating the molecular mechanism by which PTPRF regulates Wnt signaling, we treated cells with a GSK3 inhibitor, CHIR99021. As a key member of the β-catenin destruction complex, GSK3β is responsible for direct phosphorylation of β-catenin for degradation [28]. Inhibition of GSK3 results in activation of β-catenin-mediated transcription of Wnt target genes circumventing the destruction complex. Indeed, treatment with CHIR99021 increased the expression of Wnt target genes, including AXIN2 and TCF7, in both HCT116 and PT130 control cells. Moreover, GSK3β inhibitor treatment largely rescued the expression of Wnt target genes in PTPRF knockdown cells (Fig 4A-B), suggesting that PTPRF functions upstream of the β-catenin destruction complex. As a control, we showed that silencing PTPRF did not alter GSK3 activity directly (Supplemental Fig S3).
Figure 4. PTPRF regulates Wnt signaling at a step upstream of the β-catenin destruction complex.
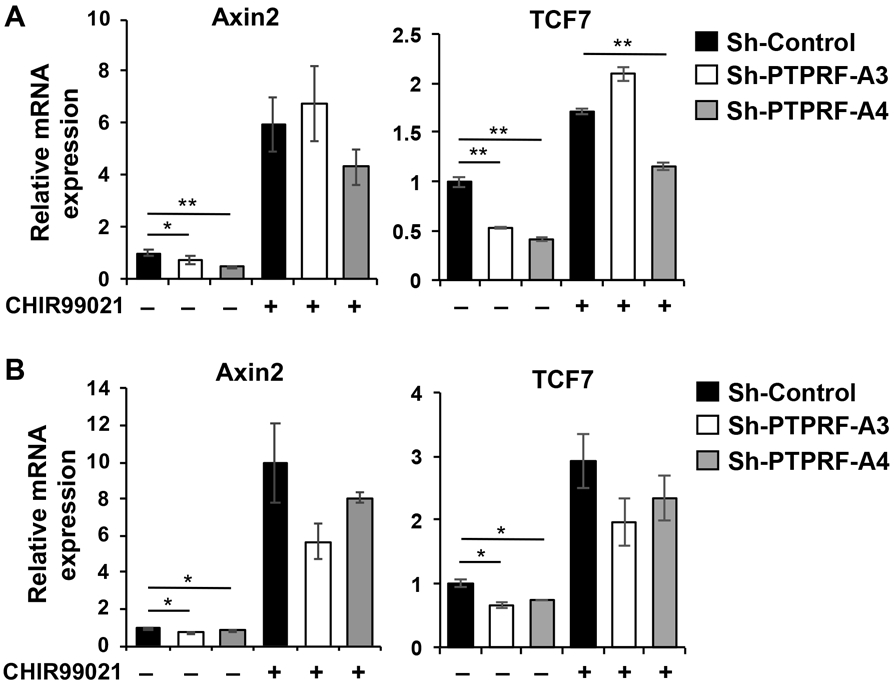
(A-B) Control and PTPRF knockdown HCT116 (A) and PT130 (B) cells were treated with DMSO or GSK3 inhibitor CHIR99021 (3 μM) for overnight. The relative expression of AXIN2 and TCF7 mRNA was determined using qRT-PCR analysis. Data represent the mean ± SD (n=3, ** p < 0.001 and * p < 0.05).
PTPRF interacts with LRP6
We next determined if PTPRF may regulate Wnt signaling at the receptor level. To this end, we evaluated the levels of phosphorylated LRP6, a Wnt co-receptor, as a readout for Wnt signaling activation in control and PTPRF knockdown cells. Results from Western blot analysis showed that when normalized to total LRP6 levels, the expression of phosphorylated LRP6 (at Ser1490) was significantly lower in PTPRF knockdown cells compared to the control in both HCT116 and PT130 cells (Fig 5A-B). Additionally, immunofluorescent staining experiments were performed to detect the cellular localization of LRP6 and PTPRF in PT130 cells. Since the antibodies for LRP6 and PTPRF were not sensitive enough to detect endogenous proteins, GFP-tagged LRP6 and RFP-tagged WT PTPRF were either expressed alone or co-expressed in PT130 cells. As shown in Fig 5C, the expression of PTPRF-RFP and LRP6-GFP was detected at the cell membrane as well as intracellular vesicles when expressed alone, although relatively higher levels of LRP6-GFP at the plasma membrane were observed compared to PTPRF-RFP. Moreover, the colocalization of PTPRF-RFP and LRP6-GFP was readily detected in cells co-expressing both proteins (Fig 5D and Supplemental Fig S4). Quantitative analysis revealed that the average Pearson’s coefficient for PTPRF and LRP6 colocalization was 0.68. Interestingly, increasing localization of LRP6-GFP in large intracellular vesicles was observed in cells co-expressing PTPRF-RFP; however, the presence of LRP-GFP did not change the localization pattern of PTPRF-RFP.
Figure 5. PTPRF interacts with LRP6.

(A) Knockdown of PTPRF reduced the phosphorylation of LRP6 in HCT16 and PT130 cells. Cell lysates prepared from control and PTPRF knockdown cells were analyzed for the phosphorylation of LRP6 as well as the expression of total LRP6, PTPRF and tubulin. (B) The levels of LRP6 phosphorylation were quantified by normalizing to total LRP6. Data represent the mean ± SD (n=3, ** p < 0.001 and * p < 0.05). (C) PT130 cells transfected with PTPRF-RFP or LRP6-GFP expression plasmid alone were fixed and visualized using confocal microscopy. Scale bar, 10 μm. (D) PT130 cells co-transfected with PTPRF-RFP and LRP6-GFP were fixed and visualized using confocal microscopy. Scale bar, 10 μm. Quantitative analysis of PTPRF and LRP6 colocalization revealed that the average Pearson’s coefficient is 0.68 ± 0.14 (mean ± SD, n=5).
To confirm that PTPRF regulates Wnt signaling at the receptor level, TOP-Flash Wnt reporter activity assays were performed in 293T cells transfected with either vector or Flag-PTPRF and subsequently treated with Pitstop 2 clathrin endocytosis inhibitor. Similar as shown in Fig. 3E, overexpression of PTPRF increased Wnt reporter activity; however, this effect was largely inhibited by treating cells with Pitstop 2, suggesting that PTPRF-mediated activation of Wnt signaling requires the endocytic pathway (Fig 6A). Moreover, similar experiments were performed in HCT116 cells using the TOP-Flash reporter. We found that PTPRF-induced Wnt activation was effectively blocked by the treatment with Pitstop 2 (Fig 6C). The overexpression of PTPRF protein was confirmed in these cells using Western blot analysis (Fig 6B and 6D).
Figure 6. PTPRF-mediated activation of Wnt signaling requires clathrin-dependent endocytosis.

(A) HEK293 cells expressing the Wnt luciferase reporter were transfected with vector or WT PTPRF. The cells were stimulated with Wnt-conditioned media in the presence or absence of Pitstop 2 (20 μM) for 6 h and the relative luciferase reporter activities were measured. Data represent the mean ± SEM (n=3, ** p < 0.01). (B) The cells used for TOP-Flash reporter assays were analyzed for the expression of PTPRF. The full-length and E-domain of PTPRF was detected by the LAR antibody. (C) HCT116 cells were transfected with vector or WT PTPRF along with TOP-Flash reporter and Renilla control plasmids as indicated. The cells were treated with Wnt-condition media in the presence or absence of Pitstop 2 (20 μM) for 6 h and the relative luciferase reporter activities were measured. Data represent the mean ± SEM (n=3, ** p < 0.01). (D) HCT116 lysates from the reporter assay were analyzed for the expression of PTPRF. The full-length and E-domain of PTPRF was detected by the LAR antibody. (E) The GSEA was performed using the TCGA Colon Adenocarcinoma (COAD) RNA-seq dataset to identify gene sets in the KEGG collections that have positive correlations with PTPRF expression. Enrichment plots showed significant correlation of colorectal cancer (NES = 1.68, FDR q-val = 0.015), the Wnt signaling pathway (NES = 1.57, FDR q-val = 0.031) and the axon guidance pathway (NES = 2.39, FDR q-val = 0.000) with PTPRF expression in colon cancer patients.
Furthermore, we determined if PTPRF expression is associated with cancer-related pathways by analyzing gene expression data from the Cancer Genome Atlas (TCGA) colon cancer RNA-seq dataset. Results from the GSEA revealed that PTPRF expression is positively associated with CRC and Wnt signaling pathway (Fig 6E). As a control, the expression of PTPRF was also found to positively correlate with the axon guidance pathway, a previous known function of PTPRF. These data support our findings that PTPRF functions to promote tumorigenesis in colon cancer by promoting signaling through the Wnt pathway. Other pathways associated with PTPRF expression are shown in Supplemental Table S1. To better understand the role of PTPRF in colon cancer cells, we performed RNA-seq analysis in control and PTPRF knockdown PT130 cells. Results from the GSEA showed that PTPRF regulates a number of oncogenic signaling pathways (Supplemental Table S2). Interestingly, the endocytosis pathway and colorectal cancer were also found to be positively enriched with PTPRF whereas the DNA replication and cell proliferation related processes were negatively enriched (Supplemental Table S2). Together, results from these bioinformatic analyses are consistent with the notion that PTPRF expression enhances Wnt and other oncogenic signaling and knockdown of PTPRF inhibits cell proliferation.
Downregulation of PTPRF decreases in vivo tumor growth
Given the importance of Wnt signaling in sustaining tumor growth, we investigated the functional effects of PTPRF knockdown in regulating tumorigenesis in vivo. Control and PTPRF knockdown HCT116 cells were subcutaneously injected into NSG mice and tumor size was measured 3 times per week for a total of 6 weeks. We found that silencing PTPRF significantly reduced the rate of tumor growth over the follow-up period (Fig 7A) and the average weight of tumors derived from PTPRF knockdown cells was nearly three times smaller than of the control tumors (Fig 7B). Consistently, the level of phosphorylated LRP6 was significantly lower in PTPRF knockdown tumors (Fig 7C-D). Similar to our in vitro experiments, results from RT-PCR analysis of tumor tissues revealed that the expression of AXIN2, TCF7, CCND1 and Ki67 was decreased indicating decreased Wnt signaling and cell proliferation (Fig 7E). To support the potential oncogenic function of PTPRF, we analyzed the COSMIC database for altered expression of PTPRF gene in human cancers. Consistently, upregulation of PTPRF gene was commonly detected in various cancer types (between 3-12% of patient samples) whereas downregulation of PTPRF was relatively rare (Supplemental Table S3).
Figure 7. Knockdown of PTPRF inhibits xenograft tumor growth and Wnt signaling.

(A) Control and PTPRF knockdown HCT116 cells were injected subcutaneously into NSG mice. The size of the tumors was measured every 3-5 days starting at one week after injection. Data represent the mean ± SEM (n=6, for sh-control group; and n=10 for sh-PTPRF group, *** p < 0.0001). (B) At the end of the 6-week experiment, tumors were excised and weighted. Data represent the mean ± SEM (*** p < 0.0001). (C) Tumor tissues from 4 mice in the sh-control group and 6 mice in the sh-PTPRF group were analyzed for the levels of PTPRF, p-LRP6 and total LRP6 using Western blotting. (D) The relative PTPRF expression and LRP6 phosphorylation were quantified by normalizing levels of PTPRF and p-LRP6 to that of tubulin and total LRP6, respectively. Data represent the mean ± SD (* p < 0.05). (E) Tumor tissues from 4 mice in the sh-control group and 6 mice in the sh-PTPRF group were analyzed for the expression of Axin2, TCF7, CCND1, MKI67 (Ki67) and PTPRF using qRT-PCR. Data represent the mean ± SEM (*** p<0.0001, ** p < 0.001 and * p < 0.05).
In summary, we demonstrated that downregulation of PTPRF leads to decreased cell proliferation and colony formation in colon cancer cells and 3D tumor organoids. In addition, xenograft tumorigenesis experiments showed that silencing PTPRF expression inhibits tumor growth in vivo.
DISCUSSION
Hyperactivation of Wnt signaling drives tumorigenesis in CRC. Continuous efforts have been focused on determining mechanisms involved in the regulation of Wnt signaling to support tumor initiation, progression and cancer stem cell properties. In this study, we investigated the role of PTPRF, a receptor type PTP, in promoting cell proliferation and tumorigenesis by regulating Wnt activation. While the majority of previous studies define the role of PTPRF through the differential expression of PTPRF mRNA or protein in tumors compared to normal tissue, the underlying mechanisms of postulated PTPRF function in cancer remain largely unknown. Results from our study identified PTPRF as a novel positive regulator that functions upstream of the destruction complex to enhance Wnt signaling in colon cancer cells. Consistent with the role of PTPRF in promoting Wnt signaling, it has been shown previously that double knockout of PTPRF and closely related PTPRS in mice resulted in craniofacial malformations during embryonic development, a hallmark of Wnt signaling deficiency [29].
Although it has long been postulated that signaling events upstream of the destruction complex have limited impact on activating the Wnt pathway in cancer cells with APC or β-catenin mutations, recent studies have indicated that Wnt ligands produced by cancer cells play an important role in sustaining canonical Wnt signaling via a receptor-mediated autocrine mechanism [30]. Increasing evidence suggests that a gradient of Wnt signaling is required to regulate distinct cell functions even in tumors with APC or β-catenin mutations [31, 32]. Given the notion that highest levels of Wnt signaling activation are required to maintain cancer stem cell properties [33, 34], it is attractive to speculate that Wnt-dependent stimulation upstream of the destruction complex is needed to maintain the cancer stem cell population. Previous studies have implicated both caveolin- and clathrin-dependent endocytic pathways in facilitating Wnt-stimulated internalization of LRP6 and the formation of signalosomes [35-38]. Notably, the requirement for clathrin-mediated endocytosis has been shown to promote the activation of Wnt signaling in cells with APC mutations [36]. Consistently, we found in our study that PTPRF colocalizes with LRP6 at the plasma membrane and intracellular vesicles and inhibition of clathrin-mediated endocytosis attenuates PTPRF’s effect on activating Wnt signaling. Moreover, results from our RNA-seq analysis suggested that altered PTPRF expression affects pathways involved in endocytosis, endosomal sorting and cytoskeletal rearrangement in addition to its effects on regulating cell proliferation and oncogenic signaling pathways (Supplemental Table S2). However, future studies are needed to address if PTPRF regulates the formation of LRP6-containing signalosomes via an endocytosis-dependent mechanism. Interestingly, the involvement of PTPRF in regulating vesicle trafficking has recently been demonstrated in the recycling of integrin α5β1 and secretion of fibronectin in endothelial cells [39].
Previous gene expression analysis of PTPRF in different cancer types has yielded seemly contradictory conclusions depending on the cancer type. For example, studies in breast, gastric and liver cancer have suggested that PTPRF may serve as a tumor suppressor [16, 20, 40]; however, an oncogenic role of PTPRF has also been implicated in breast, prostate, thyroid and non-small cell lung cancer [18, 41-44]. Currently, the mechanisms by which PTPRF regulates cancer phenotypes remain largely unknown. Given the notion that protein phosphatases commonly control multiple different substrates, it is likely that specific effects associated with altered PTPRF expression may depend on the predominant oncogenic pathways important for that particular cancer type. For example, it has been shown that silencing PTPRF expression promotes cell proliferation and tumor development as a result of increased SRC phosphorylation and activity in hepatocellular carcinoma [20]. However, we did not observe any changes in SRC phosphorylation in PTPRF knockdown CRC cells used in our study. In addition, we found that the expression of PTPRD and PTPRS, two closely related members in the PTPRF subfamily, may become upregulated in PTPRF knockdown cells. Both PTPRD and PTPRS have consistently been identified as tumor suppressors in various cancer types. Thus, the compensatory effect among PTPRF subfamily members may add another layer of complexity to the cell-type and cell-context dependent differences in PTPRF functions. Results from our study identify a functional connection between PTPRF and LRP6 in positively regulating Wnt signaling, thus supporting a tumor prompting role of PTPRF in CRC. However, more studies are needed to further determine the molecular mechanisms by which PTPRF regulates Wnt signaling through LRP6 activation and whether PTPRF functions differently in CRC cells with different mutation background. Given the importance of Wnt signaling in CRC, the identification of PTPRF as a novel oncogenic protein may lead to future translational applications targeting PTPRF.
MATERIALS AND METHODS
Cells and reagents
Primary colon cancer PT130 cells were established from patient-derived xenografts (PDX) as described previously [23, 26]. Mutational analysis showed that PT130 cells carry mutations in BRAF, TP53 and FBXW7 (but no mutations in APC or CTNNB1 gene). Human colon cancer HCT116 and SW480 cells, Wnt3A producing L cells and control L cells were purchased from ATCC. Human colon cancer cell lines were authenticated using short tandem repeat (STR) DNA profiling and tested negative for mycoplasma using PCR in March 2016 (Genetica, OH, USA). Cells were cultured in DMEM (PT130 and L cells) or McCoy’s 5A medium (HCT116) supplemented with 10% fetal bovine serum (FBS, Sigma-Aldrich) and 1% penicillin-streptomycin. Stable PTPRF knockdown cells were generated using lentivirus-mediated RNAi and puromycin selection as described previously [45-47]. The shRNA targeting sequences for human PTPRF are as the following: 5’-CTTTACCCTTACTGGCCTCAA-3’ (A3) and 5’- GCGATCACAGAGGAACTACAT-3’ (A4); and for mouse Ptprf: 5’-CCACCAGTGTTACTCTGACAT-3’. CHIR99021 and Pitstop 2 were obtained from Sigma-Aldrich.
The pCS-hLRP6-GFP construct was generously provided by Dr. Christof Niehrs (Institute of Molecular Biology, Germany) [48]. The pCMV6-XL5-hPTPRF (SC128009) and pCMV6-mPTPRF-Myc/Flag (MR222818) expression constructs were purchased from Origene. To construct RFP-tagged PTPRF, a monomeric RFP was fused in-frame to the C-terminus of full-length PTPRF and cloned into pcDNA3 vector.
Cell proliferation assay
Control and PTPRF knockdown colon cancer cells were seeded into 12-well plates (25,000 cells /well) and cultured in regular growth medium for 3-5 days. At the end of the experiments, cells were fixed and stained with 0.5% crystal violet in 20% methanol. The stained cells were dissolved in 1% SDS and absorbance at 570 nm was determined as described previously [26, 45]. For 3D cell growth, control and PTPRF knockdown cells were seeded into 12-well plates (30,000 cells/well) in 50% Matrigel and cultured in regular growth medium for 7 days. The relative cell growth was determined using the CellTiter-Glo 3D viability assay (Promega).
Tumor organoids derived from Apc/Kras double mutant mice was generated and described previously [23, 26]. To generate stable control and Ptprf knockdown organoids, tumor organoids were dissociated into small cell clusters using TrypLE (Thermo) and incubated with sh-control or sh-Ptprf lentivirus in suspension. Cells were subsequently embedded in Matrigel in 3D growth medium (Advanced DMEM/F12 supplemented with 1×Glutamax, 1×N-2, 1×B-27, 1 mM N-Acetyl-L-cysteine and 1% penicillin/streptomycin), and puromycin was used to select for stable knockdown cells. To detect proliferating cells in tumor organoids, control and Ptprf knockdown Apc/Kras mouse tumor organoids were seeded into Matrigel and allowed to grow for 3 days until small organoids formed. The organoids grown in 3D were incubated with 5-ethynyl-2’-deoxyuridine (EdU) for 1 h prior to fixation. The EdU positive cells were stained using Click-iT EdU Alexa Fluor 488 Imaging Kit (Thermo). The organoids were washed with PBS and resuspended in DAPI-mounting media. Images were taken using a Nikon A1+ confocal microscope.
In vitro colony formation assay
For colony formation assays, control and Ptprf knockdown Apc/Kras tumor organoids were dissociated and single cell suspensions were subseeded into 3D Matrigel. The number of tumor organoids formed after 6 days were counted and analyzed. For gene expression analysis, tumor organoids were cultured in 3D Matrigel for 3-4 days and collected for RT-PCR.
For colony formation using HCT116 cells, 1,000 single cell suspensions of control and PTPRF knockdown cells were seeded in non-adherent 24-well plates in StemPro hESC SFM medium supplied with 1% GlutaMAX, 2% StemPro hESC supplement, 1.8% BSA, 8 ng/mL FGF-basic and 0.1 mM 2-mercaptoethanol (Thermo). After six days in culture, numbers of spheroids were counted under a light microscope.
Western blot analysis
Colon cancer cells or tumor tissues were collected and detergent-solubilized cell lysates were obtained as described previously [23, 26, 47]. Equal amounts of total protein lysates were resolved by SDS-PAGE and subjected to Western blot analysis. The following antibodies, including phospho-LRP6 (p-LRP6, Ser1490 site, #2568), total LRP6 (#2560), active-β-catenin (#8814), total β-catenin (#8480), phospho-GSK3α/β (Ser21/9, #9331) and total GSK3α/β (#5676) antibodies were purchased from Cell Signaling; the LAR monoclonal antibody (against the E-domain of PTPRF, sc-135969) was from Santa Cruz; PTPRF (against the P-domain of PTPRF, MABN604), γ-tubulin (T6557) and β-actin (A1978) antibodies were from Sigma-Aldrich.
Quantitative RT-PCR
To measure relative gene expression by RT-PCR, total RNA was isolated from human cancer cells, mouse tumor organoids, or xenograft tumor tissues using the RNeasy Mini kit (Qiagen). Equal amounts of RNA were used as templates for the synthesis of cDNA using the High Capacity cDNA Reverse Transcription kit (Thermo). The resulting cDNA templates were placed into a 96 well plate with SYBR Green Master Mix (Qiagen) and primers listed in Supplemental Table S4. The RT-PCR assays were performed using StepOnePlus RT-PCR system (Thermo). All values were normalized to the level of β-actin.
Wnt reporter assay
Stable HEK293 Wnt reporter cells co-expressing p8xTOPFlash firefly and control Renilla luciferase plasmids were generated as described previously [49] and provided by Dr. Wei Chen (Duke University). The cells were infected with control or sh-PTPRF lentivirus and subsequently treated with Wnt3A-conditioned media for 4, 6, and 24 h as indicated. Alternatively, the cells were transfected with PTPRF expression plasmids and treated with Wnt3A-conditioned media for 8 h. The TOP-Flash activity was measured using the Dual-Luciferase Reporter Assay System (Promega). The relative Wnt activation was expressed as fold changes over untreated control cells and normalized to control cells.
Immunofluorescence staining
PT130 cells transfected with LRP6-GFP and PTPRF-RFP alone or in combination were seeded onto glass coverslips. The cells were fixed in 4% paraformaldehyde for 15 minutes and mounted in DAPI-mounting media. Images were taken using a Nikon A1+ confocal microscope. Pearson’s colocalization coefficient was determined using Nikon NIS-elements software.
RNA sequencing (RNA-seq) analysis
To generate RNA expression profiles of control and PTPRF knockdown (sh-PTPRF-A3) PT130 cells, total RNA was isolated using RNeasy mini kit (Qiagen) and treated with DNAse (Thermo). Sequencing libraries were generated and sequencing performed by BGI Genomics. For the differential expression analysis, HTSeq was used to count gene expression level and DESeq2 was used to identify differentially expressed genes (fold change > 2) between the sh-PTPRF and control group. The mRNA expression data were subjected to the Gene Set Enrichment Analysis (GSEA) as described below to identify significantly enriched pathways.
In vivo xenograft tumor model
All animal procedures were done using protocols approved by the University of Kentucky Animal Care and Use Committee. Six to eight week-old NOD.Cg-Prkdcscid Il2rgtm1Wjl/SzJ (NSG, The Jackson Laboratory) mice were used. Control and sh-PTPRF-A3 HCT116 cells grown in regular growth medium were trypsinized. Total 1 × 10⁶ cells were re-suspended in 5% Matrigel/DMEM at a final volume of 100 μl and inoculated subcutaneously. Total six and ten mice were included in the control and sh-PTPRF group, respectively. The tumor size was measured with a digital caliper starting at 1 week after injection, and the measurements were repeated at week 2 and increased in frequency to 3 times per week thereafter. The tumor volume was defined as (longest diameter) × (shortest diameter)2/2. At the end of 5 weeks, tumors were harvested and subjected to mRNA and protein analysis.
Statistical Analysis
In experiments to assess relative cell growth, EdU labeling, mRNA expression, colony formation and Wnt reporter activities, results were summarized using bar graphs and pairwise comparisons between different conditions were carried out using two-sample t-tests. A linear mixed model was employed to compare slope of tumor volume growth curves over time between groups. For the quantitative protein and mRNA expression analysis in xenograft tumors, represent average of 4 tumors in the control and 6 tumors in the sh-PTPRF group. All other experiments were repeated three times and results shown represent the average of three experiments.
For the Gene Set Enrichment Analysis (GSEA), the RNA-seq dataset from the TCGA Colon Adenocarcinoma (COAD) study were used and correlations between expressions of PTPRF and other genes were quantified by Spearman’s correlation coefficient. The genes were then ordered from highest to lowest based on the correlation coefficient. For RNA-seq data obtained from control and sh-PTPRF cells, the fold change of each gene and p-value were used to create the ranked file list. The ranked list was inputted into the GSEA Desktop Application [50] to identify pathways that are associated with PTPRF expression in colon cancer or differentially enriched in PTPRF knockdown cells.
Supplementary Material
Acknowledgements
This work was supported by funding grants R01CA133429 (TG), R01CA208343 (BME and TG), T32CA160003 (BME) and F31CA196219 (PDS). This material is based upon work supported by the National Science Foundation Graduate Research Fellowship Award (#1839289). The studies were conducted with support provided by the Biospecimen Procurement and Translational Pathology and Biostatistics and Bioinformatics Shared Resource Facilities of the University of Kentucky Markey Cancer Center (P30CA177558) at the University of Kentucky.
Footnotes
Conflict of interest
The authors declare that they have no conflict of interest.
REFERENCES:
- 1.Siegel RL, Miller KD, Jemal A. Cancer Statistics, 2017. CA Cancer J Clin 2017; 67: 7–30. [DOI] [PubMed] [Google Scholar]
- 2.Smith RA, Andrews KS, Brooks D, Fedewa SA, Manassaram-Baptiste D, Saslow D et al. Cancer screening in the United States, 2018: A review of current American Cancer Society guidelines and current issues in cancer screening. CA: a cancer journal for clinicians 2018; 68: 297–316. [DOI] [PubMed] [Google Scholar]
- 3.O'Connell JB, Maggard MA, Livingston EH, Yo CK. Colorectal cancer in the young. American journal of surgery 2004; 187: 343–348. [DOI] [PubMed] [Google Scholar]
- 4.Reya T, Clevers H. Wnt signalling in stem cells and cancer. Nature 2005; 434: 843–850. [DOI] [PubMed] [Google Scholar]
- 5.Schatoff EM, Leach BI, Dow LE. Wnt Signaling and Colorectal Cancer. Current colorectal cancer reports 2017; 13: 101–110. [DOI] [PMC free article] [PubMed] [Google Scholar]
- 6.Niehrs C. The complex world of WNT receptor signalling. Nat Rev Mol Cell Biol 2012; 13: 767–779. [DOI] [PubMed] [Google Scholar]
- 7.Clevers H. Wnt/beta-catenin signaling in development and disease. Cell 2006; 127: 469–480. [DOI] [PubMed] [Google Scholar]
- 8.Nusse R, Clevers H. Wnt/beta-Catenin Signaling, Disease, and Emerging Therapeutic Modalities. Cell 2017; 169: 985–999. [DOI] [PubMed] [Google Scholar]
- 9.Komiya Y, Habas R. Wnt signal transduction pathways. Organogenesis 2008; 4: 68–75. [DOI] [PMC free article] [PubMed] [Google Scholar]
- 10.Stamos JL, Weis WI. The beta-catenin destruction complex. Cold Spring Harb Perspect Biol 2013; 5: a007898. [DOI] [PMC free article] [PubMed] [Google Scholar]
- 11.Julien SG, Dube N, Hardy S, Tremblay ML. Inside the human cancer tyrosine phosphatome. Nature reviews Cancer 2011; 11: 35–49. [DOI] [PubMed] [Google Scholar]
- 12.Virshup DM, Shenolikar S. From promiscuity to precision: protein phosphatases get a makeover. Mol Cell 2009; 33: 537–545. [DOI] [PubMed] [Google Scholar]
- 13.Alonso A, Sasin J, Bottini N, Friedberg I, Friedberg I, Osterman A et al. Protein tyrosine phosphatases in the human genome. Cell 2004; 117: 699–711. [DOI] [PubMed] [Google Scholar]
- 14.Johnson KG, Van Vactor D. Receptor protein tyrosine phosphatases in nervous system development. Physiol Rev 2003; 83: 1–24. [DOI] [PubMed] [Google Scholar]
- 15.Barlan K, Cetera M, Horne-Badovinac S. Fat2 and Lar Define a Basally Localized Planar Signaling System Controlling Collective Cell Migration. Dev Cell 2017; 40: 467–477 e465. [DOI] [PMC free article] [PubMed] [Google Scholar]
- 16.Du WW, Fang L, Li M, Yang X, Liang Y, Peng C et al. MicroRNA miR-24 enhances tumor invasion and metastasis by targeting PTPN9 and PTPRF to promote EGF signaling. J Cell Sci 2013; 126: 1440–1453. [DOI] [PubMed] [Google Scholar]
- 17.Nunes-Xavier CE, Martin-Perez J, Elson A, Pulido R. Protein tyrosine phosphatases as novel targets in breast cancer therapy. Biochim Biophys Acta 2013; 1836: 211–226. [DOI] [PubMed] [Google Scholar]
- 18.Levea CM, McGary CT, Symons JR, Mooney RA. PTP LAR expression compared to prognostic indices in metastatic and non-metastatic breast cancer. Breast cancer research and treatment 2000; 64: 221–228. [DOI] [PubMed] [Google Scholar]
- 19.Wang Z, Shen D, Parsons DW, Bardelli A, Sager J, Szabo S et al. Mutational analysis of the tyrosine phosphatome in colorectal cancers. Science (New York, NY) 2004; 304: 1164–1166. [DOI] [PubMed] [Google Scholar]
- 20.Bera R, Chiou CY, Yu MC, Peng JM, He CR, Hsu CY et al. Functional genomics identified a novel protein tyrosine phosphatase receptor type F-mediated growth inhibition in hepatocarcinogenesis. Hepatology (Baltimore, Md) 2014; 59: 2238–2250. [DOI] [PubMed] [Google Scholar]
- 21.DaSilva JO, Amorino GP, Casarez EV, Pemberton B, Parsons SJ. Neuroendocrine-derived peptides promote prostate cancer cell survival through activation of IGF-1R signaling. The Prostate 2013; 73: 801–812. [DOI] [PMC free article] [PubMed] [Google Scholar]
- 22.Bujko M, Kober P, Mikula M, Ligaj M, Ostrowski J, Siedlecki JA. Expression changes of cell-cell adhesion-related genes in colorectal tumors. Oncol Lett 2015; 9: 2463–2470. [DOI] [PMC free article] [PubMed] [Google Scholar]
- 23.Wen YA, Xiong X, Zaytseva YY, Napier DL, Vallee E, Li AT et al. Downregulation of SREBP inhibits tumor growth and initiation by altering cellular metabolism in colon cancer. Cell death & disease 2018; 9: 265. [DOI] [PMC free article] [PubMed] [Google Scholar]
- 24.Streuli M, Krueger NX, Ariniello PD, Tang M, Munro JM, Blattler WA et al. Expression of the receptor-linked protein tyrosine phosphatase LAR: proteolytic cleavage and shedding of the CAM-like extracellular region. The EMBO journal 1992; 11: 897–907. [DOI] [PMC free article] [PubMed] [Google Scholar]
- 25.Barr AJ, Ugochukwu E, Lee WH, King ON, Filippakopoulos P, Alfano I et al. Large-scale structural analysis of the classical human protein tyrosine phosphatome. Cell 2009; 136: 352–363. [DOI] [PMC free article] [PubMed] [Google Scholar]
- 26.Wen YA, Xiong X, Harris JW, Zaytseva YY, Mitov MI, Napier DL et al. Adipocytes activate mitochondrial fatty acid oxidation and autophagy to promote tumor growth in colon cancer. Cell death & disease 2017; 8: e2593. [DOI] [PMC free article] [PubMed] [Google Scholar]
- 27.Kreso A, van Galen P, Pedley NM, Lima-Fernandes E, Frelin C, Davis T et al. Self-renewal as a therapeutic target in human colorectal cancer. Nat Med 2014; 20: 29–36. [DOI] [PubMed] [Google Scholar]
- 28.Wu D, Pan W. GSK3: a multifaceted kinase in Wnt signaling. Trends in biochemical sciences 2010; 35: 161–168. [DOI] [PMC free article] [PubMed] [Google Scholar]
- 29.Stewart K, Uetani N, Hendriks W, Tremblay ML, Bouchard M. Inactivation of LAR family phosphatase genes Ptprs and Ptprf causes craniofacial malformations resembling Pierre-Robin sequence. Development (Cambridge, England) 2013; 140: 3413–3422. [DOI] [PubMed] [Google Scholar]
- 30.Voloshanenko O, Erdmann G, Dubash TD, Augustin I, Metzig M, Moffa G et al. Wnt secretion is required to maintain high levels of Wnt activity in colon cancer cells. Nat Commun 2013; 4: 2610. [DOI] [PMC free article] [PubMed] [Google Scholar]
- 31.Flanagan DJ, Vincan E, Phesse TJ. Wnt Signaling in Cancer: Not a Binary ON:OFF Switch. Cancer Res 2019; 79: 5901–5906. [DOI] [PMC free article] [PubMed] [Google Scholar]
- 32.Flanagan DJ, Barker N, Costanzo NSD, Mason EA, Gurney A, Meniel VS et al. Frizzled-7 Is Required for Wnt Signaling in Gastric Tumors with and Without Apc Mutations. Cancer Res 2019; 79: 970–981. [DOI] [PubMed] [Google Scholar]
- 33.Vermeulen L, Morrissey E, van der Heijden M, Nicholson AM, Sottoriva A, Buczacki S et al. Defining stem cell dynamics in models of intestinal tumor initiation. Science 2013; 342: 995–998. [DOI] [PubMed] [Google Scholar]
- 34.Vermeulen L, De Sousa EMF, van der Heijden M, Cameron K, de Jong JH, Borovski T et al. Wnt activity defines colon cancer stem cells and is regulated by the microenvironment. Nat Cell Biol 2010; 12: 468–476. [DOI] [PubMed] [Google Scholar]
- 35.Yamamoto H, Komekado H, Kikuchi A. Caveolin is necessary for Wnt-3a-dependent internalization of LRP6 and accumulation of beta-catenin. Dev Cell 2006; 11: 213–223. [DOI] [PubMed] [Google Scholar]
- 36.Saito-Diaz K, Benchabane H, Tiwari A, Tian A, Li B, Thompson JJ et al. APC Inhibits Ligand-Independent Wnt Signaling by the Clathrin Endocytic Pathway. Dev Cell 2018; 44: 566–581 e568. [DOI] [PMC free article] [PubMed] [Google Scholar]
- 37.Kim I, Pan W, Jones SA, Zhang Y, Zhuang X, Wu D. Clathrin and AP2 are required for PtdIns(4,5)P2-mediated formation of LRP6 signalosomes. J Cell Biol 2013; 200: 419–428. [DOI] [PMC free article] [PubMed] [Google Scholar]
- 38.Hagemann AI, Kurz J, Kauffeld S, Chen Q, Reeves PM, Weber S et al. In vivo analysis of formation and endocytosis of the Wnt/beta-catenin signaling complex in zebrafish embryos. J Cell Sci 2014; 127: 3970–3982. [DOI] [PMC free article] [PubMed] [Google Scholar]
- 39.Mana G, Clapero F, Panieri E, Panero V, Bottcher RT, Tseng HY et al. PPFIA1 drives active alpha5beta1 integrin recycling and controls fibronectin fibrillogenesis and vascular morphogenesis. Nat Commun 2016; 7: 13546. [DOI] [PMC free article] [PubMed] [Google Scholar]
- 40.Tian X, Yang C, Yang L, Sun Q, Liu N. PTPRF as a novel tumor suppressor through deactivation of ERK1/2 signaling in gastric adenocarcinoma. Onco Targets Ther 2018; 11: 7795–7803. [DOI] [PMC free article] [PubMed] [Google Scholar]
- 41.Harder KW, Saw J, Miki N, Jirik F. Coexisting amplifications of the chromosome 1p32 genes (PTPRF and MYCL1) encoding protein tyrosine phosphatase LAR and L-myc in a small cell lung cancer line. Genomics 1995; 27: 552–553. [DOI] [PubMed] [Google Scholar]
- 42.Yang T, Zhang JS, Massa SM, Han X, Longo FM. Leukocyte common antigen-related tyrosine phosphatase receptor: increased expression and neuronal-type splicing in breast cancer cells and tissue. Molecular carcinogenesis 1999; 25: 139–149. [PubMed] [Google Scholar]
- 43.Konishi N, Tsujikawa K, Yamamoto H, Ishida E, Nakamura M, Shimada K et al. Overexpression of leucocyte common antigen (LAR) P-subunit in thyroid carcinomas. British journal of cancer 2003; 88: 1223–1228. [DOI] [PMC free article] [PubMed] [Google Scholar]
- 44.Soulieres D, Hirsch FR, Shepherd FA, Bordogna W, Delmar P, Shames DS et al. PTPRF Expression as a Potential Prognostic/Predictive Marker for Treatment with Erlotinib in Non-Small-Cell Lung Cancer. J Thorac Oncol 2015; 10: 1364–1369. [DOI] [PubMed] [Google Scholar]
- 45.Liu J, Weiss HL, Rychahou P, Jackson LN, Evers BM, Gao T. Loss of PHLPP expression in colon cancer: role in proliferation and tumorigenesis. Oncogene 2009; 28: 994–1004. [DOI] [PMC free article] [PubMed] [Google Scholar]
- 46.Li X, Stevens PD, Liu J, Yang H, Wang W, Wang C et al. PHLPP is a negative regulator of RAF1, which reduces colorectal cancer cell motility and prevents tumor progression in mice. Gastroenterology 2014; 146: 1301–1312 e1301-1310. [DOI] [PMC free article] [PubMed] [Google Scholar]
- 47.Stevens PD, Wen YA, Xiong X, Zaytseva YY, Li AT, Wang C et al. Erbin Suppresses KSR1-Mediated RAS/RAF Signaling and Tumorigenesis in Colorectal Cancer. Cancer Res 2018; 78: 4839–4852. [DOI] [PMC free article] [PubMed] [Google Scholar]
- 48.Mao B, Wu W, Davidson G, Marhold J, Li M, Mechler BM et al. Kremen proteins are Dickkopf receptors that regulate Wnt/beta-catenin signalling. Nature 2002; 417: 664–667. [DOI] [PubMed] [Google Scholar]
- 49.Chen M, Wang J, Lu J, Bond MC, Ren XR, Lyerly HK et al. The anti-helminthic niclosamide inhibits Wnt/Frizzled1 signaling. Biochemistry 2009; 48: 10267–10274. [DOI] [PMC free article] [PubMed] [Google Scholar]
- 50.Subramanian A, Tamayo P, Mootha VK, Mukherjee S, Ebert BL, Gillette MA et al. Gene set enrichment analysis: a knowledge-based approach for interpreting genome-wide expression profiles. Proc Natl Acad Sci U S A 2005; 102: 15545–15550. [DOI] [PMC free article] [PubMed] [Google Scholar]
Associated Data
This section collects any data citations, data availability statements, or supplementary materials included in this article.