

Among early‐stage non‐small‐cell lung cancer (NSCLC) patients, cg05293407TRIM27 was significantly and exclusively associated with survival of lung squamous cell carcinoma patients, who had higher smoking intensity compared to lung adenocarcinoma patients. Generally, the significant association between cg05293407TRIM27 and survival only remained in NSCLC patients having medium‐to‐high pack‐year of smoking. The cg05293407TRIM27‐smoking synergistic interaction might account for histologically heterogeneous effects of TRIM27 DNA methylation on NSCLC survival.
Keywords: DNA methylation, interaction, non‐small‐cell lung cancer, overall survival, prognosis, TRIM27
Abstract
Tripartite motif containing 27 (TRIM27) is highly expressed in lung cancer, including non‐small‐cell lung cancer (NSCLC). Here, we profiled DNA methylation of lung adenocarcinoma (LUAD) and lung squamous cell carcinoma (LUSC) tumours from 613 early‐stage NSCLC patients and evaluated associations between CpG methylation of TRIM27 and overall survival. Significant CpG probes were confirmed in 617 samples from The Cancer Genome Atlas. The methylation of the CpG probe cg05293407TRIM27 was significantly associated with overall survival in patients with LUSC (HR = 1.65, 95% CI: 1.30–2.09, P = 4.52 × 10⁻⁵), but not in patients with LUAD (HR = 1.08, 95% CI: 0.87–1.33, P = 0.493). As incidence of LUSC is associated with higher smoking intensity compared to LUAD, we investigated whether smoking intensity impacted on the prognostic effect of cg05293407TRIM27 methylation in NSCLC. LUSC patients had a higher average pack‐year of smoking (37.49LUAD vs 54.79LUSC, P = 1.03 × 10⁻¹⁹) and included a higher proportion of current smokers than LUAD patients (28.24%LUAD vs 34.09%LUSC, P = 0.037). cg05293407TRIM27 was significantly associated with overall survival only in NSCLC patients with medium–high pack‐year of smoking (HR = 1.58, 95% CI: 1.26–1.96, P = 5.25 × 10⁻⁵). We conclude that cg05293407TRIM27 methylation is a potential predictor of LUSC prognosis, and smoking intensity may impact on its prognostic value across the various types of NSCLC.
Abbreviations
- CI
confidence interval
- FDR
false discovery rate
- HR
hazard ratio
- LUAD
lung adenocarcinomas
- LUSC
lung squamous cell carcinomas
- NSCLC
non‐small‐cell lung cancer
- OS
overall survival
- QC
quality control
- SD
standard deviation
- TCGA
The Cancer Genome Atlas
- TRIM27
tripartite motif containing 27
- TSS
transcription start site
1. Introduction
Lung cancer is the most commonly diagnosed cancer, accounting for 11.6% of total cases in 2018 [1]. More than 85% of lung cancer cases are non‐small‐cell lung cancer (NSCLC), of which lung adenocarcinoma (LUAD) and lung squamous cell carcinoma (LUSC) are the most common subtypes [2, 3]. Compared to late‐stage patients, NSCLC patients diagnosed at an early stage have a better prognosis [4]. However, wide heterogeneity in overall survival has been observed even within the same stage of cancer, indicating the possible existence of prognosis‐influencing molecular mechanisms [5]. Epigenetic alterations such as DNA methylation are considered important representatives of these molecular mechanisms [6].
Tripartite motif containing 27 (TRIM27) is highly expressed in lung cancer and plays an important role in cancer prognosis [7, 8] by encoding a member of the tripartite motif (TRIM) family. TRIM family proteins play crucial roles in a wide range of processes, including cell growth, apoptosis and stem cell differentiation [9]. TRIM27 is an oncogene of various tumour types, including colitis‐associated cancer, salivary gland intraductal carcinoma, colon cancer, uterus cancer and prostate cancer [7, 10, 11]. Further, originally identified to be involved in oncogenic rearrangements with the transfection proto‐oncogene (RET), TRIM27 is also known as RFP (RET finger protein) [12]. RET rearrangements were implicated in NSCLC [13].
DNA methylation has been recognized as cancer biomarkers and therapeutic targets for NSCLC [14, 15, 16, 17, 18, 19, 20, 21], as well as other cancers [22, 23], since it is stable to measure but is modifiable with proper interventions [24, 25]. Also, aberrant DNA methylation of TRIM27 was identified affecting lung function in monozygotic twins [26]. Nevertheless, the association between DNA methylation of TRIM27 and early‐stage NSCLC survival still remains largely unclear.
Furthermore, DNA methylation changes have been linked to various environmental exposures (e.g., cigarette smoking) and may explain part of the association between smoking and cancer recurrence and mortality [15, 27, 28]. However, LUAD is more common in nonsmokers and long‐term former smokers, while most NSCLC patients among current smokers have LUSC [29, 30], indicating substantially different pathology and oncology. Anyway, few study focused on heterogeneous effect of DNA methylation between LUAD and LUSC.
Therefore, we utilized a two‐stage design to identify NSCLC prognosis associated epigenetic biomarkers in TRIM27 and further explored the potential reason of heterogeneous effect of biomarkers across histology by performing epigenetic–smoking interaction analysis. Meanwhile, the robustly significant biomarkers were investigated for the associated alterations in gene expression which were also studied for effect on lung cancer survival.
2. Materials and methods
2.1. Study populations
We collected data from early‐stage (stage I and II) NSCLC patients from five international study centres. Cases from the Harvard, Spain, Norway and Sweden cohorts were assigned into the discovery phase [31, 32, 33, 34], while cases from The Cancer Genome Atlas (TCGA) were assigned into the validation phase. All patients provided written informed consent. The study methodologies conformed to the standards set by the Declaration of Helsinki and was approved by the local ethics committee.
2.1.1. Harvard
The Harvard Lung Cancer Study cohort was described previously [31]. Patients were recruited at Massachusetts General Hospital (MGH) since 1992. All were newly diagnosed and histologically confirmed as primary NSCLC at the time of recruitment. Snap‐frozen tumour samples were taken from patients during complete resection. The 151 early‐stage patients selected in this study had complete survival information. Tumour DNA was extracted from 5‐μm‐thick histopathologic sections. Each specimen was evaluated by an MGH pathologist for amount (tumour cellularity > 70%) and quality of tumour cells. All specimens were histologically classified using World Health Organization criteria.
2.1.2. Spain
The study population was described previously [32]. Tumours were collected by surgical resection from 226 patients. DNA extraction was performed on tumour specimens (10 μm thick, tumour cellularity > 50%). The study was approved by the Bellvitge Biomedical Research Institute Institutional Review Board.
2.1.3. Norway
Participants were 133 LUAD patients with operable lung cancer tumours seen at Oslo University Hospital, Rikshospitalet, Norway, in 2006–2011 [33]. Tumour tissues were collected during surgery, snap‐frozen in liquid nitrogen, and stored at −80 °C until DNA isolation. All early‐stage patients did not receive chemotherapy or radiotherapy before surgery. The project was approved by the Oslo University Institutional Review Board and the Regional Ethics Committee (S‐05307).
2.1.4. Sweden
Tumour tissue samples were collected from 103 patients with early‐stage NSCLC who underwent operation at Skane University Hospital, Lund, Sweden [34]. The study was approved by the Regional Ethical Review Board in Lund, Sweden (Registration no. 2004/762 and 2008/702).
2.1.5. TCGA
TCGA dataset included 332 LUAD and 285 LUSC cases. Overall survival times and common covariates were included. Level‐1 HumanMethylation450 DNA methylation data (image data) of each patient were downloaded from https://portal.gdc.cancer.gov on 1 October 2015.
2.2. Quality control procedures for DNA methylation data
For each patient, DNA methylation was assessed using Infinium HumanMethylation450 BeadChips (Illumina Inc., San Diego, CA, USA). All centres followed the same quality control (QC) procedures before conducting the association study. GenomeStudio Methylation Module V1.8 (Illumina Inc.) was used to convert raw image data into beta values (continuous numbers ranging 0–1) for background subtraction and control normalization. Unqualified probes meeting any one of the following criteria were excluded: (a) failed detection (P > 0.05) in > 5% of samples; (b) coefficient of variance of < 5%; (c) all samples methylated or unmethylated; (d) common single nucleotide polymorphisms located in the probe sequence or 10‐bp flanking regions; (e) cross‐reactive probes or cross‐hybridizing probes [35]; or (f) did not pass QC in all centres. Samples with > 5% undetectable probes were excluded. Methylation signals were further processed for quantile normalization (betaqn function in r package minfi) as well as type I and II probe correction (BMIQ function in r package lumi). Data were adjusted for batch effects (ComBat function in r package sva) according to the best pipeline by a comparative study [36]. Details of QC processes are described in Fig. S1.
2.3. Gene expression data
In TCGA cohort, all of the 281 LUAD and 277 LUSC cases had complete mRNA sequencing data. Gene expression was measured by RNA sequencing. Data processing and QC were done by TCGA workgroup. Raw counts were normalized by RNA‐seq expectation maximization. Level‐3 gene quantification data were downloaded from TCGA and were further checked for quality. Expression of TRIM27 was extracted and log2‐transformed before analysis.
2.4. Statistical analysis
The study design is shown in Fig. 1. To investigate the association between DNA methylation of TRIM27 and overall survival, we applied a Cox proportional hazards model adjusted for age, sex, smoking status, clinical stage and study centre for LUAD and LUSC patients, respectively. Proportional hazards assumption for each CpG probe was also tested. Hazard ratio (HR) and 95% confidence interval (CI) were with respect to per 1% level of methylation increment. Multiple comparisons were adjusted by using false discovery rate method (FDR; measured by FDR‐q value) [37] to control the overall false‐positive rate at 5% level. CpG probes with FDR‐q ≤ 0.05 in the discovery phase were further replicated in the validation phase. Robustly significant CpG probes were finally retained if they met the following criteria: (a) P ≤ 0.05 in validation phase and (b) consistent effect direction across two phases. For robustly significant CpG probes, Kaplan–Meier curves were used to compare survival difference between patients with different methylation levels.
Fig. 1.
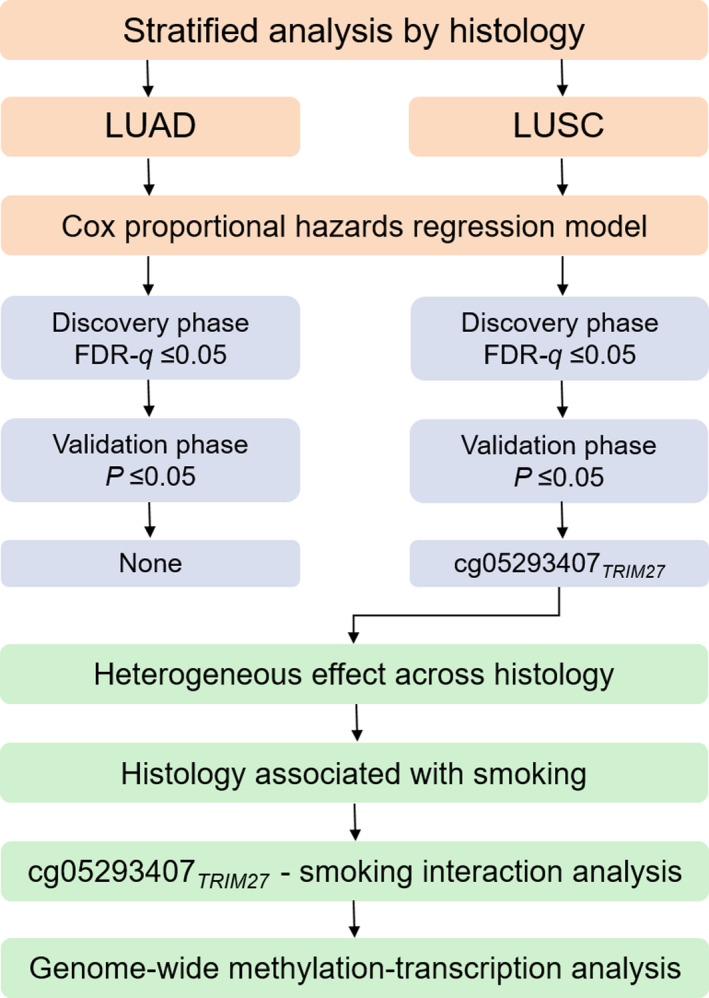
Flow chart of study design and statistical analyses.
2.5. Methylation–smoking interaction analysis
We observed a significant heterogeneous effect of cg05293407TRIM27 across histology, but the distributions of cg05293407TRIM27 methylation in LUAD and LUSC patients were comparable. Meanwhile, combined prior literature information with our results, all evidence indicated that heavy smoking was relevant to LUSC. Therefore, we hypothesized that this heterogeneity might be explained by methylation–smoking interaction, which was further tested as a product term (methylation and pack‐year of smoking) in a Cox proportional hazards model adjusted for same covariates as aforementioned.
2.6. Genome‐wide methylation‐transcription analysis
Based on hypothesis of omnigenetic model [38], for these identified prognostic CpG probes, we used a linear regression model adjusted for the aforementioned covariates to test the association between DNA methylation and gene expression using transcriptomic data from TCGA. Significant genes were identified as FDR‐q ≤ 0.05 and presented in Circos plot. Then, the association between gene expression and overall survival was further evaluated using Cox models adjusted for the same covariates. Genes significantly associated with both methylation and NSCLC survival were screened out.
Continuous variables were expressed as mean ± standard deviation (SD), and categorical variables were expressed in frequency (n) and proportion (%). Statistical analysis was performed using r version 3.5.2 (The R Foundation of Statistical Computing, Tsinghua University, Beijing, China).
3. Results
Demographic and clinical information for patients with DNA methylation and gene expression data were detailed in Table 1 and Table S1. There were 96 CpG probes located in TRIM27 (Table S2). In LUAD patients, none of the CpG probes in the discovery phase were identified by the criterion of FDR‐q ≤ 0.05 (Table S3). One probe, cg05293407TRIM27, was significantly associated with LUSC survival in both discovery (HR = 2.10, 95% CI: 1.41–3.12, P = 2.70 × 10⁻⁴, FDR‐q = 0.026) and validation phases (HR = 1.49, 95% CI: 1.07–2.07, P = 0.018) and showed robust association in combined data (HR = 1.65, 95% CI: 1.30–2.09, P = 4.52 × 10⁻⁵) (Tables S4 and S5).
Table 1.
Demographic and clinical descriptions for early‐stage NSCLC patients in five international study centres.
| Variable | Discovery | Validation | Combined | ||||
|---|---|---|---|---|---|---|---|
| USA (N = 151) | Spain a (N = 226) | Norway (N = 133) | Sweden (N = 103) | All (N = 613) | TCGA (N = 617) | Overall (N = 1230) | |
| Age (years) | 67.67 ± 9.92 | 65.67 ± 10.58 | 65.52 ± 9.34 | 67.54 ± 9.99 | 66.44 ± 10.08 | 66.51 ± 9.47 | 66.48 ± 9.78 |
| Sex | |||||||
| Female | 67 (44.37%) | 105 (46.46%) | 71 (53.38%) | 54 (52.43%) | 297 (48.45%) | 255 (41.33%) | 552 (44.88%) |
| Male | 84 (55.63%) | 121 (53.54%) | 62 (46.62%) | 49 (47.57%) | 316 (51.55%) | 362 (58.67%) | 678 (55.12%) |
| Smoking status | |||||||
| Never | 18 (11.92%) | 30 (13.57%) | 17 (12.78%) | 18 (17.48%) | 83 (13.65%) | 55 (9.18%) | 138 (11.43%) |
| Former | 81 (53.64%) | 120 (54.30%) | 74 (55.64%) | 54 (52.43%) | 329 (54.11%) | 376 (62.77%) | 705 (58.41%) |
| Current | 52 (34.44%) | 71 (32.13%) | 42 (31.58%) | 31 (30.10%) | 196 (32.24%) | 168 (28.05%) | 364 (30.16%) |
| Unknown | 0 | 5 | 0 | 0 | 5 | 18 | 23 |
| Clinical stage | |||||||
| I | 104 (68.87%) | 183 (80.97%) | 93 (69.92%) | 95 (92.23%) | 475 (77.49%) | 393 (63.70%) | 868 (70.57%) |
| II | 47 (31.13%) | 43 (19.03%) | 40 (30.08%) | 8 (7.77%) | 138 (22.51%) | 224 (36.30%) | 362 (29.43%) |
| Histology | |||||||
| LUAD | 96 (63.58%) | 183 (80.97%) | 133 (100.00%) | 80 (77.67%) | 492 (80.26%) | 332 (53.81%) | 824 (66.99%) |
| LUSC | 55 (36.42%) | 43 (19.03%) | 0 (0.00%) | 23 (22.33%) | 121 (19.74%) | 285 (46.19%) | 406 (33.01%) |
| Chemotherapy | |||||||
| No | 142 (94.04%) | 177 (90.77%) | 102 (76.69%) | 67 (90.54%) | 488 (88.25%) | 194 (76.98%) | 682 (84.72%) |
| Yes | 9 (5.96%) | 18 (9.23%) | 31 (23.31%) | 7 (9.46%) | 64 (11.75%) | 58 (23.02%) | 123 (15.28%) |
| Unknown | 0 | 31 | 0 | 29 | 60 | 365 | 425 |
| Radiotherapy | |||||||
| No | 132 (87.42%) | 184 (94.36%) | 132 (99.25%) | 74 (100.00%) | 522 (94.39%) | 239 (94.84%) | 761 (94.53%) |
| Yes | 19 (12.58%) | 11 (5.64%) | 1 (0.75%) | 0 (0.00%) | 31 (5.61%) | 13 (5.16%) | 44 (5.47%) |
| Unknown | 0 | 31 | 0 | 29 | 60 | 365 | 425 |
| Adjuvant therapy b | |||||||
| No | 127 (84.11%) | 168 (86.15%) | 101 (75.94%) | 67 (90.54%) | 463 (83.73%) | 187 (74.21%) | 650 (80.75%) |
| Yes | 24 (15.89%) | 27 (13.85%) | 32 (24.06%) | 7 (9.46%) | 90 (16.27%) | 65 (25.79%) | 155 (19.25%) |
| Unknown | 0 | 31 | 0 | 29 | 60 | 365 | 425 |
| Survival year c | |||||||
| Median (95% CI) | 6.66 (5.41–7.87) | 7.12 (5.06–9.63) | 7.36 (6.77–7.95)* | 7.39 (4.98–9.12) | 7.39 (6.50–8.23) | 4.54 (3.68–5.41) | 6.60 (5.84–7.35) |
| Censoring rate | 19.21% | 55.31% | 68.42% | 43.69% | 43.31% | 76.99% | 62.20% |
Spain centre is a collaborative study centre, containing samples from Spain, Italy, UK, France and United States.
Adjuvant therapy included chemotherapy and/or radiotherapy.
Restricted mean survival time was given because median was not available; proportion of samples lost to follow‐up or alive at end of study.
To further exemplify the effect of cg05293407TRIM27 on overall survival, patients were categorized into two groups (high vs low) based on median value of methylation level. Kaplan–Meier survival curves showed significant differences between two groups in the discovery phase (HRHigh vs Low = 2.10, 95% CI: 1.28–3.45, P = 3.41 × 10⁻³), the validation phase (HRHigh vs Low = 1.92, 95% CI: 1.20–3.07, P = 6.36 × 10⁻³) and combined data (HRHigh vs Low = 1.88, 95% CI: 1.34–2.63, P = 2.35 × 10⁻⁴) (Fig. 2). However, the effect of cg05293407TRIM27 on LUAD survival was not significant (HR = 1.08, 95% CI: 0.87–1.33, P = 0.493) (Fig. 3A), indicating a significant heterogeneous effect of cg05293407TRIM27 across NSCLC histology (P = 8.66 × 10⁻³). Also, the pattern of survival curves for patients with high, medium and low methylation levels based on tertiles of methylation level differed between LUAD and LUSC patients. Survival curves were significantly separated only in LUSC patients (Fig. 3B,C).
Fig. 2.
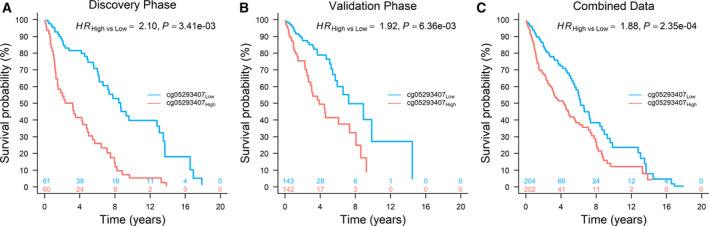
Kaplan–Meier survival curves of LUSC patients. High and low methylation groups were defined according to median value in (A) discovery phase (N = 121, median value: 1.72%), (B) validation phase (N = 285, median value: 1.48%) and (C) combined data (N = 406, median value: 1.55%). HR, 95% CI, and P value were derived from a Cox proportional hazards regression model adjusted for age, sex, smoking status, clinical stage and study centre.
Fig. 3.
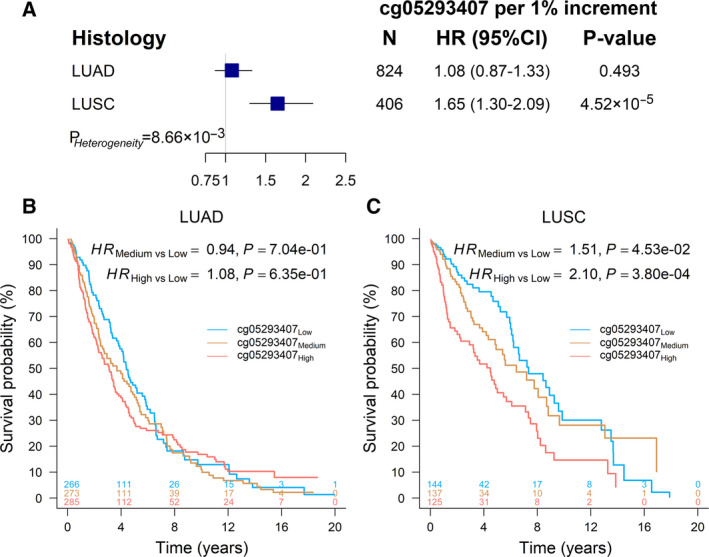
Methylation and histology interaction on survival of NSCLC patients. (A) Forest plot of the effects of cg05293407TRIM27 in LUAD and LUSC populations. HR, 95% CI, and P value were derived from a Cox proportional hazards regression model adjusted for age, sex, smoking status, clinical stage and study centre. P Heterogeneity was used to evaluate heterogeneity across both groups. (B) Kaplan–Meier survival curves of LUAD patients (N = 824) with high, medium and low methylation categorized by tertiles (1.38% and 1.84%) of cg05293407TRIM27. (C) Kaplan–Meier survival curves of LUSC patients (N = 406) with high, medium and low methylation categorized by tertiles (1.32% and 1.79%) of cg05293407TRIM27.
However, distribution of cg05293407TRIM27 methylation in LUAD and LUSC patients was similar (Fig. 4A) and comparable (P = 0.518) by Wilcoxon rank‐sum test (Fig. 4B). Since nonsmokers and long‐term former smokers are more common in LUAD patients, while the majority of lung cancer patients who are current smokers have LUSC [29]. Therefore, we assumed that there might exist a methylation–smoking interaction accounting for the heterogeneous effect of cg05293407TRIM27 on NSCLC survival across histology. The smoking‐related variables were compared between the LUAD and LUSC patients (Table S6). Compared with LUAD patients, LUSC patients had more pack‐year of smoking averagely (37.49LUAD vs 54.79LUSC, P = 1.03 × 10⁻¹⁹) (Fig. 4C,D) and a higher proportion of current smokers (28.24%LUAD vs 34.09%LUSC, P = 0.037) (Table S6).
Fig. 4.
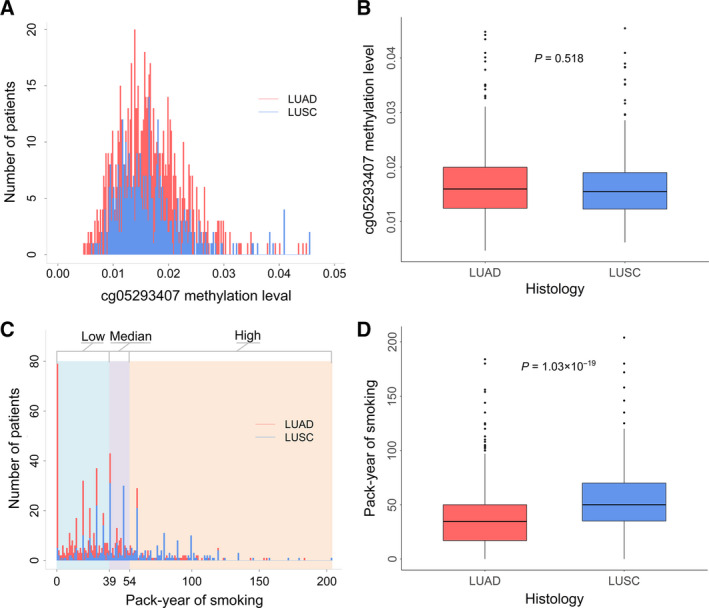
Distribution of cg05293407TRIM27 and pack‐year of smoking in LUAD (N = 824) and LUSC patients (N = 406). (A) Distribution of cg05293407TRIM27. (B) Box plot of cg05293407TRIM27. (C) Distribution of pack‐year of smoking. And, 39 and 54 are the two cut‐off values of the three groups of pack‐year of smoking (low, medium and high). (D) Box plot of pack‐year of smoking in LUAD patients (N = 652) and LUSC patients (N = 342). Wilcoxon rank‐sum test was used to estimate the P value.
We identified a significant interaction between cg05293407TRIM27 and pack‐year of smoking in all NSCLC patients (HRinteraction = 1.01, 95% CI: 1.00–1.02, P = 0.034). With increased pack‐year of smoking, there was an elevated risk for high methylation of cg05293407TRIM27 on NSCLC survival (Fig. 5). Therefore, pack‐year of smoking was a modifier of the association between cg05293407TRIM27 and NSCLC survival.
Fig. 5.
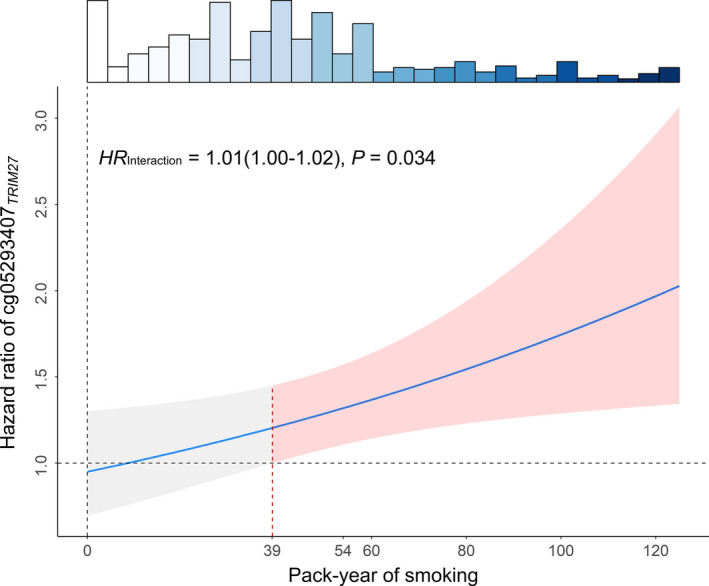
Methylation–smoking interaction on survival of NSCLC patients (N = 994). HR of interaction term, 95% CI, and P value were derived from a Cox proportional hazards regression model adjusted for age, sex, smoking status, clinical stage, cancer type and study centre. HR of methylation estimated based on level of pack‐year of smoking. Shallow area represented 95% CI. Histogram on the top shows the distribution of pack‐year of smoking.
We also evaluated joint effect of cg05293407TRIM27 methylation level and pack‐year of smoking on NSCLC survival (Table 2). Patients were categorized into three groups (high, medium and low) by tertiles of cg05293407TRIM27 methylation level (1.33% and 1.78%) and were also categorized into three groups (high, medium and low) by cut‐off values of pack‐year of smoking (39 and 54). Only for these patients having > 39 pack‐year of smoking, cg05293407TRIM27 was a significant risk factor (Fig. 5). Therefore, 39 was defined as a cut‐off value of low and medium–high levels. Further, the median value (54) of pack‐year of smoking for LUAD patients having > 39 pack‐year of smoking was used to distinguish medium and high levels. We used the best prognosis group (low–medium methylation of cg05293407TRIM27 and low–medium pack‐year of smoking) as the reference to evaluate effects of high methylation level, high pack‐year of smoking and their joint effect, as well as interaction. In the combined dataset, the main effect of high pack‐year of smoking was HR = 1.12 (95% CI: 0.84–1.49; P = 0.438), and the main effect of high methylation of cg05293407TRIM27 was HR = 1.10 (95% CI: 0.83–1.45; P = 0.502). However, the joint effect was HR = 2.00 (95% CI: 1.43–2.79; P = 5.00 × 10⁻⁵), which was greater than the product of the two individual risk effects (1.2320 = 1.12 × 1.10), indicating a synergistic interaction between high methylation of cg05293407TRIM27 and high pack‐year of smoking (HRinteraction = 1.62; 95% CI: 1.04–2.53; P = 3.21 × 10⁻²).
Table 2.
Joint effect and interaction of elevated methylation and pack‐year of smoking on prognosis of early‐stage NSCLC.
| Effect type a | High methylation b | High pack‐year of smoking | Number | Death | Crude mortality | HR (95% CI) a | P a |
|---|---|---|---|---|---|---|---|
| No | No | 486 | 158 | 32.51% | Reference | ||
| Main effect 1 | No | Yes | 177 | 77 | 43.50% | 1.12 (0.84, 1.49) | 0.438 |
| Main effect 2 | Yes | No | 229 | 94 | 41.05% | 1.10 (0.83, 1.45) | 0.502 |
| Joint effect | Yes | Yes | 102 | 56 | 54.90% | 2.00 (1.43, 2.79) | 5.00 × 10⁻⁵ |
| Interaction c | 1.62 (1.04, 2.53) | 3.21 × 10⁻² |
Patients were categorized into three groups (high vs medium–low) by tertiles of cg05293407TRIM27 methylation level (1.33% and 1.78%) and were categorized into three groups (high vs medium–low) by cut‐off value of pack‐year of smoking (39 and 54). The risk effect of cg05293407TRIM27 on survival was significant only for these patients having > 39 pack‐year of smoking. And, 54 was the median value of pack‐year of smoking for LUAD patients having > 39 pack‐year of smoking.
Main effects of elevated methylation and pack‐year of smoking as well as their joint effect and interaction were derived from Cox proportional hazards regression model adjusted for age, sex, clinical stage, histology, study centre, and stratified by cancer type.
Interaction = Joint effect ÷ (Main effect 1 × Main effect 2). 1.62 ≈ 2.00 ÷ (1.12 × 1.10).
To illustrate the modification effect by pack‐year of smoking, effect of cg05293407TRIM27 on NSCLC survival was evaluated in patients with low, medium and high levels of pack‐year of smoking. The effect of cg05293407TRIM27 varied across patients with different pack‐year of smoking. For LUAD patients with a high level of pack‐year of smoking, high methylation of cg05293407TRIM27 had significantly worse survival (HRHigh vs Low = 1.88, 95% CI: 1.07–3.32, P = 0.029) (Fig. 6A,B). In LUSC and overall NSCLC patients, we observed similar significant results in patients with both medium (HRHigh vs Low = 2.51, 95% CI: 1.10–5.73, P = 0.029 in LUSC patients; HRHigh vs Low = 1.89, 95% CI: 1.17–3.06, P = 9.35 × 10⁻³ in overall patients) and high (HRHigh vs Low = 2.55, 95% CI: 1.43−4.55, P = 1.49 × 10⁻³ in LUSC patients; HRHigh vs Low = 1.94, 95% CI: 1.32–2.84, P = 7.51 × 10⁻⁴ in overall patients) levels of pack‐year of smoking (Fig. 6C–F). Our results indicated that cg05293407TRIM27 influenced NSCLC survival actually regardless of histology, but only among these patients exposed to relatively heavy smoking. Since the pack‐year of smoking might be bimodal distributed due to plenty of zero values from never smokers, we also performed sensitivity analysis by testing the methylation–smoking interaction in NSCLC patients excluding never smokers and still observed the significant interaction (Fig. S2) and same pattern (Fig. S3). Another sensitivity analysis based on smoking status also indicated an upward trend (P Trend = 0.022) in effect size of cg05293407TRIM27 from never smokers (HR = 0.89), former smokers (HR = 1.23) to current smokers (HR = 1.88) in overall population, even not taking pack‐year of smoking into account (Fig. S4).
Fig. 6.
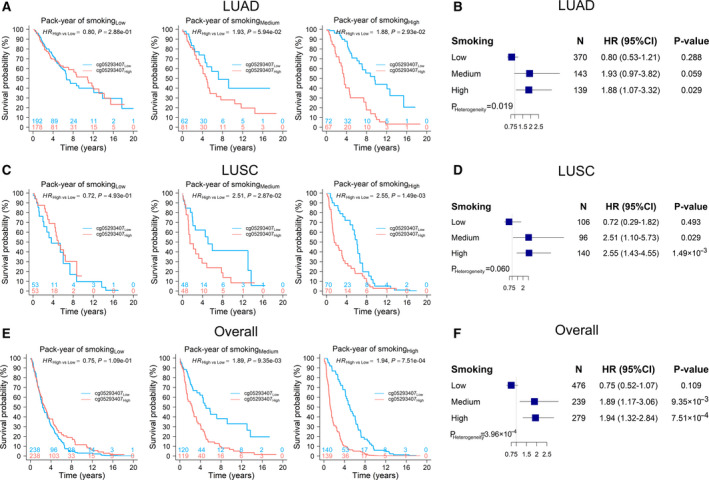
Kaplan–Meier survival curves of LUAD, LUSC and overall NSCLC patients. Kaplan–Meier curves of low and high methylation groups and forest plots of the effects of cg05293407TRIM27 were stratified by populations having low, medium and high pack‐year of smoking for (A, B) LUAD patients (N Low = 370, N Medium = 143, N High = 139), (C, D) LUSC patients (N Low = 106, N Medium = 96, N High = 140) and (E, F) overall patients (N Low = 476, N Medium = 239, N High = 279). HR, 95% CI, and P value were derived from a Cox proportional hazards regression model adjusted for age, sex, smoking status, clinical stage and study centre. P Heterogeneity was used to evaluate heterogeneity of HRs across groups.
Further, because cg05293407TRIM27 maps to TRIM27, the association between TRIM27 expression and cg05293407TRIM27 methylation was evaluated in the TCGA population. In NSCLC patients, there was a significant association (r = 0.13, P = 1.38 × 10⁻³) (Fig. 7), suggesting that methylation of cg05293407TRIM27 upregulated TRIM27 expression. However, TRIM27 expression had no significant association with overall survival (HR = 0.84, 95% CI: 0.62–1.14, P = 0.270) (Fig. S5). However, genome‐wide methylation‐transcription analysis showed that expression of 29 genes was associated with cg05293407TRIM27 (Table S7 and Fig. S6A). Among them, expression of three genes was associated with overall survival: ubiquitin‐specific protease 26 (USP26), gap junction protein gamma 3 (GJC3), and N‐acetylated alpha‐linked acidic dipeptidase 2 (NAALAD2) (Fig. S6B–D).
Fig. 7.
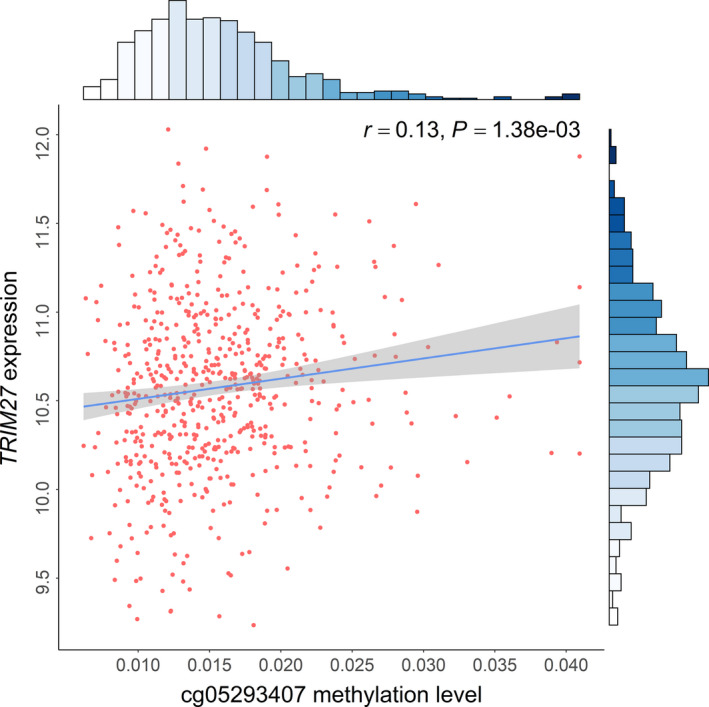
Association between DNA methylation of cg05293407 and expression of corresponding gene TRIM27 in TCGA using 277 biologically independent samples. Correlation coefficients and hypothesis tests were based on Pearson correlation test. Gene expression was log2‐transformed before analysis. Histogram on top shows the distribution of cg05293407 methylation; histogram on side shows the distribution of TRIM27 expression.
4. Discussion
We performed a two‐stage study and integrative analysis of DNA methylation of TRIM27 and gene expression in early‐stage NSCLC patients. The CpG probe, cg05293407TRIM27, located at the 200 kb transcription start site (TSS) region of TRIM27, was identified as an exclusive biomarker of early‐stage LUSC prognosis. Further, the heterogeneous effect of cg05293407TRIM27 across histology may be explained by a methylation–smoking interaction.
As LUAD and LUSC differ in the origin and histology, the mechanism of occurrence and progression may be different at a molecular level [39, 40]. For example, both mutated genes and recurrent somatic copy number alterations are largely distinct between the two NSCLC types [41]. We only observed one probe, cg05293407TRIM27, exclusively associated with early‐stage LUSC prognosis in stratified analysis by histology, whereas no promising CpG probes were observed for LUAD, possibly due to underlying epigenetic heterogeneity between LUAD and LUSC. Further, LUSC is more strongly associated with smoking than LUAD, suggesting different causes for their induction as well [30]. In addition, a methylation–smoking interaction may potentially provide interpretation of the heterogeneous effect of cg05293407TRIM27.
The tumour‐specific shift to transcriptional repression is associated with DNA methylation at TSSs in multiple tumour types [42]. Generally, hyper‐methylation blocks transcription initiation and reduces gene expression [43]. However, a small proportion of methylation surrounding the TSS region upregulates gene expression, indicating that DNA methylation regulation may be more complex [44]. In our study, DNA methylation at cg05293407 in the 200 kb TSS region of TRIM27 upregulated gene expression in tumour tissues, which was consistent with previous reports [45, 46]. This phenomenon may be mediated by affecting the binding activity of upstream transcription factors [47]. However, further functional studies are warranted to elaborate the possible mechanism.
In LUSC patients, the methylation level of cg05293407TRIM27 ranged from 0.62% to 4.09% and its median value was 1.48%, indicating a narrow range and low average level. As shown in Fig. S7, these maximum values of all 311 891 CpG probes followed a bimodal distribution with the first peak around 5%. Furthermore, there were 9341 (2.99%) CpG probes with even lower maximum value than that of cg05293407TRIM27 indicating its narrow range was reasonable. Meanwhile, plenty of studies have revealed that aberrant DNA methylations of these hypo‐methylated CpG probes were also involved in diseases (e.g., female panic disorder risk associated cg07308824HECA and paediatric medulloblastoma prognosis associated cg02257300ERCC2) [48, 49].
TRIM27 belongs to the TRIM family, an extended family of proteins with a common denominator of a tripartite combinatorial motif encompassing RING finger, B‐box, and coiled‐coil domain homologies [50]. TRIM27 is an important positive regulator of signal transducer and activator of transcription 3 (STAT3) activation. TRIM27, located at retromer‐positive structures, can recruit STAT3 after IL‐6 stimulation and lead to improved STAT3 activation [11]. STAT3 activity plays important roles in pathogenesis of many cancers, including breast, head and neck, prostate and brain cancers [51]. Further, STAT3 is overexpressed in NSCLC tumour samples, and sorafenib can inhibit STAT3 activation to produce anticancer effects in NSCLC [52]. Combined with our results, these data suggested that high methylation of cg05293407TRIM27 might promote TRIM27 expression, further leading to STAT3 activation and poor prognosis (Fig. 8).
Fig. 8.
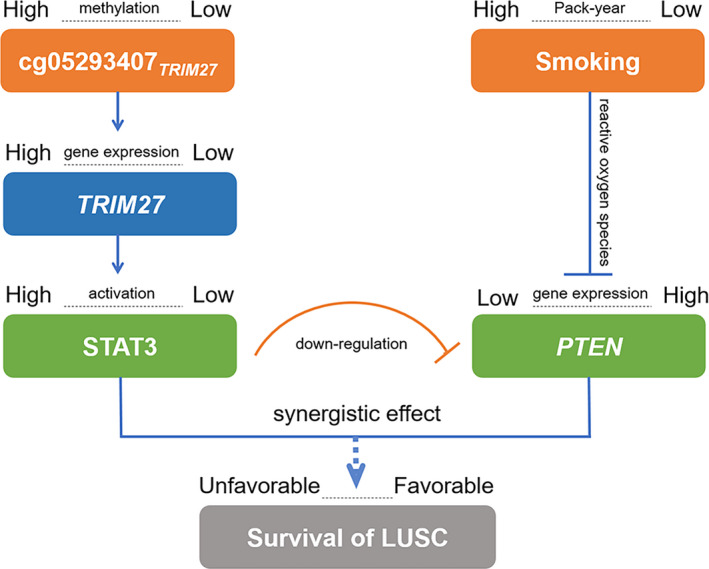
Diagram for pathway of DNA methylation–smoking interaction effect on survival for LUSC patients.
Smoking is associated with several genetic alterations in NSCLC [53] and has been well‐established as a relevant factor of lung cancer risk as well as prognosis [15]. Cigarette smoke contains reactive oxygen species (ROS), which inhibit phosphatase and tensin homolog (PTEN) expression by phosphorylating the ROS‐dependent Src/EGFR‐p38MAPK pathway [54]. PTEN inhibits glycolysis in brain tumour cells by directly interacting with phosphoglycerate kinase 1 (PGK1) [55]. Further, PTEN inhibits cancer cells by moderating signalling through the PI3K pathway. PTEN is lowly expressed in NSCLC tumour samples and is more prevalent in LUSC [56]. Therefore, for patients with high pack‐year of smoking, heavy exposure to cigarette smoking may strongly inhibit PTEN expression through ROS and relate to poor NSCLC prognosis (Fig. 8).
Moreover, PTEN is an essential modulator of STAT3‐mediated pathways. Although STAT3 is a downstream target of PTEN, STAT3 also reversely inhibits PTEN expression by directly activating miR‐21, which is part of the epigenetic switch linking inflammation to cancer [57]. Therefore, STAT3 activation can downregulate PTEN expression (Fig. 8). In terms of the cg05293407TRIM27 and smoking interaction, high methylation was associated with poor prognosis in NSCLC patients with medium–high pack‐year of smoking rather than low pack‐year of smoking, possibly because high activation of STAT3 and low expression of PTEN may only occur in patients with medium–high methylation of cg05293407TRIM27.
We observed three genes associated with cg05293407TRIM27: GJC3, NAALAD2 and USP26. GJC3 is one of the genes coding for connexin (CX) proteins and is reported to be associated with nonsyndromic hearing loss [58]. Further, patients with low GJC3 expression had a better prognosis in our study. NAALAD2 encodes human prostate‐specific membrane antigen (PSM), which is a marker of prostatic carcinomas and is the first shown to possess NAALADase activity [59]. Similarly, LUSC patients with lower NAALAD2 expression had higher survival in our study. USP26 is associated with Sertoli cell‐only syndrome and male infertility in both European and Chinese men [60, 61]. Further, our study showed consistent results in LUSC patients. Although these three genes lack explicit evidence of association with LUSC, their relationship to cg05293407TRIM27 and LUSC survival may inspire functional studies of these potential genes and further help elucidate the mechanistic pathway of cg05293407TRIM27 on LUSC survival.
Our study has several strengths. First, to our knowledge, this is the first multicentre study of interaction between DNA methylation of TRIM27 and smoking, which attempted to interpret the effect of DNA methylation that varied by NSCLC histology. Second, besides the significant statistical interaction observed on a population level, we experimentally elaborated on a plausible functional interaction between two pathways based on literature evidence. Third, by controlling false positives, our two‐stage study and the sensitivity analysis provided robustness to our results. Fourth, we performed integrative analysis of DNA methylation and gene expression and systematically evaluated associated genes of cg05293407TRIM27 on genome‐wide scale.
We also acknowledge some limitations. First, though three genes associated with cg05293407TRIM27 further affected lung cancer prognosis in our study, there was no explicit evidence of their mechanisms. Therefore, these associations should be interpreted with caution. Second, with a high censoring rate in the TCGA cohort, the statistical power might be limited. Anyway, the association between cg05293407TRIM27 and prognosis remained significant in TCGA, indicating our results were conservative and roust. Third, the positive association between cg05293407TRIM27 and TRIM27 expression was not reported by the other literatures yet. Further functional experiments are warranted to confirm our results. Finally, as the majority of our population was Caucasian (89.19%), generalization of the results to the other ethnicity groups should be cautioned.
5. Conclusion
In summary, our study identified cg05293407TRIM27 as a potential biomarker for LUSC prognosis and laid out a case that the methylation–smoking interaction may account for heterogeneous effects of cg05293407TRIM27 across histology. Our findings provide a potential dynamic and reversible therapeutic target for NSCLC patients.
Conflict of interest
The authors declare no conflict of interest.
Author contributions
XJ, LL, RZ, YW, FC and DCC contributed to the study design. RZ, LS, AS, MMB, AK, MP, JS, ÅH, ME and DCC contributed to data collection. XJ, LL, SS, XD, CC, YL, RZ, YW, FC and DCC performed statistical analysis and interpretation and drafted the manuscript. YZ, HH, XC, JC, LW, JH, WD, LS, YJ, JF, JG and DY revised the manuscript. All authors contributed to critical revision of the manuscript and approved its final version. Financial support and study supervision were provided by RZ, YW, FC and DCC.
Supporting information
Fig. S1. Quality control processes for DNA methylation chip data.
Fig. S2. Methylation–smoking interaction on survival of LUSC patients excluding never smokers.
Fig. S3. Kaplan–Meier overall survival (OS) curves of LUAD, LUSC and overall NSCLC patients excluding never smokers. (A,B) LUAD patients, (C,D) LUSC patients and (E,F) overall patients. Hazard ratio (HR) and P value were derived from a Cox proportional hazards regression model adjusted for age, sex, smoking status, clinical stage, and study centre. P Heterogeneity was used to evaluate heterogeneity of HRs across groups.
Fig. S4. Kaplan–Meier overall survival (OS) curves of LUAD, LUSC and overall NSCLC patients. (A,B) LUAD patients, (C,D) LUSC patients and (E,F) overall patients. Hazard ratio (HR) and P value were derived from a Cox proportional hazards regression model adjusted for age, sex, clinical stage, pack‐year of smoking and study centre. P Trend was used to evaluate trend of HRs across groups.
Fig. S5. Kaplan–Meier overall survival (OS) curves of TCGA cases by low or high TRIM27 expression. The gene expression divided into low and high groups by median value (10.26). Hazard ratio (HR) and P value were derived from a Cox proportional hazards regression model adjusted for age, sex, smoking status, clinical stage, and study centre.
Fig. S6. Genome‐wide methylation transcription analysis of LUSC patients from the TCGA cohort. (A) Circos plot of genome‐wide gene expression. For plots in B–D, left panels show correlation of (B) USP26, (C) GJC3 or (D) NAALAD2 expression (X‐axis) with methylation level at cg05293407TRIM27 (Y‐axis). Right panels show Kaplan–Meier survival plots of gene expression divided into low and high groups by median value.
Fig. S7. Distribution of maximum value of all 311891 CpG probes in non‐small‐cell lung cancer (NSCLC) patients.
Table S1. Demographic and clinical characteristics of early‐stage NSCLC patients with gene expression data derived from TCGA.
Table S2. Annotation information for 96 CpG probes located in TRIM27.
Table S3. Results of association analysis of 96 DNA methylation probes of TRIM27 in LUAD samples.
Table S4. Results of association analysis of 96 CpG probes of TRIM27 in LUSC samples.
Table S5. Results of proportional hazards test for 96 CpG probes of TRIM27 in LUSC samples.
Table S6. Comparison of smoking‐related characteristics of former and current smokers between early‐stage LUAD and LUSC.
Table S7. Results of genome‐wide methylation transcription analysis of 29 genes significantly associated with cg05293407 in TCGA LUSC samples.
Acknowledgements
The authors thank TCGA for contributing clinical, DNA methylation and RNA sequencing data, as well as all study subjects who participated in the five study cohorts. This study was funded by the National Natural Science Foundation of China (81530088 to FC, 81973142 to YW), National Key Research and Development Program of China (2016YFE0204900 to FC), Natural Science Foundation of Jiangsu Province (BK20191354 to RZ), Natural Science Foundation of the Jiangsu Higher Education Institutions of China (18KJB310011 to RZ), China Postdoctoral Science Foundation (2018M633767 to RZ), US National Institutes of Health (CA209414, CA092824, and U01CA209414 to DCC and YL; AG056764 to YL), and Priority Academic Program Development of Jiangsu Higher Education Institutions (PAPD). RZ was partially supported by the Outstanding Young Teachers Training Program of Nanjing Medical University.
Xinyu Ji and Lijuan Lin contributed equally to this work
Feng Chen and David C. Christiani are senior authors who supervised the work
Contributor Information
Yongyue Wei, Email: ywei@njmu.edu.cn.
Ruyang Zhang, Email: zhangruyang@njmu.edu.cn.
Data accessibility
The DNA methylation image data of Harvard, Spain, Norway and Sweden study cohort can be requested from DCC, ME, ÅH and JS, respectively. Alternatively, it can be retrieved from gene expression omnibus database (GSE39279, GSE66836 and GSE56044). TCGA: https://tcga‐data.nci.nih.gov; now hosted at GDC: https://portal.gdc.cancer.gov.
References
- 1. Bray F, Ferlay J, Soerjomataram I, Siegel RL, Torre LA & Jemal A (2018) Global cancer statistics 2018: GLOBOCAN estimates of incidence and mortality worldwide for 36 cancers in 185 countries. CA Cancer J Clin 68, 394–424. [DOI] [PubMed] [Google Scholar]
- 2. Chen Z, Fillmore CM, Hammerman PS, Kim CF & Wong KK (2014) Non‐small‐cell lung cancers: a heterogeneous set of diseases. Nat Rev Cancer 14, 535–546. [DOI] [PMC free article] [PubMed] [Google Scholar]
- 3. Molina JR, Yang P, Cassivi SD, Schild SE & Adjei AA (2008) Non‐small cell lung cancer: epidemiology, risk factors, treatment, and survivorship. Mayo Clin Proc 83, 584–594. [DOI] [PMC free article] [PubMed] [Google Scholar]
- 4. Rami‐Porta R, Asamura H, Travis WD & Rusch VW (2017) Lung cancer – major changes in the American Joint Committee on Cancer eighth edition cancer staging manual. CA Cancer J Clin 67, 138–155. [DOI] [PubMed] [Google Scholar]
- 5. Tang S, Pan Y, Wang Y, Hu L, Cao S, Chu M, Dai J, Shu Y, Xu L, Chen J et al (2015) Genome‐wide association study of survival in early‐stage non‐small cell lung cancer. Ann Surg Oncol 22, 630–635. [DOI] [PubMed] [Google Scholar]
- 6. Heyn H & Esteller M (2012) DNA methylation profiling in the clinic: applications and challenges. Nat Rev Genet 13, 679–692. [DOI] [PubMed] [Google Scholar]
- 7. Zoumpoulidou G, Broceno C, Li H, Bird D, Thomas G & Mittnacht S (2012) Role of the tripartite motif protein 27 in cancer development. J Natl Cancer Inst 104, 941–952. [DOI] [PubMed] [Google Scholar]
- 8. Iwakoshi A, Murakumo Y, Kato T, Kitamura A, Mii S, Saito S, Yatabe Y & Takahashi M (2012) RET finger protein expression is associated with prognosis in lung cancer with epidermal growth factor receptor mutations. Pathol Int 62, 324–330. [DOI] [PubMed] [Google Scholar]
- 9. Ozato K, Shin DM, Chang TH & Morse HC III (2008) TRIM family proteins and their emerging roles in innate immunity. Nat Rev Immunol 8, 849–860. [DOI] [PMC free article] [PubMed] [Google Scholar]
- 10. Skalova A, Vanecek T, Uro‐Coste E, Bishop JA, Weinreb I, Thompson LDR, de Sanctis S, Schiavo‐Lena M, Laco J, Badoual C et al (2018) Molecular profiling of salivary gland intraductal carcinoma revealed a subset of tumors harboring NCOA4‐RET and novel TRIM27‐RET fusions: a report of 17 cases. Am J Surg Pathol 42, 1445–1455. [DOI] [PubMed] [Google Scholar]
- 11. Zhang HX, Xu ZS, Lin H, Li M, Xia T, Cui K, Wang SY, Li Y, Shu HB & Wang YY (2018) TRIM27 mediates STAT3 activation at retromer‐positive structures to promote colitis and colitis‐associated carcinogenesis. Nat Commun 9, 3441. [DOI] [PMC free article] [PubMed] [Google Scholar]
- 12. Takahashi M, Ritz J & Cooper GM (1985) Activation of a novel human transforming gene, ret, by DNA rearrangement. Cell 42, 581–588. [DOI] [PubMed] [Google Scholar]
- 13. Wang R, Hu H, Pan Y, Li Y, Ye T, Li C, Luo X, Wang L, Li H, Zhang Y et al (2012) RET fusions define a unique molecular and clinicopathologic subtype of non‐small‐cell lung cancer. J Clin Oncol 30, 4352–4359. [DOI] [PubMed] [Google Scholar]
- 14. Zhang R, Chen C, Dong X, Shen S, Lai L, He J, You D, Lin L, Zhu Y, Huang H et al (2020) Independent validation of early‐stage NSCLC prognostic scores incorporating epigenetic and transcriptional biomarkers with gene‐gene interactions and main effects. Chest 158, 808–819. [DOI] [PMC free article] [PubMed] [Google Scholar]
- 15. Zhang R, Lai L, Dong X, He J, You D, Chen C, Lin L, Zhu Y, Huang H, Shen S et al (2019) SIPA1L3 methylation modifies the benefit of smoking cessation on lung adenocarcinoma survival: an epigenomic‐smoking interaction analysis. Mol Oncol 13, 1235–1248. [DOI] [PMC free article] [PubMed] [Google Scholar]
- 16. Zhang R, Lai L, He J, Chen C, You D, Duan W, Dong X, Zhu Y, Lin L, Shen S et al (2019) EGLN2 DNA methylation and expression interact with HIF1A to affect survival of early‐stage NSCLC. Epigenetics 14, 118–129. [DOI] [PMC free article] [PubMed] [Google Scholar]
- 17. Guo Y, Zhang R, Shen S, Wei Y, Salama SM, Fleischer T, Bjaanaes MM, Karlsson A, Planck M, Su L et al (2018) DNA methylation of LRRC3B: a biomarker for survival of early‐stage non‐small cell lung cancer patients. Cancer Epidemiol Biomarkers Prev 27, 1527–1535. [DOI] [PMC free article] [PubMed] [Google Scholar]
- 18. Wei Y, Liang J, Zhang R, Guo Y, Shen S, Su L, Lin X, Moran S, Helland A, Bjaanaes MM et al (2018) Epigenetic modifications in KDM lysine demethylases associate with survival of early‐stage NSCLC. Clin Epigenetics 10, 41. [DOI] [PMC free article] [PubMed] [Google Scholar]
- 19. Shen S, Zhang R, Guo Y, Loehrer E, Wei Y, Zhu Y, Yuan Q, Moran S, Fleischer T, Bjaanaes MM et al (2018) A multi‐omic study reveals BTG2 as a reliable prognostic marker for early‐stage non‐small cell lung cancer. Mol Oncol 12, 913–924. [DOI] [PMC free article] [PubMed] [Google Scholar]
- 20. Dong X, Zhang R, He J, Lai L, Alolga RN, Shen S, Zhu Y, You D, Lin L, Chen C et al (2019) Trans‐omics biomarker model improves prognostic prediction accuracy for early‐stage lung adenocarcinoma. Aging (Albany NY) 11, 6312–6335. [DOI] [PMC free article] [PubMed] [Google Scholar]
- 21. Shen S, Wei Y, Zhang R, Du M, Duan W, Yang S, Zhao Y, Christiani DC & Chen F (2018) Mutant‐allele fraction heterogeneity is associated with non‐small cell lung cancer patient survival. Oncol Lett 15, 795–802. [DOI] [PMC free article] [PubMed] [Google Scholar]
- 22. Joo JE, Dowty JG, Milne RL, Wong EM, Dugue PA, English D, Hopper JL, Goldgar DE, Giles GG & Southey MC (2018) Heritable DNA methylation marks associated with susceptibility to breast cancer. Nat Commun 9, 867. [DOI] [PMC free article] [PubMed] [Google Scholar]
- 23. Widschwendter M, Zikan M, Wahl B, Lempiainen H, Paprotka T, Evans I, Jones A, Ghazali S, Reisel D, Eichner J et al (2017) The potential of circulating tumor DNA methylation analysis for the early detection and management of ovarian cancer. Genome Med 9, 116. [DOI] [PMC free article] [PubMed] [Google Scholar]
- 24. Egger G, Liang G, Aparicio A & Jones PA (2004) Epigenetics in human disease and prospects for epigenetic therapy. Nature 429, 457–463. [DOI] [PubMed] [Google Scholar]
- 25. Feinberg AP & Tycko B (2004) The history of cancer epigenetics. Nat Rev Cancer 4, 143–153. [DOI] [PubMed] [Google Scholar]
- 26. Bolund ACS, Starnawska A, Miller MR, Schlunssen V, Backer V, Borglum AD, Christensen K, Tan Q, Christiansen L & Sigsgaard T (2017) Lung function discordance in monozygotic twins and associated differences in blood DNA methylation. Clin Epigenetics 9, 132. [DOI] [PMC free article] [PubMed] [Google Scholar]
- 27. Lee KW & Pausova Z (2013) Cigarette smoking and DNA methylation. Front Genet 4, 132. [DOI] [PMC free article] [PubMed] [Google Scholar]
- 28. Shui IM, Wong CJ, Zhao S, Kolb S, Ebot EM, Geybels MS, Rubicz R, Wright JL, Lin DW, Klotzle B et al (2016) Prostate tumor DNA methylation is associated with cigarette smoking and adverse prostate cancer outcomes. Cancer 122, 2168–2177. [DOI] [PMC free article] [PubMed] [Google Scholar]
- 29. Hecht SS (2012) Lung carcinogenesis by tobacco smoke. Int J Cancer 131, 2724–2732. [DOI] [PMC free article] [PubMed] [Google Scholar]
- 30. Wingo PA, Ries LA, Giovino GA, Miller DS, Rosenberg HM, Shopland DR, Thun MJ & Edwards BK (1999) Annual report to the nation on the status of cancer, 1973–1996, with a special section on lung cancer and tobacco smoking. J Natl Cancer Inst 91, 675–690. [DOI] [PubMed] [Google Scholar]
- 31. Asomaning K, Miller DP, Liu G, Wain JC, Lynch TJ, Su L & Christiani DC (2008) Second hand smoke, age of exposure and lung cancer risk. Lung Cancer 61, 13–20. [DOI] [PMC free article] [PubMed] [Google Scholar]
- 32. Sandoval J, Mendez‐Gonzalez J, Nadal E, Chen G, Carmona FJ, Sayols S, Moran S, Heyn H, Vizoso M, Gomez A et al (2013) A prognostic DNA methylation signature for stage I non‐small‐cell lung cancer. J Clin Oncol 31, 4140–4147. [DOI] [PubMed] [Google Scholar]
- 33. Bjaanaes MM, Fleischer T, Halvorsen AR, Daunay A, Busato F, Solberg S, Jorgensen L, Kure E, Edvardsen H, Borresen‐Dale AL et al (2016) Genome‐wide DNA methylation analyses in lung adenocarcinomas: association with EGFR, KRAS and TP53 mutation status, gene expression and prognosis. Mol Oncol 10, 330–343. [DOI] [PMC free article] [PubMed] [Google Scholar]
- 34. Karlsson A, Jonsson M, Lauss M, Brunnstrom H, Jonsson P, Borg A, Jonsson G, Ringner M, Planck M & Staaf J (2014) Genome‐wide DNA methylation analysis of lung carcinoma reveals one neuroendocrine and four adenocarcinoma epitypes associated with patient outcome. Clin Cancer Res 20, 6127–6140. [DOI] [PubMed] [Google Scholar]
- 35. Chen YA, Lemire M, Choufani S, Butcher DT, Grafodatskaya D, Zanke BW, Gallinger S, Hudson TJ & Weksberg R (2013) Discovery of cross‐reactive probes and polymorphic CpGs in the Illumina Infinium HumanMethylation450 microarray. Epigenetics 8, 203–209. [DOI] [PMC free article] [PubMed] [Google Scholar]
- 36. Marabita F, Almgren M, Lindholm ME, Ruhrmann S, Fagerstrom‐Billai F, Jagodic M, Sundberg CJ, Ekstrom TJ, Teschendorff AE, Tegner J et al (2013) An evaluation of analysis pipelines for DNA methylation profiling using the Illumina HumanMethylation450 BeadChip platform. Epigenetics 8, 333–346. [DOI] [PMC free article] [PubMed] [Google Scholar]
- 37. Benjamini Y & Hochberg Y (1995) Controlling the false discovery rate: a practical and powerful approach to multiple testing. J R Stat Soc Series B Stat Methodol 57, 289–300. [Google Scholar]
- 38. Boyle EA, Li YI & Pritchard JK (2017) An expanded view of complex traits: from polygenic to omnigenic. Cell 169, 1177–1186. [DOI] [PMC free article] [PubMed] [Google Scholar]
- 39. Devarakonda S, Morgensztern D & Govindan R (2015) Genomic alterations in lung adenocarcinoma. Lancet Oncol 16, e342–e351. [DOI] [PubMed] [Google Scholar]
- 40. Cancer Genome Atlas Research Network (2012) Comprehensive genomic characterization of squamous cell lung cancers. Nature 489, 519–525. [DOI] [PMC free article] [PubMed] [Google Scholar]
- 41. Campbell JD, Alexandrov A, Kim J, Wala J, Berger AH, Pedamallu CS, Shukla SA, Guo G, Brooks AN, Murray BA et al (2016) Distinct patterns of somatic genome alterations in lung adenocarcinomas and squamous cell carcinomas. Nat Genet 48, 607–616. [DOI] [PMC free article] [PubMed] [Google Scholar]
- 42. Ando M, Saito Y, Xu G, Bui NQ, Medetgul‐Ernar K, Pu M, Fisch K, Ren S, Sakai A, Fukusumi T et al (2019) Chromatin dysregulation and DNA methylation at transcription start sites associated with transcriptional repression in cancers. Nat Commun 10, 2188. [DOI] [PMC free article] [PubMed] [Google Scholar]
- 43. Baylin SB & Jones PA (2011) A decade of exploring the cancer epigenome – biological and translational implications. Nat Rev Cancer 11, 726–734. [DOI] [PMC free article] [PubMed] [Google Scholar]
- 44. Wagner JR, Busche S, Ge B, Kwan T, Pastinen T & Blanchette M (2014) The relationship between DNA methylation, genetic and expression inter‐individual variation in untransformed human fibroblasts. Genome Biol 15, R37. [DOI] [PMC free article] [PubMed] [Google Scholar]
- 45. van Eijk KR, de Jong S, Boks MP, Langeveld T, Colas F, Veldink JH, de Kovel CG, Janson E, Strengman E, Langfelder P et al (2012) Genetic analysis of DNA methylation and gene expression levels in whole blood of healthy human subjects. BMC Genom 13, 636. [DOI] [PMC free article] [PubMed] [Google Scholar]
- 46. Zhang D, Cheng L, Badner JA, Chen C, Chen Q, Luo W, Craig DW, Redman M, Gershon ES & Liu C (2010) Genetic control of individual differences in gene‐specific methylation in human brain. Am J Hum Genet 86, 411–419. [DOI] [PMC free article] [PubMed] [Google Scholar]
- 47. Maurano MT, Wang H, John S, Shafer A, Canfield T, Lee K & Stamatoyannopoulos JA (2015) Role of DNA methylation in modulating transcription factor occupancy. Cell Rep 12, 1184–1195. [DOI] [PubMed] [Google Scholar]
- 48. Iurato S, Carrillo‐Roa T, Arloth J, Czamara D, Diener‐Hölzl L, Lange J, Müller‐Myhsok B, Binder EB & Erhardt A (2017) DNA Methylation signatures in panic disorder. Transl Psychiatry 7, 1287. [DOI] [PMC free article] [PubMed] [Google Scholar]
- 49. Banfield E, Brown AL, Peckham EC, Rednam SP, Murray J, Okcu MF, Mitchell LE, Chintagumpala MM, Lau CC, Scheurer ME et al (2016) Exploratory analysis of ERCC2 DNA methylation in survival among pediatric medulloblastoma patients. Cancer Epidemiol 44, 161–166. [DOI] [PMC free article] [PubMed] [Google Scholar]
- 50. McNab FW, Rajsbaum R, Stoye JP & O'Garra A (2011) Tripartite‐motif proteins and innate immune regulation. Curr Opin Immunol 23, 46–56. [DOI] [PubMed] [Google Scholar]
- 51. Turkson J (2004) STAT proteins as novel targets for cancer drug discovery. Expert Opin Ther Targets 8, 409–422. [DOI] [PubMed] [Google Scholar]
- 52. Wang CY, Chao TT, Tai WT, Chang FY, Su WP, Chen YL, Chen PT, Weng CY, Yuan A, Shiau CW et al (2014) Signal transducer and activator of transcription 3 as molecular therapy for non‐small‐cell lung cancer. J Thorac Oncol 9, 488–496. [DOI] [PubMed] [Google Scholar]
- 53. Huang YT, Lin X, Liu Y, Chirieac LR, McGovern R, Wain J, Heist R, Skaug V, Zienolddiny S, Haugen A et al (2011) Cigarette smoking increases copy number alterations in nonsmall‐cell lung cancer. Proc Natl Acad Sci USA 108, 16345–16350. [DOI] [PMC free article] [PubMed] [Google Scholar]
- 54. Barbieri SS, Ruggiero L, Tremoli E & Weksler BB (2008) Suppressing PTEN activity by tobacco smoke plus interleukin‐1beta modulates dissociation of VE‐cadherin/beta‐catenin complexes in endothelium. Arterioscler Thromb Vasc Biol 28, 732–738. [DOI] [PubMed] [Google Scholar]
- 55. Qian X, Li X, Shi Z, Xia Y, Cai Q, Xu D, Tan L, Du L, Zheng Y, Zhao D et al (2019) PTEN suppresses glycolysis by dephosphorylating and inhibiting autophosphorylated PGK1. Mol Cell 76, 516–527.e7. [DOI] [PubMed] [Google Scholar]
- 56. Cumberbatch M, Tang X, Beran G, Eckersley S, Wang X, Ellston RP, Dearden S, Cosulich S, Smith PD, Behrens C et al (2014) Identification of a subset of human non‐small cell lung cancer patients with high PI3Kbeta and low PTEN expression, more prevalent in squamous cell carcinoma. Clin Cancer Res 20, 595–603. [DOI] [PMC free article] [PubMed] [Google Scholar]
- 57. Iliopoulos D, Jaeger SA, Hirsch HA, Bulyk ML & Struhl K (2010) STAT3 activation of miR‐21 and miR‐181b‐1 via PTEN and CYLD are part of the epigenetic switch linking inflammation to cancer. Mol Cell 39, 493–506. [DOI] [PMC free article] [PubMed] [Google Scholar]
- 58. Su CC, Li SY, Yen YC, Nian JH, Liang WG & Yang JJ (2013) Mechanism of two novel human GJC3 missense mutations in causing non‐syndromic hearing loss. Cell Biochem Biophys 66, 277–286. [DOI] [PubMed] [Google Scholar]
- 59. Okada Y, Hirota T, Kamatani Y, Takahashi A, Ohmiya H, Kumasaka N, Higasa K, Yamaguchi‐Kabata Y, Hosono N, Nalls MA et al (2011) Identification of nine novel loci associated with white blood cell subtypes in a Japanese population. PLoS Genet 7, e1002067. [DOI] [PMC free article] [PubMed] [Google Scholar]
- 60. Aston KI, Krausz C, Laface I, Ruiz‐Castane E & Carrell DT (2010) Evaluation of 172 candidate polymorphisms for association with oligozoospermia or azoospermia in a large cohort of men of European descent. Hum Reprod 25, 1383–1397. [DOI] [PubMed] [Google Scholar]
- 61. Lee IW, Kuan LC, Lin CH, Pan HA, Hsu CC, Tsai YC, Kuo PL & Teng YN (2008) Association of USP26 haplotypes in men in Taiwan, China with severe spermatogenic defect. Asian J Androl 10, 896–904. [DOI] [PubMed] [Google Scholar]
Associated Data
This section collects any data citations, data availability statements, or supplementary materials included in this article.
Supplementary Materials
Fig. S1. Quality control processes for DNA methylation chip data.
Fig. S2. Methylation–smoking interaction on survival of LUSC patients excluding never smokers.
Fig. S3. Kaplan–Meier overall survival (OS) curves of LUAD, LUSC and overall NSCLC patients excluding never smokers. (A,B) LUAD patients, (C,D) LUSC patients and (E,F) overall patients. Hazard ratio (HR) and P value were derived from a Cox proportional hazards regression model adjusted for age, sex, smoking status, clinical stage, and study centre. P Heterogeneity was used to evaluate heterogeneity of HRs across groups.
Fig. S4. Kaplan–Meier overall survival (OS) curves of LUAD, LUSC and overall NSCLC patients. (A,B) LUAD patients, (C,D) LUSC patients and (E,F) overall patients. Hazard ratio (HR) and P value were derived from a Cox proportional hazards regression model adjusted for age, sex, clinical stage, pack‐year of smoking and study centre. P Trend was used to evaluate trend of HRs across groups.
Fig. S5. Kaplan–Meier overall survival (OS) curves of TCGA cases by low or high TRIM27 expression. The gene expression divided into low and high groups by median value (10.26). Hazard ratio (HR) and P value were derived from a Cox proportional hazards regression model adjusted for age, sex, smoking status, clinical stage, and study centre.
Fig. S6. Genome‐wide methylation transcription analysis of LUSC patients from the TCGA cohort. (A) Circos plot of genome‐wide gene expression. For plots in B–D, left panels show correlation of (B) USP26, (C) GJC3 or (D) NAALAD2 expression (X‐axis) with methylation level at cg05293407TRIM27 (Y‐axis). Right panels show Kaplan–Meier survival plots of gene expression divided into low and high groups by median value.
Fig. S7. Distribution of maximum value of all 311891 CpG probes in non‐small‐cell lung cancer (NSCLC) patients.
Table S1. Demographic and clinical characteristics of early‐stage NSCLC patients with gene expression data derived from TCGA.
Table S2. Annotation information for 96 CpG probes located in TRIM27.
Table S3. Results of association analysis of 96 DNA methylation probes of TRIM27 in LUAD samples.
Table S4. Results of association analysis of 96 CpG probes of TRIM27 in LUSC samples.
Table S5. Results of proportional hazards test for 96 CpG probes of TRIM27 in LUSC samples.
Table S6. Comparison of smoking‐related characteristics of former and current smokers between early‐stage LUAD and LUSC.
Table S7. Results of genome‐wide methylation transcription analysis of 29 genes significantly associated with cg05293407 in TCGA LUSC samples.
Data Availability Statement
The DNA methylation image data of Harvard, Spain, Norway and Sweden study cohort can be requested from DCC, ME, ÅH and JS, respectively. Alternatively, it can be retrieved from gene expression omnibus database (GSE39279, GSE66836 and GSE56044). TCGA: https://tcga‐data.nci.nih.gov; now hosted at GDC: https://portal.gdc.cancer.gov.