

Abstract
Aim:
This study aimed to investigate the function of genome-wide association study (GWAS)-identified variants associated with alcohol use disorder (AUD)/comorbid psychiatric disorders.
Materials & methods:
Genome-wide genotype, transcriptome and DNA methylome data were obtained from postmortem prefrontal cortex (PFC) of 48 Caucasians (24 AUD cases/24 controls). Expression/methylation quantitative trait loci (eQTL/mQTL) were identified and their enrichment in GWAS signals for the above disorders were analyzed.
Results:
PFC cis-eQTLs (923 from cases+controls, 27 from cases and 98 from controls) and cis-mQTLs (9,932 from cases+controls, 264 from cases and 695 from controls) were enriched in GWAS-identified genetic variants for the above disorders. Cis-eQTLs from AUD cases were mapped to morphine addiction-related genes.
Conclusion:
PFC cis-eQTLs/cis-mQTLs influence gene expression/DNA methylation patterns, thus increasing the disease risk.
Keywords: : alcohol use disorder, enrichment analysis, expression quantitative trait loci, genome-wide association study, human prefrontal cortex, methylation quantitative trait loci
Alcohol use disorder (AUD), including alcohol abuse and dependence, is a psychiatric condition caused by the interaction of genetic and environmental factors. It is characterized by compulsive alcohol use, loss of control over drinking and alcohol withdrawal symptoms. About 6.2% (or 15.1 million) American adults aged 18 and above have AUD [1]. Quantitative genetic studies suggest a heritability of approximately 50% for AUD [2]. To understand the genetic mechanisms of AUD, a number of genome-wide association studies (GWAS) have been conducted [3–9]. AUD-associated variants or SNPs (identified by GWAS) are mainly located in noncoding regions, although several AUD-associated coding variants have been found in alcohol metabolizing genes including ADH1 and ALDH2 genes. Similarly, GWAS has also identified a large number of noncoding variants associated with other psychiatric disorders. For protein-coding variants, it is relatively easier to understand their function as they may change the encoded protein sequence or influence mRNA stability. It is a challenge to interpret the function of disease-associated noncoding variants. Additionally, several studies explored the epigenetic mechanisms of AUD by examining AUD-associated DNA methylomic changes [10–12].
Disease-associated noncoding variants potentially affect gene transcription, alternative splicing and allele-specific expression, and thus contribute to an increased/decreased risk of the disease. Functional study approaches, such as luciferase reporter gene assay and electrophoretic mobility shift assay, have been applied to validate the function of individual noncoding variants. For example, we used luciferase reporter gene assay and electrophoretic mobility shift assay to examine the function of an opioid dependence-associated variant (or SNP rs569356) located in the promoter region of OPRD1 [13]. Moreover, the genome editing approach has been used to study the function of noncoding variants. For example, CRISPR/Cas9-mediated genome editing demonstrated that two noncoding SNPs (rs1345417 and rs12651896) affect the transcription of SOX2 and FOXD1 genes that participate in hair development [14]. However, functional study experiments are costly and time-consuming. It is unrealistic to use the above approaches to study the function of every disease-associated noncoding variant. A more efficient way is to prioritize disease-associated noncoding variants and then validate their regulatory functions by functional study approaches.
Functional genomics studies can pinpoint potentially regulatory variants from a large number of noncoding variants by investigating the relationship between genotypes and gene expression or epigenetic events (e.g., DNA methylation) at the genome-wide level. Genetic variants that influence gene expression are referred to as expression quantitative trait loci (eQTLs). Similarly, genetic variants that impact DNA methylation are called methylation quantitative trait loci (mQTLs). These genetic variants are further categorized as cis- or trans-acting, depending on the physical distance between variants and the transcript (or the CpG site) they regulate. Conventionally, variants that are within 1 Mb (megabase) from the transcription start site (or a CpG site) are considered to be cis-acting, while those that are over 1 Mb away from the transcription start site (or a CpG site) or on a different chromosome are considered to be trans-acting. There is an enrichment of cis- versus trans-eQTLs (or mQTLs) [15] because genetic variants are more likely to regulate gene transcription (or DNA methylation) locally. Additionally, the power to identify trans-eQTLs (or trans-mQTLs) is low, due to the need to control millions of potential false positives.
Mapping eQTLs and mQTLs using genome-wide genotype, transcriptome and DNA methylome data can provide an unbiased approach to identify novel functional variants. One critical issue of the eQTL/mQTL analysis is that the role of genetic variants in regulating gene expression (or DNA methylation) can be tissue- or cell-specific. For instance, eQTLs (or mQTLs) identified in the peripheral blood may have no regulatory function in the brain, given that the expression (or DNA methylation) of many genes is tissue- or cell-specific [16,17]. The Genotype-Tissue Expression (GTEx) database is a valuable resource for studying tissue-specific gene expression and regulation as well as mapping tissue-specific eQTLs [18]. It includes genome-wide genotype and gene expression data from 53 tissue types (including tissues from 13 different brain regions) across nearly 1000 subjects. The eQTLs identified by GTEx have been widely used to interpret GWAS-identified noncoding variants [19–21]. Nevertheless, these eQTLs may not be disease-specific, even though they may regulate the expression of genes involved in maintaining the function of specific tissues or cells. To unravel causal variants from disease-associated loci, it would be necessary to map eQTLs and mQTLs in both patients and controls. Those eQTLs and mQTLs appearing in patients are more likely to be causal variants for the disease. Identification of disease- and tissue-specific eQTLs and mQTLs will help disentangle the role of the specific tissue in disease development as well.
The prefrontal cortex (PFC) carries out a number of important executive functions such as working memory, attentional control and cognitive inhibition and flexibility. There is evidence that dysfunction of the PFC leads to impulsive behavior and lack of control over drinking, the two major characteristics of AUD [22]. Additionally, PFC-related impairments in cognitive control or working memory have been observed in patients with schizophrenia (SCZ) [23–25], bipolar disorder (BIP) [26–28], major depressive disorder (MDD) [29,30] and attention-deficit/hyperactivity disorder (ADHD) [27,31] as well as a number of other central nervous system disorders. Therefore, in the present study, we mapped eQTLs and mQTLs in the PFC of AUD patients and matched control subjects by integrative analyses of genome-wide SNP genotype, mRNA transcriptome and DNA methylome data. As AUD is comorbid with SCZ [32,33], BIP [34–37], MDD [38,39] and ADHD [40–43], we further examined the co-localization of PFC eQTLs/mQTLs and GWAS-identified SNPs (mainly noncoding SNPs) that were associated with AUD [4] as well as comorbid SCZ [44], BIP [45], MDD [46] and ADHD [47]. Our study demonstrated the enrichment of PFC eQTLs/mQTLs in the above psychiatric disorder-associated genetic variants identified by GWAS.
Materials & methods
Postmortem PFC tissues
Postmortem brain tissue samples (n = 48) were obtained from the New South Wales Tissue Resource Centre at the University of Sydney. The New South Wales Tissue Resource Centre is partially sponsored by the National Institute on Alcohol Abuse and Alcoholism for collecting human brain tissues for alcohol-related research. It has ethics approval from the Sydney Local Health Network and The University of Sydney. These brain tissue samples were dissected from Brodmann area 9 (BA9, mainly the dorsolateral PFC) of postmortem brains of 48 European Australians. Half of the subjects (16 males and 8 females) were diagnosed with alcohol abuse (n = 15) or dependence (n = 9), but they did not use illegal drugs of abuse or were not diagnosed with major psychotic disorders (such as SCZ and BIP) according to the criteria in the Diagnostic and Statistical Manual of Mental Disorders 4th Edition (DSM-IV) [48]. The other half of the subjects were sex- and age-matched healthy controls, who were free of alcohol or drug abuse or dependence or major psychotic disorders.
Genotyping
Genomic DNA was extracted from the above 48 postmortem PFC tissue samples using the QIAamp DNA Micro Kit (Qiagen, CA, USA), and was checked for quality by 0.7% agarose gel and quantified using a NanoDrop™ 8000 spectrophotometer (Thermo Fisher Scientific, MA, USA). These DNA samples (500 ng/sample) were genotyped using the Illumina HumanCoreExome-12 v1.0 BeadChip (Illumina, CA, USA) following the Illumina Infinium HD Array Super Manual Protocol. The BeadChip contains two sets of SNPs (538,448 SNPs in total): over 240,000 tagSNPs from the Illumina HumanCore BeadChip and over 240,000 exome-focused SNPs from the Illumina HumanExome BeadChip. The genotype data were processed using the Illumina GenomeStudio software V2011.1 (Genotyping Module V1.9.4) and verified by the zCall program [49]. SNPs were excluded from eQTL and mQTL analyses if they met any of the following criteria: GenCall score ≤0.15 at any sample; minor allele frequency <0.05; p-value of Hardy–Weinberg equilibrium test <0.001; missing genotyping rate >10%. After the above data quality control process, 254,374 SNPs remained for eQTL and mQTL analyses. The genotype data have been deposited in the National Center for Biotechnology Information (NCBI) dbGaP database (Accession Number: phs001981.v1.p1).
DNA methylome profiling
The above 48 genomic DNA samples (500 ng/sample) were treated with bisulfite reagents included in the EZ-96 DNA methylation kit (Zymo Research, CA, USA) according to the manufacturer’s protocol. The genome-wide DNA methylation (or DNA methylome) was profiled using the Illumina Infinium HumanMethylation450 BeadChip (Illumina), following the Illumina Infinium HD Methylation protocol [50]. This BeadChip interrogates 485,577 CpGs across the genome [50]. The raw DNA methylome data were processed using the Illumina GenomeStudio software V2011.1 (Methylation Module V1.9.0) to generate β values for CpG sites, with β values ranging from 0 (0% methylation) to 1.0 (100% methylation). After the data quality control process as described in our previous study [51], 430,407 CpGs remained for the mQTL analysis. The DNA methylome data have been deposited in the NCBI Gene Expression Omnibus (GEO) database (Accession Number: GSE49393).
mRNA expression microarray assays
Total RNAs were isolated from about 10 mg of the above 48 frozen postmortem PFC tissues using the miRNeasy Mini Kit (Qiagen). RNA concentration was measured using a NanoDrop™ 8000 spectrophotometer (Thermo Fisher Scientific) and the RNA Integrity Number (RIN) was measured on an Agilent 2100 Bioanalyzer (Agilent Technologies, CA, USA). PFC mRNA transcriptomes were profiled using the Illumina HumanHT-12 v4 Expression BeadChip (Illumina) (one female AUD and one female control subjects were not included in the assay). The Illumina protocol (Illumina) was described in our previous study [52]. This array provides coverage of the transcribed human genome using 47,231 probe sets and thus captures the expression of more than 31,000 annotated genes. Probe intensity and gene expression data were analyzed using Illumina GenomeStudio software V2011.1 (Gene Expression Module V1.9.0). After the data quality control process as previously described [52], there were 21,521 transcripts remained for the eQTL analysis. The transcriptome data have been deposited in the NCBI GEO database (Accession Number: GSE49376).
eQTL & mQTL analyses
The correlation of SNP genotypes with gene expression (or DNA methylation) levels was analyzed by QTLtools [53]. The genotype of a SNP was coded as 0, 1 or 2 under an additive model. Linear regression models were used to assess the effect of SNPs on expression levels of transcripts (or methylation levels of CpG sites), adjusted for sex, age, postmortem interval, RIN and AUD status. SNPs showing a significant association with gene expression were referred to as eQTLs, while SNPs showing a significant association with DNA methylation were called mQTLs. Due to the potential linkage disequilibrium between genetic variants, we used an empirical false discovery rate (FDR) [54,55] to account for multiple testing. At each permutation, we randomly assigned the sample labels of gene expression data (or DNA methylation data) and then tested their association with genetic variants. The empirical FDR was estimated to be the ratio of the average number of associations from the permuted samples to the actual number of associations in the real data. 1000 permutations were performed to obtain a stable FDR estimation [54,55]. The estimation of FDR was performed for eQTLs and mQTLs, separately. Significant eQTLs and mQTLs were defined as those with the FDR <5%. Given the small number of the brain tissue samples, trans-eQTL and trans-mQTL analyses were not performed. The function of genes with expression or DNA methylation potentially impacted by PFC eQTLs/mQTLs was annotated by Enrichr [56]. Additionally, the overlap of PFC eQTLs with eQTLs identified in GTEx tissues [18] was analyzed.
Analysis of the enrichment of PFC eQTLs/mQTLs in disease-associated variants
We examined the co-localization of PFC eQTLs/mQTLs with GWAS signals for AUD and related psychiatric disorders. GWAS summary statistics for AUD [4], SCZ [44], BIP [45], MDD [46] and ADHD [47] were downloaded from the Psychiatric Genomics Consortium database (www.med.unc.edu/pgc/results-and-downloads/). All these GWAS were performed among participants of European descent. We examined the association of PFC cis-eQTLs (empirical FDR <0.05) and cis-mQTLs (empirical FDR <0.05) with each disorder, and compared them with a randomly selected SNP set with the same number of SNPs by the Kolmogorov–Smirnov test. Significant enrichment was claimed if the two-sided p-value was less than 0.05. In addition, we analyzed the enrichment of PFC eQTLs/mQTLs in 15,831 unique SNPs (p < 5 × 10⁻⁸) that were associated with 1,564 other complex disorders or traits that were available at the GWAS catalog (www.ebi.ac.uk/gwas/; accessed on 10 May 2018) by the Fisher’s exact test.
Results
PFC tissue sample descriptive statistics
As shown in Table 1, postmortem PFC tissues from 24 AUD patients (16 males and 8 females) and 24 control subjects (16 males and 8 females) were included in this study. There were no significant differences between AUD patients and control subjects in terms of age (55 ± 11 vs 56 ± 12 years), postmortem intervals (39.5 ± 14.7 vs 32.6 ± 13.1 h) and RIN (7.2 ± 1.2 vs 7.4 ± 0.8). The average alcohol consumption per day among AUD patients was 191.2 ± 152.0 g, which was significantly higher than that of control subjects (11.1 ± 8.9 g per day) (p = 2.8 × 10⁻⁹).
Table 1. . Characteristics of study samples.
| Variable | Subjects with alcohol use disorder (n = 24)† | Controls (n = 24) | p-value‡ |
|---|---|---|---|
| Males, n (%) | 16 (66.7%) | 16 (66.7%) | 1.000 |
| Age, years | 56 ± 12 | 55 ± 11 | 0.606 |
| PMI, h | 33 ± 13 | 40 ± 15 | 0.114 |
| Alcohol consumption per day, g | 191 ± 152 | 11 ± 9 | 2.8 × 10⁻⁹ |
| RIN | 7.2 ± 1.2 | 7.4 ± 0.8 | 0.449 |
Data are means (±SD) or frequencies (percentages).
15 subjects with alcohol abuse and nine subjects with alcohol dependence.
p-values were calculated by Wilcoxon rank-sum tests for continuous variables or Fisher’s exact tests for categorical variables.
PMI: Post-mortem interval; RIN: RNA integrity number; SD: Standard deviation.
Cis-eQTLs identified in the PFC
As summarized in Table 2, 923 SNPs (or cis-eQTLs) were significantly associated with expression levels of 325 genes in the combined dataset (cases + controls) (FDR <0.05). These genes are enriched in pathways including Glutathione Metabolism, Chemical Carcinogenesis, Metabolism of Xenobiotics by Cytochrome P450, Antigen Processing and Presentation, RNA Polymerase, DNA Replication, Fluid Shear Stress and Atherosclerosis, Homologous Recombination and Drug Metabolism. When the eQTL analysis was performed in cases only, 27 SNPs (or cis-eQTLs) were significantly associated with expression levels of 15 genes (FDR <0.05; enriched in pathways including Protein Export and Morphine Addiction). When the eQTL analysis was performed in controls only, 98 SNPs (or cis-eQTLs) were significantly associated with expression levels of 50 genes (FDR <0.05; enriched in pathways including Glutathione Metabolism, Metabolism of Xenobiotics by Cytochrome P450, Chemical Carcinogenesis, TGF-β Signaling Pathway, Drug Metabolism and Fluid Shear Stress and Atherosclerosis). In addition, 12 cis-eQTLs potentially influenced expression levels of six genes (ATP5G2, IPO8, PADI4, RIPK5, RPS26 and USP36; enriched in the Ribosome pathway) in both cases and controls.
Table 2. . Significant cis-expression quantitative trait loci and cis-methylation quantitative trait loci (FDR < 0.05) identified in 48 human postmortem prefrontal cortex tissues.
| cis-eQTLs | cis-eQTL-associated genes | cis-mQTLs | cis-mQTL-associated CpGs | |
|---|---|---|---|---|
| Cases + Controls | 923 | 325 | 9,832 | 5,723 (3,966 CpGs mapped to 2,538 genes) |
| Cases | 27 | 15 | 264 | 192 (119 CpGs mapped to 106 genes) |
| Controls | 98 | 50 | 695 | 483 (319 CpGs mapped to 255 genes) |
Cases: Subjects with alcohol use disorder; Controls: Healthy control subjects.
eQTL: Expression quantitative trait locus; FDR: False discovery rate; mQTL: Methylation quantitative trait locus.
Cis-mQTLs identified in the PFC
As presented in Table 2, 9,382 SNPs (or cis-mQTLs) were significantly associated with methylation levels of 5,723 CpGs (including 3,966 CpGs mapped to 2,538 genes) in the combined dataset (cases + controls) (FDR <0.05). Among them, 295 were also cis-eQTLs, accounting for 32.0% of the above 923 cis-eQTLs identified in the PFC. When the mQTL analysis was performed in cases only, 264 SNPs (or cis-mQTLs) were significantly associated with methylation levels of 192 CpGs (including 119 CpGs mapped to 106 genes) (FDR <0.05). These 106 genes are enriched in pathways including Type I Diabetes Mellitus, Antigen Processing and Presentation, Human Papillomavirus Infection, Phagosome, Allograft Rejection, Graft-versus-host Disease, Viral Carcinogenesis, Human Cytomegalovirus Infection, Autoimmune Thyroid Disease, Pathogenic E. coli Infection, Viral Myocarditis, Endocytosis and Cell Adhesion Molecules. When the mQTL analysis was performed in controls only, 695 SNPs (or cis-mQTLs) were significantly associated with methylation levels of 483 CpGs (including 319 CpGs mapped to 255 genes) (FDR <0.05). These 255 genes are enriched in pathways including Type I Diabetes Mellitus, Allograft Rejection, Graft-versus-host Disease, Antigen Processing and Presentation, Autoimmune Thyroid Disease and Asthma Viral Myocarditis. In addition, 61 cis-mQTLs potentially influenced methylation levels of 66 CpGs (including 36 CpGs mapped to 30 genes) in both cases and controls. These 30 genes are enriched in pathways including Type I diabetes Mellitus, Antigen Processing and Presentation, Epstein-Barr Virus Infection, Viral Carcinogenesis, Human Immunodeficiency Virus 1 Infection, Human Cytomegalovirus Infection and Thermogenesis.
Overlap of PFC cis-eQTLs with eQTLs identified in GTEx tissues
Figure 1 shows the overlap of PFC cis-eQTLs obtained from the present study with those reported in GTEx, which includes eQTLs from 48 different tissues, each one with more than 70 samples. An average of 26.2% of PFC cis-eQTLs from our study appeared in at least one tissue in GTEx. Among all types of tissues, the tibial nerve shared the highest proportion (39.3%) of cis-eQTLs identified in the PFC. Altogether, 71.4% of PFC cis-eQTLs identified in the present study overlapped with eQTLs identified in at least one type of tissue in GTEx.
Figure 1. . Proportions of expression quantitative trait loci shared between the prefrontal cortex and 48 different tissues included in the Genotype-Tissue Expression database.
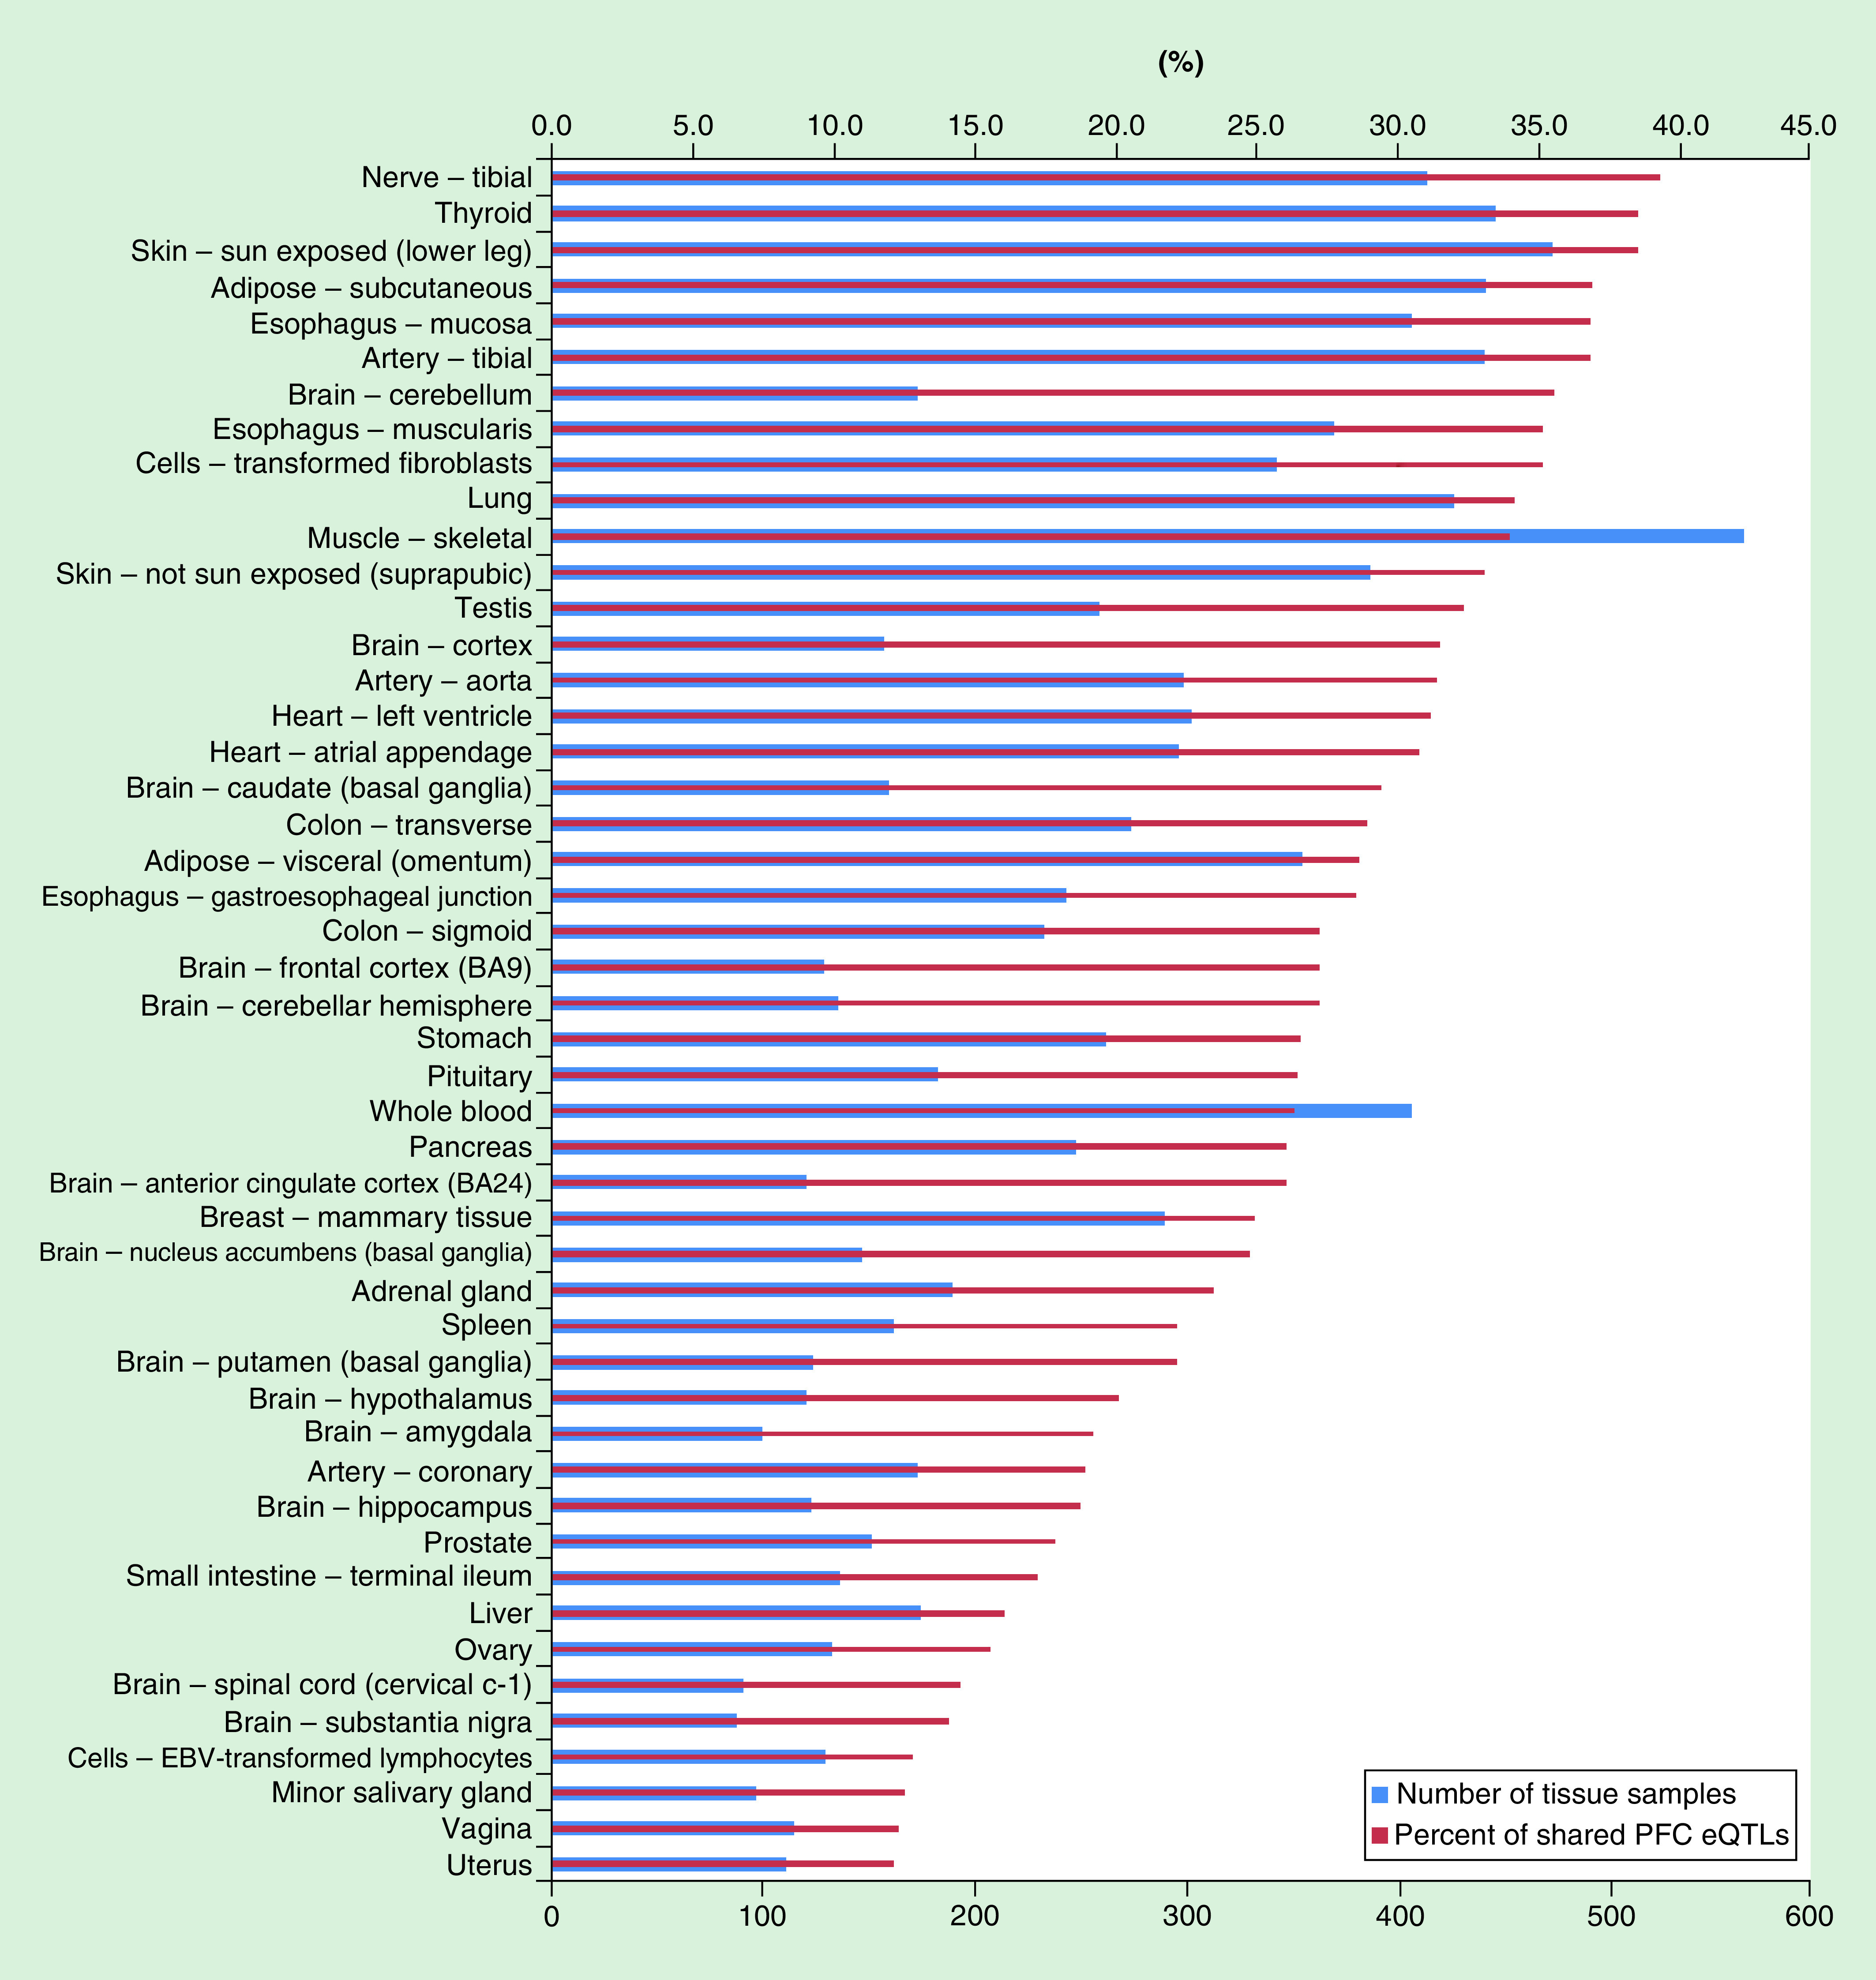
EBV: Epstein–Barr virus; eQTL: Expression quantitative trait locus; PFC: Prefrontal cortex.
Enrichment of PFC cis-eQTLs/cis-mQTLs in GWAS-identified SNPs associated with AUD & related psychiatric disorders as well as other diseases or traits
We examined the co-localization of PFC cis-eQTLs with GWAS signals for AUD and comorbid psychiatric disorders (SCZ, BIP, MDD and ADHD). The cis-eQTL enrichment analysis results are summarized in Table 3. PFC cis-eQTLs identified in all samples (cases and controls together) were significantly enriched in GWAS-identified SNPs that were associated with AUD (p = 0.011), SCZ (p = 2.2 × 10⁻¹⁶), BIP (p = 2.0 × 10⁻⁶), and MDD (p = 1.2 × 10⁻¹³). PFC cis-eQTLs identified in cases only were significantly enriched in GWAS-identified SNPs that were associated with SCZ (p = 0.002). PFC cis-eQTLs identified in controls only were significantly enriched in GWAS-identified SNPs that were associated with AUD (p = 0.012), SCZ (p = 1.8 × 10⁻⁵), BIP (p = 3.5 × 10⁻⁵), and MDD (p = 0.012).
Table 3. . Enrichment of prefrontal cortex cis-expression quantitative trait loci in genome-wide association study-identified variants associated with psychiatric disorders.
| Psychiatric | PFC cis-eQTLs (cases + controls) | PFC cis-eQTLs (cases only) | PFC cis-eQTLs (controls only) | |||
|---|---|---|---|---|---|---|
| disorders | Overlapped with GWAS SNPs | p-value | Overlapped with GWAS SNPs | p-value | Overlapped with GWAS SNPs | p-value |
| AUD | 915 | 0.011 | 27 | 0.223 | 96 | 0.012 |
| SCZ | 849 | 2.2 × 10⁻¹⁶ | 27 | 0.002 | 97 | 1.8 × 10⁻⁵ |
| BIP | 849 | 2.0 × 10⁻⁶ | 27 | 0.178 | 97 | 3.5 × 10⁻⁵ |
| MDD | 836 | 1.2 × 10⁻¹³ | 27 | 0.298 | 97 | 0.012 |
| ADHD | 909 | 0.918 | 27 | 0.056 | 96 | 0.189 |
ADHD: Attention-deficit/hyperactivity disorder; AUD: Alcohol use disorder; BIP: Bipolar disorder; eQTL: Expression quantitative trait locus; GWAS: Genome-wide association study; MDD: Major depressive disorder; PFC: Prefrontal cortex; SCZ: Schizophrenia.
The cis-mQTL enrichment analysis results are summarized in Table 4. PFC cis-mQTLs identified in all samples (cases and controls together) were significantly enriched in GWAS-identified SNPs that were associated with AUD (p = 1.2 × 10⁻¹⁰), SCZ (p = 2.2 × 10⁻¹⁶), BIP (p = 2.2 × 10⁻¹⁶), and MDD (p = 2.2 × 10⁻¹⁶). PFC cis-mQTLs identified in cases only were significantly enriched in GWAS-identified SNPs that were associated with SCZ (p = 2.1 × 10⁻⁵) and BIP (p = 8.7 × 10⁻⁶). PFC cis-mQTLs identified in controls only were significantly enriched in GWAS-identified SNPs that were associated with AUD (p = 0.004), SCZ (p = 1.6 × 10⁻¹³), BIP (p = 0.008), MDD (p = 0.006) and ADHD (p = 0.028).
Table 4. . Enrichment of prefrontal cortex cis-methylation quantitative trait loci in genome-wide association study-identified variants associated with psychiatric disorders.
| Psychiatric | PFC cis-mQTLs (cases + controls) | PFC cis-mQTLs (cases) | PFC cis-mQTLs (controls) | |||
|---|---|---|---|---|---|---|
| disorders | Overlapped with GWAS SNPs | p-value | Overlapped with GWAS SNPs | p-value | Overlapped with GWAS SNPs | p-value |
| AUD | 9277 | 1.2 × 10⁻¹⁰ | 262 | 0.093 | 685 | 0.004 |
| SCZ | 8345 | 2.2 × 10⁻¹⁶ | 244 | 2.1 × 10⁻⁵ | 606 | 1.6 × 10⁻¹³ |
| BIP | 8340 | 2.2 × 10⁻¹⁶ | 244 | 8.7 × 10⁻⁶ | 606 | 0.008 |
| MDD | 8132 | 2.2 × 10⁻¹⁶ | 240 | 0.123 | 580 | 0.006 |
| ADHD | 9045 | 0.006 | 257 | 0.556 | 668 | 0.028 |
AUD: Alcohol use disorder; ADHD: Attention-deficit/hyperactivity disorder; BIP: Bipolar disorder; GWAS: Genome-wide association study; MDD: Major depressive disorder; mQTL: Methylation quantitative trait locus; PFC: Prefrontal cortex; SCZ: Schizophrenia.
We also analyzed the overlap of PFC eQTLs and mQTLs with 15,831 unique SNPs (p < 5 × 10⁻⁸) associated with 1,564 other complex diseases or traits that were available at the GWAS catalog (accessed on 10 May 2018). Among these 15,831 unique SNPs, 39 were also eQTLs in PFC, representing a 14.7-fold enrichment (p < 2.2 × 10⁻¹⁶). Similarly, 379-disease or trait-associated SNPs were also mQTLs in PFC, representing 14.1-fold enrichment (p < 2.2 × 10⁻¹⁶). Thus, some PFC eQTLs and mQTLs were associated with other complex diseases or traits as well.
Discussion
GWAS research has identified thousands of genetic variants that were associated with hundreds of complex traits or common diseases [57]. A major focus in the post-GWAS era is to unravel causal variants and their biological functions. Genetic variants associated with AUD and related psychiatric disorders may impact gene expression in specific brain regions such as the PFC. We utilized genome-wide genotype, gene expression and DNA methylation data from human postmortem PFC tissue samples to map cis-eQTLs and cis-mQTLs. We then analyzed the co-localization of PFC cis-eQTLs/cis-mQTLs with GWAS loci for AUD and related psychiatric disorders as well as other diseases or traits. There were three major findings from the present study.
First, we uncovered cis-eQTLs and cis-mQTLs in the PFC, an important brain region mainly implicated in executive functions (working memory, decision-making and cognitive behaviors) (Table 2). The identification of cis-eQTLs/cis-mQTLs in the PFC suggests that these genetic variants may modulate the expression/DNA methylation levels of genes in the PFC, thus altering an individual’s vulnerability to PFC-related disorders or leading to PFC functional variation among individuals. Previous studies have demonstrated that variations in genes, such as NPY [58], VMAT1 [59], CRHR1 [60] and DRD2 [61], influenced PFC functions in humans. Some of these genes also harbor PFC cis-eQTLs/cis-mQTLs. For example, SNP rs8078967, a PFC cis-mQTL (FDR = 0.018), was mapped to CRHR1, a critical gene involved in the hypothalamic–pituitary–adrenal axis. To distinguish cis-eQTLs/cis-mQTLs in the PFC of AUD patients from those in the PFC of control subjects, we performed cis-eQTL/cis-mQTL analyses in cases and controls separately. Of interest, genes mapped by cis-eQTLs identified in the PFC of AUD patients participate in pathways such as Protein Export and Morphine Addiction.
Second, we found that PFC cis-eQTLs/cis-mQTLs co-localized with GWAS loci for AUD and comorbid psychiatric disorders (Tables 3 and 4). Mounting evidence suggests that PFC-dependent cognitive dysfunction (or compromised executive functions) can increase the risk of psychiatric disorders including AUD [62], SCZ [63], BIP [64], MDD [65] and ADHD [66]. The enrichment of PFC cis-eQTLs/cis-mQTLs in GWAS-identified SNPs associated with these disorders implies that some PFC cis-eQTLs/cis-mQTLs might be causal variants for them. PFC cis-eQTLs/cis-mQTLs may alter the expression of cognition-related genes in the PFC, leading to an increased risk of these disorders. Additionally, the PFC makes up over 10% of the volume of the brain, and there is a tight interconnection between the PFC and other brain regions [67]. Thus, the PFC participates in numerous other brain functions (e.g., memory, movement, sensory perception, intelligence and emotional responses) besides executive functions. Presumably, PFC cis-QTLs/cis-mQTLs may confer susceptibility to many other complex diseases or traits by influencing the function of the PFC. Our study did show a significant enrichment of PFC cis-eQTLs/cis-mQTLs in GWAS-identified SNPs associated with many other diseases or traits.
Third, we noted that PFC cis-eQTLs/cis-mQTLs might exert pleiotropic effects on multiple diseases or traits (Tables 3 and 4). That is to say, a PFC cis-eQTL or cis-mQTL may contribute to the risk of AUD and related disorders as well as other diseases or traits. The pleiotropy is caused by genetic variants that are associated with diseases or traits with shared biological pathways. For example, PFC cognitive dysfunction is the common base of AUD and related disorders (SCZ, BIP, MDD and ADHD). Polygenic risk score analyses have demonstrated significant genetic correlations between AUD and SCZ [68,69], SCZ and BIP [70] and AUD and MDD [71]. The present study further supported the genetic overlap between AUD and related psychiatric disorders. This is consistent with the findings that about 37% AUD subjects had comorbid psychiatric disorders including SCZ, BIP, MDD and ADHD [72]. In addition, there is also evidence that a single genetic variant may have pleiotropic effects on multiple diseases or traits via independent biological pathways [73]. PFC cis-eQTLs/cis-mQTLs may modulate the expression or function of PFC proteins that interact with a number of proteins involved in other biological pathways or expressed in other tissues or organs. In other words, a PFC cis-eQTL or cis-mQTL carried by a subject may influence the expression of genes in other tissues or organs, leading to an increased risk of other diseases or traits. The present study demonstrated the enrichment of PFC cis-eQTLs/cis-mQTLs in GWAS-identified SNPs that were associated with PFC-related as well as PFC-unrelated disorders or traits.
The most obvious limitation in this research was that the sample size was small, thus trans-eQTLs/trans-mQTLs and those cis-eQTLs/cis-mQTLs with a minor effect were not uncovered in the PFC. Nevertheless, generating genome-wide genotype, gene expression and DNA methylation data in a large sample is costly. The smaller sample size and the exclusion of less common SNPs in our eQTL analysis may lead to a relatively low overlap of PFC eQTLs from the present study with those from the GTEx study (48 for the present study vs 129 for the GTEx study) (Figure 1). The low overlap of PFC eQTLs may also result from the differences in sample constitutions (one half of the subjects included in the preset study were AUD patients, while all samples for the GTEx study were collected from nondisease tissue sites) and transcriptome profiling platforms (the present study used the microarray approach while the GTEx study used the RNA-seq technology). Second, the Illumina Infinium Human Methylation 450 K BeadChip used for this study can only quantify methylation levels of around 450 K methylated CpG sites, and it cannot detect the hydroxymethylation of CpGs (or 5 hmC). In our future studies, we could use the Illumina Infinium MethylationEPIC BeadChip, which targets >850 K methylated CpGs and is also useful for 5 hmC detection. We can also use the reduced representation bisulfite sequencing method to analyze genome-wide DNA methylation at the single nucleotide level [74]. Third, the analysis of eQTLs and mQTLs was conducted only in the PFC. Since a number of other brain regions are also involved in the development of AUD and its comorbid disorders, future eQTL/mQTL analyses should be performed in other brain regions as well. Finally, the present study was conducted only in participants of Caucasian ancestry. It is unknown if the eQTLs and mQTLs identified in our study are applicable to other populations. In addition, due to the limited sample size and insufficient genome coverage of the exome array used in the current study, we did not consider the potential bias caused by population stratification. Follow-up studies should use postmortem tissues from multiple brain regions of a larger number of subjects from different ethnic groups.
Conclusion
In conclusion, we performed a post-GWAS study to interpret the function of GWAS-identified SNPs (particularly those noncoding variants) associated with AUD and comorbid disorders as well as other diseases or traits. We observed a co-localization of PFC cis-eQTLs/cis-mQTLs in GWAS loci for the above diseases or traits. Our study provides further evidence that the PFC plays an important role in many diseases or traits. Future studies should consider increasing the sample size for PFC eQTL/mQTL analysis. In addition, we should also identify eQTLs/mQTLs in other brain regions that are involved in AUD and comorbid disorders.
Future perspective
Since eQTLs/mQTLs are likely the molecular link between genetic variation and phenotypic differences, the integration of GWAS findings with brain eQTLs/mQTLs is a promising approach for identifying genes that are causally related to neuropsychiatric disorders. Recent large-scale meta-analyses of GWAS have reliably identified genetic variants that are associated with neuropsychiatric disorders, such as AUD, SCZ, BIP, MDD, Alzheimer’s disease and ADHD. However, it is necessary to develop reference datasets for eQTLs/mQTLs to determine whether a gene implicated in disease risk by GWAS is directly related to disease pathogenesis. To achieve this goal, we should identify eQTLs/mQTLs in multiple brain regions in tissues obtained from a larger sample of patients and healthy subjects representing diverse ethnic populations. Such a resource would be essential to the future discovery of novel biomarkers and therapeutic approaches for neuropsychiatric disorders.
Summary points.
It is challenging to study the function of genome-wide association study (GWAS)-identified genetic variants (particularly noncoding variants) associated with diseases or traits. Causal variants for diseases or traits can be expression quantitative trait loci (eQTLs) and/or methylation quantitative trait loci (mQTLs) in specific tissues or organs.
The present study aimed to identify eQTLs and mQTLs in the prefrontal cortex (PFC) for interpreting the function of GWAS-identified single nucleotide polymorphisms associated with alcohol use disorder (AUD) and comorbid disorders as well as other diseases or traits.
The present study demonstrated that PFC cis-eQTLs/cis-mQTLs co-localized with GWAS signals for AUD and comorbid disorders as well as other diseases or traits.
These findings suggest that PFC cis-eQTLs/cis-mQTLs may regulate the expression of genes in the PFC, leading to an increased risk of AUD and comorbid disorders as well as other diseases or traits.
Acknowledgments
The transcriptome and DNA methylome data were generated at the Yale Center for Genome Analysis (YCGA). The authors thank AM Lacobelle and C Robinson from the Psychiatric Genetic Laboratory at the VA Connecticut Healthcare System for helping with the Illumina HumanCoreExome BeadChip assay. The authors are also grateful to the Australian Brain Donor Programs New South Wales Tissue Resource Centre (NSWTRC) for providing alcoholic and control brain tissues for this study. The NSWTRC is supported by the University of Sydney, the National Health and Medical Research Council of Australia and the National Institute on Alcohol Abuse and Alcoholism. We also thank the deceased subjects’ next of kin for providing consent for the studies.
Footnotes
Financial & competing interests disclosure
This work was supported by grants (R01AA025080 [H Zhang] and R21AA023068 [H Zhang]) from the National Institute on Alcohol Abuse and Alcoholism (NIAAA). The authors have no other relevant affiliations or financial involvement with any organization or entity with a financial interest in or financial conflict with the subject matter or materials discussed in the manuscript apart from those disclosed.
No writing assistance was utilized in the production of this manuscript.
Ethical conduct of research
The authors state that they have obtained appropriate institutional review board approval or have followed the principles outlined in the Declaration of Helsinki for all human or animal experimental investigations. In addition, for investigations involving human subjects, informed consent has been obtained from the participants involved. Postmortem brain tissue samples from the NSWTRC (Tissue Transfer Agreement No.: PID0191) – which has ethics approval from the Sydney Local Health Network and The University of Sydney – were de-identified. Deceased subjects’ next of kin provided informed written consent for the studies.
Data sharing statement
The genotype data have been deposited in the NCBI dbGaP database (Accession Number: phs001981.v1.p1). The DNA methylome data have been deposited in the NCBI GEO database (Accession Number: GSE49393). The transcriptome data have been deposited in the NCBI GEO database (Accession Number: GSE49376).
References
Papers of special note have been highlighted as: • of interest; •• of considerable interest
- 1.Results of the 2015 National Survey on Drug Use and Health (NSDUH): detailed Tables. Center for Behavioral Health Statistics and Quality. Substance Abuse and Mental Health Services Administration, MD, USA: (2016). [Google Scholar]
- 2.Deak JD, Miller AP, Gizer IR. Genetics of alcohol use disorder: a review. Curr. Opin. Psychol. 27, 56–61 (2019). [DOI] [PMC free article] [PubMed] [Google Scholar]
- 3.Zlojutro M, Manz N, Rangaswamy M. et al. Genome-wide association study of theta band event-related oscillations identifies serotonin receptor gene HTR7 influencing risk of alcohol dependence. Am. J. Med. Genet. B Neuropsychiatr. Genet. 156B(1), 44–58 (2011). [DOI] [PMC free article] [PubMed] [Google Scholar]
- 4.Walters RK, Polimanti R, Johnson EC. et al. Transancestral GWAS of alcohol dependence reveals common genetic underpinnings with psychiatric disorders. Nat. Neurosci. 21(12), 1656–1669 (2018). [DOI] [PMC free article] [PubMed] [Google Scholar]
- 5.Treutlein J, Cichon S, Ridinger M. et al. Genome-wide association study of alcohol dependence. Arch. Gen. Psychiatry 66(7), 773–784 (2009). [DOI] [PMC free article] [PubMed] [Google Scholar]
- 6.Sanchez-Roige S, Palmer AA, Fontanillas P. et al. Genome-wide association study meta-analysis of the Alcohol Use Disorders Identification Test (AUDIT) in two population-based cohorts. Am. J. Psychiatry 176(2), 107–118 (2019). [DOI] [PMC free article] [PubMed] [Google Scholar]; •• Important metagenome-wide association study of alcohol use disorder.
- 7.Quillen EE, Chen XD, Almasy L. et al. ALDH2 is associated to alcohol dependence and is the major genetic determinant of “daily maximum drinks” in a GWAS study of an isolated rural Chinese sample. Am. J. Med. Genet. B Neuropsychiatr. Genet. 165B(2), 103–110 (2014). [DOI] [PMC free article] [PubMed] [Google Scholar]
- 8.Gelernter J, Kranzler HR, Sherva R. et al. Genome-wide association study of alcohol dependence:significant findings in African- and European-Americans including novel risk loci. Mol. Psychiatry 19(1), 41–49 (2014). [DOI] [PMC free article] [PubMed] [Google Scholar]
- 9.Edenberg HJ, Koller DL, Xuei X. et al. Genome-wide association study of alcohol dependence implicates a region on chromosome 11. Alcohol. Clin. Exp. Res. 34(5), 840–852 (2010). [DOI] [PMC free article] [PubMed] [Google Scholar]
- 10.Gatta E, Grayson DR, Auta J. et al. Genome-wide methylation in alcohol use disorder subjects: implications for an epigenetic regulation of the cortico-limbic glucocorticoid receptors (NR3C1). Mol. Psychiatry (2019) (Epub ahead of print). [DOI] [PMC free article] [PubMed] [Google Scholar]
- 11.Lohoff FW, Sorcher JL, Rosen AD. et al. Methylomic profiling and replication implicates deregulation of PCSK9 in alcohol use disorder. Mol. Psychiatry 23(9), 1900–1910 (2018). [DOI] [PMC free article] [PubMed] [Google Scholar]
- 12.Xu K, Montalvo-Ortiz JL, Zhang X. et al. Epigenome-wide DNA methylation association analysis identified novel loci in peripheral cells for alcohol consumption among European American male veterans. Alcohol. Clin. Exp. Res. 43(10), 2111–2121 (2019). [DOI] [PMC free article] [PubMed] [Google Scholar]
- 13.Zhang H, Gelernter J, Gruen JR, Kranzler HR, Herman AI, Simen AA. Functional impact of a single-nucleotide polymorphism in the OPRD1 promoter region. J. Hum. Genet. 55(5), 278–284 (2010). [DOI] [PMC free article] [PubMed] [Google Scholar]
- 14.Wu S, Zhang M, Yang X. et al. Genome-wide association studies and CRISPR/Cas9-mediated gene editing identify regulatory variants influencing eyebrow thickness in humans. PLoS Genet. 14(9), e1007640 (2018). [DOI] [PMC free article] [PubMed] [Google Scholar]
- 15.Wray GA. The evolutionary significance of cis-regulatory mutations. Nat. Rev. Genet. 8(3), 206–216 (2007). [DOI] [PubMed] [Google Scholar]
- 16.Sonawane AR, Platig J, Fagny M. et al. Understanding tissue-specific gene regulation. Cell Rep. 21(4), 1077–1088 (2017). [DOI] [PMC free article] [PubMed] [Google Scholar]
- 17.Lokk K, Modhukur V, Rajashekar B. et al. DNA methylome profiling of human tissues identifies global and tissue-specific methylation patterns. Genome Biol. 15(4), r54 (2014). [DOI] [PMC free article] [PubMed] [Google Scholar]
- 18.Consortium GT. The Genotype-Tissue Expression (GTEx) project. Nat. Genet. 45(6), 580–585 (2013). [DOI] [PMC free article] [PubMed] [Google Scholar]; •• Useful expression quantitative trait locus database for functional study of genetic variants.
- 19.Taylor DL, Jackson AU, Narisu N. et al. Integrative analysis of gene expression, DNA methylation, physiological traits, and genetic variation in human skeletal muscle. Proc. Natl Acad. Sci. USA 116(22), 10883–10888 (2019). [DOI] [PMC free article] [PubMed] [Google Scholar]
- 20.Ratnapriya R, Sosina OA, Starostik MR. et al. Retinal transcriptome and eQTL analyses identify genes associated with age-related macular degeneration. Nat. Genet. 51(4), 606–610 (2019). [DOI] [PMC free article] [PubMed] [Google Scholar]
- 21.Huckins LM, Dobbyn A, Ruderfer DM. et al. Gene expression imputation across multiple brain regions provides insights into schizophrenia risk. Nat. Genet. 51(4), 659–674 (2019). [DOI] [PMC free article] [PubMed] [Google Scholar]
- 22.Vaughan CL, Stangl BL, Schwandt ML, Corey KM, Hendershot CS, Ramchandani VA. The relationship between impaired control, impulsivity, and alcohol self-administration in nondependent drinkers. Exp. Clin. Psychopharmacol. 27(3), 236–246 (2019). [DOI] [PMC free article] [PubMed] [Google Scholar]
- 23.Jirsaraie RJ, Sheffield JM, Barch DM. Neural correlates of global and specific cognitive deficits in schizophrenia. Schizophr. Res. 201, 237–242 (2018). [DOI] [PMC free article] [PubMed] [Google Scholar]
- 24.Guse B, Falkai P, Gruber O. et al. The effect of long-term high frequency repetitive transcranial magnetic stimulation on working memory in schizophrenia and healthy controls – a randomized placebo-controlled, double-blind fMRI study. Behav. Brain Res. 237, 300–307 (2013). [DOI] [PubMed] [Google Scholar]
- 25.Carli M, Calcagno E, Mainolfi P, Mainini E, Invernizzi RW. Effects of aripiprazole, olanzapine, and haloperidol in a model of cognitive deficit of schizophrenia in rats: relationship with glutamate release in the medial prefrontal cortex. Psychopharmacology (Berl.) 214(3), 639–652 (2011). [DOI] [PubMed] [Google Scholar]
- 26.Singh MK, Chang KD, Mazaika P. et al. Neural correlates of response inhibition in pediatric bipolar disorder. J. Child Adolesc. Psychopharmacol. 20(1), 15–24 (2010). [DOI] [PMC free article] [PubMed] [Google Scholar]
- 27.Passarotti AM, Sweeney JA, Pavuluri MN. Differential engagement of cognitive and affective neural systems in pediatric bipolar disorder and attention deficit hyperactivity disorder. J. Int. Neuropsychol. Soc. 16(1), 106–117 (2010). [DOI] [PMC free article] [PubMed] [Google Scholar]
- 28.Frangou S, Haldane M, Roddy D, Kumari V. Evidence for deficit in tasks of ventral, but not dorsal, prefrontal executive function as an endophenotypic marker for bipolar disorder. Biol. Psychiatry 58(10), 838–839 (2005). [DOI] [PubMed] [Google Scholar]
- 29.Holmes AJ, Pizzagalli DA. Spatiotemporal dynamics of error processing dysfunctions in major depressive disorder. Arch. Gen. Psychiatry 65(2), 179–188 (2008). [DOI] [PMC free article] [PubMed] [Google Scholar]
- 30.Kerestes R, Ladouceur CD, Meda S. et al. Abnormal prefrontal activity subserving attentional control of emotion in remitted depressed patients during a working memory task with emotional distracters. Psychol. Med. 42(1), 29–40 (2012). [DOI] [PubMed] [Google Scholar]
- 31.Gamo NJ, Arnsten AF. Molecular modulation of prefrontal cortex: rational development of treatments for psychiatric disorders. Behav. Neurosci. 125(3), 282–296 (2011). [DOI] [PMC free article] [PubMed] [Google Scholar]
- 32.Jones RM, Lichtenstein P, Grann M, Langstrom N, Fazel S. Alcohol use disorders in schizophrenia: a national cohort study of 12,653 patients. J. Clin. Psychiatry 72(6), 775–779 (2011). [DOI] [PubMed] [Google Scholar]
- 33.Ribbe K, Ackermann V, Schwitulla J. et al. Prediction of the risk of comorbid alcoholism in schizophrenia by interaction of common genetic variants in the corticotropin-releasing factor system. Arch. Gen. Psychiatry 68(12), 1247–1256 (2011). [DOI] [PubMed] [Google Scholar]
- 34.Azorin JM, Perret LC, Fakra E. et al. Alcohol use and bipolar disorders: risk factors associated with their co-occurrence and sequence of onsets. Drug Alcohol Depend. 179, 205–212 (2017). [DOI] [PubMed] [Google Scholar]
- 35.Goldstein BI, Levitt AJ. Factors associated with temporal priority in comorbid bipolar I disorder and alcohol use disorders: results from the national epidemiologic survey on alcohol and related conditions. J. Clin. Psychiatry 67(4), 643–649 (2006). [DOI] [PubMed] [Google Scholar]
- 36.Oquendo MA, Currier D, Liu SM, Hasin DS, Grant BF, Blanco C. Increased risk for suicidal behavior in comorbid bipolar disorder and alcohol use disorders: results from the National Epidemiologic Survey on Alcohol and Related Conditions (NESARC). J. Clin. Psychiatry 71(7), 902–909 (2010). [DOI] [PMC free article] [PubMed] [Google Scholar]
- 37.Strakowski SM, Delbello MP, Fleck DE. et al. Effects of co-occurring alcohol abuse on the course of bipolar disorder following a first hospitalization for mania. Arch. Gen. Psychiatry 62(8), 851–858 (2005). [DOI] [PubMed] [Google Scholar]
- 38.Carton L, Pignon B, Baguet A. et al. Influence of comorbid alcohol use disorders on the clinical patterns of major depressive disorder: a general population-based study. Drug Alcohol Depend. 187, 40–47 (2018). [DOI] [PubMed] [Google Scholar]
- 39.Sher L, Stanley BH, Harkavy-Friedman JM. et al. Depressed patients with co-occurring alcohol use disorders: a unique patient population. J. Clin. Psychiatry 69(6), 907–915 (2008). [DOI] [PubMed] [Google Scholar]
- 40.Skoglund C, Chen Q, Franck J, Lichtenstein P, Larsson H. Attention-deficit/hyperactivity disorder and risk for substance use disorders in relatives. Biol. Psychiatry 77(10), 880–886 (2015). [DOI] [PubMed] [Google Scholar]
- 41.Daurio AM, Aston SA, Schwandt ML. et al. Impulsive personality traits mediate the relationship between adult attention-deficit/hyperactivity symptoms and alcohol dependence severity. Alcohol. Clin. Exp. Res. 42(1), 173–183 (2018). [DOI] [PMC free article] [PubMed] [Google Scholar]
- 42.Bozkurt M, Evren C, Umut G, Evren B. Relationship of attention-deficit/hyperactivity disorder symptom severity with severity of alcohol-related problems in a sample of inpatients with alcohol use disorder. Neuropsychiatr. Dis. Treat. 12, 1661–1667 (2016). [DOI] [PMC free article] [PubMed] [Google Scholar]
- 43.Molina BS, Pelham WE, Gnagy EM, Thompson AL, Marshal MP. Attention-deficit/hyperactivity disorder risk for heavy drinking and alcohol use disorder is age specific. Alcohol. Clin. Exp. Res. 31(4), 643–654 (2007). [DOI] [PMC free article] [PubMed] [Google Scholar]
- 44.Schizophrenia Working Group of the Psychiatric Genomics C. Biological insights from 108 schizophrenia-associated genetic loci. Nature 511(7510), 421–427 (2014). [DOI] [PMC free article] [PubMed] [Google Scholar]
- 45.Stahl EA, Breen G, Forstner AJ. et al. Genome-wide association study identifies 30 loci associated with bipolar disorder. Nat. Genet. 51(5), 793–803 (2019). [DOI] [PMC free article] [PubMed] [Google Scholar]
- 46.Howard DM, Adams MJ, Shirali M. et al. Genome-wide association study of depression phenotypes in UK Biobank identifies variants in excitatory synaptic pathways. Nat. Commun. 9(1), 1470 (2018). [DOI] [PMC free article] [PubMed] [Google Scholar]
- 47.Demontis D, Walters RK, Martin J. et al. Discovery of the first genome-wide significant risk loci for attention deficit/hyperactivity disorder. Nat. Genet. 51(1), 63–75 (2019). [DOI] [PMC free article] [PubMed] [Google Scholar]; •• Important study regarding genetic correlation of alcohol dependence with related psychiatric disorders.
- 48.American Psychiatric Association. Diagnostic and Statistical Manual of Mental Disorders. 4th Edition American Psychiatric Association Publishing, DC, USA: (1994). https://psycnet.apa.org/record/1994-97698-000 [Google Scholar]
- 49.Goldstein JI, Crenshaw A, Carey J. et al. zCall: a rare variant caller for array-based genotyping: genetics and population analysis. Bioinformatics 28(19), 2543–2545 (2012). [DOI] [PMC free article] [PubMed] [Google Scholar]
- 50.Sandoval J, Heyn H, Moran S. et al. Validation of a DNA methylation microarray for 450,000 CpG sites in the human genome. Epigenetics 6(6), 692–702 (2011). [DOI] [PubMed] [Google Scholar]; • Information on the Illumina 450K DNA methylation array.
- 51.Wang F, Xu H, Zhao H, Gelernter J, Zhang H. DNA co-methylation modules in postmortem prefrontal cortex tissues of European Australians with alcohol use disorders. Sci. Rep. 6, 19430 (2016). [DOI] [PMC free article] [PubMed] [Google Scholar]
- 52.Zhang H, Wang F, Xu H. et al. Differentially co-expressed genes in postmortem prefrontal cortex of individuals with alcohol use disorders: influence on alcohol metabolism-related pathways. Hum. Genet. 133(11), 1383–1394 (2014). [DOI] [PMC free article] [PubMed] [Google Scholar]
- 53.Delaneau O, Ongen H, Brown AA, Fort A, Panousis NI, Dermitzakis ET. A complete tool set for molecular QTL discovery and analysis. Nat. Commun. 8, 15452 (2017). [DOI] [PMC free article] [PubMed] [Google Scholar]; •• Describes the bioinformatics tool for the quantitative trait loci analysis.
- 54.Schadt EE, Molony C, Chudin E. et al. Mapping the genetic architecture of gene expression in human liver. PLoS Biol. 6(5), e107 (2008). [DOI] [PMC free article] [PubMed] [Google Scholar]
- 55.Zhang B, Gaiteri C, Bodea LG. et al. Integrated systems approach identifies genetic nodes and networks in late-onset Alzheimer’s disease. Cell 153(3), 707–720 (2013). [DOI] [PMC free article] [PubMed] [Google Scholar]
- 56.Kuleshov MV, Jones MR, Rouillard AD. et al. Enrichr: a comprehensive gene set enrichment analysis web server 2016 update. Nucleic Acids Res. 44(W1), W90–W97 (2016). [DOI] [PMC free article] [PubMed] [Google Scholar]
- 57.Visscher PM, Wray NR, Zhang Q. et al. 10 years of GWAS discovery: biology, function, and translation. Am. J. Hum. Genet. 101(1), 5–22 (2017). [DOI] [PMC free article] [PubMed] [Google Scholar]; • Describes the progress and challenge of genome-wide association study.
- 58.Mickey BJ, Zhou Z, Heitzeg MM. et al. Emotion processing, major depression, and functional genetic variation of neuropeptide Y. Arch. Gen. Psychiatry 68(2), 158–166 (2011). [DOI] [PMC free article] [PubMed] [Google Scholar]
- 59.Lohoff FW, Hodge R, Narasimhan S. et al. Functional genetic variants in the vesicular monoamine transporter 1 modulate emotion processing. Mol. Psychiatry 19(1), 129–139 (2014). [DOI] [PMC free article] [PubMed] [Google Scholar]
- 60.Hsu DT, Mickey BJ, Langenecker SA. et al. Variation in the corticotropin-releasing hormone receptor 1 (CRHR1) gene influences fMRI signal responses during emotional stimulus processing. J. Neurosci. 32(9), 3253–3260 (2012). [DOI] [PMC free article] [PubMed] [Google Scholar]
- 61.Pecina M, Mickey BJ, Love T. et al. DRD2 polymorphisms modulate reward and emotion processing, dopamine neurotransmission and openness to experience. Cortex 49(3), 877–890 (2013). [DOI] [PMC free article] [PubMed] [Google Scholar]
- 62.George O, Sanders C, Freiling J. et al. Recruitment of medial prefrontal cortex neurons during alcohol withdrawal predicts cognitive impairment and excessive alcohol drinking. Proc. Natl Acad. Sci. USA 109(44), 18156–18161 (2012). [DOI] [PMC free article] [PubMed] [Google Scholar]
- 63.Guo JY, Ragland JD, Carter CS. Memory and cognition in schizophrenia. Mol. Psychiatry 24(5), 633–642 (2019). [DOI] [PMC free article] [PubMed] [Google Scholar]
- 64.Miskowiak KW, Kjaerstad HL, Stottrup MM. et al. The catechol-O-methyltransferase (COMT) Val158Met genotype modulates working memory-related dorsolateral prefrontal response and performance in bipolar disorder. Bipolar Disord. 19(3), 214–224 (2017). [DOI] [PubMed] [Google Scholar]
- 65.Clery-Melin ML, Jollant F, Gorwood P. Reward systems and cognitions in major depressive disorder. CNS Spectr. 24(1), 64–77 (2019). [DOI] [PubMed] [Google Scholar]
- 66.Alegria AA, Wulff M, Brinson H. et al. Real-time fMRI neurofeedback in adolescents with attention deficit hyperactivity disorder. Hum. Brain Mapp. 38(6), 3190–3209 (2017). [DOI] [PMC free article] [PubMed] [Google Scholar]
- 67.Yuan P, Raz N. Prefrontal cortex and executive functions in healthy adults: a meta-analysis of structural neuroimaging studies. Neurosci. Biobehav. Rev. 42, 180–192 (2014). [DOI] [PMC free article] [PubMed] [Google Scholar]; • Describes the function of the prefrontal cortex.
- 68.Hartz SM, Horton AC, Oehlert M. et al. Association between substance use disorder and polygenic liability to schizophrenia. Biol. Psychiatry 82(10), 709–715 (2017). [DOI] [PMC free article] [PubMed] [Google Scholar]
- 69.Gurriaran X, Rodriguez-Lopez J, Florez G. et al. Relationships between substance abuse/dependence and psychiatric disorders based on polygenic scores. Genes Brain Behav. 18(3), e12504 (2019). [DOI] [PubMed] [Google Scholar]
- 70.Markota M, Coombes BJ, Larrabee BR. et al. Association of schizophrenia polygenic risk score with manic and depressive psychosis in bipolar disorder. Transl. Psychiatry 8(1), 188 (2018). [DOI] [PMC free article] [PubMed] [Google Scholar]
- 71.Andersen AM, Pietrzak RH, Kranzler HR. et al. Polygenic scores for major depressive disorder and risk of alcohol dependence. JAMA Psychiatry 74(11), 1153–1160 (2017). [DOI] [PMC free article] [PubMed] [Google Scholar]
- 72.Regier DA, Farmer ME, Rae DS. et al. Comorbidity of mental disorders with alcohol and other drug abuse. Results from the Epidemiologic Catchment Area (ECA) Study. JAMA 264(19), 2511–2518 (1990). [PubMed] [Google Scholar]; • Describes the comorbility of alcohol use disorder and other mental disorders.
- 73.Pickrell JK, Berisa T, Liu JZ, Segurel L, Tung JY, Hinds DA. Detection and interpretation of shared genetic influences on 42 human traits. Nat. Genet. 48(7), 709–717 (2016). [DOI] [PMC free article] [PubMed] [Google Scholar]
- 74.Meissner A, Gnirke A, Bell GW, Ramsahoye B, Lander ES, Jaenisch R. Reduced representation bisulfite sequencing for comparative high-resolution DNA methylation analysis. Nucleic Acids Res. 33(18), 5868–5877 (2005). [DOI] [PMC free article] [PubMed] [Google Scholar]