

Abstract
Psychological stressors have been implicated in the progression of various tumor types. We investigated a role for stress in tumor immune cell chemotaxis in the B16F10 mouse model of malignant melanoma. We exposed female mice to six-hour periods of restraint stress (RST) for seven days then implanted B16F10 malignant melanoma tumor cells and continued the RST paradigm for 14 additional days. We determined serum corticosterone and liver catecholamine concentrations in these mice. To evaluate the tumor microenvironment, we performed immunohistochemistry and examined cytokine expression profiles using ELISA-based analysis of tumor homogenates. We found that tumors in mice subjected to RST grew significantly slower, had reduced tumor C-C motif ligand 2 (CCL2), and contained fewer F4/80+ macrophages than tumors from unstressed mice. We observed a concomitant increase in norepinephrine (NE) among the RST mice. An in vitro assay confirmed that NE down-regulates CCL2 production in both mouse and human macrophages, and that pre-treatment with the pan-β-adrenergic receptor inhibitor nadolol rescues this activity. Furthermore, RST had no effect on tumor growth in transgenic CCL2-deficient mice. This study suggests that stress reduces malignant melanoma by reducing recruitment of tumor promoting macrophages by CCL2.
Keywords: restraint stress, B16F10 melanoma, tumor-associated macrophages, CCL2, beta-adrenergic receptor, catecholamines
Introduction
Norepinephrine is a catecholamine that serves as both a hormone and neurotransmitter and is released during times of stress. As a hormone, norepinephrine is released from the adrenal glands after stress-induced activation of the hypothalamic-pituitary-adrenal (HPA) axis. As a neurotransmitter, norepinephrine is released at neural junctions during the “fight-or-flight” response of the sympathetic nervous system. Prolonged activation of stress pathways, such as the HPA axis, is implicated in various pathophysiological conditions[1] as well as the progression of certain types of cancers[2]. Norepinephrine induces its effects through α- and β-adrenergic receptors (AdRs) expressed on various cell types including cardiac myocytes, epithelial cells, endothelial cells, NK cells, monocytes[3], and macrophages[4].
Clinically, elevated numbers of tumor-associated macrophages (TAMs) in malignant melanoma correlate with an increase in tumor progression and metastases, and predicts poor outcome[5]. TAMs represent a population of immune cells that maintain an M2-like polarity and express a TH2 cytokine profile, including vascular endothelial growth factor (VEGF) and a number of matrix metalloproteinases (MMPs) that support tumor progression and angiogenesis[6]. Importantly, TAMs are recruited to areas of tumor-related inflammation via surface expression of CCR2, the receptor for CCL2 (C-C motif ligand 2[7]). Also known as monocyte chemoattractant protein-1 (MCP-1), CCL2 is a potent chemokine which recruits mononuclear phagocytes to areas of inflammation. Because CCL2 recruits monocytes that can differentiate into TAMs, the expression of CCL2 itself has been reported to be a negative predictive marker for patients with solid tumors[8]. In fact, targeting macrophages through this pathway has enhanced immunotherapy effectiveness against melanoma further underscoring their role in tumor progression[9].
The purpose of this study was to elucidate the role of norepinephrine, released in response to psychological stress, in macrophage trafficking and effects on tumor growth using a murine stress model of malignant melanoma. Our data suggests that norepinephrine released in response to RST suppressed CCL2 production in tumors and that this down-regulation results in less macrophage recruitment and suppression of melanoma tumor growth. The ability of norepinephrine to downregulate CCL2 expression was demonstrated in vitro as CCL2 was suppressed in both murine and human macrophages while the pan-β-AdR blocker nadolol reversed this effect. Importantly, tumors from transgenic CCL2-deficient mice subjected to RST did not exhibit this suppression of tumor growth, demonstrating the importance of CCL2-recruited macrophages in regulating melanoma tumor growth in this model. This study highlights the stress-induced effects on immune cells in the melanoma tumor microenvironment.
Materials and Methods
Restraint stress (RST) model
Wild type C57BL/6J mice (Stock No: 000664, Jackson Laboratories) and transgenic C57BL/6J CCL2-deficient mice used in this study were 8-week old female mice and housed in an all-female room. During stress trials, mice were either pre-stressed or not for seven consecutive days prior to tumor implantation. Mice were restrained in well-ventilated 50 mL polypropylene tubes for 6 hours (during the light phase, 3 hours after lights on; 9AM to 3PM). On the seventh day, tumor cells were implanted subcutaneously as described below. Because mice exposed to RST had no access to food and water while in the restraint tube; food and water was likewise removed from the home cage control (HCC) mice for the six-hour duration. For the remainder of the day, all animals were allowed access to food and water ad libitum. All experimental procedures were performed in accordance with the NIH Guide for the Care and Use of Laboratory Animals and protocols were approved by The Institutional Animal Care and Use Committee (IACUC) at The Ohio State University.
Corticosterone Assay
The serum samples were assayed using the corticosterone double antibody I125 radioimmunoassay kit (MP Biomedicals) according to the manufacturer’s protocol.
Liver norepinephrine
Norepinephrine within the livers were determined by high pressure liquid chromatography/electrochemical detection (HPLC/EC) using the CoulArray electrochemical detector by Laboratory Core Services at The Center for Clinical and Translational Sciences at The Ohio State University. All samples were processed on the same day of analysis immediately prior to HPLC. Freshly-removed, snap-frozen livers were weighed, homogenized in 1mL of 0.2N acetic acid buffer (1mL glacial acetic acid, 0.05% EDTA, 0.1% sodium bisulfite in 99 mL of HPLC water) and centrifuged. Final concentrations were determined by standardizing to total tumor weight at the time of homogenization.
Tumor growth
B16F10 malignant melanoma tumor cells were obtained from ATCC (CRL-6475™). After the seventh day of pre-stress, 2.5×10⁵ B16F10 tumor cells were subcutaneously implanted. Tumors were measured blindly using calipers and the area converted to volume (cm3) using the equation: volume=(4/3)x(pi)x(shortest dimension)2x(largest dimension). Cells obtained from ATCC were expanded upon receiving and frozen in LN2. These were the source cells for all independent experiments. Mycoplasma testing was performed regularly on cells used on our laboratory.
Analysis of tumor macrophages
Formalin-fixed tumors were sectioned and stained for F4/80 antigen to evaluate differences in macrophage infiltration (Serotec, Primary Ab: #MCA497G; secondary Ab: #BA-4001). Entire tumor sections were imaged and analyzed blindly using a microscope and a 10x objective and quantified for brown stain representing percent of F4/80-positive cells per high powered field using Adobe Photoshop CS5 histogram analysis. For flow cytometry, fresh tumor portions were homogenized using cell strainers. Cells were resuspended in 100 μL MACS buffer (Miltenyi) and blocked for 10 minutes on ice with murine IgG1 (Sigma-Aldrich) before staining for 30 minutes on ice with 10 μL F4/80 antibody (Biolegend, clone B8M, PE/Cy5-conjugate) or rat IgG2aκ isotype antibody. Cells were then washed in MACS buffer, fixed in 1% formalin, and stored at 4°C until analysis on the LSRII flow cytometer at The Ohio State University Flow Cytometry Core facility.
Quantitative Real-time PCR
Tumors were harvested at the time of euthanasia, snap-frozen, homogenized in liquid nitrogen and dissolved in TRIzol reagent (Life Technologies). Total RNA was extracted in chloroform and purified using the RNeasy Mini kit (Qiagen). cDNA was generated from 1 μg RNA using the SuperScript First-strand Synthesis System (Life Technologies) and used for real-time PCR (Supplemental Table I). SYBR Green PCR Master mix (Applied Biosciences) was used according to the manufacturer’s instructions. Data were analyzed according to the comparative threshold method and normalized against the GAPDH internal control transcript.
Tumor angiogenesis
Five minutes prior to euthanasia, mice were deeply anesthetized and Texas red–conjugated dextran (mol. wt. 70,000; Life Technologies) was injected retro-orbitally at 20 μg/g body weight (6.2 mg/mL in PBS), followed by perfusion with PBS. Tumors were sectioned and imaged on a fluorescent microscope and quantified for percent of Texas Red positivity per high powered field using Adobe Photoshop CS5 histogram analysis.
Analysis of CCL2 protein levels in tumor extracellular fluid
Tumors were homogenized and resuspended 1:2 weight:volume with 2X PBS containing protease inhibitors (Protease Inhibitor Cocktail III, Cat. No. 539134, Calbiochem) and rotated at 4°C for 2 hours. The supernatants were collected, centrifuged, and assayed for murine CCL2 (JE/MCP-1) analysis using ELISA (R&D Systems). Final CCL2 concentration was calculated after normalizing to tumor weight.
In vitro CCL2 detection
For macrophage studies, bone marrow from healthy, wild type, non-stressed female C57BL/6J mice were collected and differentiated to macrophages over five days using 10% low endotoxin FBS (certified <0.06 EU/mL), 5 ng/mL rmCSF1, 5 μg/mL polymyxin B, and 1% Penicillin-Streptomycin-Amphotericin (PSA) in RPMI-1640 media (low endotoxin ≤0.025 EU/mL, Corning). After differentiation, the macrophages were washed and cultured further for 24 hours in RPMI-1640 media containing 10% low endotoxin FBS. Macrophages alone, macrophages co-cultured with B16F10 tumor cells, or the B16F10 tumor cells alone were left untreated, treated with 50 μM norepinephrine, or pre-treated for 30 minutes with 150 μM nadolol (Sigma-Aldrich, Y0000146) prior to treatment with norepinephrine and incubated for 24 hours in 37°C and 5% CO2. Supernatants were collected and analyzed by CCL2 ELISA as described above. Human peripheral blood monocytes were isolated from buffy coats obtained from Leukocyte Source Packs from the American Red Cross (Columbus, OH). Whole blood was diluted 1:1 with 1× PBS and layered over Histopaque-1077 (density: 1.077 g/mL) and centrifuged 2,000 rpm for 20 minutes (no brake) at room temperature. The buffy layer was carefully collected and clumped in RPMI-1640 medium supplemented with 10% certified low endotoxin FBS (<0.06 EU/mL) at 4°C for 1 hr (Atlantic Biologicals). Cells were then layered over low endotoxin FBS for 20 minutes and monocytes were collected as they fell to the bottom and plated. Monocytes were allowed to adhere overnight then pre-treated with or without 300 μM nadolol and then treated with 5 nM or 50 μM norepinephrine (Sigma-Aldrich, (−)- Norepinephrine, A7257).
Adrenergic receptor agonist studies in vitro
Murine macrophages were derived from bone marrow of healthy mice, as described above and cultured in RPMI-1640 media containing 10% low endotoxin FBS, 5 μg/mL polymyxin B, and 1% PSA supplemented with 1, 10, or 100 μM of the specific β1-AdR agonist dobutamine hydrochloride (Sigma-Aldrich, D0676), the specific β2-AdR agonist formoterol fumarate dihydrate (F9552), the α1-AdR agonist methoxamine hydrochloride (M6524), or the α2-AdR agonist clonidine hydrochloride (C7897) for 48 hours. The cell-free supernatants were collected and subjected to ELISA for murine MCP-1/CCL2/JE (R&D Systems).
Statistical Analyses
All statistical analyses were performed by the Biostatistics Core at The Ohio State University. Analyses included repeated measures ANOVA, Student T-Test, or Tukey’s post-hoc ANOVA where appropriate. For tumor growth rate determination in vivo, random effects regression comparison of log transformed tumor volumes from repeated measures was used. P-values based on random-effects regression comparison of log transformed tumor volumes. Holm’s procedure was used to compensate for multiple comparisons. Hotelling’s T^2 was used to calculate differences between RST and HCC clusters in the correlate studies of macrophages, tumor weight, tumor volume, and CCL2. P<0.05 was considered statistically significant.
Results
Restraint induces biological response
Different stress paradigms in mice have contrasting immunomodulatory effects[10][11]. We wanted to understand how restraint stress (RST) influenced tumor growth and macrophage trafficking in a model of malignant melanoma. We exposed a group of wild type female C57BL/6J mice to RST for six hours and compared them to unstressed mice (home cage control, HCC). After the seventh episode of RST, implanted B16F10 malignant melanoma tumor cells. We continued the RST or HCC paradigm for 14 additional days. To confirm the biological effect of the RST model, whole blood was collected at day 0 (prior to RST) and immediately before RST on days 7, 14, and 21 (Figure 1A). Serum corticosterone levels were evaluated using an I25 radioimmunoassay and illustrated a significant increase in the RST group compared to the HCC group over the 21 days (p=0.039 for HCC vs RST) indicating the RST model induced a persistent physiological response (Figure 1B). To confirm the induction of norepinephrine in the mice exposed to RST, we subjected the livers of HCC and RST mice after 21 days to HPLC analysis. Our data confirms that livers from mice subjected to RST had significantly more norepinephrine than livers from mice in the HCC group (p=0.041) (Figure 1C).
Figure 1. Stress is protective against tumor growth in a murine model of melanoma.

A) Female C57BL/6J mice were subjected to 6 hours of HCC or RST for 7 days. B16F10 tumor cells were implanted and HCC or RST continued for 14 more days. Tumors were palpable after 3 days and measured daily. B) Before RST (Baseline) and during RST (Days 7, 14, and 21), blood was collected to determine serum corticosterone. Mice subjected to RST had significantly higher levels of serum corticosterone compared to mice that were not stressed (HCC) as evaluated by ANOVA analysis for group effect (p=0.039). n=5 mice for both RST and HCC groups. Error bars represent ±SEM. C) Subsequent to HCC/RST, the livers were removed, snap frozen, weighed, homogenized in homogenization buffer and centrifuged. Final concentrations of norepinephrine were determined by standardizing to total liver weight. HPLC/EC was performed following standard procedure. Livers from the RST group had significantly more norepinephrine than the HCC mice (p=0.041). n=10 for both HCC and RST groups. Error bars represent ±SEM. D) Female C57BL/6J mice were subjected to RST for seven days then subcutaneously injected with 2.5×10⁵ B16F10 tumor cells. Stress was continued in the RST group until the tumors reached 2cm2 in their largest diameter, until the mouse died, or for an additional 14 days. For statistical analysis, the data points from were converted to growth slopes by using the natural log (Ln) of tumor growth and the resulting lines fitted using Waldman Test parameters from random-slope regression comparing HCC to RST groups (inset) and doubling times of tumor growth for both groups were calculated (HCC=3.7 days; RST=6.5 days) (p=0.001). Upon sacrifice, the tumors were resected and measured with calipers (right). Tumors from the HCC group were significantly larger than tumors from the RST group (p=0.029). n=30 for both HCC and RST groups, experiment repeated 3 independent times. Error bars represent ±SD.
Restraint stress suppresses melanoma tumor growth
Prior to each episode of HCC or RST, the smallest and largest dimensions of the tumors were measured using calipers. Our data suggest that mice subjected to RST had significantly smaller tumors than HCC mice (Figure 1D). Statistical analysis was performed using the tumor volumes converted to growth slopes by using the natural log (Ln) of tumor growth and the resulting lines fitted using a Waldman Test of parameters from random-slope regression comparing the HCC to RST groups and doubling times for tumor growth were calculated (HCC=3.7 days; RST=6.5 days) (p=0.001) (Figure 1D, inset). Survival curves up to day 10 revealed a significant survival advantage for RST mice, and, in a couple instances, no visible tumor formation at day 14 (Supplemental Figure 1). Therefore, our data suggests that 14 days of RST effectively decreased the rate of tumor growth compared to the tumors in HCC mice.
Stress reduces tumor influx of macrophages
Since stress-induced catecholamines regulate macrophage immune responses via signaling mediated by the α- and β-AdRs[12], and because tumor macrophages are associated with tumor size, progression, and patient outcome in many cancer types[13][5], we postulated that the observed stress-associated reduction in tumor growth rate correlated with tumor macrophage presence. Using immunohistochemical analysis, we immunostained the tumors for F4/80 antigen. F4/80 is a 160 kD cell surface glycoprotein expressed on macrophages during maturation and activation. Qualitative assessment of all tumor sections revealed a decrease in F4/80(+) cells in the tumors from the RST mice (Figure 2A, right column) compared to the tumors from the HCC group (Figure 2A, left column). Quantitative analysis by imaging entire tumor sections illustrated a significant decrease in the percent F4/80(+) cells per high-powered field in the RST group compared to the HCC group (p=0.017) (Figure 2B).
Figure 2. Tumors from mice subjected to stress have reduced macrophage infiltration and CCL2.
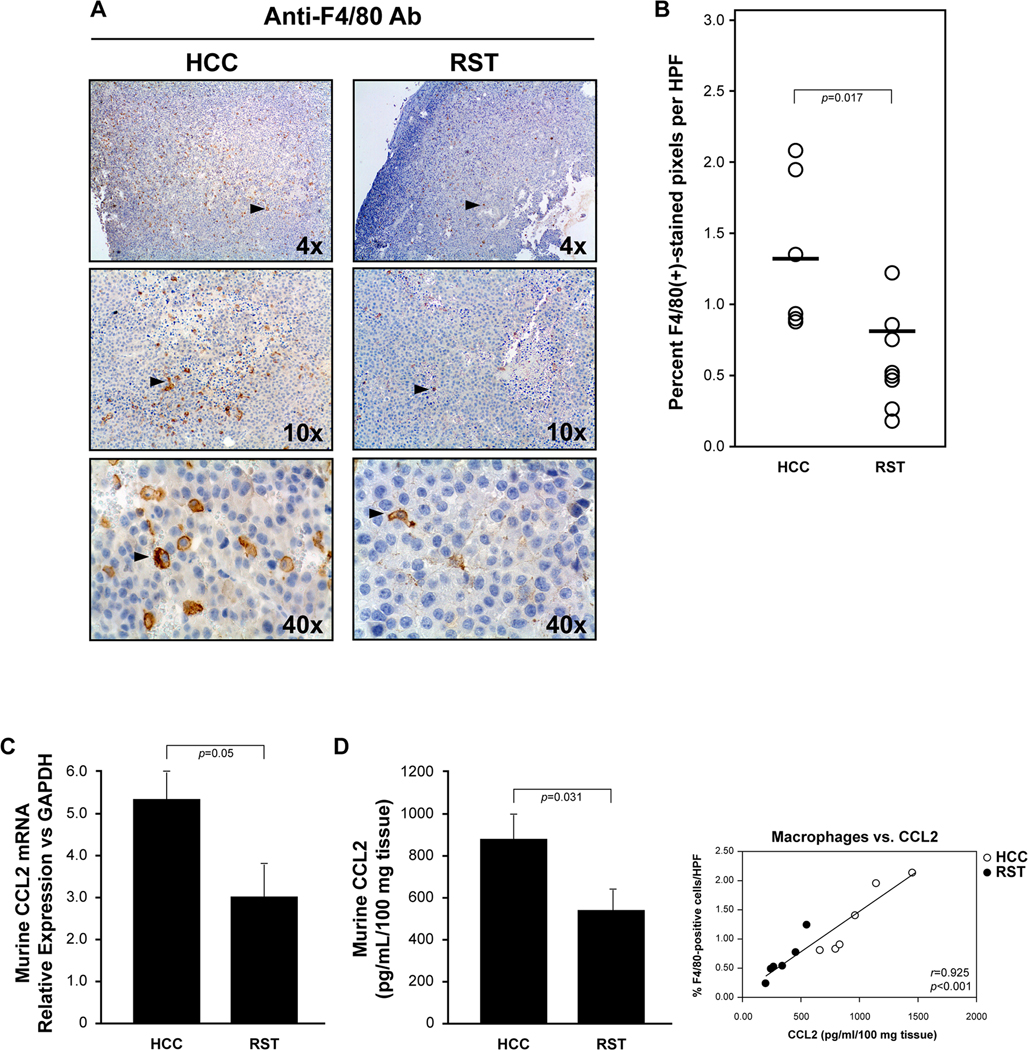
A) Tumors were removed upon sacrifice and immunostained using an antibody specific for F4/80 antigen on macrophages. A representative tumor from the HCC group (top left and bottom left) reveals more F4/80(+)-stained cells than in a tumor from the RST group (top right and bottom) at the same magnification. B) Quantification of F4/80(+)-stained cells as percent of brown-stained cells per high powered field (HPF). T-test analysis suggests a statistical difference of p=0.017 for macrophage infiltration between the two groups. HCC=6 tumors and RST=8 tumors. C) Tumors from each group were flash frozen and homogenized in Trizol for total RNA isolation. Real-time PCR analysis for murine Ccl2 mRNA was performed. Tumors from mice subjected to RST had significantly less Ccl2 mRNA than tumors from mice left unstressed (HCC) (p<0.05). n=6 mice per group and error bars represent ±SEM. D) Tumors from each group were weighed, homogenized, centrifuged and supernatant collected and subjected to Bioplex analysis. After standardization using tissue weight, tumors from the RST group had significantly less CCL2 compared to tumors from the HCC group (p=0.031). n=6 for both HCC and RST (left). Error bars represent ±SEM. CCL2 protein directly correlate with F4/80+ cells/HPF (p<0.001, right).
CCL2 is reduced in tumor extracellular fluid of stressed mice
CCL2 is a potent monocyte/macrophage chemoattractant at sites of tumor-promoting inflammation. Based on the decrease in F4/80(+) macrophages in the tumors of the mice subjected to RST, we hypothesized that this stress paradigm reduced the expression of CCL2 from cells within the tumor microenvironment. To address this hypothesis, we extracted extracellular fluid from the tumors and analyzed for the presence of CCL2 protein using ELISA. We used whole tumor homogenate for mRNA isolation and real-time PCR for Ccl2 mRNA expression. There was a significant reduction in both Ccl2 mRNA (Figure 2C) and CCL2 protein (Figure 2D, left) in the tumors from the mice in the RST group compared to the tumors from the HCC mice (p=0.05 and p=0.031, respectively), and CCL2 protein directly correlated with F4/80+ cells/HPF (p<0.001, Figure 2D, right).
Reduced number of tumor macrophages correlates with less angiogenesis
In many cancer types, the numbers of macrophages correlate with tumor angiogenesis and predict disease outcome[14][15], levels of free VEGF[16] and CCL2 expression[14][17]. To evaluate the effect of stress on the observed tumor parameters as a group, we used Hotelling’s analysis of these five parameters [(1) tumor volume at sacrifice, (2) tumor weight at sacrifice, (3) tumor macrophage presence as %F4/80-positivity by IHC, (4) CCL2 by ELISA, and (5) VEGF by ELISA] (Supplemental Figure 2). Our data indicate that all five HCC means are all together larger than the means of the five parameters in the RST group (p<0.001).
Because of the reduced levels of CCL2 and fewer number of tumor macrophages observed in the RST group, and because macrophage presence predicts tumor progression, we analyzed the tumors for differences in angiogenesis. Prior to sacrifice, the mice were intravenously administered Texas Red-conjugated dextran. Dextran extravasates into extravascular tissue through leaky blood vessels produced during tumor angiogenesis. Fluorescent analysis (Figure 3, left) and quantification (Figure 3, right) of the tumors in both groups of mice suggested that there was less tumor angiogenesis in the tumors of the restraint mice than the control mice (p=0.036).
Figure 3. Reduced macrophage population in stress mice results in less Texas Red-dextran+ tumor blood vessels.

Prior to sacrifice, C57BL/6J mice bearing B16F10 tumors that were subjected to HCC or RST for 21 days were injected with Texas Red-dextran tumor blood vessels. Images representative of n=6 for both HCC and RST groups (left). Fluorescent microscopy and quantification of red pixels per high powered field of the entire tumor surface suggest there are less tumor vessels in the tumors of the RST mice than the HCC mice (p=0.036) (right). n=6 for both HCC and RST groups. Error bars represent ±SEM.
Norepinephrine regulates CCL2 production from macrophages
Since we observed reduced CCL2 in the tumor homogenates of the RST mice, we wanted to understand if norepinephrine regulated CCL2 from macrophages and/or B16F10 tumor cells. We differentiated macrophages from bone marrow collected from wild type, naive female C57BL/6J mice. At the same time, we cultured B16F10 malignant melanoma tumor cells alone or with macrophages that were left untreated, treated with 50 μM norepinephrine, or pre-treated for 30 minutes with 150 μM nadolol prior to treatment with norepinephrine and allowed to incubate for 24 hours (Figure 4A). The cell-free supernatants were collected and subjected to ELISA specific for murine CCL2. Macrophages incubated alone and macrophages co-cultured with B16F10 tumor cells produced significantly more CCL2 compared to cells treated with norepinephrine (p=0.036 and p=0.017, respectively). The B16F10 cells alone did not express detectable concentrations of CCL2 by ELISA. Further, pre-incubation with the pan-β-AdR blocker nadolol rescued CCL2 expression from both the macrophages alone and the macrophage/B16F10 co-culture treated with norepinephrine (p=0.05 and p=0.038, respectively).
Figure 4. Norepinephrine inhibits CCL2 production from macrophages, in vitro.

A) Macrophages from non-stressed female C57BL/6J mice were derived in serum-containing media. B16F10 tumor cells were co-cultured with the macrophages or cultured alone. Macrophages alone, macrophages co-cultured with B16F10 tumor cells, or the B16F10 tumor cells alone were left untreated (Macs; Macs+F10; F10), treated with 50 μM norepinephrine (Macs+NE; Macs+F10+NE; F10+NE), or pre-treated for 30 minutes with 150 μM nadolol prior to treatment with norepinephrine (Macs+Nad+NE; Macs+F10+nad+NE; F10+Nad+NE) and allowed to incubate for 24 hours at 37°C and 5% CO2. The cell-free supernatants were collected and subjected to murine CCL2 ELISA. The macrophages alone and the macrophages co-cultured with B16F10 cells produced more CCL2 compared to cells incubated with norepinephrine (p=0.036 and p=0.017, respectively). Pre-incubation with nadolol rescued CCL2 expression from both macrophages treated with norepinephrine and the macrophage/B16F10 co-culture treated with norepinephrine (p=0.05 and p=0.038, respectively.) n=8 for CCL2 in vitro from murine macrophages. Error bars represent ±SEM. B) Human macrophages were differentiated over 5 days from peripheral blood monocytes. Macrophages alone (Macs), macrophages treated with 50 μM norepinephrine (Macs+NE 50 μM), or pre-treated for 30 minutes with 300 μM nadolol prior to treatment with norepinephrine (Macs+Nad 300 μM+NE 50 μM) and allowed to incubate for 24 hours at 37°C and 5% CO2. Cell-free supernatants were collected and subjected to human CCL2 ELISA. Macrophages alone produced more CCL2 compared to those cells incubated with norepinephrine (p=0.0058). Pre-incubation with nadolol rescued CCL2 expression from macrophages treated with norepinephrine (p=0.0075). n=4 per group. Error bars represent ±SEM. C) Human macrophages prepared as described above were treated with complete media or complete media plus 50 μM norepinephrine (NE) or 5 nM NE for 24 hours. Both NE concentrations significantly suppressed NE production compared to control (p=0.0027 and p=0.0047). n=4 per group. Error bars represent ±SEM.
To understand if the same paradigm exists in human macrophages, we differentiated peripheral blood monocytes to macrophages over 5 days. In serum-supplemented media, we left human macrophages untreated, treated with 50 μM norepinephrine (as in the mouse model) or pre-treated for 30 minutes with 300 μM nadolol prior to treatment with norepinephrine (Figure 4B). As observed with the murine cells, norepinephrine inhibited basal CCL2 production from human macrophages (p=0.0058) while nadolol abrogated the effect of norepinephrine (p=0.0075). Having first used a pharmacological dose of 50 μM norepinephrine as in the mouse model for maximal effect, we also wanted to test whether a physiologically relevant level of norepinephrine is sufficient to inhibit CCL2 production by human macrophages. Therefore, we treated human macrophages with 5 nM norepinephrine and measured CCL2 protein production (Figure 4C). CCL2 levels were significantly decreased by exposure to even 5 nM norepinephrine (p=0.0047). No cell toxicity was observed on macrophages in response to norepinephrine treatment as high 50 μM (Supplemental Figure 3).
Protective effect of RST abrogated by CCL2-deficiency
To understand if CCL2 plays a causal role in the RST-associated inhibitory effect on melanoma tumor growth, we once again implanted B16F10 tumor cells into C57BL/6J wild type (CCL2+/+) or CCL2−/− transgenic female mice after an initial week of RST or HCC and exposed them to the same HCC/RST paradigm. As observed previously, the tumors in the wild type CCL2+/+ mice subjected to RST grew significantly slower than those CCL2+/+ mice left unstressed over 14 days (p=0.001) (Figure 5A). The tumors from the CCL2-deficient mice subjected to RST or HCC grew at similar rates (p=0.764) suggesting that RST acts upon CCL2 to alter tumor growth.
Figure 5. CCL2-deficiency abrogates protection of stress on tumor growth.

A) Age-matched, female C57BL/6J CCL2−/− or wild type CCL2+/+ mice were subjected to HCC or RST for seven days then implanted with 2.5×10⁵ B16F10 tumor cells. The HCC/RST paradigm persisted for 14 more days. Repeated measures ANOVA demonstrates a significant difference in tumor growth between the wild type mice subjected to HCC and RST (p=0.001) while there was no difference in tumor growth in the CCL2−/− mice (p=0.764). n=7 for CCL2+/+ HCC; n=6 for CCL2+/+ RST; n=6 for CCL2−/− RST and n=8 for CCL2−/− HCC. Error bars represent ±SD. B) Tumors from the CCL2+/+ and CCL2−/− mice were resected upon sacrifice and homogenized into a single cell suspension. The cells were immunostained with an antibody targeting macrophage F4/80 and differences in F4/80-positivity between RST and HCC groups were quantified using flow cytometry. RST significantly suppressed macrophage influx into the tumors from the CCL2+/+ mice (p<0.05) while RST had no effect on macrophage recruitment in the CCL2-deficient mice (p=NS). n=7 for CCL2+/+ HCC; n=6 for CCL2+/+ RST; n=6 for CCL2−/− RST and n=8 for CCL2−/− HCC. Error bars represent ±SEM.
To understand the effect that CCL2-deficiency has on tumor macrophage trafficking, we immunostained the tumors from the wild type and CCL2−/− mice with antibodies targeting F4/80 antigen and subjected them to flow cytometry analysis. Confirming our previous results that RST reduces F4/80+ cell influx into the tumors, we observed a significant reduction in tumor macrophages from mice in the RST group compared to the tumors from mice subjected to HCC (p<0.05) (Figure 5B). Surprisingly, even though no difference was observed in tumor macrophage numbers between the CCL2-deficient mice subjected to RST or HCC (which supports our original hypothesis of CCL2 expression regulated by RST), the percentage of F4/80+ cells in both the CCL2−/− HCC and RST mice were similar to that of the wild type CCL2+/+ mice subjected to HCC. These data compelled us to investigate the effect of CCL2-deficiency in these CCL2−/− mice for compensatory expression of other monocyte chemokines and chemokine receptors. Real-time PCR analysis of tumors from both wild type and CCL2−/− mice subjected to RST and HCC was performed (Table I). In the wild type mice, mRNA for chemokines Ccl2, Ccl7, Ccl8, Ccl12 and the chemokine receptor Ccr3 were all significantly decreased by RST relative to HCC. In contrast, in the CCL2−/− mice, mRNA for chemokines Ccl5 and Ccl7 were significantly increased in response to RST while Ccl8 and Ccl12 levels were not significantly changed by RST. Ccl13 mRNA expression was undetectable in tumors from mice in all groups. In addition, we did not observe significant differences in mRNA levels of the other chemokine receptors (except for Ccr3 described above) between tumors from RST and HCC mice. These data suggest a compensation for the loss of CCL2 by the upregulation of expression of other chemokines that regulate macrophage trafficking. Studies investigating different monocyte subpopulations being recruited in response to RST in the CCL2−/− mice are ongoing in our laboratory.
Table I.
B16F10 tumor mRNA expression in response to RST and HCC
| Fold change in tumor mRNA relative to HCC mice | ||||
|---|---|---|---|---|
| Wild type mice | CCL2−/− mice | |||
| Fold change | p-value | Fold change | p-value | |
| Chemokine | ||||
| Ccl2 | 1.70 dec | 0.05 | N/A | |
| Ccl5 | 5.27 dec | 0.18 | 2.75 inc | 0.03 |
| Ccl7 | 5.11 dec | 0.01 | 4.11 inc | 0.04 |
| Ccl8 | 3.14 dec | 0.04 | 2.57 inc | 0.11 |
| Ccl12 | 3.58 dec | 0.01 | 1.99 inc | 0.19 |
| Ccl13 | undetectable | undetectable | ||
| Chemokine receptor | ||||
| Ccr1 | 1.50 dec | 0.23 | 1.80 inc | 0.49 |
| Ccr2 | 1.05 dec | 0.85 | 1.88 inc | 0.25 |
| Ccr3 | 2.02 dec | 0.02 | 3.51 inc | 0.12 |
| Ccr4 | 2.46 dec | 0.15 | 2.92 inc | 0.28 |
| Ccr5 | 1.65 dec | 0.21 | 2.54 inc | 0.31 |
| Cxcr4 | 1.25 inc | 0.37 | 3.08 inc | 0.13 |
“dec” = mRNA expression in mice exposed to RST was decreased relative to mice exposed to HCC.
“inc” = mRNA expression in mice exposed to RST was increased relative to mice exposed to HCC.
β-, but not α-, adrenergic receptor activation suppresses CCL2 from macrophages
While macrophages express both α- and β-adrenergic receptors (AdRs)[18][19], B16F10 melanoma cells lack β-AdR1 expression and only express modest levels of β-AdR2[20]. Since epinephrine, like norepinephrine, is a catecholamine released during the stress response, and because each catecholamine binds and activates the AdRs, we asked if the suppression of CCL2 from macrophages that we observe in culture was specific to norepinephrine. We derived murine macrophages from the bone marrow of female C57BL/6J mice and treated with complete media (with low endotoxin FBS), 50 μM epinephrine alone, or pre-treated for 30 minutes with 150 μM of the pan-β-AdR antagonist nadolol. There was significantly less CCL2 found in the cell-free supernatants of the macrophages treated with 50 μM norepinephrine and 50 μM epinephrine compared to the cells left untreated (p=0.007 and p=0.001, respectively). Furthermore, pre-treatment with 150 μM nadolol rescued this suppressive effect of norepinephrine and epinephrine resulting in levels of CCL2 similar to those cells in complete media alone (Figure 6).
Figure 6. Selective β-AdR agonists reduce macrophage CCL2, in vitro.

We derived murine bone marrow into macrophages from C57BL/6J mice and cultured in serum-media (Media alone); 50 μM norepinephrine (NE) alone or pre-treated for 30 minutes with 150 μM nadolol (NAD); 50 μM epinephrine (EPI) alone or pre-treated for 30 minutes with 150 μM nadolol. Less CCL2 was produced by macrophages treated with 50 μM NE and 50 μM EPI compared to the cells treated with media alone (n=4 for epinephrine and n=4 for nadolol+epinephrine; n=8 for norepinephrine and n=8 for nadolol+norepinephrine) (p=0.007 and p=0.001, respectively). Pre-treatment with 150 μM nadolol rescued suppression of CCL2 to levels similar to cells in media alone. Also, murine macrophages were cultured in media alone with 1, 10, or 100 μM of the β1-AdR agonist dobutamine; 1, 10, or 100 μM of the β2-AdR agonist, formoterol; 1, 10, or 100 μM of the α1-AdR agonist methoxamine; or 1, 10, or 100 μM of the α2-AdR agonist clonidine. The β-AdR agonists dobutamine and formoterol reduced CCL2 production in the supernatants in a dose-dependent manner compared to vehicle (1 μM, p=0.005; 10 μM and 100 μM, p=<0.001 for both dobutamine and formoterol). The α-AdR agonists methoxamine and clonidine had no effect on the down regulation of CCL2 at any concentration tested. n=8 for dobutamine, n=8 for formoterol, n=4 for methoxamine, and n=4 for clonidine. Error bars represent ±SEM.
Because both norepinephrine and epinephrine significantly reduced CCL2 from macrophages, we wanted to elucidate, specifically, which AdRs were responsible for the down regulation of CCL2. We again isolated bone marrow and derived murine macrophages in complete media then left untreated or supplemented with 1, 10, or 100 μM of the specific β1-AdR agonist dobutamine; the specific β2-AdR agonist formoterol; the α1-AdR agonist methoxamine; or the α2-AdR agonist clonidine. Both of the β-AdR agonists, dobutamine and formoterol, significantly reduced the expression of CCL2 in the supernatants in a dose-dependent manner compared to control media (1 μM, p=0.005; 10 μM and 100 μM, p=<0.001 for both dobutamine and formoterol) while the α-AdR agonists methoxamine and clonidine had no effect on CCL2 levels (Figure 6).
Discussion
The detrimental effects of prolonged activation of stress pathways have been well characterized, including a report from our laboratories characterizing the effect of norepinephrine on various human tumor cell lines. We showed that norepinephrine induces the expression of pro-angiogenic and pro-invasive molecules in vitro which could aid in tumor progression[21]. However, in 1995, Brandberg et al.[22] reported on the psychological and psychosomatic reactions to malignant melanoma; 144 patients with Stage 1 malignant melanoma were evaluated after their first post-surgery follow-up and completed questionnaires after 7 and 13 months to correlate anxiety to tumor recurrence. Of the patients that were diagnosed with an unfavorable prognosis, those with recurrence within 2 years presented lower levels of anxiety at the first visit compared to those patients free from recurrence after 2 years. The authors explained their surprising result by suggesting “a tendency not to worry about the signs of melanoma, or lack of knowledge about those signs might lead to delay in seeking treatment, which in turn results in thicker tumors and a worse prognosis”. In light of the observations we present here, we propose that there may be an underlying biological explanation for this tumor growth-inhibiting effect of psychological stress involving the effect of norepinephrine on host immune cells, namely macrophages.
Psychological stress is associated with the upregulated expression of stress hormones such as the glucocorticoid cortisol/corticosterone and the catecholamines, norepinephrine and epinephrine, that impacts various aspects of health[23]. For example, elevated levels of glucocorticoids in stressed mice have been reported to suppress the migration of macrophages and neutrophils to an inflammatory locus[24]. Further, restraint stress-induced norepinephrine reduces the percentage of CD11b+F4/80+ macrophages in the spleen[25]. Our current study shows that stress-induced norepinephrine can reduce the number of infiltrating macrophages and slow tumor growth in vivo in a model of malignant melanoma by down-regulating CCL2. This study helps clarify the role of stress, specifically norepinephrine, on infiltrating immune cells and how they may regulate tumor growth.
Different mouse models of stress vary in their immunomodulatory effects and ability to disrupt homeostasis. In fact, chronic stress has been shown to promote tumor progression while acute stress may be beneficial against tumor progression[26]. For example, social disruption (SDR) promotes a pro-inflammatory phenotype characterized by elevated levels of IL-6 and IL-10[27], enhanced macrophage activity[10], diminished inflammatory responsiveness to glucocorticoids[11], and splenomegaly stemming from a large increase in the number of splenic CD11b+ myeloid cells, as well as increased inflammatory sensitivity of these cells leading to increased IL-6 and TNF-α expression[28]. In contrast, restraint stress (RST) delays expression of pro-inflammatory cytokines such as IL-1α, IL-1β[11], IL-2, IL-4, IL-10[29], reduces expression of type I and II interferon, inhibits leukocyte mobilization, reduces monocyte activation in response to viral and bacterial challenges[10] and induces splenic atrophy arising from splenic cell apoptosis[30]. Because studies suggest immunosuppressive effects of RST on other immune cells such as T cells and NK cells, we chose to investigate a regulatory role of this stress paradigm on tumor macrophages.
Other types of stress, such as thermal stress, which result in measurable changes in epinephrine concentrations have shown diverse effects. For example, Bucsek et al.[31] demonstrated mice exposed to hypothermia resulted in elevated epinephrine which acted upon CD8+ T cells to slow tumor progression in 4T1 and B16-OVA models. This study also used genetic β2-AR knockout mice which mimicked similar results. In our model, we observed an increase in CD4+ T cells (Supplemental Figure 5) suggesting that the effects may be mediated by immune cell-specific adrenergic signaling. In addition, our data indicate that adrenergic signaling on macrophages may have a larger effect on β1-AR signaling as dobutamine resulted in the largest suppression of CCL2 expression in vitro (Figure 6) when compared to using a specific β2-AR antagonist.
To evaluate differences in tumor macrophage recruitment between HCC and RST mice, we immunostained the tumor sections using an antibody specific for the macrophage marker F4/80. As discussed above, overall macrophage numbers within tumors have been correlated with tumor progression and metastases. Upon quantification, we found a significant reduction in tumor macrophages in RST mice. This reduction in macrophages prompted us to investigate whether this phenomenon is associated with CCL2 expression in the tumor extracellular fluid. Using an ELISA-based analysis, we analyzed CCL2 levels in the tumor homogenates. We found that the chemokine CCL2 is significantly downregulated in response to RST.
Next, to validate that our stress paradigm led to increases in tissue NE, we measured catecholamine levels within the livers of the RST and HCC mice. Through the activation of the HPA axis and sympathetic nervous system, RST upregulates glucocorticoids and catecholamines, respectively[32] and the half-life of norepinephrine is on the order of a few minutes in peripheral blood while in hepatic tissue it can remain elevated for hours[33]. HPLC evaluation of the livers revealed increased norepinephrine in the mice subjected to RST. This supports that, during the 6-hour RST paradigm, norepinephrine is up-regulated in these mice. Duration of RST exposure varies widely between experimental methodologies. We chose to use the 6-hour, 21-day RST model in order to investigate the biological consequences of chronic stress. While restraint stress exposures of 15 minutes to 2 hours are common in experimental settings, studies using short periods of restraint demonstrate measures of early stress responses (e.g. short-term neurological and neurochemical changes and behavioral measures of anxiety)[34] but fail to provoke responses associated with chronic stress. However, repeated exposure to 6 hours or more of RST elicits changes in body and organ mass, learning deficits and depressive-like behavior[34], immunological shifts[2], and diminished wound healing ability[35]. By using the 6-hour RST paradigm, we were able to effectively examine biological response to a chronic stressor. Behavioral modulation in C57BL/6J mice in response to 6-hour, 21-day RST has been reported previously[34].
To understand if increased norepinephrine levels in RST mice were responsible for the observed CCL2 down-regulation, we determined if norepinephrine reduced CCL2 expression from murine bone marrow-derived macrophages in vitro, as macrophages express both α- and β-AdRs. Indeed, we observed a 50% reduction in CCL2 protein from the norepinephrine-treated macrophages, a response that was reversed by pre-incubation with the pan-β-AdR blocker nadolol. Consistent with the ability of nadolol to abrogate the norepinephrine-dependent down-regulation of CCL2 expression, we further show that treatment of murine macrophages with the β-AdR agonists dobutamine and formoterol down-regulated CCL2 expression while the α-AdR agonists methoxamine and clonidine failed to do so. Because B16F10 tumor cells do not express CCL2, it is likely that the downregulation of CCL2 within the tumors is directly related to the effect of norepinephrine on macrophages. Importantly, human macrophages undergo the same downregulation of CCL2 in response to norepinephrine. Interestingly, this effect appears to be cell and/or model specific as β2-AdR stimulation increased CCR2 expression and migratory response to CCL2 by bone marrow cells[36]. Several studies also suggest macrophage phenotype changes upon β-AdR signaling. For example, β-AdR promotes M2-like gene expression such as Arg1 which is often associated as a tumor-promoting phenotype[37]. Investigation of tumor macrophage polarity during this RST paradigm are underway in our laboratory. Nonetheless, our data suggest that the recruitment of macrophages is mainly responsible for the differences seen in this model.
To determine if CCL2 plays a causal role in mediating the effects of norepinephrine on melanoma tumor growth, we implanted B16F10 cells into CCL2-deficient transgenic mice exposed or not exposed to RST and compared tumor growth to RST and HCC using B16F10 tumor-bearing wild type CCL2+/+ mice. We did not observe a difference in growth of tumors from the CCL2-deficient mice subjected to RST or HCC suggesting that the inhibitory effect of RST on melanoma tumor growth is dependent on CCL2. We further observed similar numbers of tumor macrophages between the CCL2-deficient mice subjected to RST or HCC. However, we unexpectedly observed that the percentage of F4/80+ macrophages in both the CCL2−/− HCC and RST mice were similar to that of the wild type CCL2+/+ mice subjected to HCC. This phenomenon may be explained by an observed upregulation of other chemokines that regulate macrophage trafficking which compensate for the absence of CCL2 in these mice. We propose that the upregulated expression of these chemokines or differential expression of chemokine receptors can recruit other monocyte/macrophage subpopulations into the tumor environment. For example, Tie-2 expressing monocytes/macrophages identified in breast tumors in both human[38] and mice[39] are recruited by factors other than CCL2 as they lack CCR2 but instead express CXCR4 and by definition, Tie-2, receptor for angiopoietin-1 and −2.
In addition to augmenting monocyte/macrophage mobilization, CCL2 has been reported to mediate proliferation of metastatic melanoma cells directly[40]. Thus, we treated B16F10 tumor cells in vitro with varying doses of murine CCL2 and saw no increase in cell proliferation (Supplemental Figure 4) suggesting CCL2 has no direct role in promoting tumor growth in this model. These data emphasize the importance of tumor macrophages as regulators of tumor growth in the tumor microenvironment. Supporting these data, targeting CCL2 using neutralizing antibodies inhibited tumor growth in mouse models of metastatic melanoma[40], and fibrocyte-expressed CCL2 recruited Ly6C monocytes, promoting B16F10 cell metastasis to the lung[42]. However, tumor-derived CCL2 was alternatively elevated in an ovarian cancer model under restraint stress leading to increased monocyte infiltration and subsequent tumor progression[43]. This seemingly tumor model-dependent effect of restraint stress on CCL2-mediated monocyte recruitment warrants further investigation. Together, our data support studies describing the stress-associated inhibition of tumor progression. Environmental enrichment-induced activation of a brain-adipocyte BDNF/leptin axis resulted in reduced B16F10 melanoma tumor growth[44]. Likewise, our data also support the role of signaling pathways mediated by β-AdRs. Beta-blockers have demonstrated beneficial effects in patients with established melanoma including increases in overall survival[45][46] and reduced disease progression[47]. These effects have also demonstrated positive synergistic effects with immunotherapy in mice[46]. However, in a study from the United Kingdom, no association for beta-blocker treatment and melanoma-related mortality was found even when beta-blocker types were individualized[48]. Two more studies reported that use of beta-blockers was associated with increased risk for metastatic melanoma[49]. These studies further support the immune cell role in melanoma progression and demonstrate that effects of beta adrenergic signaling may be specific to host, adrenergic receptor type, immune cell type, and the effectiveness of beta-blockers in the later stages of tumor progression. These studies underscore the need for future research focused on elucidating the causative mechanism of beta-blockers and melanoma initiation and progression.
However, we further suggest that a contributing factor to the observed tumor inhibition is the modulation of macrophage recruitment into the tumor. In addition, Dhabhar and colleagues illustrated similar tumor growth-inhibiting effects of acute RST using a UV-light induced squamous cell carcinoma model which was associated with increases in infiltrating immune cells, namely T cells[50]. Investigation is ongoing to determine if regulatory T cells may help modulate the tumor growth-inhibiting effect of RST in this model. Furthermore, it would be of great interest to investigate the RST-macrophage recruitment relationship in this model by depleting macrophages using clodronate followed by reconstitution of the monocyte population to rescue the observed effects. This study would more completely deplete macrophages compared to our CCL2−/− model which only addresses those monocyte populations recruited by CCL2. These studies could shed new light on how stress can regulate the immune system and uncover potential new targets for therapeutic intervention.
Conclusion
There is an interest in using β-blockers as a therapeutic intervention for melanoma patients. Here, we suggest a molecular basis of how activating β-adrenergic receptors on tumor macrophages could actually inhibit the growth of melanoma tumors by suppressing the production of the monocyte/macrophage chemokine, MCP-1/CCL2, in a mouse model of malignant melanoma. This work emphasizes the importance of understanding how targeted therapies can potentially manipulate host immune cell function.
To our knowledge, this is the first study showing that stress-induced norepinephrine regulates macrophage trafficking by suppressing the production of CCL2 in macrophages. This study emphasizes the complexity of tumor biology and that there is no single strategy to suppress the growth of solid tumors in stress-related progression of cancers and that treatment strategies should consider both tumor cell phenotype as well as the immune cells infiltrating the tumor microenvironment.
Supplementary Material
Acknowledgements
This study was supported by NCI K99CA131552/R00CA131552, and NCI R01CA194013 (T.D. Eubank), NHLBI R01HL067176 (C.B. Marsh), The Gilbert and Kathryn Mitchell Endowment (R. Glaser), the Research Investment Fund from the OSU College of Medicine and NCI R01CA10024301A2S1 (E.V. Yang/R. Glaser), and The OSU Comprehensive Cancer Center Core Grant NCI P30CA016058 (B. Andersen). We thank Trina Wemlinger (Clinical Research Center Core at The Center for Clinical and Translational Sciences, OSU Medical Center) and Susie Jones (Pathology Core Facility, OSU).
Footnotes
Disclosure of Potential Conflicts of Interest
No potential conflicts of interest were disclosed.
References
- 1.Kiecolt-Glaser JK, Marucha PT, Mercado AM, Malarkey WB and Glaser R. Slowing of wound healing by psychological stress. The Lancet 1995;346(8984), pp.1194–1196. [DOI] [PubMed] [Google Scholar]
- 2.Frick LR, Barreiro Arcos ML, Rapanelli M, Zappia MP, Brocco M, Mongini C. et al. Chronic restraint stress impairs T-cell immunity and promotes tumor progression in mice. Stress 2009;12(2), pp.134–143. [DOI] [PubMed] [Google Scholar]
- 3.Guirao X, Kumar A, Katz J, Smith M, Lin E, Keogh C. et al. Catecholamines increase monocyte TNF receptors and inhibit TNF through β2- adrenoreceptor activation. American Journal of Physiology-Endocrinology And Metabolism 1997;273(6), pp.E1203–E1208. [DOI] [PubMed] [Google Scholar]
- 4.Gosain A, Muthu K, Gamelli RL and DiPietro LA Norepinephrine suppresses wound macrophage phagocytic efficiency through alpha-and beta-adrenoreceptor dependent pathways. Surgery 2007;142(2), pp.170–179. [DOI] [PMC free article] [PubMed] [Google Scholar]
- 5.Torisu H, Ono M, Kiryu H, Furue M, Ohmoto Y, Nakayama J. et al. Macrophage infiltration correlates with tumor stage and angiogenesis in human malignant melanoma: Possible involvement of TNFα and IL-1α. International journal of cancer 2000;85(2), pp.182–188. [PubMed] [Google Scholar]
- 6.Coussens LM, Tinkle CL, Hanahan D. and Werb Z. MMP-9 supplied by bone marrow–derived cells contributes to skin carcinogenesis. Cell 2000;103(3), pp.481–490. [DOI] [PMC free article] [PubMed] [Google Scholar]
- 7.Fujimoto H, Sangai T, Ishii G, Ikehara A, Nagashima T, Miyazaki M. Stromal MCP-1 in mammary tumors induces tumor-associated macrophage infiltration and contributes to tumor progression. International journal of cancer 2009;125(6), pp.1276–1284. [DOI] [PubMed] [Google Scholar]
- 8.Yoshidome H, Kohno H, Shida T, Kimura F, Shimizu H, Ohtsuka M. et al. Significance of monocyte chemoattractant protein-1 in angiogenesis and survival in colorectal liver metastases. International journal of oncology 2009;34(4), pp.923–930. [DOI] [PubMed] [Google Scholar]
- 9.Cassetta L. and Kitamura T. Macrophage targeting: opening new possibilities for cancer immunotherapy. Immunology 2018;155(3), pp.285–293. [DOI] [PMC free article] [PubMed] [Google Scholar]
- 10.Bailey MT, Engler H. and Sheridan JF Stress induces the translocation of cutaneous and gastrointestinal microflora to secondary lymphoid organs of C57BL/6 mice. Journal of neuroimmunology 2006;171(1–2), pp.29–37. [DOI] [PubMed] [Google Scholar]
- 11.Sheridan JF, Padgett DA, Avitsur R. and Marucha PT Experimental models of stress and wound healing. World journal of surgery 2004;28(3), pp.327–330. [DOI] [PubMed] [Google Scholar]
- 12.Szelenyi J, Selmeczy Z, Brozik A, Medgyesi D. and Magocsi M. Dual β-adrenergic modulation in the immune system: Stimulus-dependent effect of isoproterenol on MAPK activation and inflammatory mediator production in macrophages. Neurochemistry international 2006;49(1), pp.94–103. [DOI] [PubMed] [Google Scholar]
- 13.Lin EY and Pollard JW Tumor-associated macrophages press the angiogenic switch in breast cancer. Cancer Research 2007;67(11), pp.5064–5066. [DOI] [PubMed] [Google Scholar]
- 14.Koide N, Nishio A, Sato T, Sugiyama A. and Miyagawa SI Significance of macrophage chemoattractant protein-1 expression and macrophage infiltration in squamous cell carcinoma of the esophagus. The American journal of gastroenterology 2004;99(9), p.1667. [DOI] [PubMed] [Google Scholar]
- 15.Tsutsui S, Yasuda K, Suzuki K, Tahara K, Higashi H. and Era S. Macrophage infiltration and its prognostic implications in breast cancer: the relationship with VEGF expression and microvessel density. Oncology reports 2005;14(2), pp.425–431. [PubMed] [Google Scholar]
- 16.Bando H, Weich HA, Brokelmann M, Horiguchi S, Funata N, Ogawa T. et al. Association between intratumoral free and total VEGF, soluble VEGFR-1, VEGFR-2 and prognosis in breast cancer. British journal of cancer 2005;92(3), p.553. [DOI] [PMC free article] [PubMed] [Google Scholar]
- 17.Payne AS and Cornelius LA The role of chemokines in melanoma tumor growth and metastasis. Journal of Investigative Dermatology 2002;118(6), pp.915–922. [DOI] [PubMed] [Google Scholar]
- 18.Qin JF, Jin FJ, Li N, Guan HT, Lan L, Ni H, Wang Y. Adrenergic receptor β2 activation by stress promotes breast cancer progression through macrophages M2 polarization in tumor microenvironment. BMB Rep. 2015;May;48(5):295–300. [DOI] [PMC free article] [PubMed] [Google Scholar]
- 19.Sigola LB, Zinyama RB Adrenaline inhibits macrophage nitric oxide production through beta1 and beta2 adrenergic receptors. Immunology 2000;July;100(3):359–63. [DOI] [PMC free article] [PubMed] [Google Scholar]
- 20.Maccari S, Buoncervello M, Rampin A, Spada M, Macchia D, Giordani L. et al. Biphasic effects of propranolol on tumour growth in B16F10 melanoma-bearing mice. Br J Pharmacol. 2017;January;174(2):139–149. doi: 10.1111/bph.13662. [DOI] [PMC free article] [PubMed] [Google Scholar]
- 21.Yang EV, Sood AK, Chen M, Li Y, Eubank TD, Marsh CB et al. Norepinephrine up-regulates the expression of vascular endothelial growth factor, matrix metalloproteinase (MMP)-2, and MMP-9 in nasopharyngeal carcinoma tumor cells. Cancer research 2006;66(21), pp.10357–10364. [DOI] [PubMed] [Google Scholar]
- 22.Brandberg Y, Månsson-Brahme E, Ringborg U. and Sjödén PO Psychological reactions in patients with malignant melanoma. European Journal of Cancer 1995;31(2), pp.157–162. [DOI] [PubMed] [Google Scholar]
- 23.Marketon JIW and Glaser R. Stress hormones and immune function. Cellular immunology 2008;252(1–2), pp.16–26. [DOI] [PubMed] [Google Scholar]
- 24.Mizobe K, Kishihara K, El-Naggar RED, Madkour GA, Kubo C. and Nomoto K. Restraint stress-induced elevation of endogenous glucocorticoid suppresses migration of granulocytes and macrophages to an inflammatory locus. Journal of neuroimmunology 1997;73(1–2), pp.81–89. [DOI] [PubMed] [Google Scholar]
- 25.Li Y, Jiang W, Li ZZ, Zhang C, Huang C, Yang J. Repetitive restraint stress changes spleen immune cell subsets through glucocorticoid receptor or β-adrenergic receptor in a stage dependent manner. Biochemical and biophysical research communications 2018;495(1), pp.1108–1114. [DOI] [PubMed] [Google Scholar]
- 26.Qiao G, Chen M, Bucsek MJ, Repasky EA, Hylander BL. Adrenergic Signaling: A Targetable Checkpoint Limiting Development of the Antitumor Immune Response. Front Immunol. 2018;February 6;9:164. [DOI] [PMC free article] [PubMed] [Google Scholar]
- 27.Anisman H, Poulter MO, Gandhi R, Merali Z. and Hayley S. Interferon-α effects are exaggerated when administered on a psychosocial stressor backdrop: cytokine, corticosterone and brain monoamine variations. Journal of neuroimmunology 2007;186(1–2), pp.45–53. [DOI] [PubMed] [Google Scholar]
- 28.Bailey MT, Kinsey SG, Padgett DA, Sheridan JF and Leblebicioglu B. Social stress enhances IL-1β and TNF-α production by Porphyromonas gingivalis lipopolysaccharide-stimulated CD11b+ cells. Physiology & behavior 2009;98(3), pp.351–358. [DOI] [PMC free article] [PubMed] [Google Scholar]
- 29.Sheridan JF, Dobbs C, Jung J, Chu X, Konstantinos A, Padgett D. et al. Stress-Induced Neuroendocrine Modulation of Viral Pathogenesis and Immunity a. Annals of the New York Academy of Sciences 1998;840(1), pp.803–808. [DOI] [PMC free article] [PubMed] [Google Scholar]
- 30.Avitsur R, Powell N, Padgett DA and Sheridan JF Social interactions, stress, and immunity. Immunology and Allergy Clinics 2009;29(2), pp.285–293. [DOI] [PubMed] [Google Scholar]
- 31.Bucsek MJ, Qiao G, MacDonald CR, Giridharan T, Evans L, Niedzwecki B. et al. β-Adrenergic Signaling in Mice Housed at Standard Temperatures Suppresses an Effector Phenotype in CD8+ T Cells and Undermines Checkpoint Inhibitor Therapy. Cancer Research 2017;October 15;77(20):5639–5651. [DOI] [PMC free article] [PubMed] [Google Scholar]
- 32.Dobbs CM, Feng N, Beck FM and Sheridan JF Neuroendocrine regulation of cytokine production during experimental influenza viral infection: effects of restraint stress-induced elevation in endogenous corticosterone. The Journal of Immunology 1996;157(5), pp.1870–1877. [PubMed] [Google Scholar]
- 33.Kuhn CM, Surwit RS and Feinglos MN Glipizide stimulates sympathetic outflow in diabetes-prone mice. Life sciences 1995;56(9), pp.661–666. [DOI] [PubMed] [Google Scholar]
- 34.Buynitsky T. and Mostofsky DI Restraint stress in biobehavioral research: recent developments. Neuroscience & Biobehavioral Reviews 2009;33(7), pp.1089–1098. [DOI] [PubMed] [Google Scholar]
- 35.Padgett DA, Marucha PT and Sheridan JF Restraint stress slows cutaneous wound healing in mice. Brain, behavior, and immunity 1998;12(1), pp.64–73. [DOI] [PubMed] [Google Scholar]
- 36.Grisanti LA, Traynham CJ, Repas AA, Gao E, Koch WJ and Tilley DG β2-Adrenergic receptor-dependent chemokine receptor 2 expression regulates leukocyte recruitment to the heart following acute injury. Proceedings of the National Academy of Sciences 2016;113(52), pp.15126–15131. [DOI] [PMC free article] [PubMed] [Google Scholar]
- 37.Lamkin DM, Ho HY, Ong TH, Kawanishi CK, Stoffers VL, Ahlawat N. et al. β-Adrenergic-stimulated macrophages: comprehensive localization in the M1-M2 spectrum. Brain, behavior, and immunity 2016;57, pp.338–346. [DOI] [PMC free article] [PubMed] [Google Scholar]
- 38.Venneri MA, De Palma M, Ponzoni M, Pucci F, Scielzo C, Zonari E. et al. Identification of proangiogenic TIE2-expressing monocytes (TEMs) in human peripheral blood and cancer. Blood 2007;109(12), pp.5276–5285. [DOI] [PubMed] [Google Scholar]
- 39.Mazzieri R, Pucci F, Moi D, Zonari E, Ranghetti A, Berti A. et al. Targeting the ANG2/TIE2 axis inhibits tumor growth and metastasis by impairing angiogenesis and disabling rebounds of proangiogenic myeloid cells. Cancer cell 2011;19(4), pp.512–526. [DOI] [PubMed] [Google Scholar]
- 40.Ohanna M, Giuliano S, Bonet C, Imbert V, Hofman V, Zangari J. et al. Senescent cells develop a PARP-1 and nuclear factor-κB-associated secretome. Genes Development 2011;June 15;25(12):1245–61. [DOI] [PMC free article] [PubMed] [Google Scholar]
- 41.Knight DA, Ngiow SF, Li M, Parmenter T, Mok S, Cass A. et al. Host immunity contributes to the anti-melanoma activity of BRAF inhibitors. The Journal of clinical investigation 2013;123(3), pp.1371–1381. [DOI] [PMC free article] [PubMed] [Google Scholar] [Retracted]
- 42.van Deventer HW, Palmieri DA, Wu QP, McCook EC and Serody JS et al. Circulating fibrocytes prepare the lung for cancer metastasis by recruiting Ly-6C+ monocytes via CCL2. The Journal of Immunology 2013;190(9), pp.4861–4867. [DOI] [PMC free article] [PubMed] [Google Scholar]
- 43.Armaiz-Pena GN, Gonzalez-Villasana V, Nagaraja AS, Rodriguez-Aguayo C, Sadaoui NC, Stone RL et al. Adrenergic regulation of monocyte chemotactic protein 1 leads to enhanced macrophage recruitment and ovarian carcinoma growth. Oncotarget 2015;6(6), p.4266. [DOI] [PMC free article] [PubMed] [Google Scholar]
- 44.Cao L, Liu X, Lin EJD, Wang C, Choi EY, Riban V. et al. Environmental and genetic activation of a brain-adipocyte BDNF/leptin axis causes cancer remission and inhibition. Cell 2010;142(1), pp.52–64. [DOI] [PMC free article] [PubMed] [Google Scholar]
- 45.Na Z, Qiao X, Hao X, Fan L, Xiao Y, Shao Y. et al. The effects of beta-blocker use on cancer prognosis: a meta-analysis based on 319,006 patients. Onco Targets Ther. 2018;August 20;11:4913–4944. [DOI] [PMC free article] [PubMed] [Google Scholar]
- 46.Kokolus KM, Zhang Y, Sivik JM, Schmeck C, Zhu J, Repasky EA. et al. Beta blocker use correlates with better overall survival in metastatic melanoma patients and improves the efficacy of immunotherapies in mice. Oncoimmunology 2017;December 21;7(3):e1405205. [DOI] [PMC free article] [PubMed] [Google Scholar]
- 47.De Giorgi V, Grazzini M, Benemei S, Marchionni N, Geppetti P, Gandini S. β-Blocker use and reduced disease progression in patients with thick melanoma: 8 years of follow-up. Melanoma Res. 2017;June;27(3):268–270. [DOI] [PubMed] [Google Scholar]
- 48.McCourt C, Coleman HG, Murray LJ, Cantwell MM, Dolan O, Powe DG et al. Beta-blocker usage after malignant melanoma diagnosis and survival: a population-based nested case–control study. British journal of dermatology 2014;170(4), pp.930–938. [DOI] [PubMed] [Google Scholar]
- 49.Tang H, Fu S, Zhai S, Song Y. and Han J. Use of Antihypertensive Drugs and Risk of Malignant Melanoma: A Meta-analysis of Observational Studies. Drug safety 2018;41(2), pp.161–169. [DOI] [PubMed] [Google Scholar]
- 50.Dhabhar FS, Saul AN, Daugherty C, Holmes TH, Bouley DM and Oberyszyn TM Short-term stress enhances cellular immunity and increases early resistance to squamous cell carcinoma. Brain, behavior, and immunity 2010;24(1), pp.127–137. [DOI] [PMC free article] [PubMed] [Google Scholar]
Associated Data
This section collects any data citations, data availability statements, or supplementary materials included in this article.