Abstract
We report on the impact of nonlinear four-magnon scattering on magnon transport in microstructured Co25Fe75 waveguides with low magnetic damping. We determine the magnon propagation length with microfocused Brillouin light scattering over a broad range of excitation powers and detect a decrease of the attenuation length at high powers. This is consistent with the onset of nonlinear four-magnon scattering. Hence, it is critical to stay in the linear regime, when deriving damping parameters from the magnon propagation length. Otherwise, the intrinsic nonlinearity of magnetization dynamics may lead to a misinterpretation of magnon propagation lengths and, thus, to incorrect values of the magnetic damping of the system.
In the growing field of magnonics,1–4 one aims at the use of magnons, the excitation quanta in magnetically ordered systems, to transport and process information. In order to allow for coherent long-distance transport of signals in complex magnonic networks, the search for materials with low magnetic damping was reinitiated. In 2016, ferromagnetic resonance (FMR) measurements of continuous films revealed intrinsic damping values as low as (5±1.8)×10−4 for the conductor Co25Fe75,5 approaching values found for the ferrimagnetic insulator yttrium iron garnet6, with the added benefit of seminconductor compatibility. As a consequence, studies of the propagation characteristics in Co25Fe75 microstructures followed, comparing damping values obtained from FMR to those derived from magnon propagation lengths.7–9 In Ref. 7, a 2.5 times higher damping is reported for magnon transport measurements than for FMR analysis of extended films, which is attributed to significant extrinsic contributions to the magnetic damping in the microstructured sample, such as local inhomogeneities and two-magnon scattering.
However, one must consider that even in a perfect crystal, higher-order nonlinear scattering can lead to a significant increase of losses. The efficiency of such nonlinear processes depends on the population of the initial and the final magnon states. Hence, if fewer final states are available, e.g., by patterning the continuous film to a microstructured waveguide, a higher population of final states is achieved more easily, and the threshold for nonlinearities is reduced strongly.10 This is even more the case in materials with low intrinsic damping. As a direct consequence, the efficiency of magnon transport certainly depends on the excitation amplitude, i.e., whether the system is operated in the linear or nonlinear regime. One may think that in order to obtain most effective magnon transport, it is necessary to drive the excitation of magnons with the maximum power available. But counterintuitively, this may lead to increased losses due to nonlinear magnon scattering.
In this Letter, we demonstrate that the application of high excitation powers above the threshold for nonlinear scattering may easily result in an underestimation of the magnon propagation lengths. Using spatially resolved Brillouin light scattering (BLS) microscopy of magnon transport in a Co25Fe75 waveguide, we prove that magnon propagation lengths are significantly larger if excited in the linear compared to the nonlinear regime.
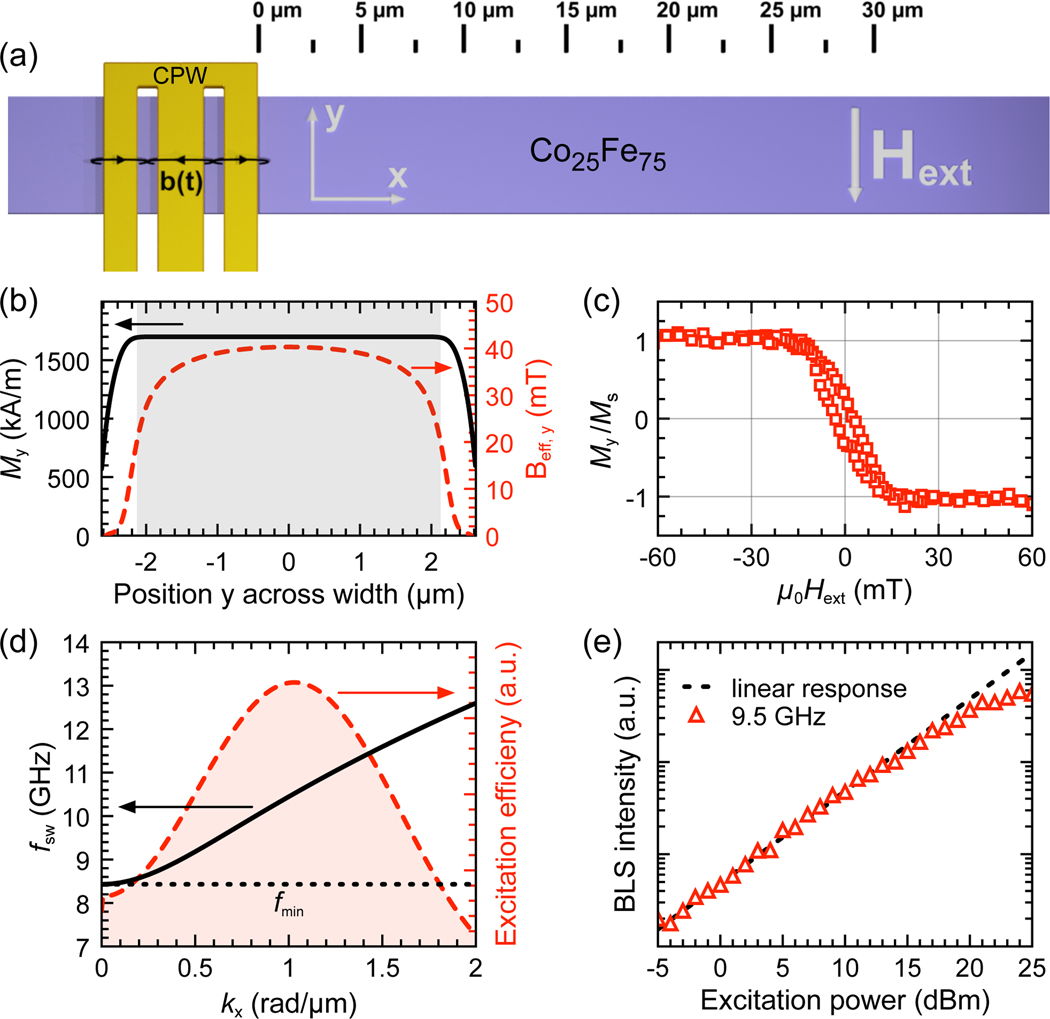
As illustrated in Fig. 1a, we study a 5.25μm wide and 60μm long magnon waveguide that was patterned from a Pt(3)/Cu(3)/Co25Fe75(26)/Cu(3)/Ta(3) multilayer (all thicknesses in nanometers) using electron beam lithography, sputter deposition, and subsequent lift-off. In a previous study, we reported an intrinsic damping for this metallic thin film of α0 ≤ 3.18 × 10⁴ in out-of-plane geometry.9 In a second step, we patterned a Cr(5)/Au(70) film to a coplanar waveguide (CPW) with a 2.1μm wide center conductor, separated by 960nm from the 1.5μm wide ground planes. The magnon waveguide extends up to 38μm on one side of the CPW. Microwave (rf) currents running through the CPW allow for the excitation of magnons with well-defined frequencies and high amplitudes, easily reaching the nonlinear regime.
FIG. 1.
(a) Schematic of the investigated microstructure. Blue depicts the 5.25μm wide Co25Fe75 waveguide, yellow shows the coplanar waveguide (CPW). (b) Micromagnetic simulation of the y-component of the magnetization (black solid line) and of the effective magnetic field Beff,y (red dashed line), both extracted along the width of the waveguide for μ0Hext = 46mT. (c) Hysteresis loop of the waveguide in hard axis direction measured by laser scanning MOKE in the center of the waveguide. (d) Calculated dispersion relation (black solid line) and excitation efficiency of the CPW (red dashed line). (e) BLS intensity measured in a 600MHz window around the excitation frequency frf =9.5 GHz as a function of the excitation power in 1μm distance to the CPW.
In order to achieve magnon propagation in Damon-Eshbach configuration,11 an external magnetic field of μ0Hext = 46mT was applied perpendicularly to the long axis of the waveguide. At this field, the magnetic moments align parallel to the external field over a 4.1μm wide center region, whereas the demagnetization field causes canting of the magnetization at the edges. This is confirmed by micromagnetic simulations using MuMax312 (black solid line in Fig. 1b). Furthermore, laser scanning magneto-optic Kerr effect measurements confirm that the magnetization in the center of the magnon waveguide is saturated for μ0Hext > 20mT (Fig. 1c). Hence, magnon propagation along the waveguide is governed by the characteristic dispersion with as plotted by the black solid line in Fig. 1d. The calculation follows the formalism of Kalinikos and Slavin13 assuming a quantization of the wave vector ky across the stripe with an effective width of 4.1μm and an effective magnetic field of μ0Hext = 40mT, both obtained from micromagnetic simulations (Fig. 1b). For our calculations and micromagnetic simulations, we assume material parameters as in Ref. 9: Aex = 2.6pJ/m, g = 2.051, thickness t = 26nm, and Ms = 1700kA/m. Ms is slightly reduced compared to 1774kA/m reported in Ref. 9 in order to account for heating due to the scanning BLS laser.14 The red dashed line in Fig. 1d plots the excitation efficiency of the CPW which was calculated via a fast Fourier transform of the magnetic field generated by the CPW and has a maximum at ≈ 1 rad/μm but still allows for the excitation of magnons in a broad range of wave vectors.
In order to analyze the influence of nonlinear scattering on magnon propagation, we employed Brillouin light scattering microscopy (μBLS).15,16 This technique relies on the inelastic scattering of light and magnons followed by spectral analysis of the scattered light via a high-resolution interferometer. The incident light, focused with a microscope objective onto the sample, yields a spatial resolution of about 350nm. The advantage of this technique compared to, e.g., time-resolved magneto-optical Kerr effect or ferromagnetic resonance, lies in its capability to detect not only coherent but also incoherent magnons. This means we do not only have access to magnons that are directly excited by microwave fields but also to magnons created by nonlinear processes.
Such nonlinear interactions occur above a critical magnon amplitude. In our experiments, we determine this threshold in terms of a critical microwave power directly supplied by a signal generator without using any amplifiers. To this end, we apply a fixed microwave frequency of frf = 9.5 GHz to the CPW and gradually increase the microwave power from −5dBm to 25dBm. We measure the magnon intensity integrated in a 600MHz window around the excitation frequency in 1μm distance from the antenna (red triangles in Fig. 1e).
In the range between −5dBm and 15dBm, the response of the magnetic system linearly follows the increasing excitation power (dashed black line). Above 15dBm, however, the measured intensities deviate from the extrapolated linear response. In this regime, the intensity is lower than would be expected from the increasing input power, indicating the onset of nonlinear scattering processes, which we will elucidate in more detail below.
Nonlinear processes have extensively been studied in a variety of publications, both experimentally and theoretically.10,17–22 In general, several nonlinear multimagnon scattering processes, often referred to as Suhl instabilities17, can cause a reduction of the population of directly excited magnons, all of which naturally obey energy and momentum conservation. Considering the dispersion relation in Fig. 1d, the lowest order process of three-magnon scattering (one magnon with frf splits in two magnons with f1 + f2 = frf) can be excluded in our system since no states exist to satisfy this condition for frf = 9.5 GHz.
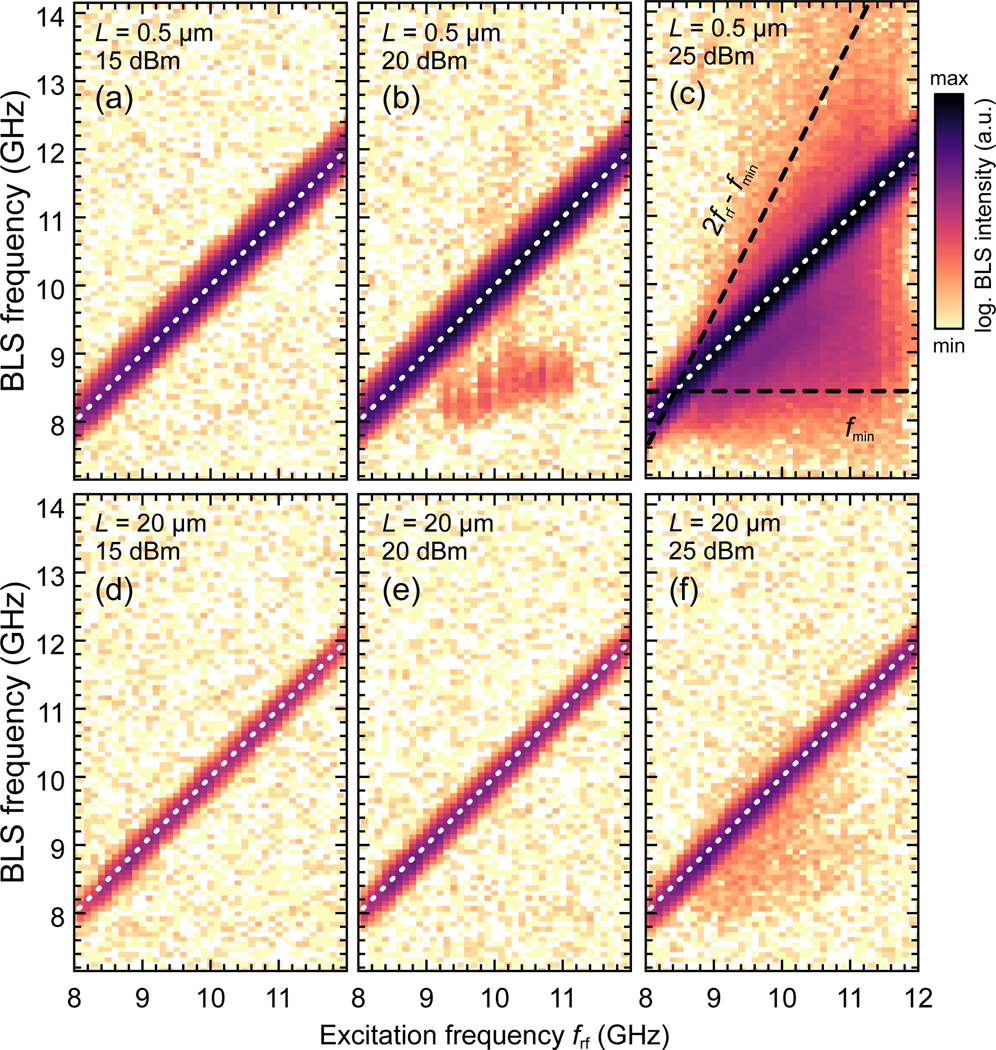
The next higher order nonlinear process is given by four-magnon scattering: two primary magnons, that are excited at frf, scatter and form two secondary magnons with frf ±δf, which is easily possible in our system due to the quasi-linear magnon dispersion over a wide range of wave vectors. To demonstrate that the intensity reduction in Fig. 1e is indeed in accordance with four-magnon scattering, we measure BLS spectra at three different microwave powers (15dBm, 20dBm, and 25dBm) and in two distances L from the antenna (0.5μm and 20μm). The results are summarized in Fig. 2. Each column in the color maps shows a BLS spectrum that was recorded for microwave frequencies ranging from 8 GHz to 12 GHz. The measured intensities are color coded on the same logarithmic scale.
FIG. 2.
μBLS spectra measured in 0.5μm (a-c) and 20μm (d-f) distance to the antenna and at 15dBm (a,d), 20dBm (b,e), and 25dBm (c,f) microwave power. At low powers, the linear response of the magnetization dynamics to the external input dominates (white dotted lines). Especially for the highest power and close to the antenna, four-magnon scattering is apparent, which causes a significant broadening of the excitation spectra. All BLS intensities are plotted on the same logarithmic color scale.
Close to the antenna, at 15dBm (Fig. 2a), the measured magnon frequencies (y-axis) linearly follow the excitation frequency frf (x-axis), as indicated by the white dotted line. For increasing powers (Fig. 2b,c), however, we see a significant broadening around frf. The limits of this broadening are indicated by black dashed lines and match the limits set by the bottom of the magnon manifold (fmin) and energy conservation (2frf – fmin). This broadening is in agreement with previous studies driven at high excitation powers close to the exciting antenna and is a well known evidence for four-magnon scattering.10,21
Note that the intensities of nonlinearly excited magnons above frf (white dashed line in Fig. 2b,c) are lower than in the range from fmin to frf. This can be related to the decreasing detection sensitivity of the BLS microscope with increasing wave vector, i.e., with increasing frequency15. Additionally, in first order approximation, the lifetime of magnons scales inversely with their frequency which reduces the overall population of states with higher frequencies23 and thus leads to a smaller signal.
As a next step, we study the influence of four-magnon scattering on the propagation characteristics in the system. At 20μm distance to the antenna, the detected magnon intensities are attributed only to propagation, which was confirmed by phase-resolved BLS measurements in a previous investigation.9 Nonetheless, Fig. 2f reveals that four-magnon scattering can still be evident at the highest excitation power, revealing the significant impact of four-magnon scattering on magnon propagation at high power levels.
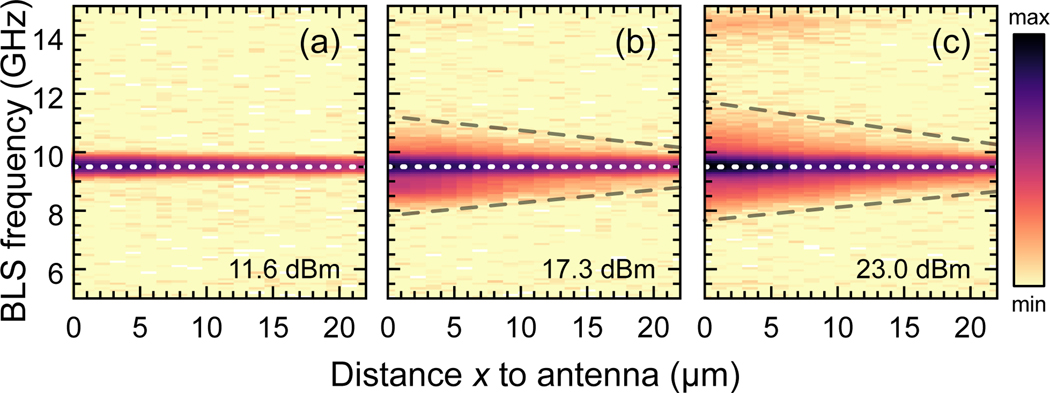
To further elaborate on this phenomenon, we fix the excitation frequency at frf = 9.5 GHz and measure magnon intensities as a function of distance x to the antenna for three different excitation powers (Fig. 3). At 11.6dBm, we detect only magnons that are directly excited at 9.5 GHz (white dotted line) and continuosuly decay along the waveguide. With increasing power (Fig. 3b,c), the detected magnon spectrum broadens again, which is most pronounced close to the antenna and gets more and more narrow with increasing distance (indicated by dashed lines in Fig. 3b,c). One can assume that this spatial profile is defined by several contributions: First, primary magnons excited at frf by the antenna propagate along the waveguide with their amplitude decaying according to their damping. The same is true for secondary magnons that are excited by nonlinear scattering above the nonlinear threshold. In the same manner, they propagate along the waveguide and suffer from damping. Second, four-magnon scattering causes energy flux from the primary to the secondary magnons. This energy flux provides an additional damping channel for the directly excited magnons at frf but also compensates losses of the secondary magnons. The coupling is based on dipoledipole interaction and inversely proportional to the wave vector mismatch of the contributing states19. Therefore, scattering into states i with small δki = |k(ωrf) – k(ωi)| is expected to have lower threshold amplitudes, and to be more efficient. In the case of high excitation powers, this translates into the presence of these scattered states at larger distances from the antenna.
FIG. 3.
μBLS spectra measured along the waveguide for different excitation powers at a fixed excitation frequency frf = 9.5 GHz (white dotted line). The grey dashed lines mark the distribution of magnons that are parametrically excited by four-magnon scattering.
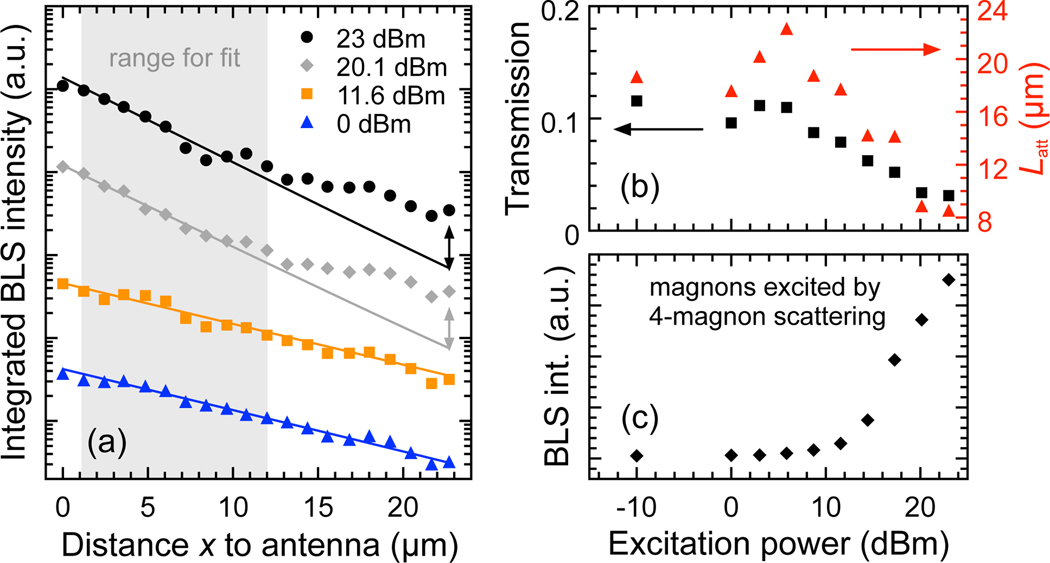
For a more detailed analysis of the nonlinear propagation characteristics, we repeat the same spatial measurements as in Fig. 3 in a broader range of excitation powers. We integrate the BLS intensities over the entire frequency range of primary and secondary magnons and plot this as a function of the distance x to the antenna. Figure 4a shows the integrated intensities exemplarily for 0, 11.6, 20.1, and 23 dBm. The data up to x = 12 μm suggest magnon propagation following a simple exponential decay of the intensity I(x) = exp(−2x/Latt) + c with Latt giving the attenuation length. The constant offset c includes the thermal magnon background as well as thermal noise of the used photon counter. The factor two in the exponent accounts for the measurement of magnon intensities via BLS, which are proportional to the square of the magnon amplitudes. For fitting the data, we consider only the range 1 μm ≤ x ≤ 12 μm and plot the results as solid lines in Fig. 4a.
FIG. 4.
a) Integrated BLS intensities of magnons directly excited at frf =9.5 GHz as a function of the distance x to the antenna for various RF powers. Solid lines show the results of exponential fits in the range between x = 1 μm and x = 12 μm. Measurements at different powers are shifted vertically for clarity. b) Attenuation lengths (red triangles) that were determined for different powers from the exponential fits in a. Relative transmission through the waveguide (black squares) given by the ratio of the integrated intensities measured in 1 μm and 22.7 μm distance to the antenna. c) BLS intensities only of magnons excited by four-magnon scattering (integrated in the ranges fBLS < 9.2 GHz and fBLS > 9.8 GHz) and integrated over all measurement positions.
At 0dBm and 11.6dBm, the fits agree well with the measured data for the entire range of distances from the antenna. However, at 20.1dBm and 23dBm, the fits strongly deviate from the experimental results for x > 12 μm and the measured intensities exceed the predictions of the exponential fits. This already indicates that nonlinear processes have a crucial impact on the propagation of magnons when driven above the critical threshold. Fitting data in a limited range close to the antenna at high excitation powers may lead to an underestimation of the actual decay lengths.
Red triangles in Fig. 4b summarize the attenuation lengths Latt that we obtained from the exponential fits in the range 1 μm ≤ x ≤ 12 μm for all excitation powers. From −10dBm up to 10dBm, the attenuation lengths remain on a constant level around 19 μm. For higher excitation powers, a pronounced reduction of the attenuation lengths occurs, reaching a minimum of 8.5 μm at 23 dBm. However, if we fit the BLS intensities for further distances from the antenna, i.e., x > 12 μm, all fits over the entire power range yield propagation lengths in the range of 20 μm.
As a different means to describe the total signal losses over the propagation length of 22.7 μm, we calculated a transmission factor T = If/Ii, where Ii (If) is the measured intensity at x = 1 μm (x = 22.7 μm), respectively (black squares in Fig. 4b). The power dependence of this parameter is consistent with the determined attenuation lengths. In the investigated range of microwave powers, the transmission is reduced by almost one order of magnitude, showing the significance of four-magnon scattering on the effective losses.
To demonstrate the influence of four-magnon scattering more directly, we integrated only the contributions of the secondary magnons, i.e., we integrated the BLS signal in the ranges fBLS < 9.2 GHz and fBLS > 9.8 GHz. Figure 4c displays the intensity of those magnons, that are excited via four-magnon scattering, as a function of the excitation power. At lower powers, this signal stays within the noise level of the measurement. Only above 12dBm, contributions from four-magnon scattering drastically increase, which is consistent with the decrease of the measured attenuation lengths and transmission in Fig. 4b and the measurement of the threshold for nonlinear four-magnon scattering in Fig. 1e.
In conclusion, we quantitatively studied the impact of nonlinear four-magnon scattering on long range magnon transport in a Co25Fe75 waveguide. The increase of propagation losses coincides with the onset of nonlinear four-magnon scattering. Measurements of the full magnon spectrum along the waveguide showed the presence of nonlinearities for propagation lengths exceeding 10 μm. Our studies show that it is crucial to stay in the linear regime in order to quantify propagation lengths in systems with reduced dimensionality. If one is not aware that the excitation powers already reach the nonlinear regime, one may underestimate the performance of their structure, especially when comparing the results to ferromagnetic resonance measurements on continuous films.
Acknowledgments
Financial support within DFG programme SCHU 2922/1–1 is acknowledged. K.S. acknowledges funding within the Helmholtz Postdoc Programme. LL, LF and MW acknowledge funding by the DFG via projects WE5386/4–1 and WE5386/5–1. The samples were partially fabricated at the Nanofabrication Facilities (Nano-FaRo) at the Institute of Ion Beam Research and Materials Research at HZDR. We thank B. Scheumann for the deposition of the Cr/Au film.
References
- 1.Neusser S and Grundler D. Adv. Mater. 21, 2927–2932 (2009). [Google Scholar]
- 2.Kruglyak VV, Demokritov SO, and Hillebrands B. J. Phys. D 43, 264001 (2010). [Google Scholar]
- 3.Lenk B, Ulrichs H, Garbs F, and Münzenberg M. Phys. Rep. 507, 107–136 (2011). [Google Scholar]
- 4.Chumak AV, Vasyuchka VI, and Hillebrands B. Nature Phys. 11, 453–461 (2015). [Google Scholar]
- 5.Schoen MAW, Thonig D, Schneider ML, Silva TJ, Nembach HT, Eriksson O, Karis O, and Shaw JM, Nat. Physics 12, 839–842 (2016). [Google Scholar]
- 6.Sun Y, Chang H, Kabatek M, Song Y-Y, Wang Z, Jantz M, Schneider W, Wu M, Montoya E, Kardasz B, Heinrich B, te Velthuis SGE, Schultheiss H, and Hoffmann Phys A. Rev. Lett. 111, 106601 (2013). [DOI] [PubMed] [Google Scholar]
- 7.Körner HS, Schoen MAW,Mayer T, Decker MM, Stigloher J, Weindler T, Meier TNG, Kronseder M, and Back CH, Appl. Phys. Lett. 111, 132406 (2017). [Google Scholar]
- 8.Talalaevskij A, Decker M, Stigloher J, Mitra A, Körner HS, Cespedes O, Back CH, and Hickey BJ. Phys. Rev. B 95, 064409 (2013). [Google Scholar]
- 9.Flacke L, Liensberger L, Althammer M, Huebl H, Geprägs S, Schultheiss K, Buzdakov A, Hula T, Schultheiss H, Edwards ERJ, Nembach HT, Shaw JM, Gross R, and Weiler M, Appl. Phys. Lett. 115, 122402 (2019). [PMC free article] [PubMed] [Google Scholar]
- 10.Schultheiss H, Vogt K, and Hillebrands B, Physical Review B 86, 054414 (2012). [Google Scholar]
- 11.Damon RW and Eshbach JR, Phys. Chem. Solids 19, 308–320 (1960). [Google Scholar]
- 12.Vansteenkiste A, Leliaert J, Dvornik M, Helsen M, Garcia-Sanchez F, and Van Waeyenberge B, AIP Adv. 4, 107133 (2014) [Google Scholar]
- 13.Kalinikos BA, Kostylev MP, Kozhus NV, and Slavin AN, Phys J.: Cond. Matter 2, 9861–9877 (1990). [Google Scholar]
- 14.Schultheiss H, Schäfer S, Candeloro P, Leven B, Hillebrands B, and Slavin AN. Phys. Rev. Lett. 100, 047204 (2008). [DOI] [PubMed] [Google Scholar]
- 15.Sebastian T, Schultheiss K, Obry B, Hillebrands B, and Schultheiss H, Front. Phys. 3, 35 (2015). [Google Scholar]
- 16.Wagner K, Kákay A, Schultheiss K, Henschke A, Sebastian T, and Schultheiss H, Nat. Nano. 11, 432–436 (2016). [DOI] [PubMed] [Google Scholar]
- 17.Suhl H, Phys J. Chem. Solids 1, 209–227 (1957). [Google Scholar]
- 18.Demidov VE, Jersch J, Rott K, Krzysteczko P, Reiss G, and Demokritov SO. Phys. Rev. Lett. 102, 177207 (2009). [DOI] [PubMed] [Google Scholar]
- 19.Krivosik P and Patton CE, Phys. Rev. B 82,184428 (2010). [Google Scholar]
- 20.Demidov VE, Ulrichs H, Demokritov SO, and Urazhdin S. Phys. Rev. B 83, 020404(R) (2011). [Google Scholar]
- 21.Bauer H, Majchrak P, Kachel T, Back CH, and Woltersdorf G, Nat. Comm. 6, 8274–8280 (2015). [DOI] [PMC free article] [PubMed] [Google Scholar]
- 22.Schultheiss K, Verba R, Wehrmann F, Wagner K, Körber L, Hula T, Hache T, Kákay A, Awad AA, Tiberkevich V, Slavin AN, Fassbender J, and Schultheiss H, Phys. Rev. Lett. 122, 097202 (2019). [DOI] [PubMed] [Google Scholar]
- 23.Stancil DD and Prabhakar A, Spin Waves. Theory and Applications, Springer Science+Business Media, New York, USA: (2009). [Google Scholar]


