

Abstract
The urgent need for an effective SARS-CoV-2 vaccine has forced development to progress in the absence of well-defined correlates of immunity. While neutralization has been linked to protection against other pathogens, whether neutralization alone will be sufficient to drive protection against SARS-CoV-2 in the broader population remains unclear. Therefore, to fully define protective humoral immunity, we dissected the early evolution of the humoral response in 193 hospitalized individuals ranging from moderate to severe. Although robust IgM and IgA responses evolved in both survivors and non-survivors with severe disease, non-survivors showed attenuated IgG responses, accompanied by compromised Fcɣ receptor binding and Fc effector activity, pointing to deficient humoral development rather than disease-enhancing humoral immunity. In contrast, individuals with moderate disease exhibited delayed responses that ultimately matured. These data highlight distinct humoral trajectories associated with resolution of SARS-CoV-2 infection and the need for early functional humoral immunity.
Keywords: SARS-CoV-2, antibodies, Fc receptors, innate immunity, dynamics, COVID-19
Graphical Abstract
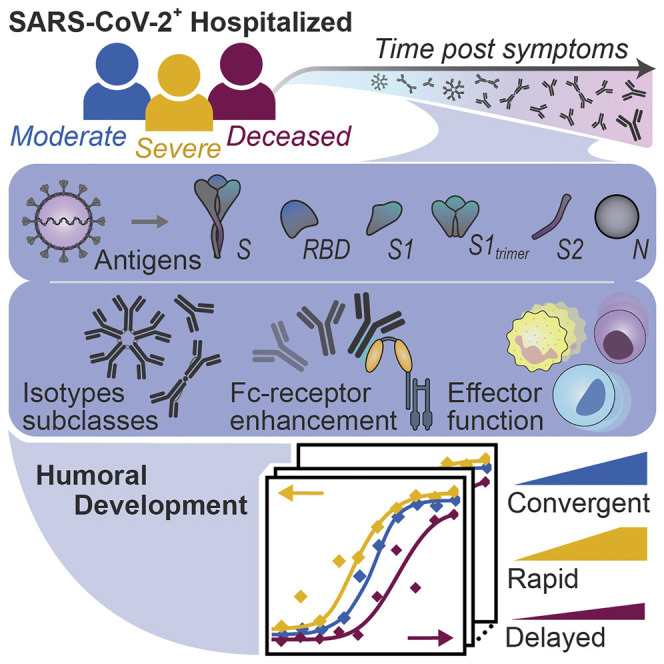
Analyses of the functional humoral trajectories associated with the resolution of SARS-CoV-2 infection find that despite equivalent IgM and IgA immunity to the virus across all levels of disease severity, survival and recovery are linked to early class switching to IgG and the ability to leverage Fcγ receptors targeting the spike protein.
Introduction
The majority of individuals infected with severe acute respiratory syndrome coronavirus 2 (SARS-CoV-2) develop mild symptoms; however, a small but significant proportion of the population develop more severe disease, a fraction of which pass away (Wu and McGoogan, 2020). The rapid spread of infection and unpredictable evolution of disease severity in some infected individuals has overwhelmed hospitals. While a number of comorbidities have been linked to mortality (Richardson et al., 2020; Williamson et al., 2020), emerging data suggest that inflammatory markers and cellular activation track with severity of disease (Kuri-Cervantes et al., 2020; Vaninov, 2020), pointing to a generalized activation of the immune response with progressive infection. Moreover, antibody levels and neutralizing antibody activity increase with the rapid expansion of plasmablast populations in the setting of more severe disease (Kuri-Cervantes et al., 2020), raising the possibility that the humoral immune response may contribute to pathology rather than protection (Zohar and Alter, 2020). However, recent data from vaccine studies point to protective effects of antibodies against SARS-CoV-2 infection and disease (Chandrashekar et al., 2020). It is still unclear whether qualitatively distinct antibodies evolve in individuals who survive severe infection or whether antibody functions track with differential disease severity. Understanding how antibody functions, beyond neutralization, evolve during infection and contribute to recovery rather than pathology may provide key insights for vaccine and therapeutic design to avoid detrimental enhancement and provide highly effective humoral defense.
The acute humoral immune response to SARS-CoV-2 is marked by the rapid evolution of multi-isotype-specific humoral immunity (Long et al., 2020), which is likely involved in the highly compartmentalized antiviral response within the respiratory tract. However, whether specific antibody functional profiles explain the variation seen in viral control remains unclear. Thus, here we comprehensively profiled the humoral immune response to SARS-CoV-2 over the first 3 weeks following symptom onset in depth and used complementary modeling approaches to define whether distinct humoral immune responses evolve among individuals with different degrees of disease severity. A total of 193 hospitalized individuals were included in the study, stratified by disease severity and outcome into three groups: inpatients with moderate infection that recovered, inpatients with severe infection that recovered, and inpatients whose underlying cause of death was coronavirus disease 2019 (COVID-19). Humoral maturation was observed across all three groups, with more rapid and robust evolution in individuals that survived severe infection, with an early and vigorous functional response to S2, just days after symptom onset. Despite comparable evolution of immunoglobulin (Ig)M and IgA responses among survivors and non-survivors with severe disease, non-survivors failed to fully deploy a highly functional IgG response able to coordinate Fc receptor (FcR) binding and elicit innate immune effector function. While neutralizing antibody activity did not differ across the groups, no signatures of antibody enhancement were noted among individuals with severe infection. Conversely, delayed evolution of functional humoral immunity was also observed in individuals with moderate disease, albeit the IgG response continued to evolve overtime. Thus, the data point to the potential importance of early and continued evolution of IgG-recruiting Fc effector function in antiviral control and clearance beyond host defense.
Results
Distinct Weekly Evolution of Antibody Features
The humoral immune response to SARS-CoV-2 evolves rapidly following infection in individuals with symptomatic infection, evolving weeks after symptom onset (Long et al., 2020). Significant heterogeneity in the magnitude of the humoral immune response has been observed across individuals who have survived infection (Robbiani et al., 2020). While neutralizing antibodies have been linked to protection following vaccination in non-human primates (NHPs) (Yu et al., 2020; Folegatti et al., 2020), antibodies may contribute to antiviral control and clearance through various additional mechanisms, via their capacity to interact and leverage the anti-pathogen functions of the innate immune system (Lu et al., 2018; Nimmerjahn and Ravetch, 2008). Preliminary data point to early differences in the immunodominance of the humoral immune response among individuals with different clinical outcomes (Atyeo et al., 2020). However, whether distinct antibody profiles develop over time in individuals with different clinical trajectories remains unclear but could point to immune mechanisms of convalescence. Thus, here we profiled the humoral immune response across three hospitalized cohorts: a group of 82 individuals who did not require admission to the intensive care unit (ICU) and were eventually discharged with moderate disease, a group of 76 individuals who required ICU care but survived severe disease, and group of 35 individuals with severe disease that died due to COVID-19 regardless of type of care (Figure 1 A; Table S1). Individuals were sampled 1–8 times during the first month of infection. These data collectively provided a population-level temporal landscape that could be used to define differences in the trajectories of antibody features across disease outcomes (Data S1).
Figure 1.

Weekly Evolution of SARS-CoV-2-Specific Humoral Immune Responses Following Symptom Onset across Different Clinical Courses
There were 193 plasma samples from hospitalized SARS-CoV-2 infected individuals profiled against the SARS-CoV-2 spike (S) antigen. (A) Of the patients, 82 were not admitted to the ICU and were eventually discharged (moderate), 76 required ICU care but did not succumb to infection (severe), and 35 died of COVID-19 (deceased). Patients were sampled from 1–8 times during their hospital stay. np denotes the number of patients in a group, and nt denotes the total number of samples collected across all individuals. Distributions of titers (B), Fc receptors (C), and functions (D–G) across moderate (blue), severe (yellow), and deceased (red) over the course of 0–7, 8–14, and greater than 14 days against S. The solid white line represents the median, and the dotted lines represent the first and third quartiles. A Kruskal-Wallis test was used to evaluate statistical differences across groups for all intervals and features and was corrected for multiple hypothesis testing using the Benjamini-Hochberg procedure. If statistically significant, a two-sided Mann-Whitney U test was performed for post hoc comparisons. Significance corresponds to the Mann-Whitney U test p values (∗p < 5e−2, ∗∗p < 5e−3, ∗∗∗p < 5e−4, ∗∗∗∗p < 5e−5, ∗∗∗∗∗p < 5e−6). Antibody-dependent cellular phagocytosis (ADCP), antibody-dependent neutrophil phagocytosis (ADNP), antibody-dependent complement deposition (ADCD), antibody-dependent natural killer cell activation (ADNKA). See also Figure S1, Table S1, and Data S1.
A week after onset of symptoms, similar SARS-CoV-2 antigen-specific IgM and IgA titers were observed in all three groups with slightly higher IgA1 spike (S)-specific titers in severe disease survivors. (Figure 1B; Figure S1 A). Similarly, no significant difference was observed in IgG3, the first highly functional IgG subclass selected during acute immune responses (Vidarsson et al., 2014). However, the anti-S IgG1 titers differed significantly between severe and moderate disease and were lower in individuals that died from severe infection. By the second week, significantly higher titers of nearly all the S-specific antibody isotypes and subclasses (Figure 1B), and higher titers across all antigens (Figure S1A), were observed in survivors of severe disease compared to those with moderate disease and those who died. Slower S-specific IgG1 development was noted in both those who died and in individuals with moderate disease. By the third week, IgA and IgM were nearly equivalent across all groups (Figure 1B; Figure S1A). However, individuals with severe and moderate disease generated higher IgG subclass titers compared to the deceased group by the third week, pointing to a convergence of IgG immunity across survivors but a delayed and incomplete evolution among non-survivors. Thus, despite the early robust evolution of IgA and IgM responses among non-survivors, these data argue for a potential selective defect in IgG development associated with COVID-19 mortality.
Figure S1.

Antibody Evolution by Week following Symptoms and RBD-Specific IgG1 Fc Receptor Coordination, Related to Figure 1
(A) 193 plasma samples from hospitalized SARS-CoV-2 infected individuals were profiled against SARS-CoV-2 spike antigen (S), receptor binding domain (RBD), nucleocapsid protein (N), subunit 1 of the spike protein as a trimer (S1 trimer), subunit 1 of spike protein (S1) as a monomer, and subunit 2 of the spike protein (S2). Distributions of titers across moderate (blue), severe (yellow), and deceased (red) individuals are shown in the violin plot over the first, second, and third week following symptom onset. The solid white line represents the median and the dotted lines the first and third quartiles. A Kruskal-Wallis test was used to evaluate statistical differences across groups for all intervals and features and was corrected for multiple hypothesis testing with the Benjamini-Hochberg procedure. If statistically significant then a two-sided Mann-Whitney U test was performed for post hoc comparisons. Significance shown corresponds to the Mann-Whitney U test p values (∗p < 0.5e-1, ∗∗p < 0.5e-2, ∗∗∗p < 0.5e-3, ∗∗∗∗p < 0.5e-4, ∗∗∗∗∗p < 0.5e-5). Antibody dependent cellular phagocytosis (ADCP), antibody dependent neutrophil phagocytosis (ADNP), antibody dependent complement deposition (ADCD), antibody dependent natural killer cell activation (ADNKA).
(B) Spearman correlations were assessed within each clinical group at two- and three-weeks post symptom onset between IgG1 titers and FcɣR binding profiles to assess shifts and changes in antibody glycosylation. Red corresponds to higher correlation, white to no correlation, and blue to anti-correlation.
Compromised Fc Receptor Binding and Effector Function Tracks with COVID-19 Mortality
Given the differences in IgG class switching, we next examined the functional consequences of this defective class-switched response. Specifically, the ability of SARS-CoV-2-specific antibodies to bind to the low-affinity IgG-Fcɣ receptors (FcɣRs) and the IgA-Fc-α-receptor (FcαR), critical for deploying antibody effector function (Nimmerjahn and Ravetch, 2008), was assessed. Binding was assessed to the FcαR and the low-affinity IgG-FcɣR, the activating FcɣR2A and FcɣR3A receptors, the sole human inhibitory receptor FcɣR2B, and the GPI-anchored FcɣR3B receptor (Nimmerjahn and Ravetch, 2008; Otten and van Egmond, 2004). FcɣR binding profiles mirrored changes in IgG1 and IgG3 titers, with early development of S-specific FcɣR2B and S1- and S2-specific FcɣR2B and FcɣR3B binding antibodies in individuals with severe SARS-CoV-2 infection that survived (Figure 1C; Figure S1A). These differences were amplified over time, with FcɣR3A and FcαR binding antibodies reaching relatively similar levels across groups but overall lower FcR binding antibodies in individuals with moderate disease and non-survivors.
Differences in FcR binding results in changes in signaling cascades and distinct antibody-mediated innate immune effector functions (Nimmerjahn and Ravetch, 2008). Therefore, we next probed the consequences of the changes in antibody titer and FcR binding on innate immune effector functions and neutralization (Figure 1D). Low but detectable antibody effector functions were observed in all three groups 1 week following symptoms, with rapid initial development of functional humoral immunity among survivors with severe infection. Notably, by the second week of infection, S-specific antibody-dependent neutrophil phagocytosis (ADNP), complement fixation (ADCD), and neutralization were similar among the severe survivors and non-survivors but were higher than the levels observed in individuals with moderate disease (Figure 1D). Conversely, cellular phagocytosis (ADCP), NK cell-activating (ADNKA) S-specific antibodies, measured by MIP-1b secretion, and receptor-binding domain (RBD)-specific functions were significantly lower in non-survivors compared to survivors of severe infection but were similar in non-survivors and survivors with moderate disease. In particular, RBD-specific monocyte phagocytic antibodies and complement-fixing antibodies remained lower in non-survivors through week three (Figure S1A). Changes in Fc glycosylation directly influence FcɣR binding and effector function (Jefferis et al., 1998). Interestingly, by the second week following symptom onset, broad FcɣR binding associations were observed in survivors of severe disease (Figure S1B) that were lost in individuals who ultimately succumbed to infection, pointing to potential shifts in Fc glycosylation across groups in the setting of continually evolving IgG titers. Thus, two potential temporal shifts in Fc glycosylation may exist during SARS-CoV-2 infection, the first poised to recruit and clear the virus and a second for clearing infected cells. These data collectively point to a disconnect in the evolution of antibody titer and function, with a slower and milder evolution of antibody effector functions among individuals with moderate infection, a rapid and highly functional humoral immune evolution in individuals with severe disease, and a defect in the evolution of particular IgG functions in individuals that ultimately pass away.
Developmental Differences in Humoral Architecture
To further investigate whether specific types of antibody properties or antigen specificities differed across individuals that survived or did not survive severe SARS-CoV-2 infection, polar plots were generated to examine potential patterns in humoral features at 1, 2, and 3 weeks post symptom onset (Figure 2 ). As early as the first week post symptoms, enhanced humoral immunity was observed in severely ill patients that survived infection (Figure 2). While responses holistically increased in both groups, the rise was more uniform and robust among survivors compared to non-survivors. Although there were similar IgA and IgM responses across the two groups, there was an overall trend toward lower IgG3, FcR binding, and Fc functions in the non-survivor,s which were observable by the second week post symptoms but were amplified by week three, similar to what was observed in the univariate analysis (Figure 1). In particular, survivors evolved overall higher phagocytic responses. To probe the global differences in the humoral immune response across the groups, non-parametric combinations of univariate differences for each feature class further revealed significantly higher overall development of FcR binding as early as week one and Fc-functional responses by week three in the severely ill recovered individuals compared to those who died (Figure 2). Ultimately, the majority of antibody features were stunted in those who died with no evidence of disease-enhancing humoral responses linked to mortality. These data highlight more significant qualitative defects in the humoral immune response that track with COVID-19 mortality.
Figure 2.

Weekly Evolution of Humoral Architecture
The polar plots depict the mean percentile of each antibody feature at each interval across the severe (top) and the deceased (bottom) groups. The major slices 1–6 cover antigen-specific isotypes/subclasses, 7–11 antigen-specific antibody Fc receptor binding, and 12–16 antigen-specific antibody mediated functions. For segments 1–11, antigen specificities repeat in the following order: S, RBD, N, S1 trimer, S1, and S2. For segments 12–16, antigen specificities are repeated S, RBD, and N. The size of the wedge depicts the mean percentile ranging from 0–1. On the right, non-parametric combination global p values are shown, composed of Mann-Whitney U test p values for partial tests within each feature type and using the Fisher method for combination (∗p < 0.05).
Longitudinal Variation across Clinical Groups
Given the significant differences across the groups over time, we next aimed to gain enhanced temporal granularity related to the nature of the humoral defect in humoral immunity. Whereas the Uniform Manifold Approximation and Projection (UMAP), which represents high-dimensional data reduced to two-dimensional space, showed limited SARS-CoV-2 humoral immune variation by age and sex (Figures 3A and 3B; Figure S2 ), but variation was observed with respect to time following symptom onset (Figure 3C). Temporal changes in individual humoral features across the groups highlighted distinct humoral trajectories across the patient groups and across antigens and isotypes (Figure 3D). When analyzed by days following symptom onset, rather than weekly intervals (Figures 1 and 2), delays in the rise of IgG, IgA, FcɣR2A, and antibody functions in non-survivors emerged (Figure 3D). All three isotypes appeared to decline more rapidly among the deceased compared to the survivors. Furthermore, no difference was noted in neutralizing antibody evolution between these groups (Figure 3D). Thus, temporal analysis revealed both delayed and incomplete evolution of the humoral immune response among non-survivors of SARS-CoV-2 infection.
Figure 3.

Temporal Evolution of SARS-CoV-2-Specific Antibody Features
(A–C) Uniform Manifold Approximation and Projection (UMAP) was used to visualize the multivariate data in two dimensions. Each point represents a given individual at a single time point and colors indicate age (A), sex (B), and group (C).
(D) Normalized antibody levels are shown over time, plotted by days after symptom onset, for the severe and deceased group. Each dot is an individual measurement, the lines show smoothed non-parametric regression models (loess), and the color indicates the antigen specificity. See also Figure S2 and Data S1.
Figure S2.

Batch Effect Evaluation, Related to Figure 3
(A) The algorithm provides an overview of the evaluation pipeline. The first 40 principal components (PCs) explained more than 95% of the variance and were extracted from z-scored measurements. UMAP was applied to map the extracted PCs into two dimensions, in which the local diversity was quantified by the local inverse Simpson index (LISI).
(B) UMAP visualizations highlight limited antibody profile differences across four of the treatments that were used in the SARS-CoV-2 patients.
(C) UMAP visualizations show the influence of comorbid conditions – immunosuppression, pulmonary disease, and body-mass-index (BMI) - on antibody profiles.
(D) UMAP visualization was used to probe for potential plate-batch effects, where each color represents a different plate run across Systems Serology.
(E) The histograms show the distributions of LISI scores for past pulmonary disease, body-mass-index (BMI), age, sex, and well plate. LISI measures the degree of mixing in an embedding ranging from 1 to the number of categories (e.g., 2 for sex), where larger LISI scores indicate less separation and more mixing. Unknown samples were excluded and the continuous variables BMI and age were grouped in 4 and 7 categories, respectively (BMI: < 25, [25,30), [30, 35), ≥ 35, age: [30,40), [40,50), [50,60), [60,70), [70,80), [80,90), [90,100)). Overall, the histograms show no substantial skewing of the antibody profiles.
Dissecting Specific Temporal Differences in Early Humoral Dynamics
To determine the antibody features that differed most across survivors and non-survivors, Akaike information criterion (AIC) was used to identify the individual humoral characteristics that showed the greatest variation between the severe and deceased groups, based on quantitative kinetics occurring over the first 17 days following symptom onset (Figure 4 A). Among the top 5 features, S2-, S-, and S1 trimer-specific FcɣR binding were highly divergent across the groups, followed by additional RBD- and S1-specific FcɣR binding and S-specific ADCD (Figure 4A). Antibody titers showed less pronounced differences between the groups, highlighting stronger differences in quality, rather than quantity, of antibody evolution during the first 17 days following symptom onset.
Figure 4.

Dissecting Temporal Differences across Groups
(A) The bar plot depicts the ΔAIC of the model without differences between the groups, where the higher height represents the features that explain trajectory differences best between the groups. The bars are colored according to antigen specificity, and the vertical line (ΔAIC = 10) indicates the commonly used threshold for rejecting models.
(B) Four-parameter logistic growth curves were employed to dissect the specific temporal difference across the groups for each feature. The curves were built by y(t) = d + (a − d)/(1 + (t/c)b), with y(t) describing the temporal evolution of the antibody levels based on the days after symptom. Differences were then split by a = defining differences in initial levels, b = the seroconversion speed, c = the seroconversion time, and d = the asymptotic end levels. The influence of the parameters on the shape of the curve is shown for varying parameter values indicated by the color.
(C) The top 10 different features that differed most between the groups are shown. Dots indicate individual patients, diamonds indicate the binned median, the lines indicate the fitted curves corresponding to the optimal model and the color indicates the group. The specific parameters, which differed for the displayed model, are indicated in the left corner. The dots and lines are color-coded according to the group.
(D) The heatmap shows the Akaike weight averaged parameter differences between the groups. Each row represents a parameter (a, b, c, d) and is normalized across the features, the color intensity depicts how different the parameter is across the groups, and the color indicates in which group the parameter is higher. Along the x axis, individual specificities (S, RBD, N, S1 trimer, S1, and S2) are organized in the same repeating order across each Fc variable that was acquired (subclasses, isotypes, FcR binding, and functions).
(E–G) Normalized enrichment scores (a metric of how different the feature is across the two groups) are shown for individual features collapsed by antigen (E), individual antigens (F), and feature “type” (G). The darker the color the more differentially that feature is expressed across the two groups.
(H) Receiver operating characteristic (ROC) curve shows the model performance in a cross-validation framework. In light blue are the ROC curves for each replicate, and the orange is the mean ROC curve showing overall performance. Mean area under curve (AUC) is reported using the mean ROC curve. Classification accuracy was compared to permutated data and significance was assessed using exact p values of the tail probabilities (∗p < 0.05). TPR, true positive rate; FPR, false positive rate.
(I) Features most often selected during the classification process in yellow are shown and ranked based on the magnitude of the enrichment across severe and deceased individuals.
See also Figures S3 and S4.
To gain a deeper sense of how the features differed over time, curves were fitted for each feature and evaluated based on four parameters: (1) “a” = initial levels, (2) “b” = initial seroconversion speed, (3) “c” = seroconversion time, and (4) “d” = endpoint levels (Figure 4B). Analyzing the features that were the most divergent across the groups (Figure 4A), S2-specific FcɣR3B and S-specific FcɣR2B binding levels differed not only at the time of symptom onset (parameter a), but also seroconverted more rapidly (c) over the first few days following symptom onset in the individuals who survived severe SARS-CoV-2 infection (Figure 4C; Figure S3 ). Conversely, S2-specific FcɣR2B and FcɣR2A binding were initially higher in survivors compared to non-survivors but reached similar levels in both groups. Further FcR binding antibodies and S-specific ADCD all showed similar differences in time to seroconversion across the two groups, highlighting the delayed kinetics of this evolution in individuals that did not survive infection. Thus, these data highlight the different temporal changes across the antibody features, pointing to distinct functional consequences in antiviral immunity following infection.
Figure S3.

Temporal Evolutionary Curves of Antibody Features, Related to Figure 4
For each antibody feature, the optimal model fit is shown for each group across each feature. Dots indicate individual patients, diamonds indicate the binned median, the lines indicate the fitted curves corresponding to the optimal model and the color indicates the group. The parameters which are different for the displayed model are indicated in the left corner and color-coded according to the group for which the parameter is higher.
In order to understand generalizable differences in the temporal evolution of the humoral immune response, a composite visual was constructed that summarized kinetic differences in each parameter (a, b, c, d) across each feature and the two group. Early elevated broad IgG1 levels, S1- and S2-specific IgG3, S-specific FcɣR2B, S- and S2-specific FcɣR3A, and S2-specific FcɣR3B were noted, with a notable immunodominance of S2-specific immunity among survivors at the time of symptom onset (parameter a) (Figure 4D). A consistent but more abrupt initial conversion speed (parameter b) was observed in the individuals that ultimately passed away across multiple subclasses, isotypes, FcR binding profiles, and functions, potentially related to their lower early levels. Non-survivors also converted later (parameter c) than survivors across nearly all FcR binding antibodies, with a delay in RBD- and S2-specific FcɣR2B and FcɣR3B binding antibodies. Final overall magnitudes (parameter d) pointed toward higher levels among survivors. Importantly, no single feature was enhanced early or later in individuals who ultimately passed away, further underscoring that no antibody feature pointed to evidence of disease enhancement in this population.
As mentioned above, in comparison to other targets on S, S2-specific responses were already expanded days after symptom onset in severe survivors (Figures 4C and 4D; Figure S3). Given the emerging appreciation for the more conserved nature of S2 across coronaviruses (Braun et al., 2020), the early rise in S2-specific FcR binding antibodies may reflect an early evolution of cross-reactive immunity that may be key to disease control. Conversely, no differences were observed in common-coronavirus RBD-specific humoral immune responses at early time points across the groups, suggesting that the ability to evolve S2-specific cross-reactive immunity, rather than the level of pre-existing immunity to less cross-reactive RBDs, associated with neutralization (Amanat et al., 2020) may play a more critical role in disease recovery (Figure S4 ). These data point to both higher initial and overall levels of IgG and FcR binding antibodies among survivors, especially against the S2 domain. In contrast, non-survivors showed lower initial responses that attempted to converge but largely failed to do so.
Figure S4.

Pre-existing Coronavirus Immunity, Related to Figure 4
60 plasma samples from hospitalized SARS-CoV-2 infected individuals were profiled against the receptor binding domain of HKU1, NL63, and a mixture of influenza antigens. Distributions of titers across moderate (blue), severe (yellow), and deceased (red) individuals are shown in the violin plot collected within the first five days following symptoms. The solid white line represents the median and the dotted lines the first and third quartiles. A Kruskal-Wallis test was used to evaluate statistical differences across groups for all intervals and features and was corrected for multiple hypothesis testing with the Benjamini-Hochberg procedure. No significant differences were detected.
Finally, to determine the individual antibody features that differed most across the two groups, data were integrated, and an enrichment score was calculated for each antibody Fc readout (Figure 4E), each antigen-specificity (Figure 4F), or groups of Fc features (Figure 4G) to define the humoral changes that were most elevated within one group or another. While limited differences were noted in IgG2, IgA, and IgM responses across the two groups, IgG1, IgG3, FcR binding, and functional responses differed most across survivors and non-survivors. These differences were observed similarly across all tested SARS-CoV-2 antigens (Figure 4F). Moreover, when all feature “types” were collapsed, no enrichment was observed for titers, but FcR binding and Fc effector functions were able to resolve individuals across clinical trajectories (Figure 4G). These data highlight that cross-antigen differences in antibody effector function, rather than titer, are most divergent between survivors and non-survivors of SARS-CoV-2 infection.
To illustrate whether survivors with severe disease and those who died could be distinguished within the first week following symptom onset, a random forest selection model was constructed. The model recursively chose a minimal set of features that best distinguished the two groups in a cross-validation framework, resulting in the generation of a model able to robustly classify individuals. The model was able to classify survivors or non-survivors with 72% accuracy (Figures 4H and 4I). Many of the top features selected by the model were higher in survivors, including S-specific functions, FcRs, and IgG3. One feature, N-specific FcαR, was higher in non-survivors, in line with previous observations related to early immunodominance shifts between S and N across individuals that ultimately survive or pass away (Atyeo et al., 2020). Thus, early cross-antigen specific antibodies able to drive rapid control and clearance of the virus represent early biomarkers that resolve disease trajectory and provide insights into humoral functions, and dysfunctions, that may be key to early antiviral containment.
Antibody Profiles Evolve More Slowly with Moderate Disease but Mimic Survivor Profiles
The evolution of early FcR binding and activity in severely infected individuals appeared to emerge as a key correlate of convalescence. However, whether similar antibody profiles developed in individuals with moderate infection remained unclear. Antibody profiles were therefore compared across individuals with moderate and severe infection who survived. Despite the delayed rise in SARS-CoV-2 antibody levels early in infection (Figure 1B; Figure S1), individuals with moderate infection evolved equivalent IgA and IgM levels by the third week following symptoms (Figures 1B and 5A; Figure S1). IgG, FcR binding, and antibody effector functions evolved slowly and remained lower in individuals with moderate disease compared to those with severe disease but continued to develop (Figure 5A). Similarly, trajectory analysis demonstrated delayed subclass and isotype titers, FcR binding, and functional responses in individuals with moderate infection (Figure 5B). As early as 2 weeks following symptoms, individuals with a moderate disease trajectory could be resolved from individuals with severe disease based largely on functional antibody features that were all elevated in individuals with severe disease (Figures 5C and 5D). These data point to similar biophysical, albeit delayed, SARS-CoV-2 antibody profiles among moderately infected individuals that may not require further functional evolution due to early and effective control of the virus.
Figure 5.

Humoral Differences between Moderate and Severe Disease
(A) The polar plots depict the mean percentile of each antibody feature at each interval across the moderate (top) and the severely (bottom) infected individuals. The major slices 1–6 cover antigen-specific isotypes and subclasses, 7–11 antigen-specific antibody Fc receptor binding, and 12–16 antigen-specific antibody-mediated functions. For segments 1–11, antigen specificities repeat in the following order: S, RBD, N, S1 trimer, S1, and S2. For segments 12–16 antigen specificities are repeated S, RBD, and N. The size of the wedge depicts the mean percentile ranging from 0–1. On the right, non-parametric combination global p values are shown, composed of Mann-Whitney U test p values for partial tests within each feature type and using the Fisher method for combination (∗p < 0.05).
(B) Normalized antibody levels are shown over time, by days after symptom onset for the moderate and severe groups. Each dot is an individual measurement, the lines show smoothed non-parametric regression models (loess), and the color indicates the antigen specificity.
(C) The ROC curve shows the model performance in a cross-validation framework. In light blue are the ROC curves for each replicate and the orange represents the mean ROC curve showing overall performance. Mean AUC is reported using the mean ROC curve. Classification accuracy was compared to permutated data, and significance was assessed using exact p values of the tail probabilities (∗p < 0.05). TPR, true positive rate; FPR, false positive rate.
(D) Features most often selected during the classification process. In yellow are features enriched in the individuals with severe infection, and in blue are features enriched in the moderates.
Discussion
In the absence of correlates of immunity, vaccine development efforts have been focused on maximizing antibody titers and neutralization, which have been linked to protection against other pathogens (Chen et al., 2018; Murin et al., 2019; Plotkin, 2010). However, once SARS-CoV-2 infection evolves beyond the upper-respiratory tract, dissemination within the lower-respiratory tract, and even across organs, may require more complex immune responses to fully contain and eradicate the infection. Along these lines, emerging vaccine correlates of immunity point to a critical role for both neutralization and Fc effector functions in protection from infection (Yu et al., 2020). Specifically, S- and RBD-specific complement and phagocytosis have been linked to viral control in the bronchoalveolar fluid (Yu et al., 2020). These data suggest that a potential synergy is required between the antibody antigen-binding domain (Fab) and constant domain (Fc) functions in immunity against SARS-CoV-2, where neutralization provides a first line of defense, and Fc effector functions may provide a second line of defense deeper within the respiratory tract. However, whether the same mechanisms are utilized during natural viral clearance or whether spontaneous resolution of infection may be associated with different antibody mechanisms remains to be determined.
Unlike other viral infections, IgM and IgA arise nearly simultaneously in SARS-CoV-2 infection, likely due to the highly compartmentalized nature of this infection. While individuals with moderate infection exhibited lower levels of these isotypes, the similar levels of IgA and IgM among individuals who survived or did not survive severe infection suggest similar early pathogen burden within the groups. However, while the individuals who survived severe infection successfully class switched to IgG antibodies, with high-affinity FcR binding capacities, individuals who did not survive showed less robust switching and exhibited a delayed evolution of high-affinity FcR binding antibodies and Fc effector function. This suggests an acute systemic developmental defect in the humoral immune response associated with COVID-19 mortality. Moreover, individuals with moderate disease also exhibited delayed humoral immune evolution, pointing to either non-humoral mechanisms of humoral immune control in moderate disease or an exposure to less virus, requiring less aggressive immunity for containment and clearance. Furthermore, given the striking perturbations in cellular immunity reported during infection (Kuri-Cervantes et al., 2020), future studies including autologous antibodies and cellular effectors from infected patients could provide enhanced insights into mechanisms of protection or pathology.
Given the staged evolution of antibody isotypes and the time required for affinity maturation, distinct antibody effector functions likely contribute to restriction of infection at different times during infection. Dissecting the trajectory of the humoral immune profiles with respect to time following symptoms and comparing the evolution of humoral features across groups could point to distinct time-specific mechanisms of immunity against SARS-CoV-2. For example, S2-specific FcR binding differed among the groups very early in infection, with S2-specific FcɣR2B separating the groups from the first day of symptom onset. Given our emerging appreciation for S2 conservation across coronaviruses, it is plausible that the rapid evolution of S2-specific responses, drawn from pre-existing cross-reactive immunity to other coronaviruses may help facilitate initial viral control (Mateus et al., 2020). Conversely, S1 trimer-, S-, and RBD-specific humoral immune profiles split between the groups during the second week of infection, highlighting a delayed response to these specificities. Collated, kinetic differences highlighted the unique early and late enrichment of IgG and FcR binding in individuals who survived compared to those who did not, pointing to a critical need for a very early class switch and maintenance of IgG and FcR binding antibodies for recovery. However, why the deceased class switched to IgA but not to IgG early in disease remains unclear. Emerging data point to the aberrant induction of germinal centers among individuals with severe infection (Kaneko et al., 2020). Due to the compartmentalized mucosal nature of the infection and the ability of T cell-independent IgA class switching to occur at mucosal sites, it is plausible that equivalent early IgA switching may occur across all severely ill individuals (Bergqvist et al., 2010), but a lack of sufficient germinal center support may result in poor IgG switching in those who ultimately pass away. T help is critical for class switching, and T helper selection biases have been noted with age (Haynes and Maue, 2009), diabetes (Walker and von Herrath, 2016), and higher body-mass index (Green and Beck, 2017), comorbidities associated with more severe SARS-CoV-2 disease. Additionally, lymphopenia, cytokine dysregulation, and other tissue architectural pathological manifestations may all alter germinal center activity, contributing to this early incomplete class switching. Therefore, future studies considering the dysregulated cellular states observed in the COVID-19 patients, as well as the collaboration of antibodies with cellular immunity, may reveal additional mechanisms critically important for protection.
Antibody responses clearly accrue with more severe disease, raising discussions about a potential pathological role for humoral immunity in disease severity (Zohar and Alter, 2020). However, here we did not observe any evidence of higher antibody levels or functions in individuals who ultimately passed away, providing limited evidence of antibody enhancement. It is critical to note that beyond their immunological activities, antibodies also represent critical biomarkers of the intensity of antigen-exposure. For instance, antibody levels typically increase with antigen-burden in tuberculosis (Kawahara et al., 2019), human immunodeficiency virus (Tomaras and Haynes, 2009), and malaria infection (Dobbs and Dent, 2016) but do not contribute to enhanced disease in these settings. Thus, distinguishing the quantitative changes that simply track with pathogen burden from the qualitative changes in antibodies that drive immunity or pathology may be key to unlocking the mechanistic changes that lead to effective immunity.
Neutralization did not differ across the groups in early infection but instead developed with severity of disease. Whereas emerging vaccine studies point to neutralization as a key correlate of immunity (van Doremalen et al., 2020), after establishment of infection, neutralization may play less of a role in controlling the pathogen. Instead, Fc effector functions are likely critical for the recognition of infected cells and clearance of new virus. In the context of vaccination, then, neutralization and Fc effector function are likely to be key collaborative correlates required to provide first and second line defense in antiviral control, as has been recently observed in vaccinated NHP (Yu et al., 2020). However, given that only a small proportion of NHPs develop severe disease, like their human counterparts, assessing the impact of these vaccines on attenuating severe disease remains difficult outside of very large primate studies. Nonetheless, harmonizing human pathogenesis studies with NHP vaccine studies offers a unique opportunity to uncover the key correlates of immunity to guide vaccine development.
While no influence was observed in antibody profiles across therapeutic interventions or comorbid conditions, these data argue for independent influences of lung disease-associated pathophysiological changes in collaboration with SARS-CoV-2-specific antibody profiles in shaping disease outcome. However, collectively, the work here argues for the evolution of a robust, protective functional humoral immunity among individuals who develop severe infection that is perturbed soon after infection among non-survivors. Defining early biomarkers that identify individuals on a deleterious clinical trajectory may provide early opportunities to triage individuals to better and more intense care. Alternatively, these data also highlight the importance of accessing the full range of humoral immune functions to fully provide protection from SARS-CoV-2 infection and disease.
Limitation of Study
There are several limitations in this study. First, given that patients are admitted and discharged at different stages during their disease trajectories, identical temporal sampling was not possible across all samples. However, given the large number of samples, temporal trajectories were constructed across clinical groups. Moreover, complementary modeling approaches were used to ensure that the trajectories were representative of the patient class and that conserved signatures of protection were identified across the groups. Additionally, antibody-mediated functional assays were performed with cells from healthy donors rather than autologous cells from the infected patients. However, recent findings suggest that COVID-19 patients, especially those with severe disease, exhibit unique cellular deficiencies and perturbated cellular states (Kuri-Cervantes et al., 2020). Therefore, future studies investigating the composite effects of humoral functional immunity linked to altered cell states observed in COVID-19 patients may reveal additional mechanisms critically important for mechanistically understanding protection. Lastly, peripheral antibodies were analyzed in this study. However, localized production of antibodies may result in the production of localized antibodies with distinct functional properties that may drive unique protective or pathological functions. Thus, future studies focused on compartment-specific antibody functional profiles may also provide enhanced resolution on protective or pathological functions of antibodies at the site of viral infection and replication.
Collectively, the data presented here argue for a role for functional humoral immunity in the resolution of severe SARS-CoV-2 infection. Although additional cohorts may provide future mechanistic insights into the specific signals that result in the generation of these protective humoral immune responses, these data point to specific antibody functions that may be of high value in vaccine or therapeutic design.
STAR★Methods
Key Resources Table
| REAGENT or RESOURCE | SOURCE | IDENTIFIER |
|---|---|---|
| Antibodies | ||
| APC-Cy7 Mouse Anti-Human CD16 | BD Biosciences | CAT#557758; RRID:AB_396853 |
| CD56 PE-Cy7 Mouse Anti-Human CD56 | BD Biosciences | CAT#557747; RRID:AB_396853 |
| PE MIP-1b Mouse anti-Human | BD Biosciences | CAT#550078; RRID:AB_393549 |
| Pacific Blue™ Mouse Anti-Human CD3 | BD Biosciences | CAT#558117; RRID:AB_1595437 |
| FITC Goat IgG anti-C3 | MP Biomedicals | CAT#: 855385 |
| Mouse Anti-Human IgG1-Fc PE | Southern Biotech | CAT # 9054-09; RRID:AB_2796628 |
| Mouse Anti-Human IgG2-Fc PE | Southern Biotech | CAT # 9060-09; RRID:AB_2796635 |
| Mouse Anti-Human IgG3-Hinge PE | Southern Biotech | CAT # 9210-09; RRID:AB_2796701 |
| Mouse Anti-Human IgG4-Fc PE | Southern Biotech | CAT # 9200-09; RRID:AB_2796693 |
| Mouse Anti-Human IgA1-Fc PE | Southern Biotech | CAT # 9130-09; RRID:AB_2796656 |
| Mouse Anti-Human IgM-Fc PE | Southern Biotech | CAT # 9020-09; RRID:AB_2796577 |
| BV605 Mouse Anti-Human CD11b | BD Biosciences | CAT# 562721; RRID:AB_2737745 |
| Bacterial and Virus Strains | ||
| SARS-CoV-2-S pseudovirus with a luciferase reporter | This paper | N/A |
| Chemicals, Peptides, and Recombinant Proteins | ||
| SARS-CoV-2 S | Obtained from the lab of Dr. Eric Fischer | N/A |
| SARS-CoV-2 RBD | Obtained from the lab of Dr. Aaron Schmidt | N/A |
| HKU1 RBD | Obtained from the lab of Dr. Aaron Schmidt | N/A |
| NL63 RBD | Obtained from the lab of Dr. Aaron Schmidt | N/A |
| SARS-CoV-2 N | Aalto Bio Reagents | CAT # CK 6404-b |
| Human Fc receptors | Produced at the Duke Human Vaccine Institute, {Boesch, 2014 #15} |
N/A |
| Streptavidin-R-Phycoerythrin | Prozyme | CAT#:PJ31S |
| FIX&Perm Cell Permeabilization Kit | Life Tech | CAT#: GAS001S100 CAT#: GAS002S100 |
| Brefeldin A | Sigma Aldrich | CAT #: B7651 |
| GolgiStop | BD Biosciences | CAT #: 554724 |
| Luciferase Assay Reagent | Promega | CAT#: E1483 |
| SARS-CoV-2 S1 trimer | Kindly provided by Bing Chen | N/A |
| SARS-CoV-2 S1 | Sino Biological | CAT #: 40591-V08B1 |
| SARS-CoV-2 S2 | Sino Biological | CAT #: 40590-V08B |
| HA A/Michigan/45/2015 (H1N1) | Immunetech | IT-003-00105DTMp |
| HA A/Singapore/INFIMH-16-0019/2016 (H3N2) | Immunetech | IT-003-00434DTMp |
| HA B/Phuket/3073/2013 | Immunetech | IT-003-B11DTMp |
| Critical Commercial Assays | ||
| BirA-500: BirA biotin-protein ligase standard reaction kit | Avidity | CAT#: BirA500 |
| RosetteSep Human NK Cell Enrichment Cocktail | Stem Cell Technologies | CAT#: 15065 |
| Steady-Glo Luciferase Assay | Promega | CAT#: E2510 |
| Deposited Data | ||
| Generated Data and Code | This paper | Mendeley Data: http://dx.doi.org/10.17632/97m5dtkg4t.1 |
| Experimental Models: Cell Lines | ||
| THP-1 Cells | ATCC | CAT#: TIB-202 RRID: CVCL_0006 |
| HL-60 | ATCC | CAT#: CCL-240 |
| Recombinant DNA | ||
| psPAX2 | AIDS Reagent | CAT#11348 |
| pLenti-CMV Puro-Luc | Addgene | CAT#17447 |
| pcDNA3.1-SARS CoV-2.SDCT | This paper | N/A |
| pcDNA3.1(-)-hACE2 | Addgene | CAT# 1786 |
| Software and Algorithms | ||
| Intellicyt ForeCyt Software | Sartorious | https://intellicyt.com/products/software/ |
| Python programming language | Version 3.6.8 | https://www.python.org/ |
| R programming language | Version 3.6.1 | https://www.r-project.org/ |
| Other | ||
| FluoSpheres™ NeutrAvidin™-Labeled Microspheres, 1.0 μm, yellow-green fluorescent (505/515), 1% solids | Invitrogen | CAT#: F8776 |
| FluoSpheres™ NeutrAvidin™-Labeled Microspheres, 1.0 μm, red fluorescent (505/515), 1% solids | Invitrogen | CAT#: F8775 |
| MagPlex microspheres | Luminex corporation | CAT#: MC12001-01, MCI12040-01, MCI10077-01 |
Resource Availability
Lead Contact
Further information and requests for resources and reagents should be directed to and will be fulfilled by the Lead Contact, Galit Alter (galter@partners.org).
Materials Availability
This study did not generate new unique reagents.
Data and Code Availability
The dataset generated for the study (Data S1) and the code (Data S2) used for analysis have been made available in the supplemental material. Additional supplemental items are also available at Mendeley Data: http://dx.doi.org/10.17632/97m5dtkg4t.1.
Experimental Model and Subject Details
Sample Cohort
Plasma samples from 193 subjects infected with SARS-CoV-2, from Massachusetts General Hospital (MGH), were included in this study. Individuals were tested for SARS-CoV-2 by real-time reverse-transcriptase–polymerase-chain-reaction (RT-PCR) using nasopharyngeal swabs. Subjects that tested positive were enrolled in the study upon hospital admission, and samples at admission were included in this study (Figure 1A; Table S1). Patients were admitted to the hospital due to moderate to severe symptoms of COVID-19 and were followed over multiple time points (ranging from 1-8 time points per individual). Disease outcome was classified as either discharged or deceased. Severity of disease was classified by admission to the intensive care unit (ICU). All enrolled participants gave written, informed consent. Demographic information including age, and whether patients were immunosuppressed are summarized across the groups (Table S1). Plasma samples from 32 hospitalized individuals which tested negative by RT-PCR were used as negative controls throughout the study. All experimental data was captured in two technical replicates and the average value was reported for all assays. This study was approved by the MGH Human Subjects Institutional Review Board.
Primary Immune Cells
Fresh peripheral blood was collected by the MGH Blood bank from healthy human volunteers. All volunteers gave signed consent and were over 18 years of age, and all samples were de-identified before use. The study was approved by the MGH Institutional Review Board. Human NK cells were isolated from fresh peripheral blood and maintained at 37°C, 5% CO2 in RPMI with 10% fetal bovine serum, L-glutamine, penicillin/streptomycin.
Cell Lines
HL-60 cells (ATCC), a promyelocytic leukemia cell line, were grown in IMDM supplemented with 20% fetal bovine serum and penicillin/streptomycin at 37°C, 5% CO2. For neutrophil differentiation, the media was supplemented with 1.25% DMSO for THP-1 cells (ATCC), a monocytic leukemia cell line, was maintained in RPMI supplemented with 10% fetal bovine serum, L-glutamine, penicillin/streptomycin, HEPES, and beta-mercaptoethanol. THP-1 cells were grown at 37°C, 5% CO2.
Method Details
Luminex
Antigen-specific antibody subclass/isotype and Fc-receptor (FcR) binding levels were measured using a 384-well based customized multiplexed Luminex assay, as previously described (Brown et al., 2012). This high-throughput assay allows for the assessment of relative antibody concentration against SARS-CoV-2 RBD, HKU1 RBD, NL63 RBD (all kindly provided by Aaron Schmidt, Ragon Institute), SARS-CoV-2 nucleocapsid (N) protein (Aalto Bio Reagents), and SARS-CoV-2 spike protein (S) (kindly provided by Eric Fischer, Dana Farber) as well as S1 (Sino Biological, 40591-V08B1), S1 trimer (provided by Bing Chen), S2 (Sino Biological, 40590-V08B), and a mix of HA A/Michigan/45/2015 (H1N1), HA A/Singapore/INFIMH-16-0019/2016 (H3N2), B/Phuket/3073/2013 (Immunetech). In brief, antigens were covalently bound to fluorescent carboxyl- modified microspheres (Luminex) by NHS-ester linkages using EDC and Sulfo-NHS (Thermo Scientific). Antigen-coupled beads were then washed and blocked before adding plasma samples at an appropriate sample dilution (1:500 for IgG1, 1:1000 for all Fc- receptors, and 1:100 for all other isotype/subclass readouts). After an overnight incubation at 4°C while shaking at 700rpm, immune complexed microspheres were washed using an automated plate washer (Tecan) with 0.1% BSA 0.02% Tween-20. Antigen-specific antibody titers were detected using a PE-coupled detection antibody for each subclass and isotype (IgG1, IgG2, IgG3, IgA1 and IgM, Southern Biotech), and Fc-receptors were fluorescently labeled with PE before addition to immune complexes (FcR-2A, −2B, −3A, −3B, Duke Protein Production facility). Plasma samples were acquired via flow cytometry, using an iQue (Intellicyt) and S-Lab robot (PAA). Analysis was done using ForeCyt software by gating on fluorescent bead regions and PE median fluorescent intensity (MFI) was reported as readout for antigen-specific antibody titers.
Effector Functional Assays
Bead-based assays were used to quantify antibody-dependent cellular phagocytosis (ADCP), antibody-dependent neutrophil phagocytosis (ADNP) and antibody-dependent complement deposition (ADCD) in the MGH SARS-CoV-2 cohort, as previously described (Ackerman et al., 2011; Worley et al., 2018; Lu et al., 2016; Fischinger et al., 2019; Karsten et al., 2019). Yellow (ADNP and ADCP) as well as red (ADCD) fluorescent neutravidin beads (Thermo Fisher) were coupled to biotinylated SARS-CoV-2 RBD, N and S antigens and incubated with diluted plasma (ADCP and ADNP 1:100, ADCD 1:10) to allow immune complex formation for 2 h at 37°C. To assess the ability of sample antibodies to induce monocyte phagocytosis, THP-1 s (ATCC) were added to the immune complexes at 1.25E5cells/mL and incubated for 16 h at 37°C. For ADNP, HL-60 cells were differentiated into CD11-expressing neutrophils with media including 1.25% DMSO for 5 days as described previously (Worley et al., 2018), cells were maintained below 1E6 cells/mL. On day 5, 5E5 cells/mL were added per well to immune complexed yellow beads and incubated for 16 h at 37°C. Afterward, neutrophils were stained with an anti-CD11 BV605 detection antibody (Biolegend) and fixed with 4% paraformaldehyde (Alfa Aesar). In order to measure antibody-dependent deposition of C3, lyophilized guinea pig complement (Cedarlane) was reconstituted according to manufacturer’s instructions and diluted in gelatin veronal buffer with calcium and magnesium (GBV++) (Boston BioProducts). Subsequently, C3 was detected with an anti-C3 fluorescein-conjugated goat IgG fraction detection antibody (Mpbio).
Antibody-dependent NK cell activity was measured via an ELISA-based assay, as described previously (Chung et al., 2015). Briefly, plates were coated with 3mg/mL of antigen (SARS-CoV-2 RBD, N and S) and blocked overnight at 4°C. NK cells were isolated the day prior via RosetteSep (Stem Cell Technologies) from healthy buffy coats (MGH blood donor center) and rested overnight in 1 ng/mL IL-15 at 1.5E5 cells/mL (Stemcell). The next day, diluted plasma samples were added to the antigen-coated plates (1:50 dilution) and incubated for 2 h at 37þC. NK cells were mixed with a staining cocktail containing CD107a PE-Cy5 (BD), Golgi stop (BD) and Brefeldin A (BFA, Sigma Aldrich) and 2.5E5 cells/mL were added per well and incubated for 5 h at 37þC. Following, cells were fixed (Perm A, Life Tech) and stained for surface markers with anti-CD16 APC-Cy7 (BD), anti-CD56 PE-Cy7 (BD) and anti-CD3 PacBlue (BD). Subsequently, cells were permeabilized using Perm B (Life Tech) and intracellularly stained with an anti-MIP-1b PE (BD) antibody.
All assays were acquired via flow cytometry with iQue (Intellicyt) and an S-Lab robot (PAA). For ADCP, events were gated on singlets and bead-positive cells, whereas neutrophils were defined as CD11 positive events followed by gating on bead-positive neutrophils. A phagocytosis score was calculated for ADCP and ADNP as (percentage of bead-positive cells) x (MFI of bead-positive cells) divided by 10000. ADCD was reported as median of C3 deposition. NK cells were defined as CD3-, CD16+ and CD56+. Data were reported as the percentage of cells positive for CD107a and MIP-1b.
Neutralization
Neutralization was determined using a SARS-CoV-2 pseudovirus expressing a luciferase reporter gene, as described previously (Yang et al., 2004). To generate the pseudovirus, the packaging construct psPAX2 (Cat# 11348, AIDS Reagent), luciferase reporter plasmid pLenti-CMV Puro-Luc (Cat# 17447, Addgene) and Spike protein expressing pcDNA3.1-SARS CoV-2.SDCT were transfected in HEK293T cells by the calcium phosphate method at a ratio of 1:1:0.5. Supernatants were collected and filtered with a 0.45-μm filter 48 h post-transfection. For the neutralization assay, HEK293Ts were transfected with pcDNA3.1(-)-hACE2 (Cat# 1786, Addgene). The hACE2-expressing HEK293T cells were plated in 96-well plates 12 h after transfection at a density of 20,000 cells/well and rested overnight. Serum was heat inactivated by incubation at 56°C for 30 min. Heat inactivated serum was twofold serially diluted, mixed with 50uL of pseudovirus, and incubated at 37°C incubator for 1 h. After incubation, the serum/pseudovirus mixed was added to the HEK293T/hACE2 cells. Six h after infection, cell medium was replenished. Cells were lysed in Steady-Glo Luciferase Assay (Promega) 48 h after infection. A luciferase assay was performed with luciferase assay reagent (Promega) according to the manufacturer’s protocol. NT50 was defined as the concentration of serum required to achieve half maximal neutralization.
Quantification and Statistical Analysis
All analyses were performed using python version 3.6.8, and R version 3.6.1. Raw data and custom code are available in Supplementary Information.
Polar Plots
Polar plots summarize the mean percentile of clinical groups across day ranges from symptom onset. First, percentile rank scores were determined for each feature across all time ranges. Samples which were sampled multiple times within an interval were represented by the mean value, and mean percentiles were determined using samples corresponding to intervals and clinical groups.
Non-Parametric Combination
Global statistical differences of feature types between groups were assessed using non-parametric combination (Pesarin and Salmaso, 2010; Winkler et al., 2016). Briefly, for each feature class (i.e., IgG) partial tests consisting of p values determined by Mann-Whitney U tests were performed for each sub feature (i.e., IgG1 RBD, IgG1 N, etc.), then p values were combined using the Fisher method. Next, the data was permutated a thousand times, preserving the permutated structure for partial tests, and was used to construct a null distribution of global statistics. Finally, the true global statistic was directly compared the null distribution and the global p value was determined.
Batch Effect Evaluation
To evaluate batch effects by confounders including age, sex, body-mass-index (BMI), well plate and past pulmonary disease, UMAP (McInnes et al., 2018) based methods were used to reduce the high-dimensional serological data into a two-dimensional space for qualitative evaluation, and then quantified by the degree of local neighborhood diversity using local inverse Simpson’s Index (LISI) (Korsunsky et al., 2019) (Figure S2A). First, titers and FcR features were log10 transformed. Then, using the first 40 principle components (PCs) that explain more than 95% of the variance, variation was extracted by principal component analysis (PCA) (Wold et al., 1987) using the ‘prcomp’ function in R package ‘stats’. Next, the principal components were mapped into a two-dimensional space through the UMAP technique implemented using the R package ‘umap’ with fine-tuned parameters (neighbor = 30, min. dist = 0.1). Finally, the LISI score was calculated using the R package ‘immunogenomics/LISI’. The score ranged from one to the number of categories and was used to evaluate the degree of mixing in the UMAP embedded space. The larger the LISI score, the higher the degree of heterogeneity among the samples and, therefore, the smaller the confounding effect. Unknown samples (for BMI and previous pulmonary diseases) were excluded and the continuous variables BMI and age were grouped in 4 and 7 categories, respectively (BMI: < 25, [25,30), [30, 35), ≥ 35, age: [30,40), [40,50), [50,60), [60,70), [70,80), [80,90), [90,100). The observations for the continuous variables were the same when using a local average score instead of categorizing the samples.
Temporal Analysis
First, the Luminex measurements and ADCD were log10 transformed. All measurements were normalized such that the minimal value across groups was 0, and the maximal value was 1. For visualization, a non-parametric regression model was employed to obtain a smoothed line using the R function ‘loess’ (span = 0.7). It is critical to note, that the late rise of some curves is attributable to a limited number of late time points, and not due to a true elevation in antibody levels. To understand and determine differences in the antibody dynamics between the groups, we described the dynamics of each antibody feature y at the group-level using a four-parameter logistic growth curve:
with t denoting the days after symptom onset, and a, b, c, and d denoting biological parameters for the initial antibody levels at the day of symptom onset (a), the initial seroconversion speed (b), the time of 50% seroconversion (c) and the asymptotic end levels (d). To detect differences between the individuals who survived severe SARS-CoV-2 infection and those who did not, we built models that describe the dynamics of both groups simultaneously, allowing for combinations of parameters to differ between the groups, while the others are shared between the groups. With 4 parameters, there are 16 possible combinations/models for each feature that could potentially explain the antibody feature dynamics. For each feature, each of the 16 models was fitted to the data using maximum likelihood estimation, treating each measurement as an independent data point and assuming that differences in measurements arose due to measurement noise. We employed a Laplacian likelihood function, which has been shown to be robust against outliers in the data (Maier et al., 2017).
In addition to the parameters a, b, c, and d, also the noise parameter was estimated from the data. Therefore, the simplest model assuming that there is no difference between the two groups has 5 parameters, while the most complex model has 9 parameters and allows all curve parameters to differ. The corresponding likelihood functions were maximized using a multi-start gradient-based optimization (Raue et al., 2013) with parameter boundaries and 50 starts which were increased to 500 if the maximal value was not found more than 3 times within a log-likelihood threshold of 0.1. Due to improved numerical performance, the parameters were estimated in log10-space (Hass et al., 2019).
To detect whether there were differences between the groups, and, furthermore, decide which particular differences were most distinct across the groups, we calculated the Akaike Information Criterion (AIC) (Akaike, 1973):
for each of the 16 models. Here, denoted the number of parameters of model i and log-likelihood function evaluated at the maximum likelihood estimate. The AIC rewards a good fit and penalizes a higher number of parameters to avoid overfitting and, thus, low values of AIC are preferable. The model with the lowest AIC value was then chosen to be the best model and, commonly, models with a difference in AIC values:
that were higher than 10 were rejected (Burnham and Anderson, 2002). To analyze the overall differences in parameters across the groups (Figure 4D), the maximum likelihood estimates for all 16 models were combined by weighting the contribution of individual models by the Akaike weight:
Weights for models that were not plausible were ranked low, and, therefore, did not contribute to the parameter estimate.
Enrichment Analysis
Enrichment of features determined to be different between groups was determined using the same framework employed by Gene Set Enrichment Analysis (GSEA) (Subramanian et al., 2005). The R package ‘fgsea’ was used to determine normalized enrichment scores (Sergushichev, 2016). ΔAIC were used as weights and null distributions were constructed with size matched random selection of features over 10000 times.
Classification of Clinical Groups
Random forest (Pedregosa et al., 2011) classification models were trained to distinguish clinical groups using minimal sets of features, to avoid overfitting and identify features that were most predictive. Data were not corrected or transformed prior to analysis but features for which 70% of values fell below one standard deviation above the mean of SARS-CoV-2 negative samples were pruned. Samples which had multiple time points within a time interval were represented as a single mean value.
Models were trained and tested in a fourfold cross-validation framework using random stratified sampling to ensure the groups are represented each set. Within each fold, random forest hyperparameters (number of estimators, max depth, and max features) which best optimize balanced accuracy were selected based on the training set with a random search in a threefold cross validation framework. Balanced subsampling during bootstrapping was used for the construction of each random forest model. Once hyperparameters were determined the minimal set of features which optimizes out of bag accuracy on the training set is selected using recursive feature elimination with fourfold cross validation. Finally, a random forest classifier was fit using both the selected hyperparameters and minimal features and used to predict the test set. Multiple iterations of fold-specific feature selections were performed to determine the features which best distinguish clinical groups and the stability of the results.
Performance was determined using receiver operating characteristic curves (ROC) and summarized with the area under curves (AUC). ROC curves were constructed for each repetition using probability estimates, and the mean ROC curve was determined by using the mean probability for each sample across replicates. Performance and robustness of the model was also contrasted to negative control models built from permuted data. Within each fold of the model the training set labels were shuffled, and classification accuracies were generated using the same process. These control models were generated 50 times for each repetition. Predicted and true outcomes were compared to determine accuracy. Robustness was defined as the exact p values of the tail probabilities of the true distributions within the control distributions. Reported are the median p values across ten independent cross-validation repetitions (Ojala and Garriga, 2010).
Acknowledgments
We thank the SAMANA Kay MGH Research Scholarship, Nancy Zimmerman, Bruce Walker, Mark and Lisa Schwartz, an anonymous donor (financial support), and Terry and Susan Ragon for their support. We would also like to thank Bing Chen for protein production efforts. We acknowledge support from the Ragon Institute of MGH, MIT, the Massachusetts Consortium on Pathogen Readiness (MassCPR), the NIAID (U01CA260476, U19 AI35995, R37AI80289, R01AI146785), and the U.S. Centers for Disease Control and Prevention (CK000490).
Author Contributions
Conceptualization, T.Z., C.L., S.F., C.A., C.W., D.A.L., and G.A.; Methodology, T.Z., C.L., S.F., C.A., C.W., D.L., and G.A.; Formal Analysis, T.Z., C.L., C.W., and D.A.L.; Investigation, S.F., C.A., M.D.S., J.B., J.Y., J.F., B.M.H., A.G.S., T.C., and Y.C.; Recourses, R.C.C.; Data Curation, C.L. and R.C.C.; Writing – Original Draft, T.Z., C.L., S.F., C.A., and G.A.; Writing – Review & Editing, T.Z., C.L., S.F., C.A., D.A.L., E.T.R., R.C.C., and G.A.; Visualization, T.Z., C.L., and C.W.; Supervision, D.A.L. and G.A.
Declaration of Interests
G.A. is a founder of SeromYx Systems, Inc. The Systems Serology platform is pending as a patent to G.A. No other authors have interests to declare.
Published: November 3, 2020
Footnotes
Supplemental Information can be found online at https://doi.org/10.1016/j.cell.2020.10.052.
Supplemental Information
a Information about acute respiratory distress syndrome was not available for 15 individuals in the severe group, and 8 of the deceased group. b Information about past pulmonary diseases was not available for 1 individual in the moderate group, 3 in the severe group, and 3 in the deceased group. c Information about body-mass-index was not available for 13 individuals in the moderate group, 13 in the severe group, and 3 in the deceased group.
Data includes raw values, and sample demographics and descriptors
References
- Ackerman M.E., Moldt B., Wyatt R.T., Dugast A.-S., McAndrew E., Tsoukas S., Jost S., Berger C.T., Sciaranghella G., Liu Q., et al. A robust, high-throughput assay to determine the phagocytic activity of clinical antibody samples. J. Immunol. Methods. 2011;366:8–19. doi: 10.1016/j.jim.2010.12.016. [DOI] [PMC free article] [PubMed] [Google Scholar]
- Akaike H. In: Second International Symposium on Information Theory. Petrov B.N., Caski F., editors. Akadémiai Kiadó; 1973. Information theory and an extension of the maximum likelihood principle; pp. 267–281. [Google Scholar]
- Amanat F., Stadlbauer D., Strohmeier S., Nguyen T.H.O., Chromikova V., McMahon M., Jiang K., Arunkumar G.A., Jurczyszak D., Polanco J., et al. A serological assay to detect SARS-CoV-2 seroconversion in humans. Nat. Med. 2020;26:1033–1036. doi: 10.1038/s41591-020-0913-5. [DOI] [PMC free article] [PubMed] [Google Scholar]
- Atyeo C., Fischinger S., Zohar T., Slein M.D., Burke J., Loos C., McCulloch D.J., Newman K.L., Wolf C., Yu J., et al. Distinct Early Serological Signatures Track with SARS-CoV-2 Survival. Immunity. 2020;53:524–532.e4. doi: 10.1016/j.immuni.2020.07.020. [DOI] [PMC free article] [PubMed] [Google Scholar]
- Bergqvist P., Stensson A., Lycke N.Y., Bemark M. T cell-independent IgA class switch recombination is restricted to the GALT and occurs prior to manifest germinal center formation. J. Immunol. 2010;184:3545–3553. doi: 10.4049/jimmunol.0901895. [DOI] [PubMed] [Google Scholar]
- Braun J., Loyal L., Frentsch M., Wendisch D., Georg P., Kurth F., Hippenstiel S., Dingeldey M., Kruse B., Fauchere F., et al. SARS-CoV-2-reactive T cells in healthy donors and patients with COVID-19. Nature. 2020 doi: 10.1038/s41586-020-2598-9. [DOI] [PubMed] [Google Scholar]
- Brown E.P., Licht A.F., Dugast A.-S., Choi I., Bailey-Kellogg C., Alter G., Ackerman M.E. High-throughput, multiplexed IgG subclassing of antigen-specific antibodies from clinical samples. J. Immunol. Methods. 2012;386:117–123. doi: 10.1016/j.jim.2012.09.007. [DOI] [PMC free article] [PubMed] [Google Scholar]
- Burnham K., Anderson D. Model Selection and Multimodel Inference: a Practical Information-theoretic Approach. Springer; 2002. [Google Scholar]
- Chandrashekar A., Liu J., Martinot A.J., McMahan K., Mercado N.B., Peter L., Tostanoski L.H., Yu J., Maliga Z., Nekorchuk M., et al. SARS-CoV-2 infection protects against rechallenge in rhesus macaques. Science. 2020;369:812–817. doi: 10.1126/science.abc4776. [DOI] [PMC free article] [PubMed] [Google Scholar]
- Chen X., Liu S., Goraya M.U., Maarouf M., Huang S., Chen J.-L. Host Immune Response to Influenza A Virus Infection. Front. Immunol. 2018;9:320. doi: 10.3389/fimmu.2018.00320. [DOI] [PMC free article] [PubMed] [Google Scholar]
- Chung A.W., Kumar M.P., Arnold K.B., Yu W.H., Schoen M.K., Dunphy L.J., Suscovich T.J., Frahm N., Linde C., Mahan A.E., et al. Dissecting Polyclonal Vaccine-Induced Humoral Immunity against HIV Using Systems Serology. Cell. 2015;163:988–998. doi: 10.1016/j.cell.2015.10.027. [DOI] [PMC free article] [PubMed] [Google Scholar]
- Dobbs K.R., Dent A.E. Plasmodium malaria and antimalarial antibodies in the first year of life. Parasitology. 2016;143:129–138. doi: 10.1017/S0031182015001626. [DOI] [PMC free article] [PubMed] [Google Scholar]
- Fischinger S., Fallon J.K., Michell A.R., Broge T., Suscovich T.J., Streeck H., Alter G. A high-throughput, bead-based, antigen-specific assay to assess the ability of antibodies to induce complement activation. J. Immunol. Methods. 2019;473:112630. doi: 10.1016/j.jim.2019.07.002. [DOI] [PMC free article] [PubMed] [Google Scholar]
- Folegatti P.M., Ewer K.J., Aley P.K., Angus B., Becker S., Belij-Rammerstorfer S., Bellamy D., Bibi S., Bittaye M., Clutterbuck E.A., et al. Safety and immunogenicity of the ChAdOx1 nCoV-19 vaccine against SARS-CoV-2: a preliminary report of a phase 1/2, single-blind, randomised controlled trial. Lancet. 2020;396:467–478. doi: 10.1016/S0140-6736(20)31604-4. [DOI] [PMC free article] [PubMed] [Google Scholar]
- Green W.D., Beck M.A. Obesity altered T cell metabolism and the response to infection. Curr. Opin. Immunol. 2017;46:1–7. doi: 10.1016/j.coi.2017.03.008. [DOI] [PMC free article] [PubMed] [Google Scholar]
- Hass H., Loos C., Raimúndez-Álvarez E., Timmer J., Hasenauer J., Kreutz C. Benchmark problems for dynamic modeling of intracellular processes. Bioinformatics. 2019;35:3073–3082. doi: 10.1093/bioinformatics/btz020. [DOI] [PMC free article] [PubMed] [Google Scholar]
- Haynes L., Maue A.C. Effects of aging on T cell function. Curr. Opin. Immunol. 2009;21:414–417. doi: 10.1016/j.coi.2009.05.009. [DOI] [PMC free article] [PubMed] [Google Scholar]
- Jefferis R., Lund J., Pound J.D. IgG-Fc-mediated effector functions: molecular definition of interaction sites for effector ligands and the role of glycosylation. Immunol. Rev. 1998;163:59–76. doi: 10.1111/j.1600-065x.1998.tb01188.x. [DOI] [PubMed] [Google Scholar]
- Kaneko N., Kuo H.-H., Boucau J., Farmer J.R., Allard-Chamard H., Mahajan V.S., Piechocka-Trocha A., Lefteri K., Osborn M., Bals J., et al. Loss of Bcl-6-expressing T follicular helper cells and germinal centers in COVID-19. Cell. 2020;183:143–157.e13. doi: 10.1016/j.cell.2020.08.025. [DOI] [PMC free article] [PubMed] [Google Scholar]
- Karsten C.B., Mehta N., Shin S.A., Diefenbach T.J., Slein M.D., Karpinski W., Irvine E.B., Broge T., Suscovich T.J., Alter G. A versatile high-throughput assay to characterize antibody-mediated neutrophil phagocytosis. J. Immunol. Methods. 2019;471:46–56. doi: 10.1016/j.jim.2019.05.006. [DOI] [PMC free article] [PubMed] [Google Scholar]
- Kawahara J.Y., Irvine E.B., Alter G. A Case for Antibodies as Mechanistic Correlates of Immunity in Tuberculosis. Front. Immunol. 2019;10:996. doi: 10.3389/fimmu.2019.00996. [DOI] [PMC free article] [PubMed] [Google Scholar]
- Korsunsky I., Millard N., Fan J., Slowikowski K., Zhang F., Wei K., Baglaenko Y., Brenner M., Loh P.R., Raychaudhuri S. Fast, sensitive and accurate integration of single-cell data with Harmony. Nat. Methods. 2019;16:1289–1296. doi: 10.1038/s41592-019-0619-0. [DOI] [PMC free article] [PubMed] [Google Scholar]
- Kuri-Cervantes L., Pampena M.B., Meng W., Rosenfeld A.M., Ittner C.A.G., Weisman A.R., Agyekum R.S., Mathew D., Baxter A.E., Vella L.A., et al. Comprehensive mapping of immune perturbations associated with severe COVID-19. Sci. Immunol. 2020;5:eabd7114. doi: 10.1126/sciimmunol.abd7114. [DOI] [PMC free article] [PubMed] [Google Scholar]
- Long Q.-X., Liu B.-Z., Deng H.-J., Wu G.-C., Deng K., Chen Y.-K., Liao P., Qiu J.-F., Lin Y., Cai X.-F., et al. Antibody responses to SARS-CoV-2 in patients with COVID-19. Nat. Med. 2020;26:845–848. doi: 10.1038/s41591-020-0897-1. [DOI] [PubMed] [Google Scholar]
- Lu L.L., Chung A.W., Rosebrock T.R., Ghebremichael M., Yu W.H., Grace P.S., Schoen M.K., Tafesse F., Martin C., Leung V., et al. A Functional Role for Antibodies in Tuberculosis. Cell. 2016;167:433–443.e14. doi: 10.1016/j.cell.2016.08.072. [DOI] [PMC free article] [PubMed] [Google Scholar]
- Lu L.L., Suscovich T.J., Fortune S.M., Alter G. Beyond binding: antibody effector functions in infectious diseases. Nat. Rev. Immunol. 2018;18:46–61. doi: 10.1038/nri.2017.106. [DOI] [PMC free article] [PubMed] [Google Scholar]
- Maier C., Loos C., Hasenauer J. Robust parameter estimation for dynamical systems from outlier-corrupted data. Bioinformatics. 2017;33:718–725. doi: 10.1093/bioinformatics/btw703. [DOI] [PubMed] [Google Scholar]
- Mateus J., Grifoni A., Tarke A., Sidney J., Ramirez S.I., Dan J.M., Burger Z.C., Rawlings S.A., Smith D.M., Phillips E., et al. Selective and cross-reactive SARS-CoV-2 T cell epitopes in unexposed humans. Science. 2020;370:89–94. doi: 10.1126/science.abd3871. [DOI] [PMC free article] [PubMed] [Google Scholar]
- McInnes L., Healy J., Melville J. UMAP: Uniform Manifold Approximation and Projection for Dimension Reduction, arXiv:1802.03426. Cornell University; 2018. [Google Scholar]
- Murin C.D., Wilson I.A., Ward A.B. Antibody responses to viral infections: a structural perspective across three different enveloped viruses. Nat. Microbiol. 2019;4:734–747. doi: 10.1038/s41564-019-0392-y. [DOI] [PMC free article] [PubMed] [Google Scholar]
- Nimmerjahn F., Ravetch J.V. Fcgamma receptors as regulators of immune responses. Nat. Rev. Immunol. 2008;8:34–47. doi: 10.1038/nri2206. [DOI] [PubMed] [Google Scholar]
- Ojala M., Garriga G.C. Permutation Tests for Studying Classifier Performance. J. Mach. Learn. Res. 2010;11:1833–1863. [Google Scholar]
- Otten M.A., van Egmond M. The Fc receptor for IgA (FcalphaRI, CD89) Immunol. Lett. 2004;92:23–31. doi: 10.1016/j.imlet.2003.11.018. [DOI] [PubMed] [Google Scholar]
- Pedregosa F., Varoquaux G., Gramfort A., Michel V., Thirion B., Grisel O., Blondel M., Prettenhofer P., Weiss R., Dubourg V., et al. Scikit-learn: Machine Learning in Python. J. Mach. Learn. Res. 2011;12:2825–2830. [Google Scholar]
- Pesarin F., Salmaso L. John Wiley & Sons, Ltd; 2010. Permutation Tests for Complex Data. [Google Scholar]
- Plotkin S.A. Correlates of protection induced by vaccination. Clin. Vaccine Immunol. 2010;17:1055–1065. doi: 10.1128/CVI.00131-10. [DOI] [PMC free article] [PubMed] [Google Scholar]
- Raue A., Schilling M., Bachmann J., Matteson A., Schelker M., Kaschek D., Hug S., Kreutz C., Harms B.D., Theis F.J., et al. Lessons learned from quantitative dynamical modeling in systems biology. PLoS ONE. 2013;8:e74335. doi: 10.1371/journal.pone.0074335. [DOI] [PMC free article] [PubMed] [Google Scholar]
- Richardson S., Hirsch J.S., Narasimhan M., Crawford J.M., McGinn T., Davidson K.W., Barnaby D.P., Becker L.B., Chelico J.D., Cohen S.L., et al. the Northwell COVID-19 Research Consortium Presenting Characteristics, Comorbidities, and Outcomes Among 5700 Patients Hospitalized With COVID-19 in the New York City Area. JAMA. 2020;323:2052–2059. doi: 10.1001/jama.2020.6775. [DOI] [PMC free article] [PubMed] [Google Scholar]
- Robbiani D.F., Gaebler C., Muecksch F., Lorenzi J.C.C., Wang Z., Cho A., Agudelo M., Barnes C.O., Gazumyan A., Finkin S., et al. Convergent antibody responses to SARS-CoV-2 in convalescent individuals. Nature. 2020;584:437–442. doi: 10.1038/s41586-020-2456-9. [DOI] [PMC free article] [PubMed] [Google Scholar]
- Sergushichev A.A. An algorithm for fast preranked gene set enrichment analysis using cumulative statistic calculation. bioRxiv. 2016 doi: 10.1101/060012. [DOI] [Google Scholar]
- Subramanian A., Tamayo P., Mootha V.K., Mukherjee S., Ebert B.L., Gillette M.A., Paulovich A., Pomeroy S.L., Golub T.R., Lander E.S., Mesirov J.P. Gene set enrichment analysis: a knowledge-based approach for interpreting genome-wide expression profiles. Proc. Natl. Acad. Sci. USA. 2005;102:15545–15550. doi: 10.1073/pnas.0506580102. [DOI] [PMC free article] [PubMed] [Google Scholar]
- Tomaras G.D., Haynes B.F. HIV-1-specific antibody responses during acute and chronic HIV-1 infection. Curr. Opin. HIV AIDS. 2009;4:373–379. doi: 10.1097/COH.0b013e32832f00c0. [DOI] [PMC free article] [PubMed] [Google Scholar]
- van Doremalen N., Lambe T., Spencer A., Belij-Rammerstorfer S., Purushotham J.N., Port J.R., Avanzato V., Bushmaker T., Flaxman A., Ulaszewska M., et al. ChAdOx1 nCoV-19 vaccination prevents SARS-CoV-2 pneumonia in rhesus macaques. bioRxiv. 2020 doi: 10.1101/2020.05.13.093195. [DOI] [PMC free article] [PubMed] [Google Scholar]
- Vaninov N. In the eye of the COVID-19 cytokine storm. Nat. Rev. Immunol. 2020;20:277. doi: 10.1038/s41577-020-0305-6. [DOI] [PMC free article] [PubMed] [Google Scholar]
- Vidarsson G., Dekkers G., Rispens T. IgG subclasses and allotypes: from structure to effector functions. Front. Immunol. 2014;5:520. doi: 10.3389/fimmu.2014.00520. [DOI] [PMC free article] [PubMed] [Google Scholar]
- Walker L.S.K., von Herrath M. CD4 T cell differentiation in type 1 diabetes. Clin. Exp. Immunol. 2016;183:16–29. doi: 10.1111/cei.12672. [DOI] [PMC free article] [PubMed] [Google Scholar]
- Williamson E.J., Walker A.J., Bhaskaran K., Bacon S., Bates C., Morton C.E., Curtis H.J., Mehrkar A., Evans D., Inglesby P., et al. Factors associated with COVID-19-related death using OpenSAFELY. Nature. 2020;584:430–436. doi: 10.1038/s41586-020-2521-4. [DOI] [PMC free article] [PubMed] [Google Scholar]
- Winkler A.M., Webster M.A., Brooks J.C., Tracey I., Smith S.M., Nichols T.E. Non-parametric combination and related permutation tests for neuroimaging. Hum. Brain Mapp. 2016;37:1486–1511. doi: 10.1002/hbm.23115. [DOI] [PMC free article] [PubMed] [Google Scholar]
- Wold S., Esbensen K., Geladi P. Principal Component Analysis. Chemom. Intell. Lab. Syst. 1987;2:37–52. [Google Scholar]
- Worley M.J., Fei K., Lopez-Denman A.J., Kelleher A.D., Kent S.J., Chung A.W. Neutrophils mediate HIV-specific antibody-dependent phagocytosis and ADCC. J. Immunol. Methods. 2018;457:41–52. doi: 10.1016/j.jim.2018.03.007. [DOI] [PubMed] [Google Scholar]
- Wu Z., McGoogan J.M. Characteristics of and Important Lessons From the Coronavirus Disease 2019 (COVID-19) Outbreak in China: Summary of a Report of 72 314 Cases From the Chinese Center for Disease Control and Prevention. JAMA. 2020;323:1239–1242. doi: 10.1001/jama.2020.2648. [DOI] [PubMed] [Google Scholar]
- Yang Z.Y., Kong W.P., Huang Y., Roberts A., Murphy B.R., Subbarao K., Nabel G.J. A DNA vaccine induces SARS coronavirus neutralization and protective immunity in mice. Nature. 2004;428:561–564. doi: 10.1038/nature02463. [DOI] [PMC free article] [PubMed] [Google Scholar]
- Yu J., Tostanoski L.H., Peter L., Mercado N.B., McMahan K., Mahrokhian S.H., Nkolola J.P., Liu J., Li Z., Chandrashekar A., et al. DNA vaccine protection against SARS-CoV-2 in rhesus macaques. Science. 2020;369:806–811. doi: 10.1126/science.abc6284. [DOI] [PMC free article] [PubMed] [Google Scholar]
- Zohar T., Alter G. Dissecting antibody-mediated protection against SARS-CoV-2. Nat. Rev. Immunol. 2020;20:392–394. doi: 10.1038/s41577-020-0359-5. [DOI] [PMC free article] [PubMed] [Google Scholar]
Associated Data
This section collects any data citations, data availability statements, or supplementary materials included in this article.
Supplementary Materials
a Information about acute respiratory distress syndrome was not available for 15 individuals in the severe group, and 8 of the deceased group. b Information about past pulmonary diseases was not available for 1 individual in the moderate group, 3 in the severe group, and 3 in the deceased group. c Information about body-mass-index was not available for 13 individuals in the moderate group, 13 in the severe group, and 3 in the deceased group.
Data includes raw values, and sample demographics and descriptors
Data Availability Statement
The dataset generated for the study (Data S1) and the code (Data S2) used for analysis have been made available in the supplemental material. Additional supplemental items are also available at Mendeley Data: http://dx.doi.org/10.17632/97m5dtkg4t.1.