Abstract
PSR J0537–6910, also known as the Big Glitcher, is the most prolific glitching pulsar known, and its spin-induced pulsations are only detectable in X-ray. We present results from analysis of 2.7 years of NICER timing observations, from 2017 August to 2020 April. We obtain a rotation phase-connected timing model for the entire timespan, which overlaps with the third observing run of LIGO/Virgo, thus enabling the most sensitive gravitational wave searches of this potentially strong gravitational wave-emitting pulsar. We find that the short-term braking index between glitches decreases towards a value of 7 or lower at longer times since the preceding glitch. By combining NICER and RXTE data, we measure a long-term braking index n = −1.25 ± 0.01. Our analysis reveals 8 new glitches, the first detected since 2011, near the end of RXTE, with a total NICER and RXTE glitch activity of 8.88 × 10⁻⁷ yr−1. The new glitches follow the seemingly unique time-to-next-glitch—glitch-size correlation established previously using RXTE data, with a slope of 5 d μHz−1. For one glitch around which NICER observes two days on either side, we search for but do not see clear evidence of spectral nor pulse profile changes that may be associated with the glitch.
Keywords: gravitational waves, stars: neutron, pulsars: individual: PSR J0537–6910, X-rays: individual: PSR J0537–6910
1. INTRODUCTION
With a spin frequency v ≈ 62 Hz (spin period P ≈ 16 ms), PSR J0537–6910 is the fastest-rotating young pulsar known and is located in the 1–5 kyr old supernova remnant N157B (Wang & Gotthelf 1998; Chen et al. 2006) in the Large Magellanic Cloud at a distance of 49.6 kpc (Pietrzyński et al. 2019). Its spin rate is only measurable at X-ray and gamma-ray energies up to ~60 keV (Marshall et al. 1998; Kuiper & Hermsen 2015), and the pulsar has the highest spin-down energy loss rate Ė = 4.9 × 1038 erg s−1 among more than 2800 known pulsars (Manchester et al. 2005). While the pulsar’s spin frequency decreases over the entire 13 years of RXTE observation from 1999–2011 at a rate v̇ ≈̇ −1.99 × 10⁻¹⁰ Hz s−1, PSR J0537–6910 underwent a remarkable 42 or 45 spin-up glitches, yielding an average glitch rate of > 3.2 yr−1 (Marshall et al. 2004; Middleditch et al. 2006; Antonopoulou et al. 2018; Ferdman et al. 2018), and its glitch sizes are larger than those seen in most glitching pulsars (Espinoza et al. 2011; Yu et al. 2013; Fuentes et al. 2017; Ho et al. 2020). Because of its high glitch activity, PSR J0537–6910 proves to be extremely useful in theoretical understanding of the mechanism that produces glitches (Link et al. 1999; Melatos et al. 2008; Andersson et al. 2012; Chamel 2013; Ho et al. 2015), which is thought to be due to unpinning of superfluid vortices in the star’s crust and possibly its core (Anderson & Itoh 1975; Alpar et al. 1984).
What makes PSR J0537–6910 even more extraordinary is the predictability of when its glitches occur. Middleditch et al. (2006); Antonopoulou et al. (2018); Ferdman et al. (2018) measure a linear correlation between glitch size Δv and time to next glitch, with a slope of ~ 0.2 μHz d−1 and prediction accuracy of days (see Section 4.2). Such a clear correlation does not seem to hold for any other pulsar and may be unique to PSR J0537–6910 (Melatos et al. 2018). Fuentes et al. (2019) find the large glitches of the Vela pulsar show a weak correlation, Akbal et al. (2017) predict Vela glitch times to an accuracy of about ±0.4 yr, and Melatos & Drummond (2019) predict the next glitch for three other pulsars but with large uncertainties of ±0.7, 4, and 5 yr. Furthermore, statistical analyses give some indication that glitch sizes and times to next glitch each show a bimodal distribution in the case of PSR J0537–6910 (Howitt et al. 2018). Glitch times also appear quasi-periodic (Middleditch et al. 2006; Melatos et al. 2008).
PSR J0537–6910 is of additional interest because of its potential as a source of detectable gravitational waves (GWs). The frequencies at which PSR J0537–6910 might emit GWs are in the most sensitive frequency band of ground-based detectors (around 100 Hz; Abbott et al. 2019c). There is also tantalizing but speculative evidence shown by Andersson et al. (2018) for the generation of GWs in this pulsar by a stellar oscillation, i.e., r-mode oscillation (Andersson 1998; Friedman & Morsink 1998; Andersson & Kokkotas 2001). The most sensitive searches for continuous GW emission from known pulsars use contemporaneous electromagnetic observations to track a pulsar’s spin evolution and thereby reduce the large parameter space of a search (Abbott et al. 2019c). Such a targeted search has not been done in the advanced detector era for PSR J0537–6910 (cf. narrow-band search; Fesik & Papa 2020a,b) because of the lack of a timing model to compare to GW data, and an accurate phase-connected model is not possible over long times without monitoring because of the pulsar’s high glitch rate.
With the demise of RXTE in 2012, the 42 glitches of PSR J0537–6910 measured by Ferdman et al. (2018) or 45 glitches measured by Antonopoulou et al. (2018) are all the ones obtainable from existing data prior to NICER; the difference in glitch numbers is due to small glitches just above or below detection thresholds. NICER began observing PSR J0537–6910 soon after launch in 2017 June. As we show here, NICER clearly detects the pulsar’s spin rate, with typical pulse time-of-arrival (TOA) uncertainties (< 100 μs) generally better than those obtained using RXTE. In Section 2, we describe NICER observations of PSR J0537–6910 and timing analysis of these observations. In Section 3, we present our timing model and measurements of braking indices of PSR J0537–6910. In Section 4, we discuss measured glitches and their properties. In Section 5, we summarize and discuss some implications of our results.
2. NICER DATA
We process and filter NICER data on PSR J0537–6910 using HEASoft 6.22–6.26 and NICERDAS 2018-03-01_V003-2020-01-08_V006c. We exclude all events from “hot” detector 34, which gives elevated count rates in some circumstances, and portions of exposure accumulated during passages through the South Atlantic Anomaly. While NICER is sensitive to 0.25–12 keV photons, we make an energy cut and extract only events from 1–7 keV, where pulsations are easily detected (see, e.g., Marshall et al. 1998; Kuiper & Hermsen 2015). We ignore time intervals of enhanced background affecting all detectors by constructing a light curve binned at 16 s and removing intervals strongly contaminated by background flaring when the count rate exceeds 10 c s−1. NICER experienced a time stamp anomaly which resulted in incorrect time stamps for data taken with MPU1 between 2019 July 8 and 23; we follow the recommended procedure for excluding MPU1 data within this time window1. Using these filtering criteria, we obtain clean data with count rates ~ 3 c s−1 for use in pulse timing analysis. We do not conduct spectral analyses using NICER data, except for a small subset (see Section 4.3), since the large non-imaging field of view implies an extracted spectrum that will primarily be due to that of the supernova remnant and such spectra from X-ray imaging telescopes are presented in other studies (Chen et al. 2006; Kuiper & Hermsen 2015).
We combine sets of individual ObsIDs into merged observations, with each merged observation yielding a single time-of-arrival (TOA) measurement. ObsIDs are combined such that there is sufficient exposure to confidently detect the spin frequency of PSR J0537–6910, with typical total exposures of 4–9 ks (see below), and merged ObsIDs are those acquired usually within a 3–4 day span and on rare occasions within 6–7 days. We obtain 95 merged observations for the data and timespan (2017 August 17 to 2020 April 25) presented here2. Before performing a pulsation search, we use barycorr to transform between Terrestrial Time, used for event time stamps, and Barycentric Dynamical Time (TDB). We adopt the JPL DE421 solar system ephemeris and the Chandra sky position of PSR J0537–6910 measured by Townsley et al. (2006), i.e., R.A. = 05h37m47s.416, ; note the (1σ) difference in position from that measured by Chen et al. (2006).
Acceleration searches are conducted using PRESTO (Ransom et al. 2002), with searches using a time bin of 0.5 ms and usually including 8 harmonics given the narrow pulse profile of PSR J0537–6910 (see, e.g., Section 4.3). Pulsations at the spin frequency (v ≈ 61.9 Hz) are almost always the strongest detected. Data are folded at the candidate pulse frequency using prepfold and a refined frequency is determined. On occasion, further iterations are performed to obtain a more robust measurement. Figure 1 shows the difference between the candidate spin frequency measurement from each merged observation and a simple linear model of frequency evolution, v4 + v̇4(t − t4), arbitrarily set to values obtained from the fourth segment of data. The slope evident in some segments is due to a difference in actual v̇ for that segment. Each segment is separated by the occurrence of a glitch. Finally, we determine the TOA for each merged observation by cross-correlation with a template pulse profile generated from fitting a Gaussian to a series of NICER pulse profiles of PSR J0537–6910. Figure 2 shows the measured uncertainty of each TOA (top panel) and total exposure time of each merged observation that is used for each TOA measurement (bottom panel).
Figure 1.
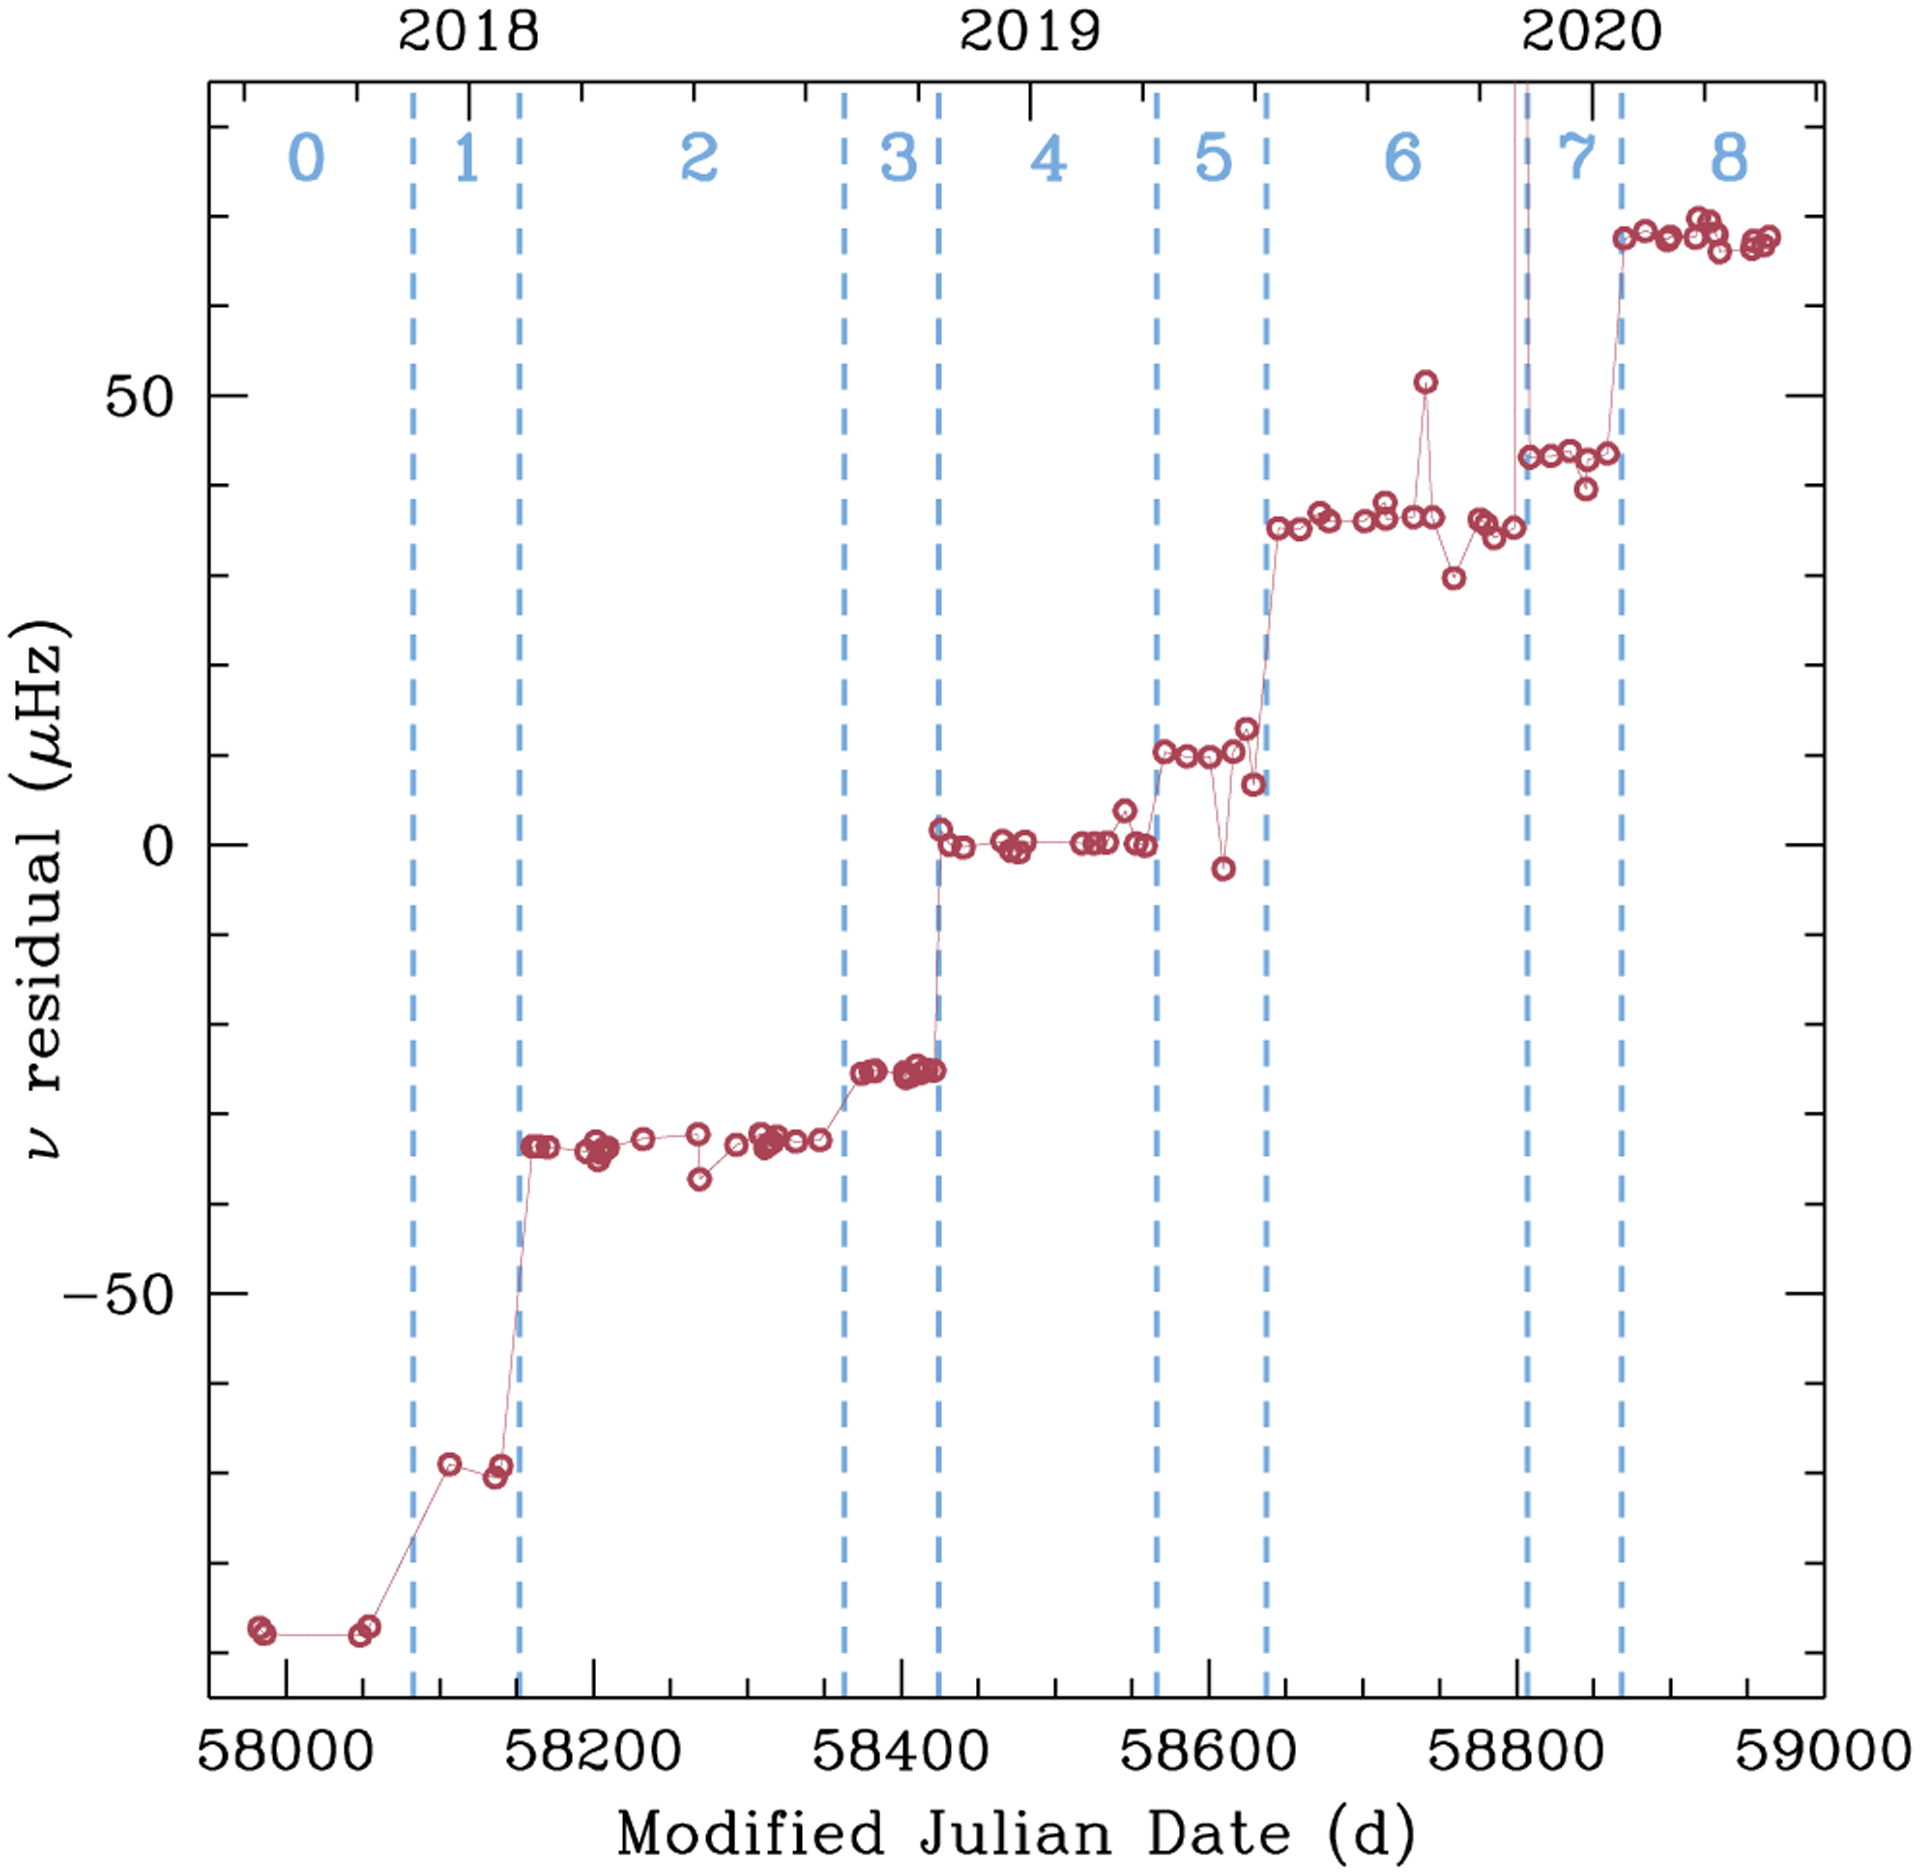
Difference between the measured candidate spin frequency of PSR J0537–6910 and linear model for frequency evolution, v4 + v̇4(t − t4), where v4 and v̇4 are values from segment 4 at t4 = MJD 58493 (see Table 1). Segments are labeled by numbers and separated by the occurrence of a glitch, each of which is denoted by a vertical dashed line.
Figure 2.
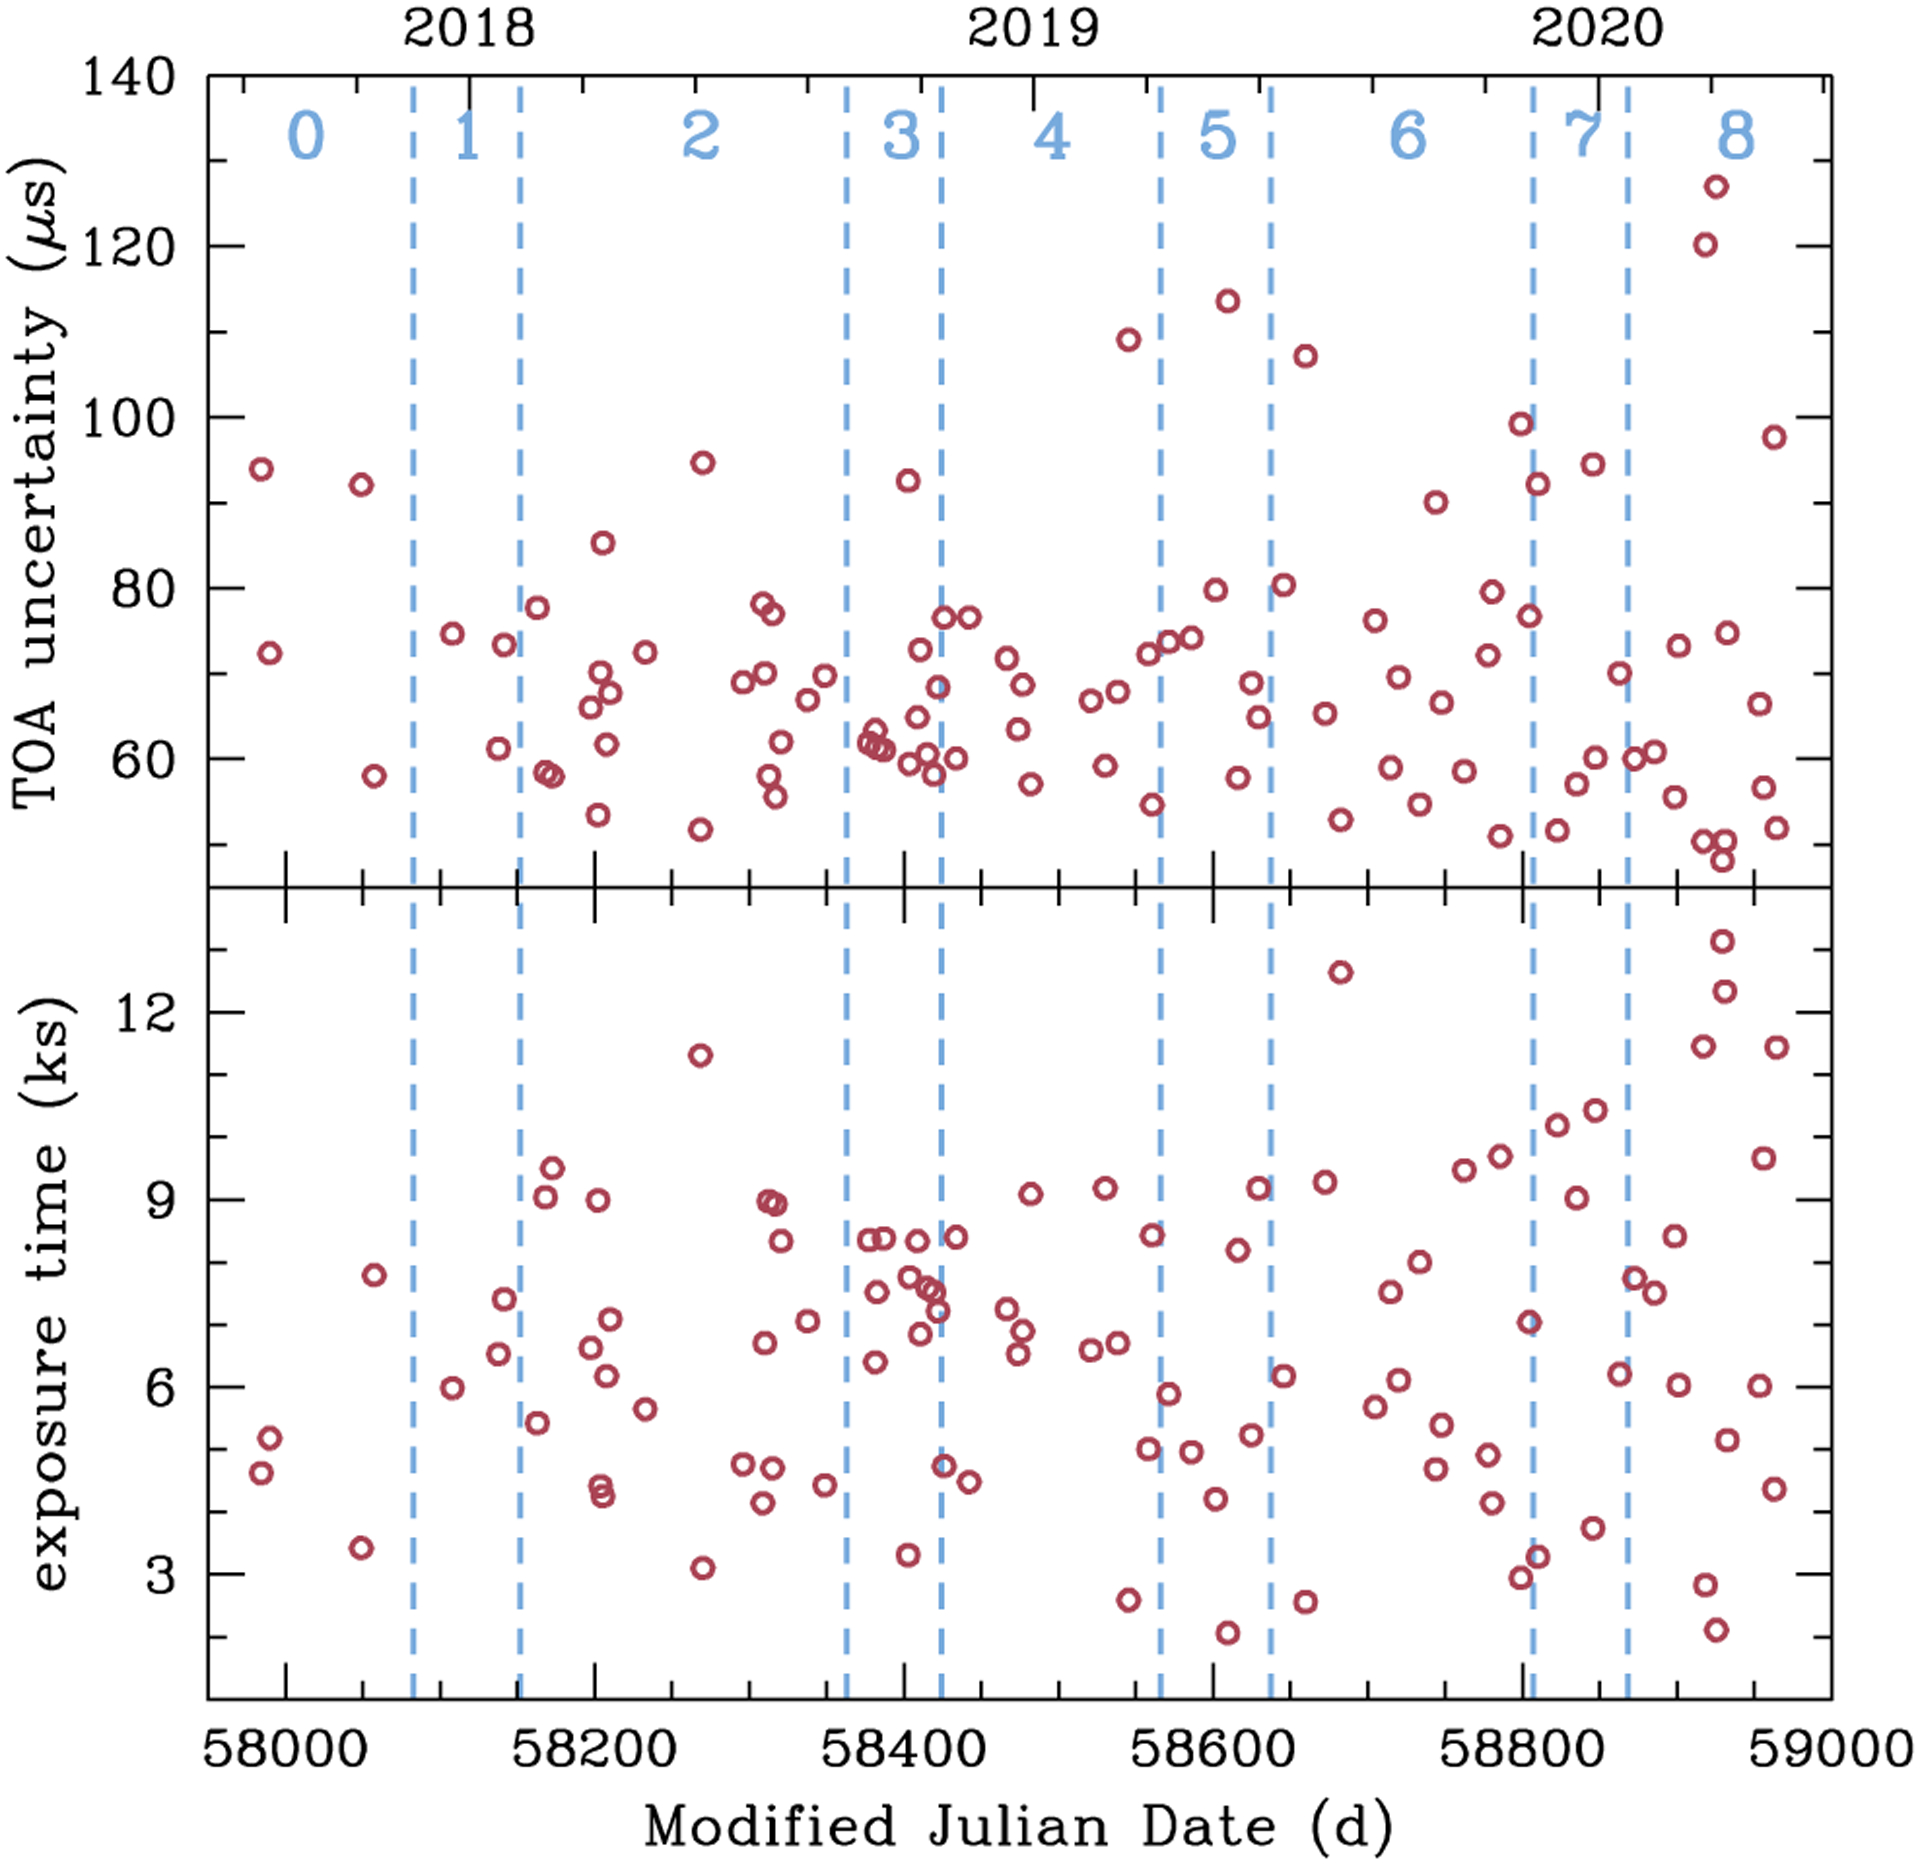
Uncertainty in measured time-of-arrival (top) and total exposure time (bottom) for each merged observation. Segments are labeled by numbers and separated by the occurrence of a glitch, each of which is denoted by a vertical dashed line.
3. SPIN EVOLUTION
3.1. Timing model
We use TEMPO2 (Hobbs et al. 2006) to fit TOAs in each segment between glitches with a timing model that includes a fiducial phase and the pulsar spin frequency v and its first and second time derivatives, v̇ and v̈, as free parameters. However, for segments 0, 1, and 5, we fix v̈ at 10−20 Hz s−2 [i.e., mean value during segments between glitches in the RXTE era (Antonopoulou et al. 2018) and is generally consistent with our NICER measurements] because there are insufficient numbers of TOAs to fully constrain the model. Furthermore, for segment 1 when we only have 3 TOAs, v and v̇ are determined by searching within a range of values and selecting those that yield the lowest root-mean-square (RMS) residuals. Specifically, the search is performed centred at the first candidate v measurement in the segment (see Figure 1) and at the v̇ expected from the general long-term trend (see Figure 4), with search radii of 2 μHz and 1 × 10⁻¹³ Hz s−1. Quoted uncertainties correspond to half the range of values covered by all solutions that yield a RMS lower than 75 μs, which is the largest measured TOA uncertainty in segment 1. The results of these timing model fits are given in Table 1, with quoted uncertainties being the formal 1σ errors from the fits. Figures 3 and 4 show the spin frequency v and its time derivative v̇ for each segment, as well as interglitch values measured using RXTE.
Figure 4.
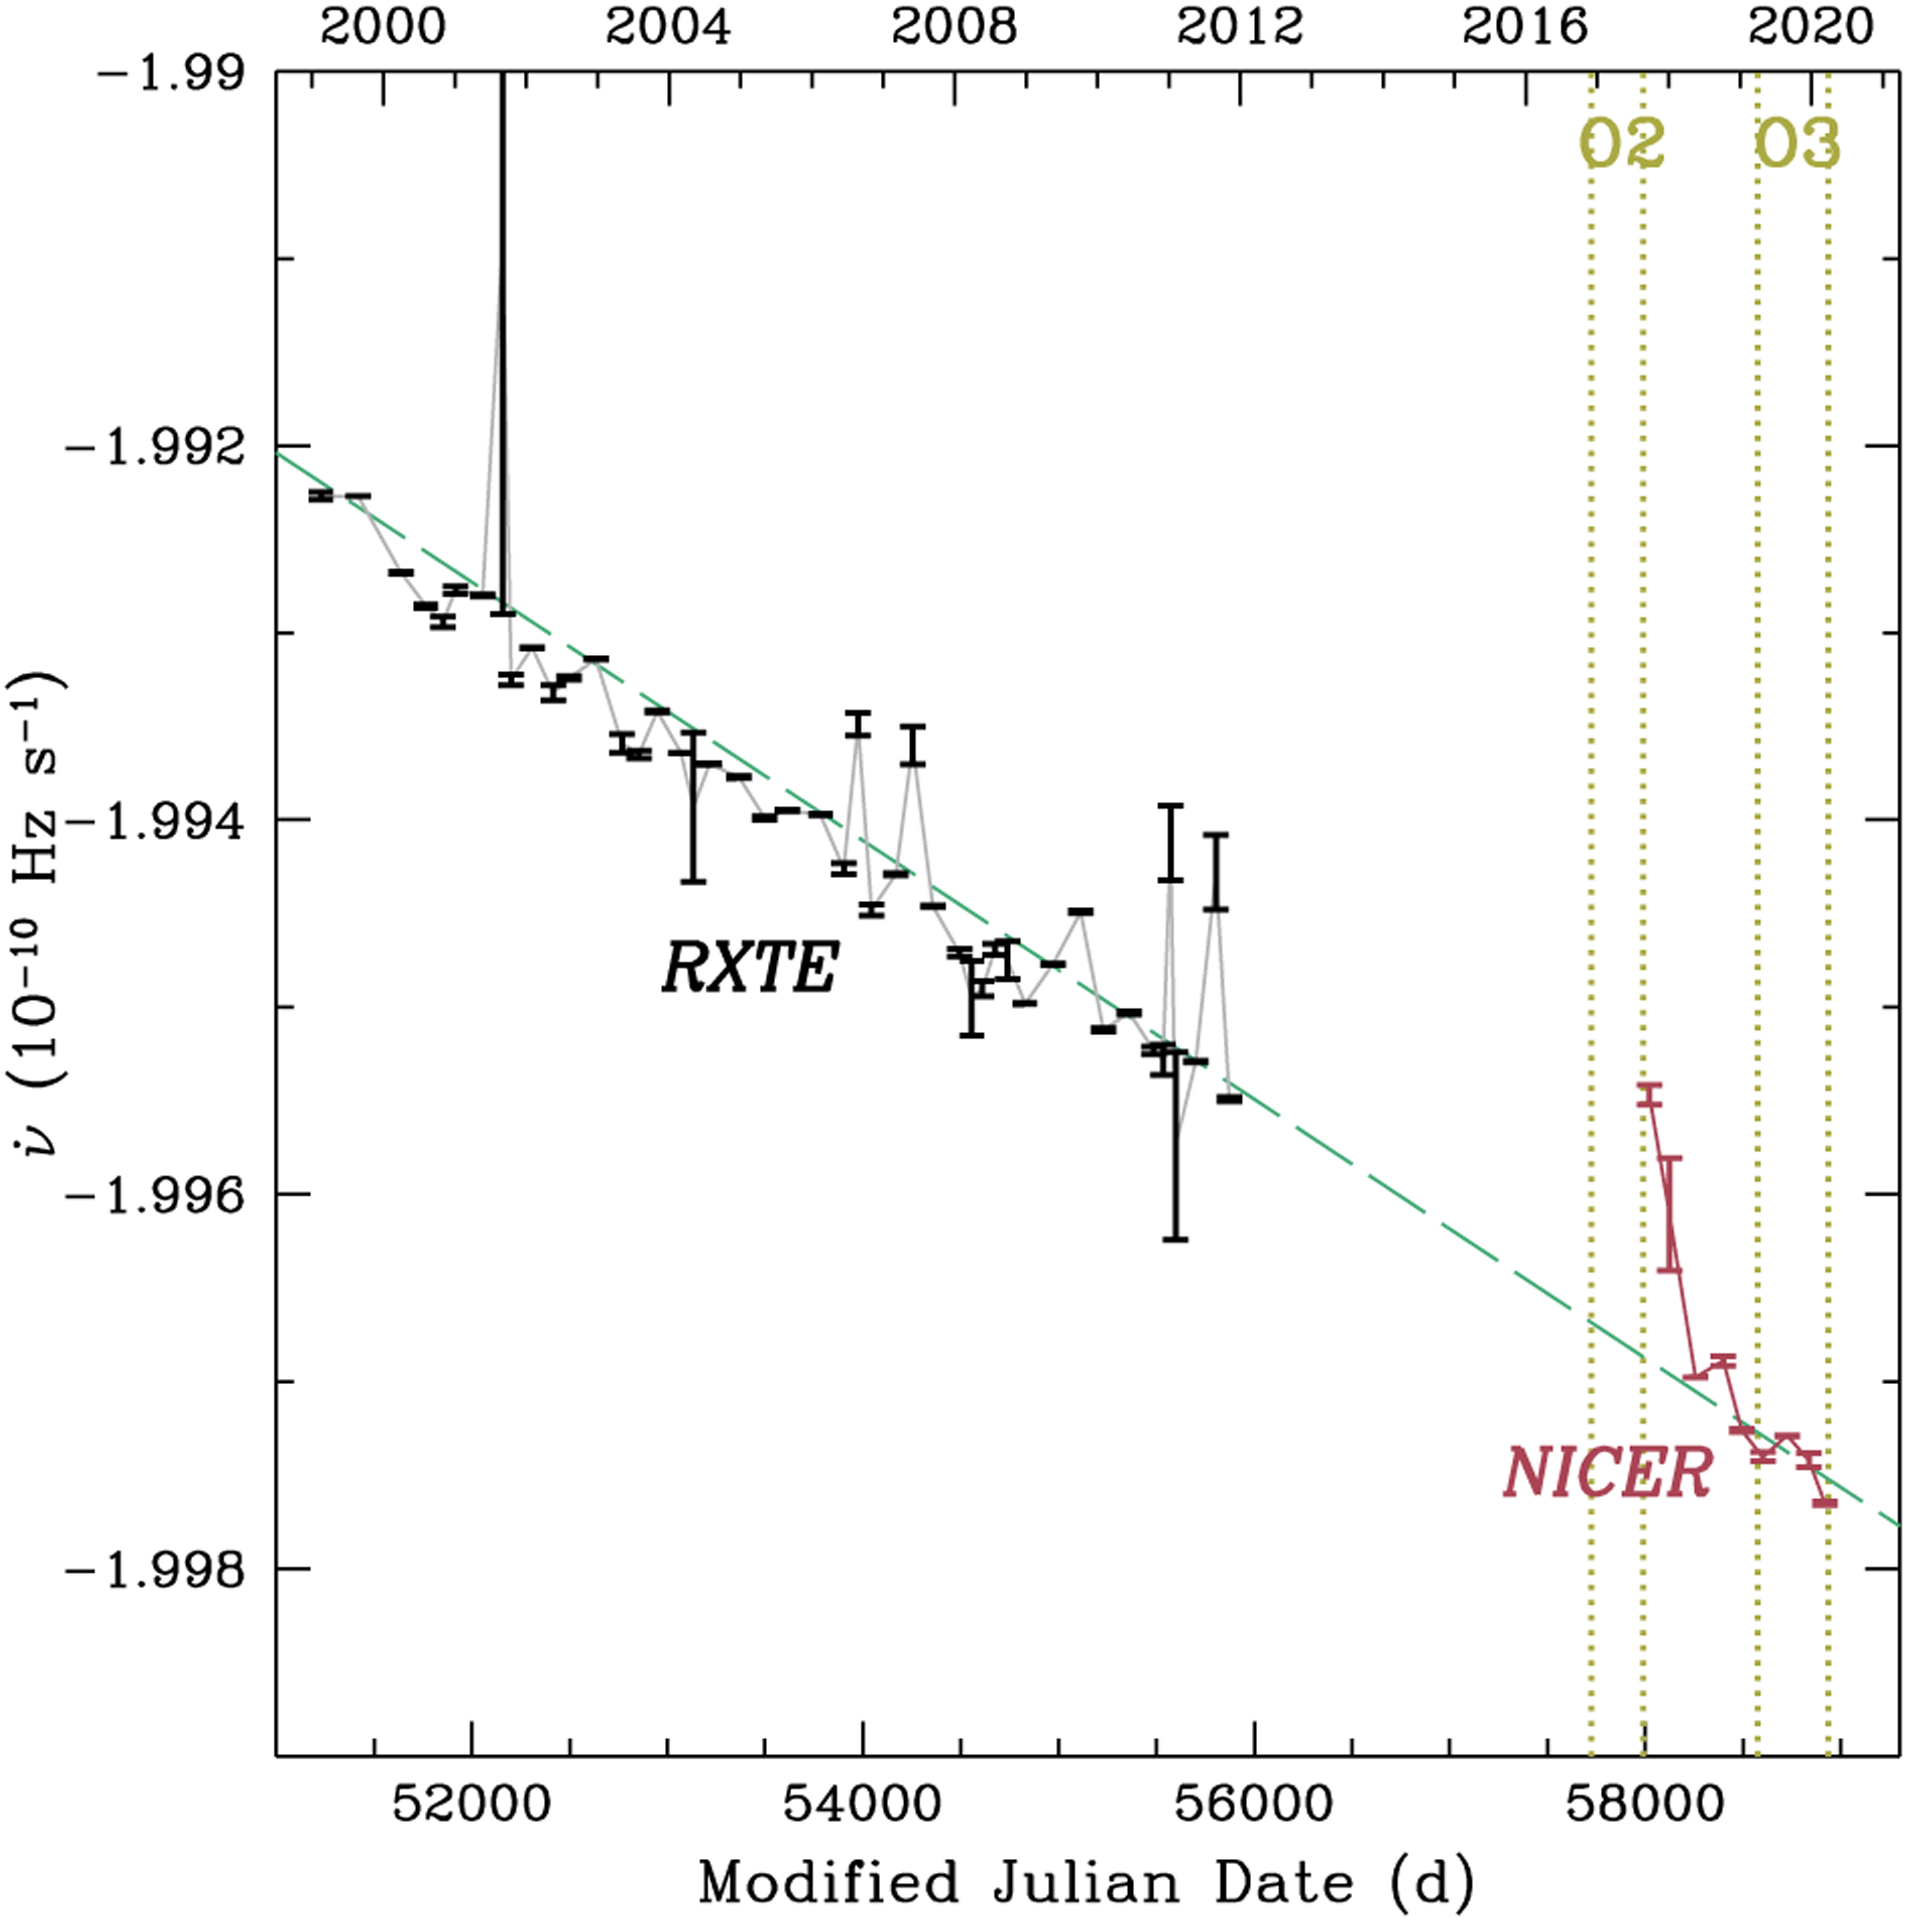
Evolution of the spin frequency time derivative v̇ of PSR J0537–6910. NICER values are measured by fitting a timing model to TOAs in each segment (see Table 1). RXTE values are from Table 1 of Antonopoulou et al. (2018). Errors are 1σ uncertainty. Dashed line shows a linear fit of NICER and RXTE data with best-fit v̈ = −8.00 × 10⁻²² Hz s−2. Vertical dotted lines denote the start (MJD 57722, 2016 November 30) and end (MJD 57990, 2017 August 25) of the second observing run (O2) and start (MJD 58574, 2019 April 1) and end (MJD 58935, 2020 March 27) of the third observing run (O3) of LIGO/Virgo.
Table 1.
PSR J0537–6910 timing model parameters for segments between glitch epochs. Number in parentheses is 1σ uncertainty in last digit.
| Segment | Epoch (MJD) | Start (MJD) | End (MJD) | TOAs | v (Hz) | v̇ (10−10 Hz s−1) | v̈ (10−20 Hz s−2) | nig | Residual RMS (μs) | χ2/dof |
|---|---|---|---|---|---|---|---|---|---|---|
| 0 | 58020 | 57984.5 | 58057.5 | 4 | 61.924374260(2) | −1.99547(5) | [1]a | — | 66.14 | 3.1 |
| 1 | 58124 | 58108.1 | 58141.6 | 3 | 61.922597203(3) | −1.9961(3) | [1]a | — | 1.158 | —b |
| 2 | 58255 | 58163.0 | 58348.8 | 21 | 61.9203729962(9) | −1.996977(2) | 0.56(1) | 8.7(2) | 123.5 | 4.4 |
| 3 | 58399 | 58377.5 | 58422.2 | 11 | 61.917896251(3) | −1.99689(2) | 5.9(6) | 90(10) | 56.39 | 1.2 |
| 4 | 58493 | 58426.1 | 58560.6 | 13 | 61.916299559(4) | −1.997261(8) | 0.81(8) | 13(1) | 250.8 | 20 |
| 5 | 58600 | 58571.3 | 58629.3 | 7 | 61.914462421(2) | −1.99740(3) | [1]a | — | 98.49 | 3.3 |
| 6 | 58723 | 58645.5 | 58804.5 | 16 | 61.912366620(2) | −1.997289(4) | 0.88(3) | 13.7(4) | 142.7 | 5.9 |
| 7 | 58836 | 58810.0 | 58862.9 | 6 | 61.910424210(6) | −1.99742(4) | 5.8(9) | 90(10) | 81.92 | 4.7 |
| 8 | 58918 | 58872.5 | 58964.4 | 14 | 61.909033102(3) | −1.99765(1) | 1.4(1) | 22(2) | 138.4 | 6.9 |
v̈ is fixed at 10−20 Hz s−2 (see text).
No fit performed (see text).
Figure 3.
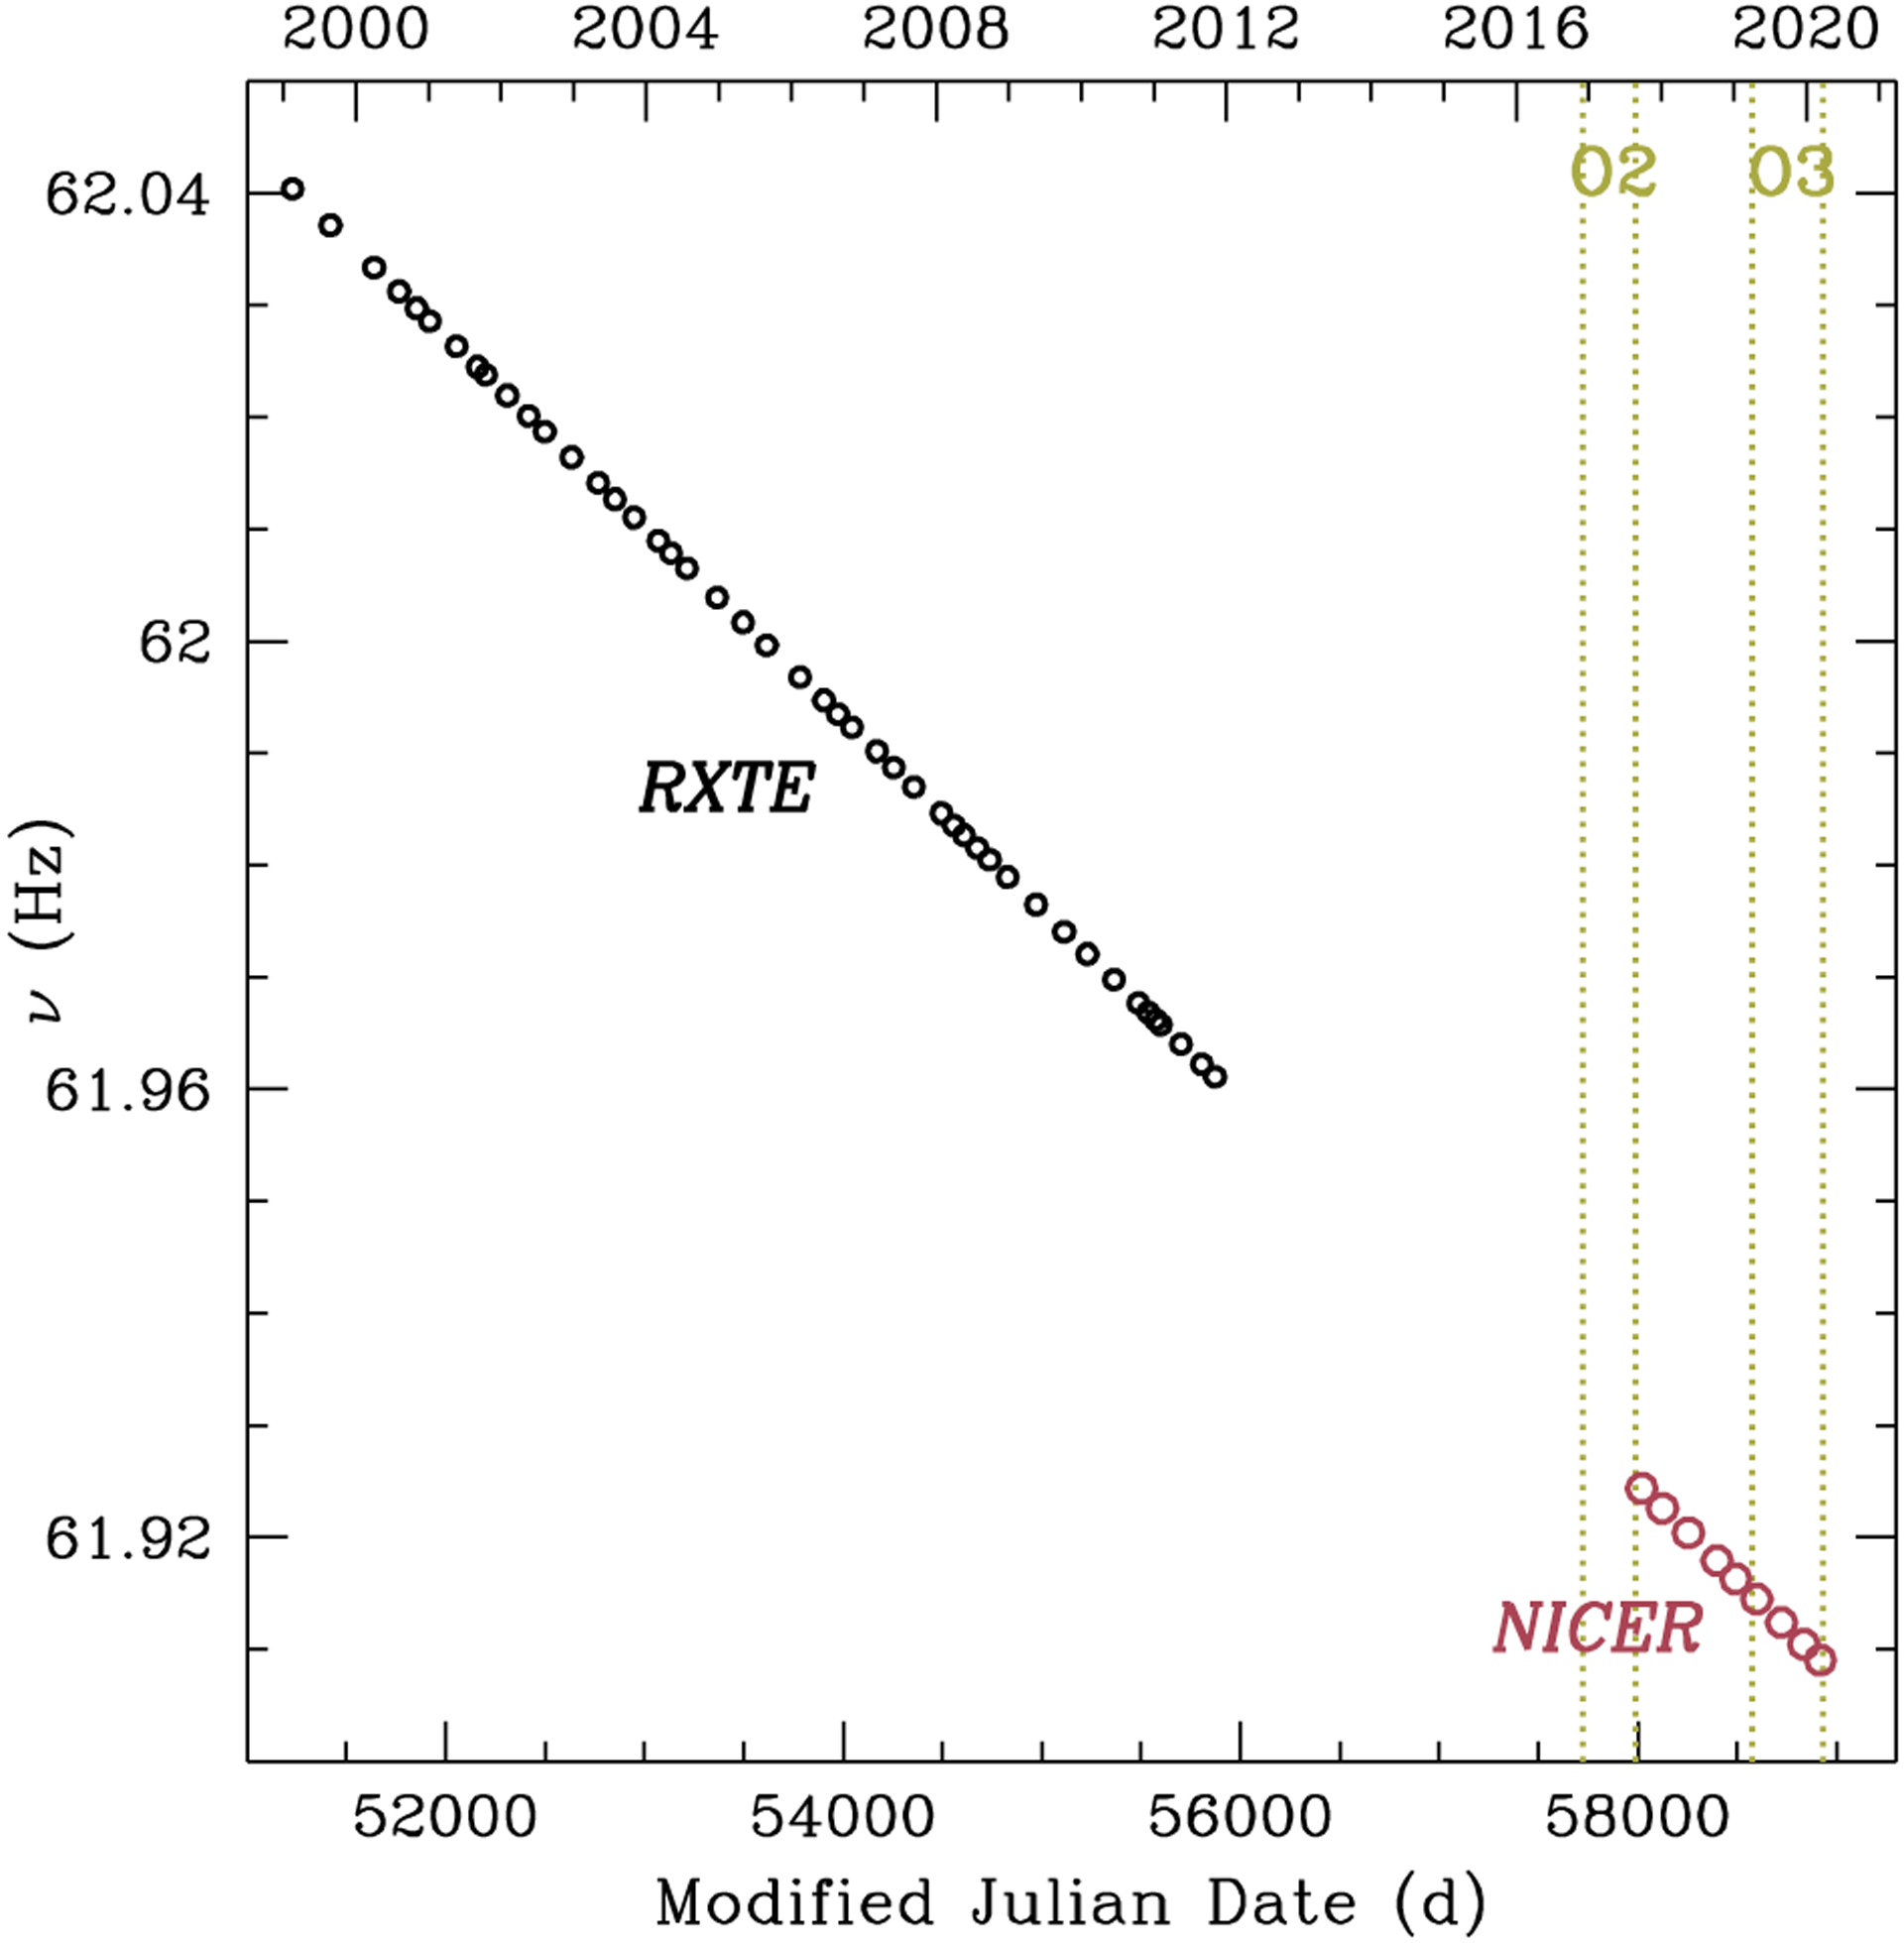
Evolution of the spin frequency v of PSR J0537–6910. Large circles are NICER values measured by fitting a timing model to TOAs in each segment (see Table 1). Small circles denote RXTE values from Table 1 of Antonopoulou et al. (2018). Vertical dotted lines denote the start (MJD 57722, 2016 November 30) and end (MJD 57990, 2017 August 25) of the second observing run (O2) and start (MJD 58574, 2019 April 1) and end (MJD 58935, 2020 March 27) of the third observing run (O3) of LIGO/Virgo.
The timing solutions determined above provide an initial estimate of glitch sizes. Each glitch is measured more precisely by fitting a timing model (see, e.g., Edwards et al. 2006) that includes glitch parameters Δϕ, Δv, Δv̇, and Δv̈ to the set of TOAs that immediately precedes the glitch and the set of TOAs that immediately follows the glitch (e.g., TOAs from segments 0 and 1 are fit to obtain parameters of glitch 1); like glitches detected using RXTE (Antonopoulou et al. 2018), an exponential recovery-term is not needed to describe our measured glitches (see also Section 4.1). However, for glitch 1, Δv̇ is not varied during the fitting but is calculated by comparing v̇ from segments 0 and 1 at the glitch epoch; its uncertainty is the uncertainty of v̇ in segment 1. Because v̇ cannot be varied for segment 1, the uncertainty of Δv̇ for glitch 2 is set to the uncertainty of v̇ for segment 1. For glitches 1 and 5, Δv̈ is set to zero during the fitting because v̈ is not determined in segments 1 and 5 (see above); for the same reason, Δv̈ for glitch 2 (and 6) is simply the change from the fixed v̈ = 10−20 Hz s−2 in segment 1 (and 5) to the measured v̈ in segment 2 (and 6). Glitch epochs are set at the centre of the interval between the last TOA before the glitch and the first TOA after the glitch, and the uncertainty is set at half this interval. The results of these timing model fits are given in Table 2.
Table 2.
PSR J0537–6910 glitch parameters. Number in parentheses is 1σ uncertainty in last digit.
| Glitch | Glitch epoch (MJD) | Δϕ (cycle) | Δv (μHz) | Δv̇ (10−13 Hz s−1) | Δv̈ (10−20 Hz s−2) |
|---|---|---|---|---|---|
| 1 | 58083(25) | −0.016(8) | 16.132(2) | −1.5(3) | — |
| 2 | 58152(11) | 0.47(1) | 36.035(6) | −1.6(3) | −0.44(1)a |
| 3 | 58363(14) | 0.17(5) | 7.83(5) | −2.3(4) | 5(1) |
| 4 | 58424(2) | −0.35(23) | 25.3(3) | −2(1) | −5(2) |
| 5 | 58566(5) | −0.32(2) | 9.21(2) | −0.89(5) | — |
| 6 | 58637(8) | 0.03(2) | 26.99(1) | −0.86(4) | −0.12(3)a |
| 7 | 58807(3) | 0.31(2) | 7.57(3) | −2.2(3) | 5(1) |
| 8 | 58868(5) | 0.06(6) | 24.04(8) | −2.4(5) | −4(1) |
In the preceding segment, v̈ is fixed at 10−20 Hz s−2 due to a low number of TOAs (see Table 1). Δv̈ is the difference between this fixed value and v̈ in the next segment.
The glitch parameters determined above are used together to create a single timing solution for all measured TOAs. The reference time is set at the centre of segment 0, and the reference v, v̇ and v̈ are set at corresponding values for segment 0. The resulting best-fit timing model has a RMS fit residual of 141 μs, i.e., < 0.9 percent of the rotation cycle of PSR J0537–6910. The glitch parameters obtained by this subsequent fit agree within errors to those measured by individual fits above (see Table 2). Figure 5 shows the residual of each TOA after removing the final best-fit timing model.
Figure 5.
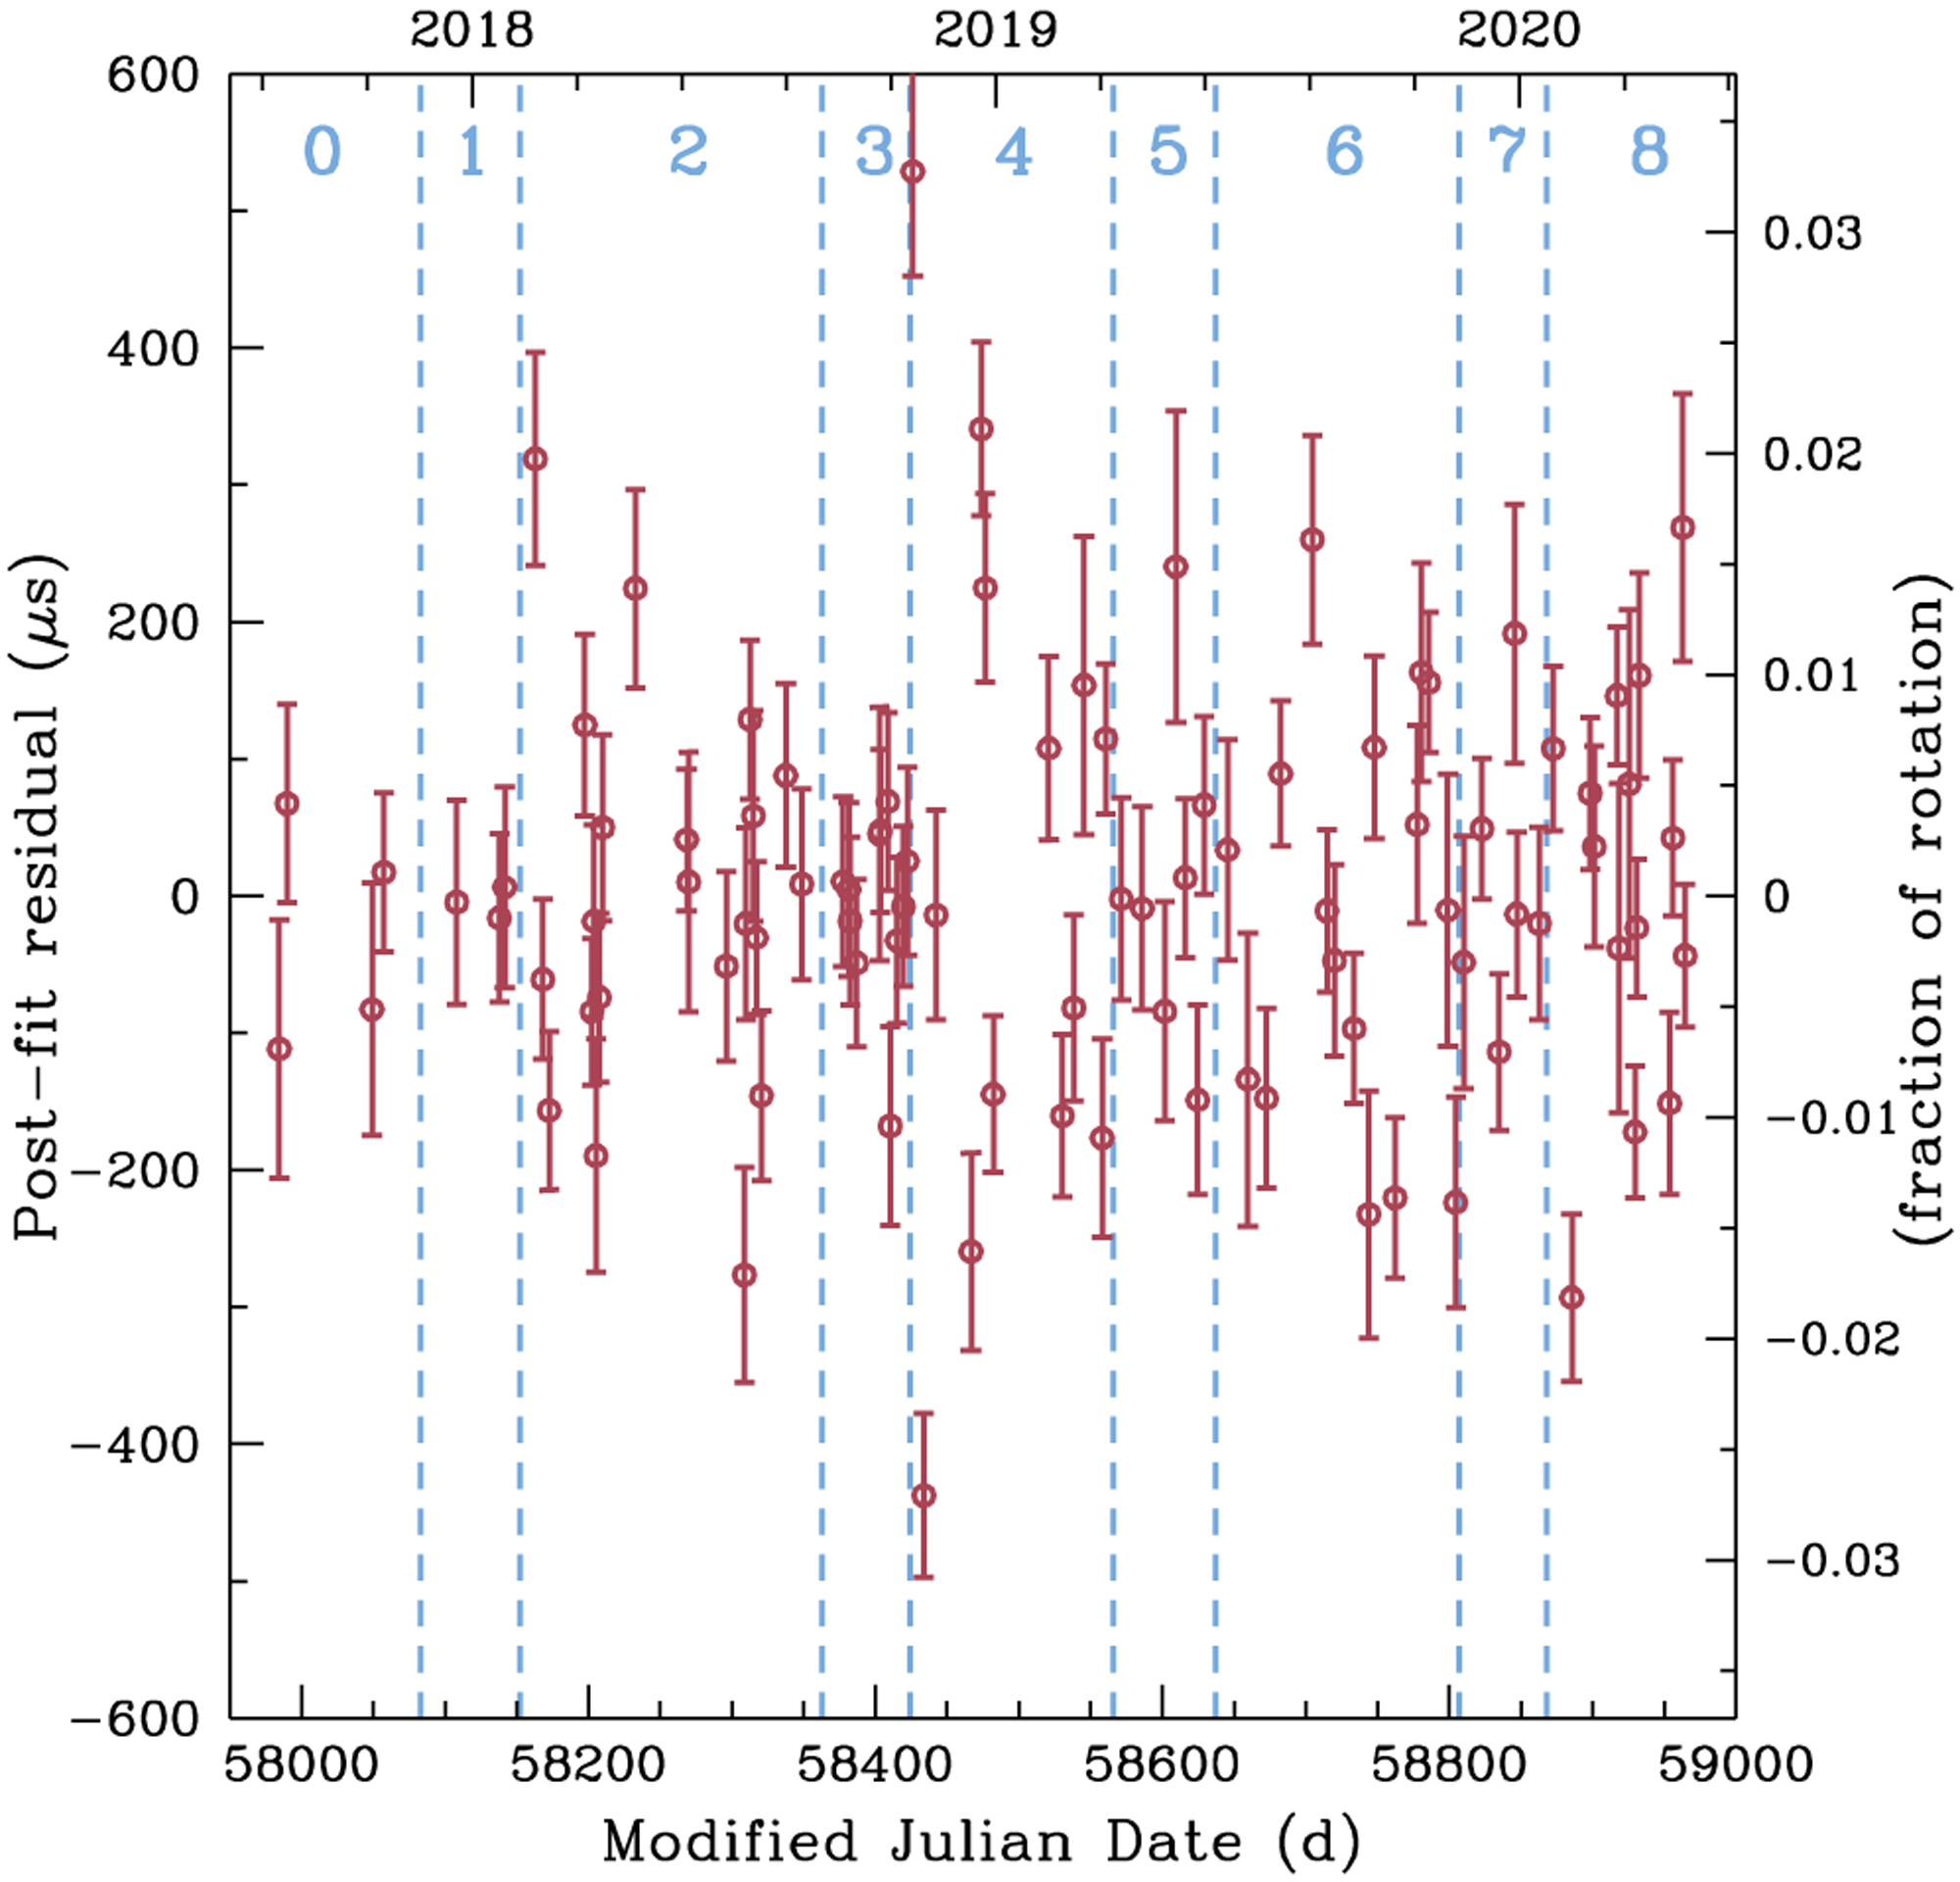
Timing residual for each merged observation after accounting for the best-fit timing model, with left axis in μs and right axis in fraction of rotation cycle. Errors are 1σ uncertainty. Segments are labeled by numbers and separated by the occurrence of a glitch, each of which is denoted by a vertical dashed line.
3.2. Long and short-term braking indices
The spin-down behavior of a pulsar can be described by the braking index, which is defined as n ≡ vv̈/v̇2 and follows from characterizing the spin-down rate as a power law v̇ ∝ −vn. In the case of PSR J0537–6910, its spin-down rate is measured to be increasing (v̇ becoming more negative) over time, with Antonopoulou et al. (2018) finding v̈ = (−7.7 ± 0.3) × 10−22 Hz s−2 and n = −1.22 ± 0.04 and Ferdman et al. (2018) finding v̈ = (−8.2 ± 0.3) × 10−22 Hz s−2 and n = −1.28 ± 0.04.
We perform a simple linear fit of v̇ over time, which yields n = −1.32 ± 0.02 for only RXTE data (taken from Table 1 of Antonopoulou et al. 2018) and n = −1.4 ± 0.2 for only NICER data (see Table 1); 1σ errors are obtained by increasing all individual v̇ errors by a single factor such that the fit produces a χ2/dof = 1. A fit of all v̇ values gives v̈ = (−8.00 ± 0.08) × 10−22 Hz s−2, which is shown in Figure 4, and long-term braking index n = −1.25 ± 0.01.
The long-term spin-down behavior of PSR J0537–6910 is in sharp contrast to the behavior over short interglitch intervals. Between individual glitches, the interglitch braking index nig is generally non-negative and much greater than the canonical value of 3 for spin-down by electromagnetic dipole radiation (see Table 1 and Antonopoulou et al. 2018; see also Middleditch et al. 2006). Furthermore, Andersson et al. (2018) show that, when measuring braking indices as a function of time since the preceding glitch, nig tends to decrease toward an asymptotic value. Figure 6 shows NICER values alongside RXTE values. It is likely that large braking indices determined at short times after a glitch reflect the impact of the glitch on the spin-down behavior of the pulsar. This is borne out in modeling of post-glitch relaxation, with an exponential timescale of 17–34 d and an asymptotic nig ≈ 7 (Andersson et al. 2018; Antonopoulou et al. 2018; Ferdman et al. 2018). Observationally, a more reliable measure of spin-down behavior with less glitch contamination can be obtained by determining braking indices at long times after a large glitch. While our current NICER dataset contributes only seven new interglitch braking indices, we see that NICER values of nig follow the same trend as those from RXTE and are highlighted by interglitch segment 2 which follows 103 ± 11 d after the second largest glitch observed in PSR J0537–6910 (glitch 2; see Table 2). We perform a simple fit with the form , where n0 and τig are fit parameters and is the asymptotic value of the braking index which we take to be either 3, 5, or 7; fits yield decay timescales of 19–44 d, with a longer timescale for a lower braking index (see Figure 6). While assuming an asymptotic leads to a better fit than assuming , the frequent occurrence of glitches may be preventing measurements of nig < 7. We discuss implications of braking indices of 5 and 7 in Section 5.2.
Figure 6.
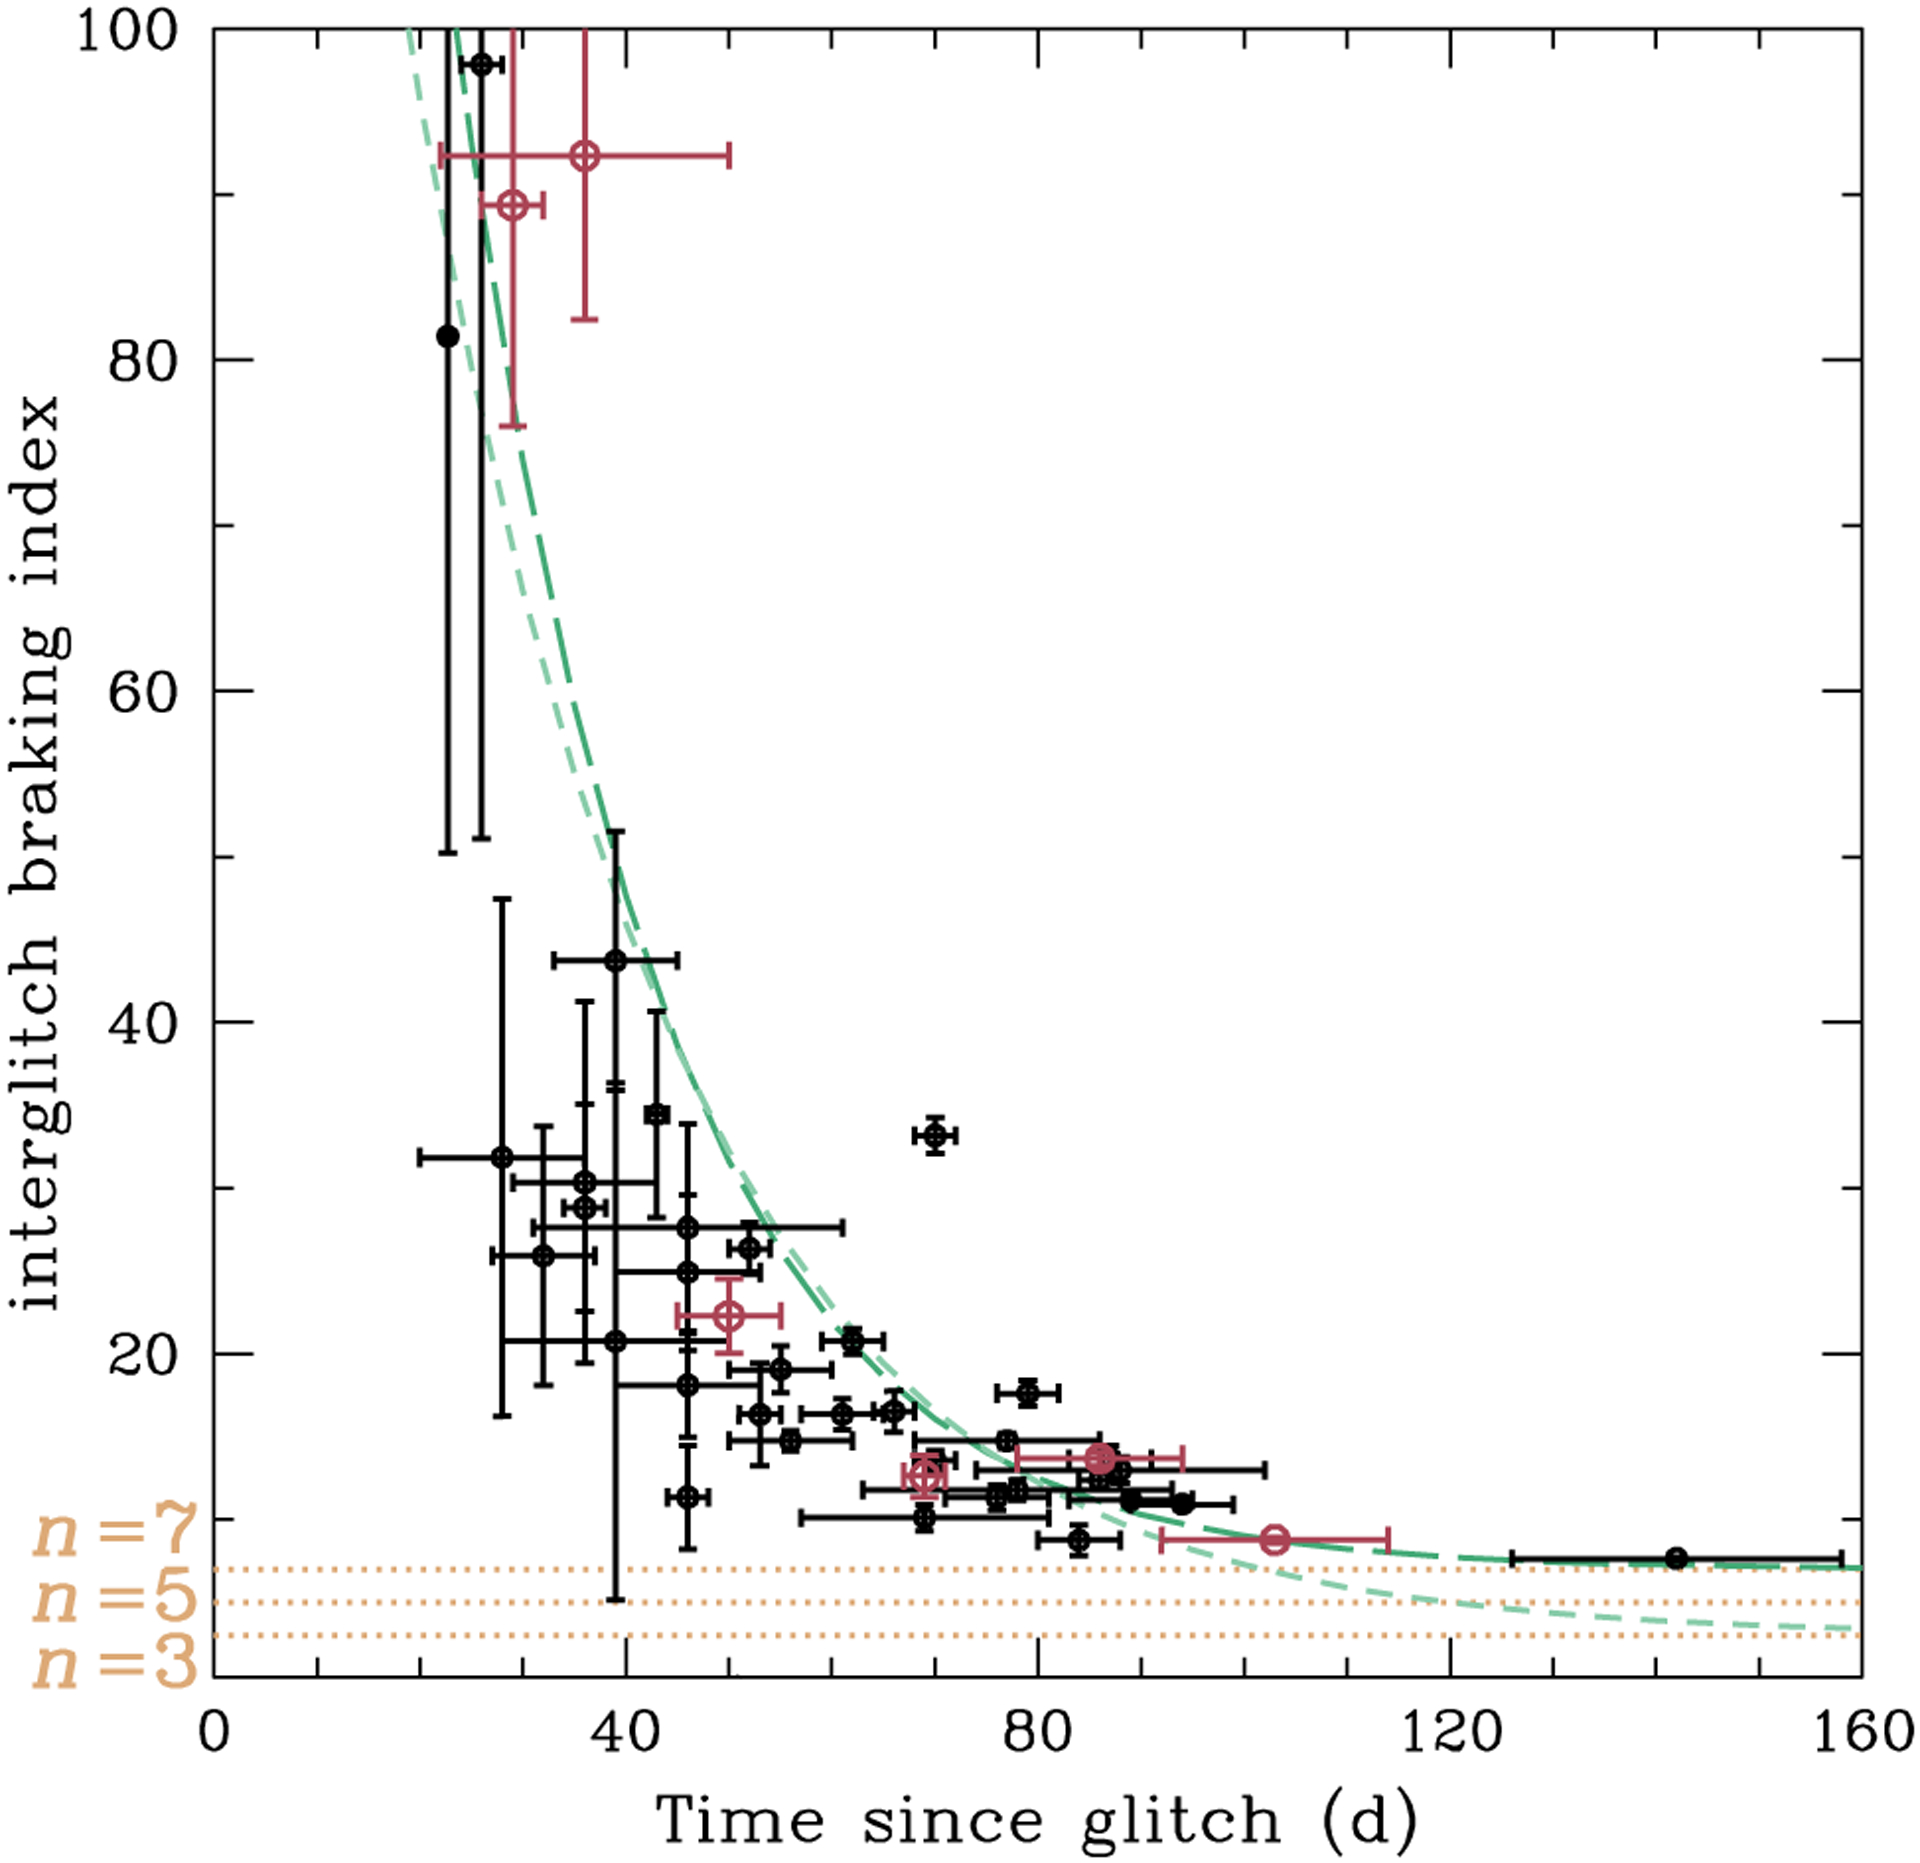
Braking index nig calculated from spin parameters of each segment between glitches as a function of time since last glitch. Large and small circles denote NICER and RXTE values, respectively, with the latter taken from Tables 1 and 2 of Antonopoulou et al. (2018). Errors in nig are 1σ uncertainty. Horizontal dotted lines indicate braking index n = 3, 5, 7, which are expected for pulsar spin-down due to electromagnetic dipole radiation, gravitational-wave emitting ellipticity, and gravitational-wave emitting r-mode oscillation, respectively (see Section 5.2). Short and long-dashed lines indicate exponential decay to n = 3 with best-fit timescale of 26 d and to n = 7 with best-fit timescale of 20 d, respectively.
4. GLITCHES
4.1. Glitch properties
The detection of these 8 glitches, with parameters given in Table 2, in 2.7 yr of observation yields a glitch rate of 3.0 yr−1. Thus PSR J0537–6910 continues to glitch at the same rate as during the RXTE era, when either 42 glitches (Ferdman et al. 2018) or 45 glitches (Antonopoulou et al. 2018) are found in 12.95 yr of RXTE data at a rate of either 3.24 yr−1 or 3.47 yr−1, respectively.
Glitching activity of a pulsar can also be characterized by the parameter Ag ≡ ∑i (Δv/v)i/tobs, where the summation is over each glitch i and tobs is time over which the pulsar is monitored (McKenna & Lyne 1990). For glitches detected using RXTE and tobs = 12.95 yr, the results of Antonopoulou et al. (2018) yield ∑i Δvi = (709.5 ± 0.8) μHz and Ag = (8.84 ± 0.01) × 10−7 yr−1, while the results of Ferdman et al. (2018) yield ∑i Δvi = (707.4 ± 0.8) μHz and Ag = (8.81 ± 0.01) × 10−7 yr−1. For glitches detected using NICER and tobs = 2.7 yr, values from Table 2 give ∑i Δvi = (153.1 ± 0.3) μHz and Ag = (9.22 ± 0.02) × 10−7 yr−1. Figure 7 plots the cumulative fractional glitch magnitude Δv/v over the RXTE and NICER eras. Combining RXTE and NICER glitches produces an activity parameter Ag = (8.88 ± 0.01) × 10−7 yr−1. We note that Ferdman et al. (2018) find an indication that Ag decreases during the time RXTE is monitoring PSR J0537–6910. However, we find that Ag during the NICER era is similar to or even greater than Ag measured during the RXTE era.
Figure 7.
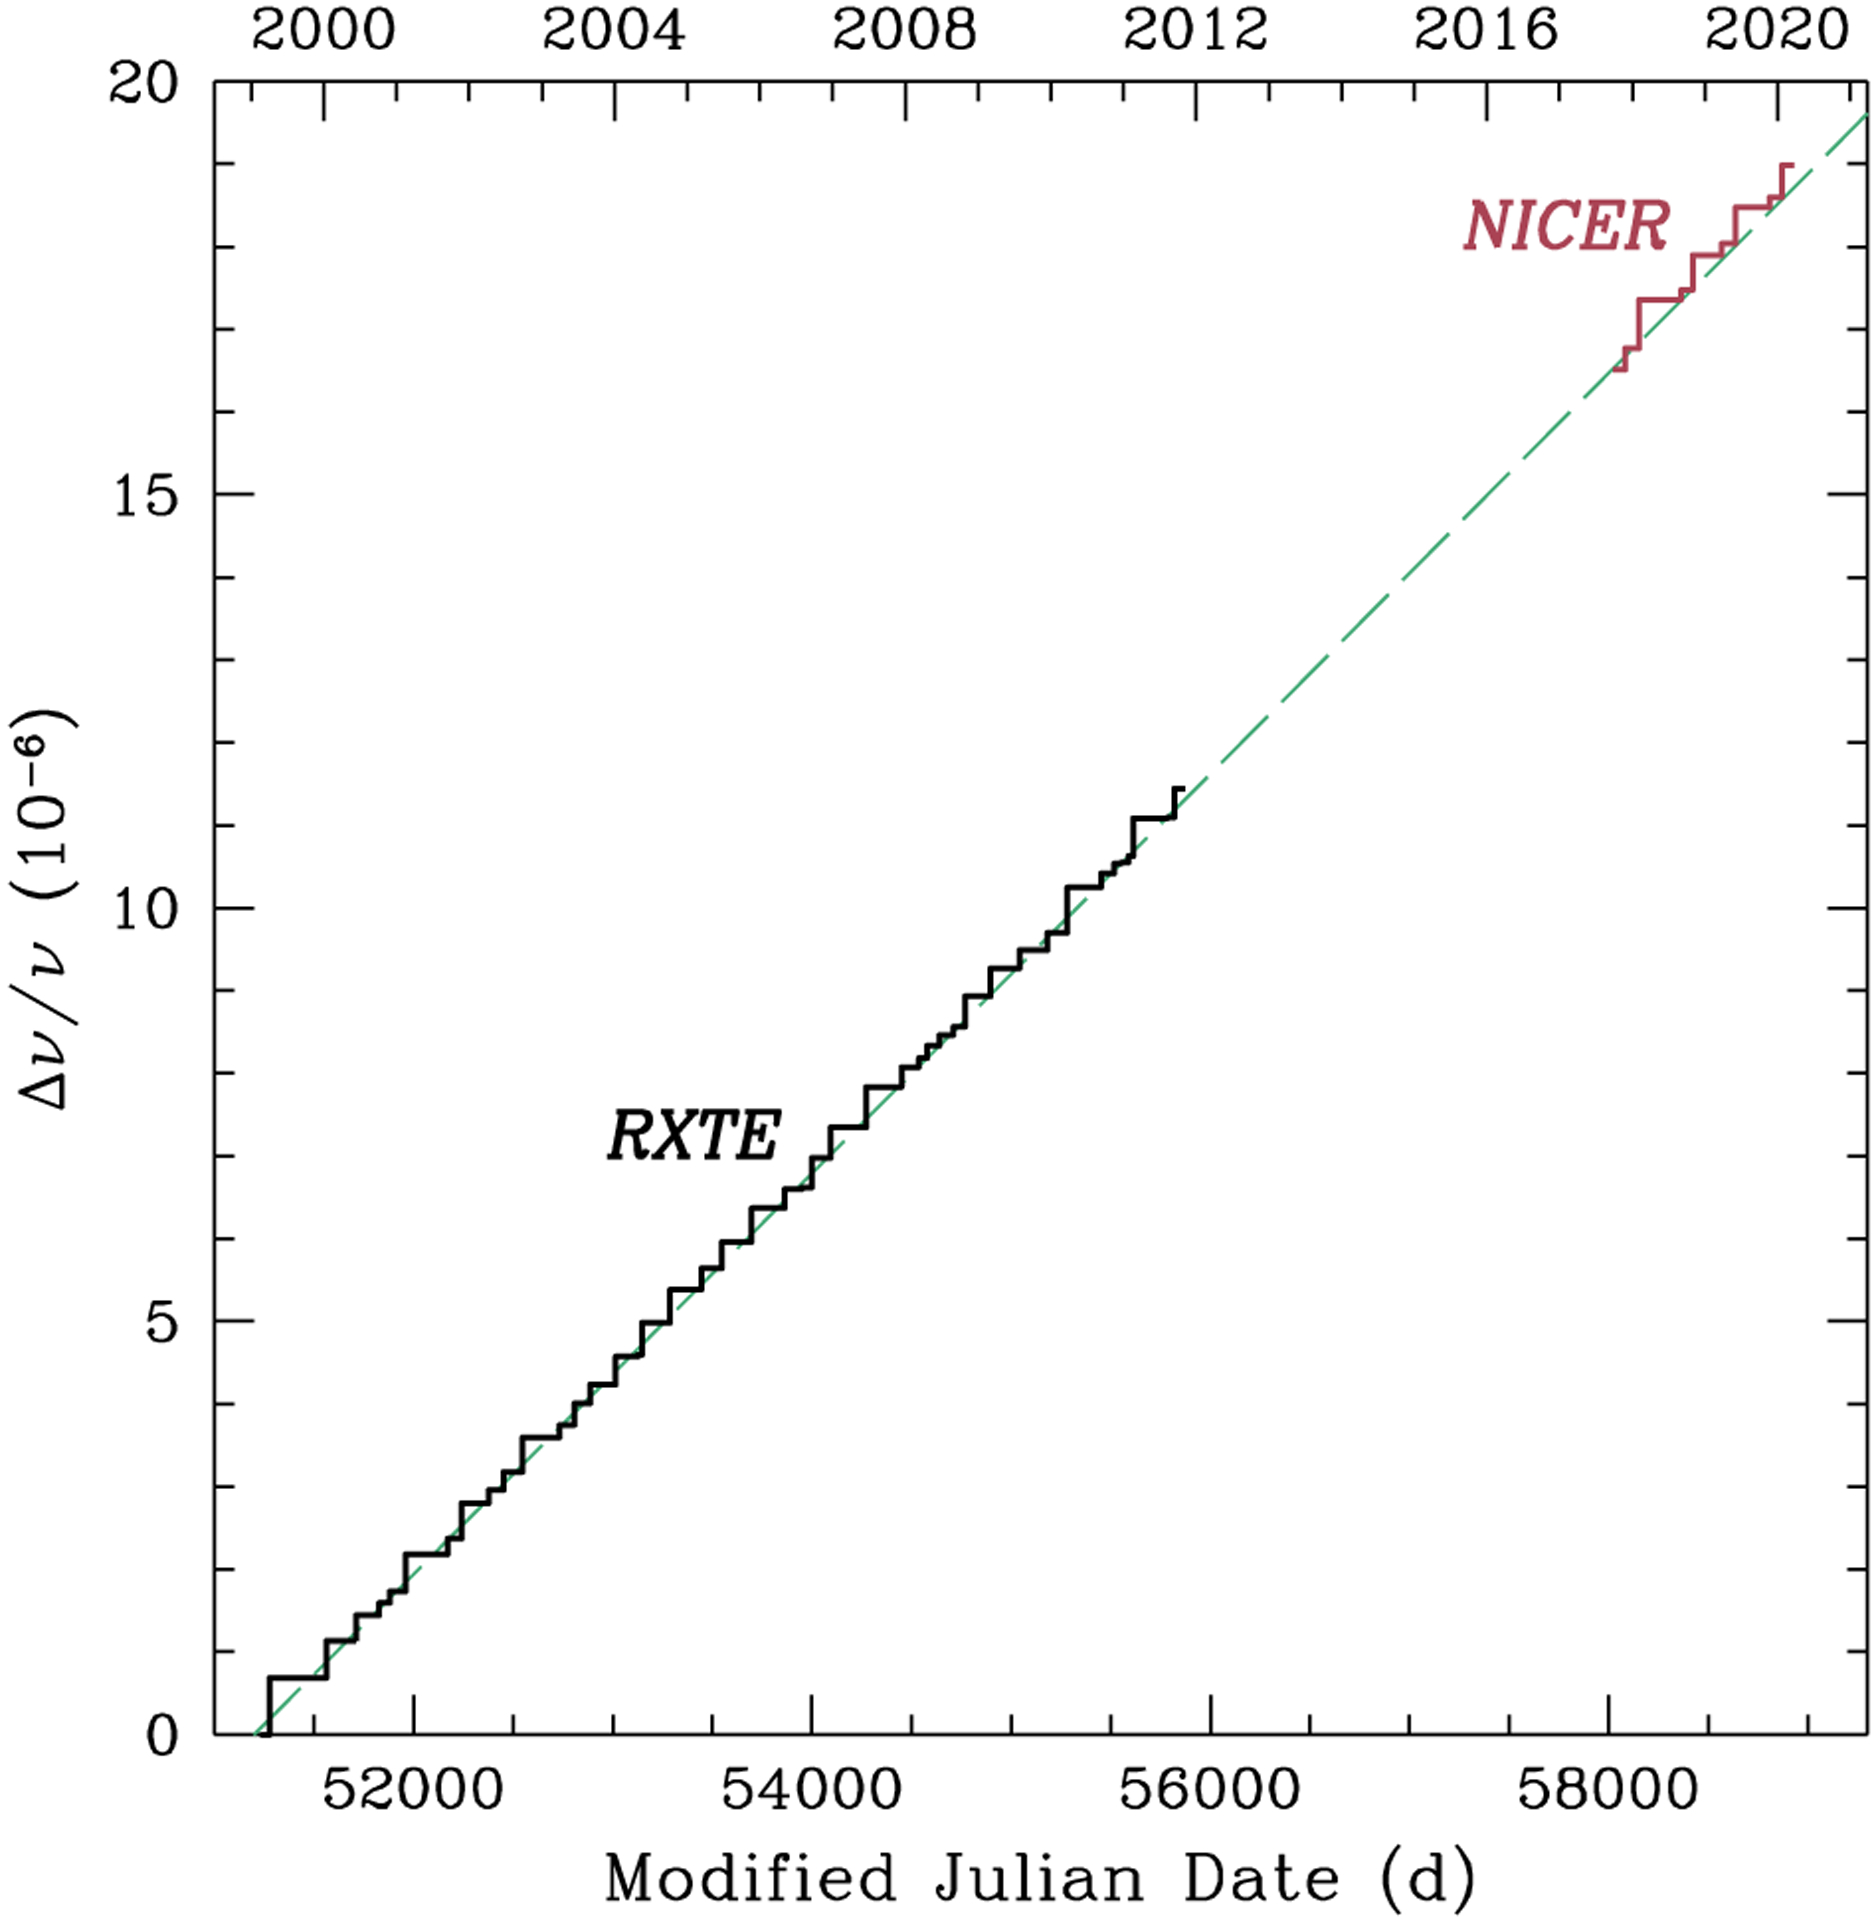
Fractional glitch magnitude Δv/v shown as a cumulative sum over each previous glitch. RXTE values are from Table 2 of Antonopoulou et al. (2018), Dashed line indicates a line with a slope of 8.84 × 10⁻⁷ yr−1, which is the glitch activity Ag ≡ ∑i (Δv/v)i/tobs from RXTE data, where tobs is time over which the pulsar is monitored; note that Ag = 8.88 × 10⁻⁷ yr−1 for the combination of RXTE and NICER glitches. NICER values are offset by Δv/v = 16.5 × 10⁻⁶, i.e., value of dashed line at the epoch of NICER segment 0 at MJD 58020.
Figure 8 shows measured Δv and |Δv̇|. Middleditch et al. (2006) argue that there exists a hard upper limit of |Δv̇| = 1.5 × 10⁻¹³ Hz s−1 based on the first 23 glitches detected using RXTE. However, analysis of the next 22 glitches reveal several exceeding this limit, with three even having |Δv̇| > 2 × 10⁻¹³ Hz s−1 (Antonopoulou et al. 2018); analysis by Ferdman et al. (2018) find somewhat lower |Δv̇| but still several exceeding the proposed limit. While Antonopoulou et al. (2018) indicate such large |Δv̇| should be rare (based on 3 out of 45), NICER data reveals 4 out of 8 glitches with |Δv̇| > 2 × 10⁻¹³ Hz s−1, although their uncertainties are large enough to reach below this limit.
Figure 8.
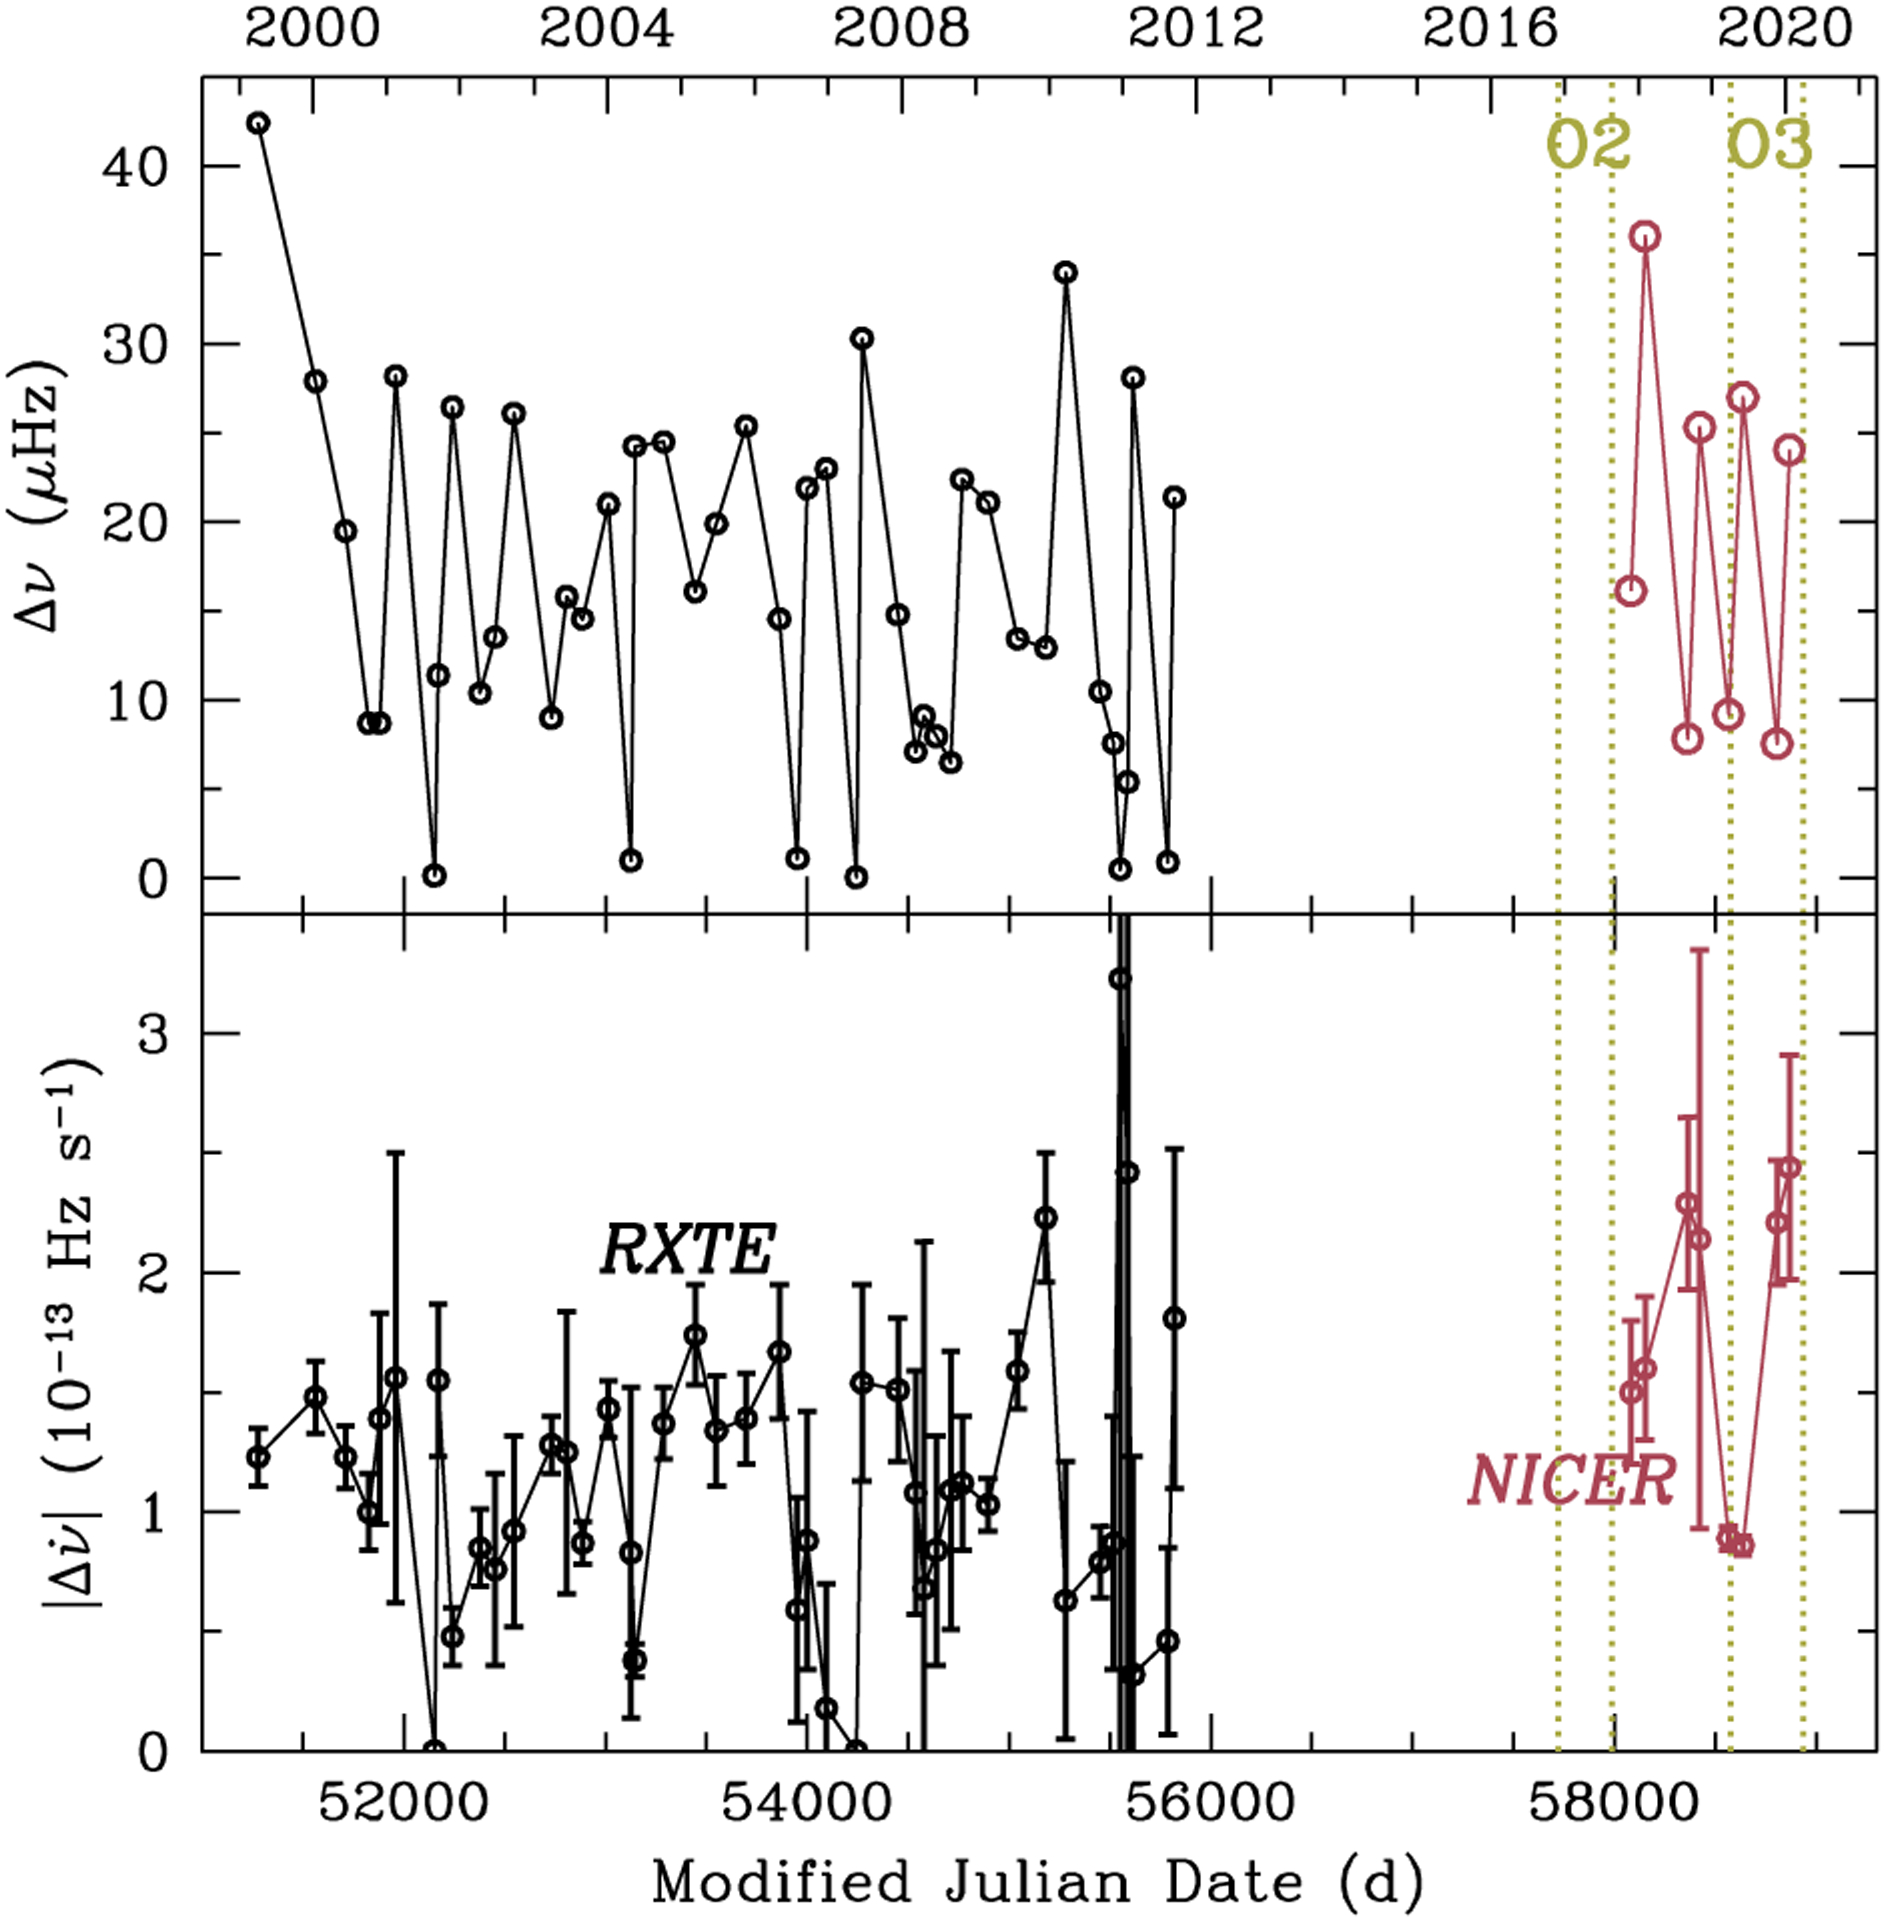
Glitch Δv (top) and Δv̇ (bottom) as functions of time. Large and small circles denote NICER and RXTE values, respectively, with the latter taken from Table 2 of Antonopoulou et al. (2018). Errors in bottom panel are 1σ uncertainty, while errors are not shown in top panel because they are smaller than the circles. Vertical dotted lines denote the start (MJD 57722, 2016 November 30) and end (MJD 57990, 2017 August 25) of the second observing run (O2) and start (MJD 58574, 2019 April 1) and end (MJD 58935, 2020 March 27) of the third observing run (O3) of LIGO/Virgo.
The 8 glitches detected using NICER show potentially correlated properties, in addition to the same glitch size-time to next glitch correlation observed in RXTE glitches (see Section 4.2). NICER glitches appear in pairs, with each pair consisting first of a smaller glitch (Δv ≈ 8 – 16 μHz) and then a larger glitch (Δv ≈ 24 – 36 μHz) but each glitch in a pair having similar Δv̇ and |Δv̈| (and Δv̈ > 0 for the first glitch in the pair, then Δv̈ < 0 for the second glitch in the pair), albeit with large uncertainties (see Table 2 and Figure 8). Each pair occurs quasi-periodically (as is evident from, e.g., Figure 1), with a period of ~ 210 – 270 d (in Δv) that simply reflects the glitch size-time to next glitch correlation and ~ 440 – 480 d (in Δv̇). These behaviors do not seem to occur in the RXTE era, and it will be interesting to see whether this continues with future monitoring and detection of glitches using NICER.
For the three largest glitches (glitches 2, 4, and 6), we add an exponential term in the timing model to look for a potential exponential recovery associated with each glitch. No evidence of exponential recovery for glitch 6 is found, but there is marginal evidence for glitches 2 and 4 (with χ2/dof decreasing from 4.1 to 2.6 and from 12 to 6.9, respectively), each with a timescale of ~5 d. This is in contrast to the 20 d timescale of the largest RXTE glitch (Antonopoulou et al. 2018).
4.2. Glitch predictability
PSR J0537–6910 is unique in how well its glitch sizes Δv correlate with time to the next glitch (Middleditch et al. 2006; Antonopoulou et al. 2018; Ferdman et al. 2018). Figure 9 shows this correlation, with NICER glitches from Table 2 and RXTE glitches from Antonopoulou et al. (2018). We perform two fits to model the correlation: one linear model is constrained such that the time to next glitch is zero when Δv = 0 and a second linear model that allows for non-zero time to next glitch when Δv = 0. One might argue that the former is more physically-motivated. However, Figure 9 clearly shows that there is a delay even for small glitches, which could suggest that there is a minimum time to next glitch or that the correlation has a different slope or becomes non-linear at small glitch sizes. Results of the fits to all NICER and RXTE glitches are time to next glitch = 6.4 d (Δv/μHz) and time to next glitch = (23 ± 1) d + (5.08 ± 0.07) d (Δv/μHz), and both fit results are plotted in Figure 9. Fits to only NICER or only RXTE glitches yield very similar results, and the above results also closely match those obtained by Antonopoulou et al. (2018); Ferdman et al. (2018) using only RXTE glitches.
Figure 9.
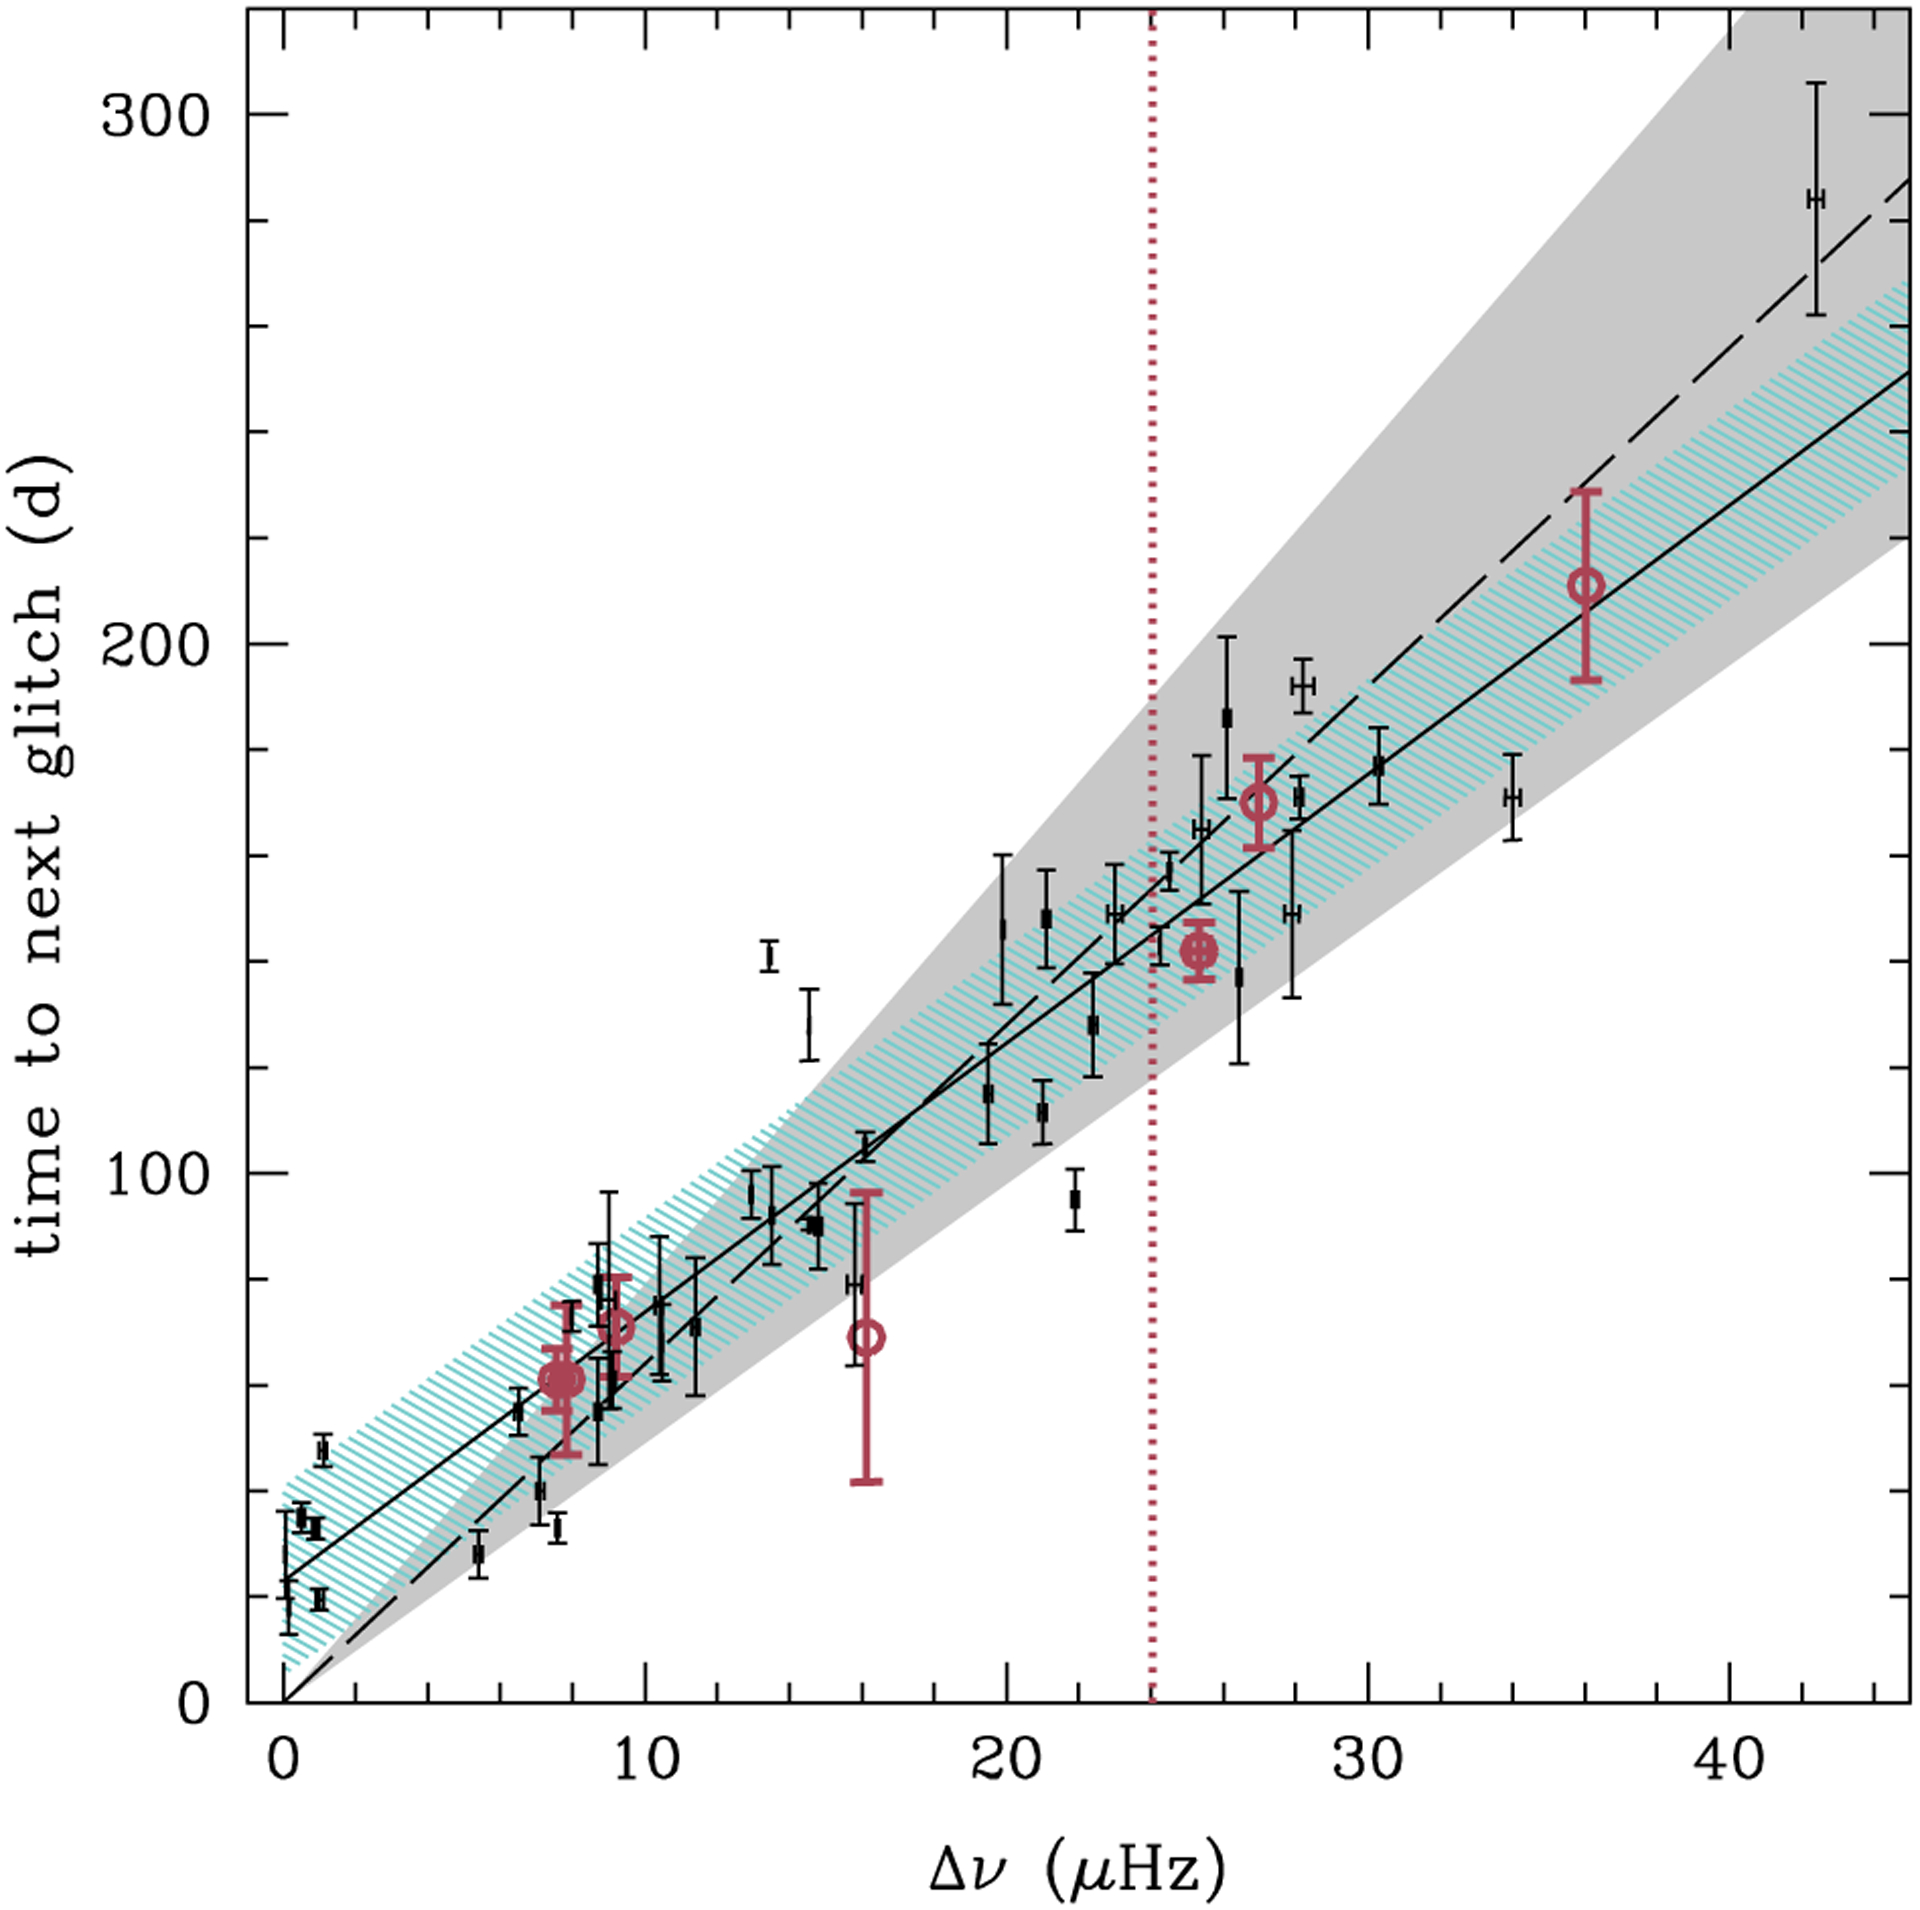
Time to next glitch as a function of glitch size Δv. Circles with errors are NICER values, and points with errors are RXTE values, which are from Table 2 of Antonopoulou et al. (2018). Vertical dotted line indicates the size of glitch 8, which is the most recent NICER-detected glitch and for which the time to next glitch is not known yet. Errors in Δv are 1σ uncertainty. Solid and dashed lines show a linear fit of NICER and RXTE data with time to next glitch = 6.4 d (Δv/μHz) and time to next glitch = 23 d + 5.08 d (Δv/μHz), respectively, while shading shows correlation regions which fit 68 percent of glitches (see Section 4.2).
While these best-fit results indicate a formal uncertainty in time to next glitch of only a few days, comparison of the two fit correlations can produce a difference of ~ 10 d in predicted time, and observed values show significant scatter around the best-fit correlations. To obtain a more reliable estimate of the uncertainty in predicted time to next glitch, we expand the parameter space covered by the best-fit correlation until 68 percent of measured glitches (with a follow-up glitch) fall within the expanded region. In particular, for the fit that is constrained at Δv = 0, we increment symmetrically the slope around the best fit value until 35 of 51 glitches lie within the two lines defined, i.e., time to next glitch = (6.4 ± 1.5) d (Δv/μHz). For the fit that is unconstrained at Δv = 0, we increment the normalization rather than the slope and find the two lines defined by time to next glitch = (23 ± 18) d + 5.08 d (Δv/μHz) encompass 68 percent of glitches. Each of these are illustrated in Figure 9. From these results, the actual uncertainty in time to next glitch is ~ ±20 d.
4.3. Glitch-induced emission variability
We present a limited search for potential spectral and pulse profile changes associated with a glitch because the large non-imaging field-of-view of NICER is not ideal for studying emission from a weak point source embedded within bright diffuse emission, such as the case of PSR J0537–6910. Note that Ferdman et al. (2018) look for but do not find glitch-associated flux and pulse profile changes using the RXTE dataset (see also, e.g., Palfreyman et al. 2018 for a radio search during a Vela pulsar glitch, Ray et al. 2019 for a X-ray search during three spin-down glitches of NGC 300 ULX-1, and Feng et al. 2020 for a X-ray polarization search during a Crab pulsar glitch). Here, we identify NICER observations that are nearest in time before and after glitch 4 (see Table 2) on MJD 58424 (2018 November 2) and compare spectra and pulse profiles to see if there are any clear signs of variability that could be associated with the glitch. Note that glitch 7 has the next nearest in time observations, about three days on either side of the glitch.
For spectral analysis, ObsID 1020100312 (MJD 58421; October 30) and 1020100313 (MJD 58422; October 31) are taken about two to three days before the glitch and ObsID 1020100314 (MJD 58425; November 3) and 1020100315 (MJD 58426; November 4) are taken about one to two days after the glitch. Data are processed using nicerl2 in NICERDAS with standard filtering options. We apply a barycentric correction, extract spectra from clean event data, subtract a background generated using the niback-gen3C50 tool, and add and bin spectra using mathpha and grppha, respectively. We obtain net exposures of 6.8 ks and 5.3 ks from the above specified pre and post-glitch observations, respectively. A comparison of the spectra results in χ2/dof = 552/314 and no distinctive features or clearly visible differences. We also fit each spectrum at 1–5 keV with an absorbed power law model and obtain model parameters before and after the glitch that are consistent within uncertainties, i.e., absorption NH = (2.7 ± 0.6) × 1021 cm−2 versus (2.2 ± 0.6) × 1021 cm−2, power law index Γ = 2.7 ± 0.1 versus 2.5 ± 0.1, and unabsorbed flux = (6.0 ± 0.2) × 10−12 erg s−1 cm−2 versus (6.1 ± 0.2) × 10−12 erg s−1 cm−2; errors are at 90 percent confidence. Imaging spectra of the supernova remnant using Chandra and XMM-Newton (Chen et al. 2006; Kuiper & Hermsen 2015) indicate higher NH (= 6 × 1021 cm−2) but comparable power law index (Γ ~ 2.4) and flux (≈ 1 × 10⁻¹¹ erg s−1 cm−2) to our spectral results. Therefore we conclude that our spectra are dominated by remnant emission, and pulsed emission from PSR J0537–6910 would be difficult to extract, which limits our ability to measure glitch-induced spectral variability.
For pulse profile analysis, our data reduction procedure is as described in Section 2 and yields exposures of 7.2 ks and 4.7 ks for the pre and post-glitch observations described above, respectively. We also consider observations from a somewhat larger range of dates around the glitch epoch. In particular, ObsID 1020100309–1020100311 (MJD 58416–58419; October 25–28) are from before the glitch and ObsID 1020100317–1020100321 (MJD 58431–58436; November 9–14) are from after the glitch, and merged observations from these ObsIDs have exposures of 7.5 ks and 8.4 ks, respectively. Figure 10 shows a comparison of the pulse profiles from before and after the glitch. Like the spectra, there are no clear significant differences. Subtracting from each pulse profile an average pulse profile, constructed from the above observations, we find residuals that are constant within uncertainties and a shift of one phase bin.
Figure 10.
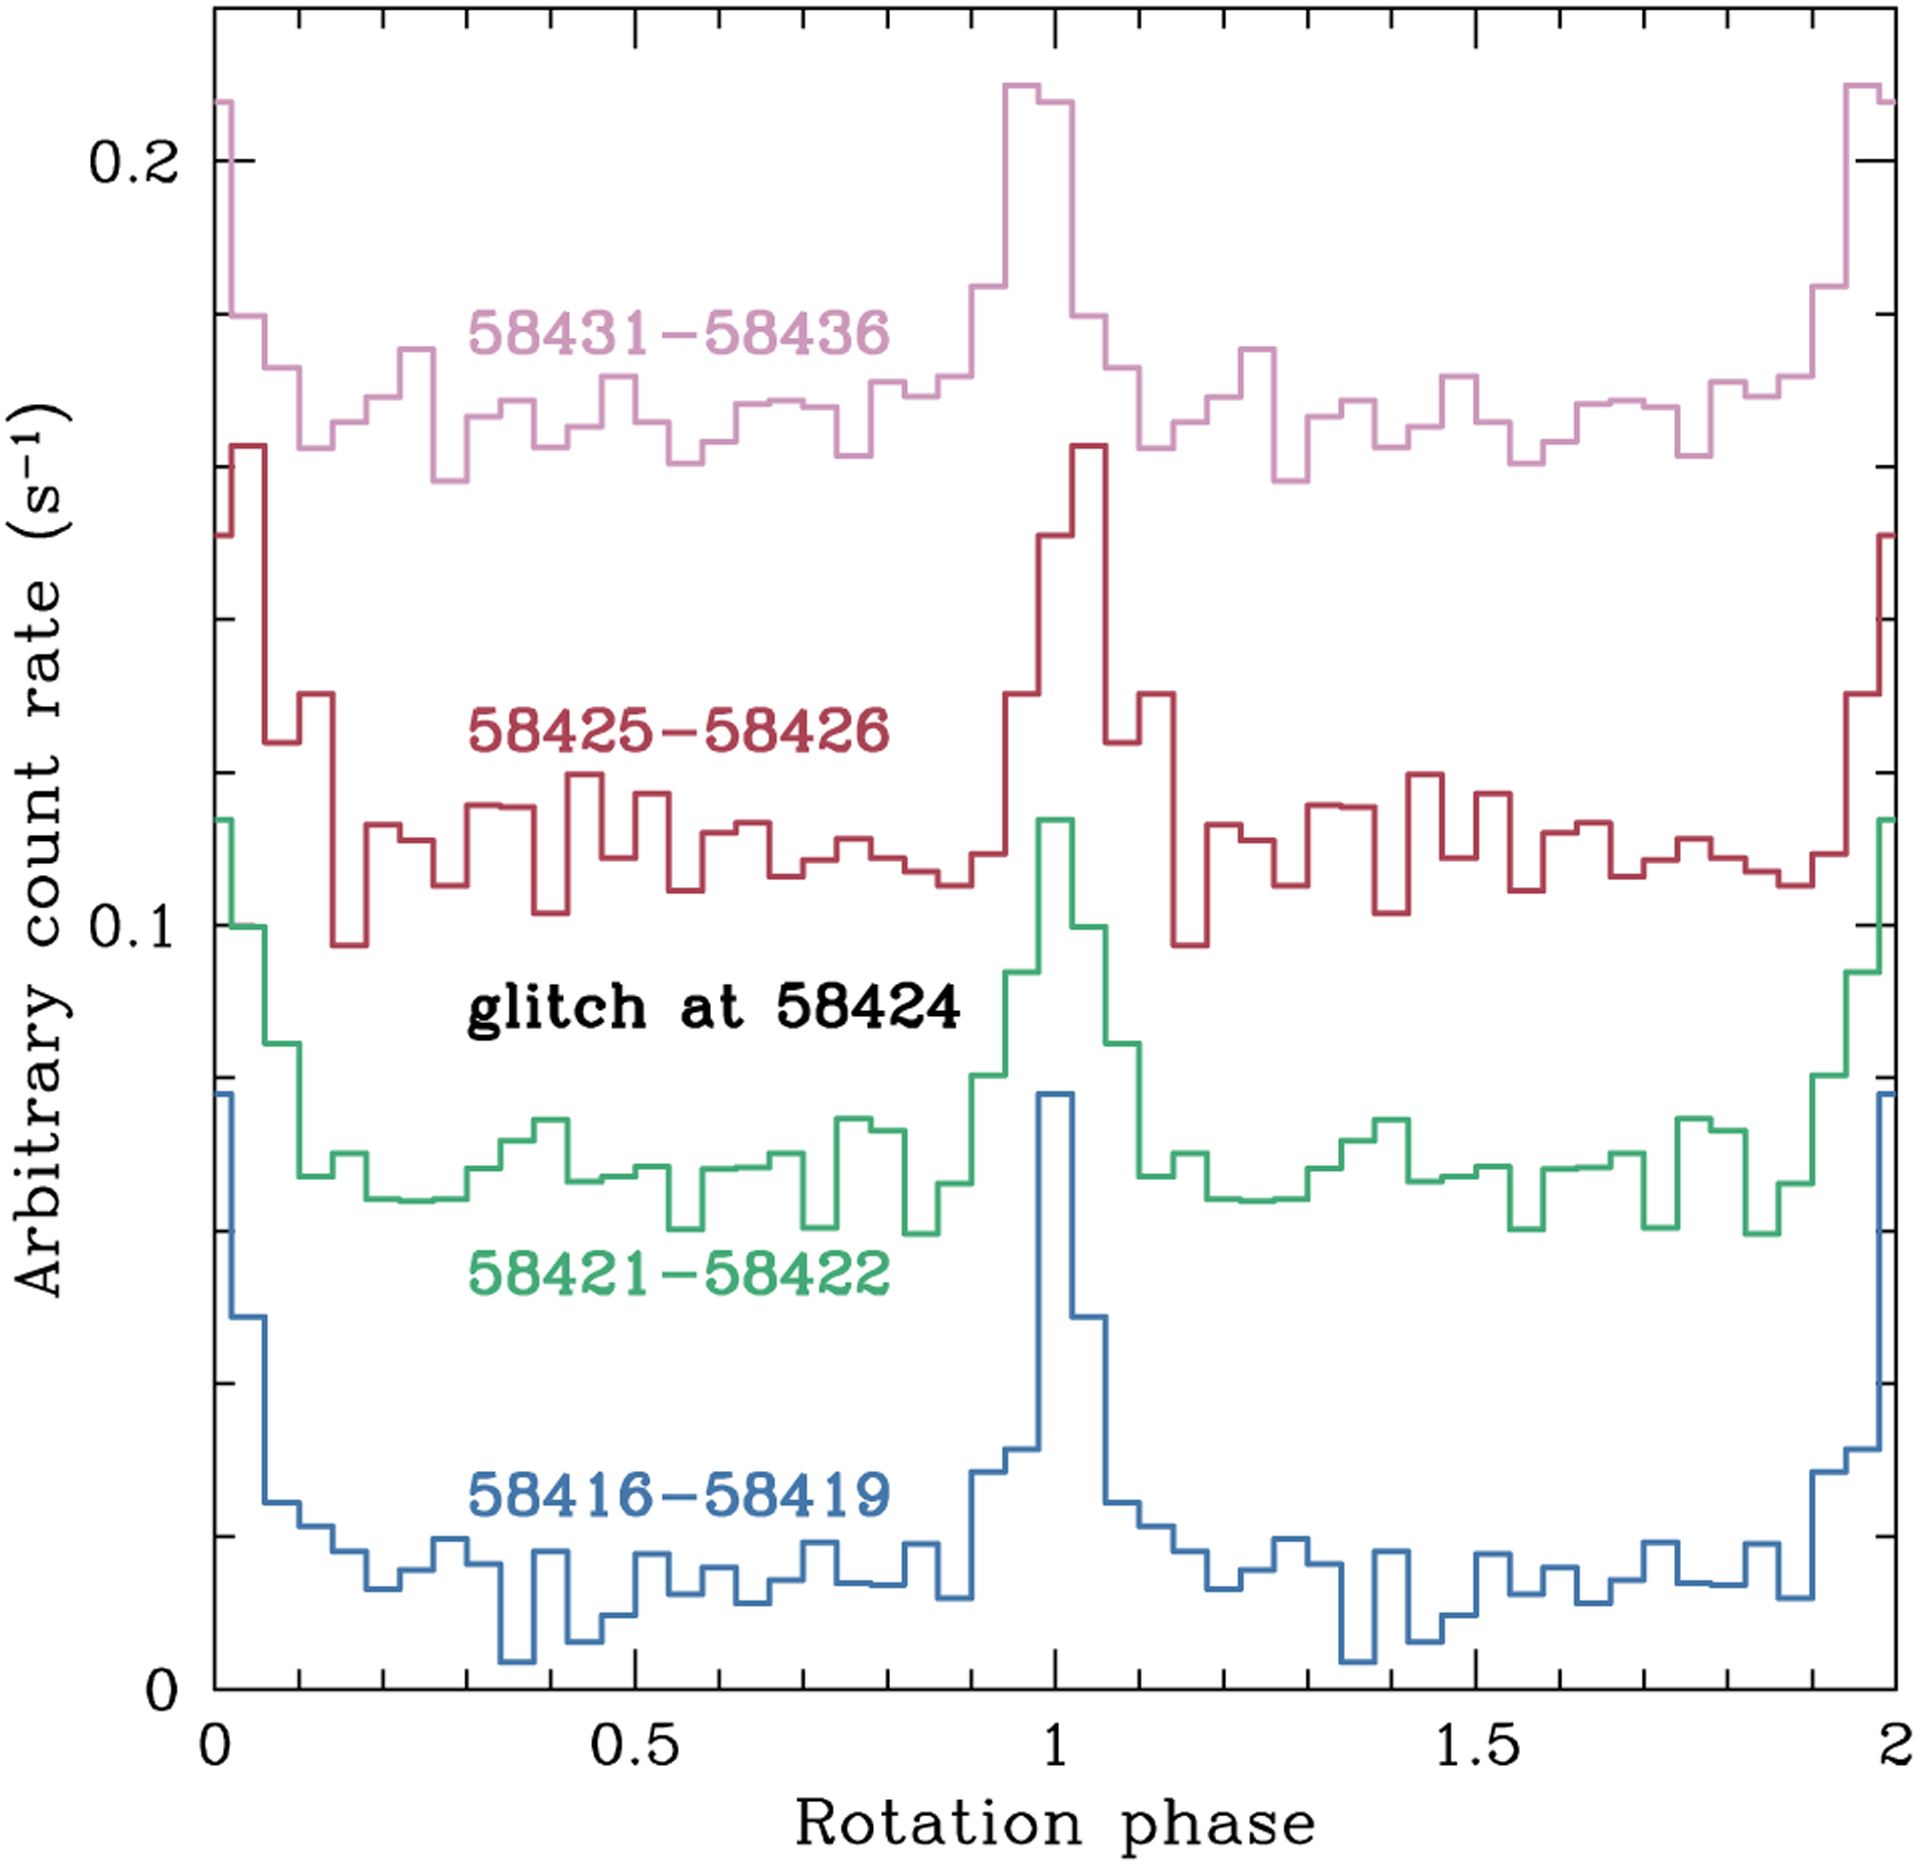
Pulse profiles of PSR J0537–6910 in the 1–7 keV band, folded at the ephemeris from Tables 1 and 2, from earliest date at the bottom to latest date at the top. Two rotation cycles are shown, with 25 bins per cycle, and each profile is arbitrarily shifted in count rate for clarity. Labels indicate MJD of data used to construct profile and epoch of glitch 4 (at MJD 58424).
5. DISCUSSIONS
In this work, we present results of our ongoing campaign of monitoring and timing the pulsar PSR J0537–6910 using NICER. We are able to obtain a rotation phase-connected timing model for the evolution of the pulsar spin frequency v during the first 2.7 yr of NICER observations. In agreement with timing results using RXTE from 1999–2011, we measure a long-term braking index n = −1.25 ± 0.01 and a short-term braking index between glitches that seems to relax over time towards a value of nig = 7 or possibly lower. We measure 8 glitches, with similar properties as RXTE glitches, and the rate is in line with the 42 or 45 glitches measured in 13 years of RXTE data. The 8 glitches also show a pairing/periodicity whose significance will be tested by future observations. We obtain a more reliable estimate of the uncertainty in the observed correlation between glitch size and time to next glitch. Finally, for the glitch that was most closely observed in time, i.e., within ±2 d, we search for but do not see clear evidence of spectral or pulse profile changes that could be associated with the glitch.
We provide here limited discussions of implications of our monitoring results and newly detected glitch activity. This is because much of the timing and glitch behaviors seen using the current NICER dataset is in good agreement with the behaviors seen using the RXTE dataset, and implications of the latter dataset are described extensively in many previous works (see below).
5.1. Superfluid and crust moment of inertia and pulsar mass
The mechanism that produces large spin-up glitches like those seen in the Vela pulsar (Dodson et al. 2007; Palfreyman et al. 2018) and PSR J0537–6910 is thought to be a sudden transfer of angular momentum from a rapidly rotating superfluid that permeates the neutron star inner crust to the rest of the star, which is slowing down from electromagnetic radiation braking (Anderson & Itoh 1975; Haskell & Melatos 2015; Graber et al. 2017). Link et al. (1999) provide strong support for this theory by first showing that the fractional moment of inertia (Isf/I) of the superfluid angular momentum reservoir is related to a pulsar’s glitch activity via Isf/I ≥ 2τc Ag, where I is total moment of inertia and τc = −v/2v̇ is pulsar characteristic age. They then show that the glitch activity of pulsars like Vela gives Isf/I ≳ 0.01, and this approximately matches the theoretical fractional moment of inertia of a neutron star’s crust Icrust/I. For PSR J0537–6910, we find 2τc Ag = 0.00874, which agrees with that found in previous works (Middleditch et al. 2006; Antonopoulou et al. 2018; Ferdman et al. 2018). More recently, calculations by Andersson et al. (2012); Chamel (2013) indicate that the above relation is underestimated after accounting for superfluid entrainment and should instead be , where and mn are averaged effective neutron mass and neutron mass, respectively (and ; Chamel 2012), and as a result, the angular momentum required by a glitch is more than the crust can provide. One solution proposed by Andersson et al. (2012) is that the superfluid component in the crust extends into the core. Subsequently, Ho et al. (2015, 2017) show that, by combining a pulsar’s glitch activity with a measurement of true age or surface temperature, one can obtain valuable constraints on properties of the superfluid and even measure the mass of the pulsar; for the Ag and estimated age of PSR J0537–6910, the pulsar’s mass turns out to be much higher than the canonical 1.4M⊙. Very recently, Sauls et al. (2020) suggest superfluid entrainment may not be as strong as found by Chamel (2012, 2017). More work is needed to resolve the issue.
5.2. Braking index and GW implications
As described in Section 3.2, we determine a long-term spin-rate change v̈ = (−8.00 ± 0.08) × 10−22 Hz s−2 from spin-rate v̇ measurements of PSR J0537–6910 over the past 21 years (Figure 4), which indicates an increasing |v̇| over time, unlike for most pulsars. The corresponding braking index n ≡ vv̈/v̇2 = −1.25 ± 0.01 is significantly lower than the canonical value of 3, which is implied for a pulsar whose rotational energy loss rate is purely due to electromagnetic dipole radiation (Shapiro & Teukolsky 1983). The braking index of PSR J0537–6910 is the lowest precisely measured value (cf. J1738–2955 has n = −70 ± 40 and J1833ed value (n = −15 ± 2; Parthasarathy et al. 2020). Glitches could contribute to lowering the braking index, as possibly indicated by the prevalence of low n for glitching pulsars (Espinoza et al. 2017; see also Ho 2015). Various other ideas and models that can produce a braking index below 3 have been proposed, e.g., a changing moment of inertia due to superfluidity (Ho & Andersson 2012), evolution of magnetic field orientation (Middleditch et al. 2006; Lyne et al. 2015; Johnston & Karastergiou 2017) or magnetic field strength (Romani 1990), as demonstrated for the case of PSR J0537–6910 (Gourgouliatos & Cumming 2015; Ho 2015), and particle winds (Michel 1969; Michel & Tucker 1969; Tong et al. 2013).
Meanwhile, measurements of the braking index of PSR J0537–6910 over shorter timescales of tens of days between glitches yields much larger values (Table 1). While the long-term spin evolution is clearly affected by glitches, the strength of the effect is unclear. Regardless, one can see that the post-glitch spin behavior appears to relax at long times after a glitch to a braking index value near 7 or even lower (Figure 6; see also Andersson et al. 2018), which is supported by a fit of post-glitch spin-rate with a model that assumes changes on an exponential timescale (see Section 3.2).
In addition to mechanisms that can lead to a braking index less than 3, such as those described above, it is well-known that neutron stars emitting GWs can have a braking index greater than 3. For example, a neutron star with a quadrupolar mass deformation, characterized by an ellipticity ε ≡ |Ixx − Iyy|/Izz, where Ixx, Iyy, and Izz are triaxial components of the stellar moment of inertia, can emit GWs at a frequency vgw (= 2v) with a strain amplitude
| (1) |
(see, e.g., Abbott et al. 2019c). The GW strain amplitude h0, which is either measured or has an upper bound in the case of non-detection, can be compared to the “spin-down limit” strain amplitude hsd, such that a constraint on a pulsar’s ellipticity is obtained when h0/hsd < 1. The spin-down limit
| (2) |
is determined by assuming that a neutron star’s rotational energy loss is due entirely to GW quadrupolar emission and implies a braking index n = 5. As GW searches become more sensitive, such that the measured h0 decreases, an improving constraint on ellipticity is
| (3) |
The latest LIGO/Virgo searches of PSR J0537–6910 find an upper limit of h0/hsd = 1.92 using GW data from the second observing run (O2), which collected data from 2016 November 30 to 2017 August 25 (Abbott et al. 2019a). Because the only timing model of PSR J0537–6910 available at the time of the GW search is that derived from RXTE observations from 1999–2011, the search by Abbott et al. (2019a) could only be conducted in a frequency band around the frequency expected for PSR J0537–6910 and could not account for glitches (Ashton et al. 2017; Keitel et al. 2019). A contemporaneous timing model, such as that determined here using NICER, enables the most sensitive targeted searches. Estimating the h0 sensitivity upper limit of O2 data at vgw = 124 Hz from Figure 2 of Abbott et al. (2019c), such a targeted search could yield h0/hsd < 0.4, which would set the limit ε < 4 × 10⁻⁵ and limit the percentage of rotational energy loss that is due to GW emission to < 20 percent. We also note that, while PSR J0537–6910 is much more distant than pulsars in the Milky Way, the decrease in signal strength [e.g., equation (1)] is partly compensated by its higher GW frequency, which is in the most sensitive range of ground-based GW detectors.
An alternative GW emission mechanism is that due to fluid motions in a neutron star. For example, an active r-mode oscillation can produce GWs (Andersson 1998; Friedman & Morsink 1998; Andersson & Kokkotas 2001), and GW searches for r-modes in pulsars are ongoing (see, e.g., Abbott et al. 2019b). The GW frequency in the case of r-modes is vgw ~ (4/3)v [or vgw ~ (1.4 − 1.6)v after accounting for relativistic corrections; Andersson et al. 2014; Idrisy et al. 2015; Jasiulek & Chirenti 2017; Caride et al. 2019], and the theoretical strain amplitude equivalent to equation (1) is
| (4) |
while the spin-down limit hsd is 3/2 that given by equation (2) (Owen 2010) and leads to a limit on the r-mode amplitude
| (5) |
What makes r-modes of special relevance to PSR J0537–6910 is that, if the spin evolution of a neutron star is dominated by GW emission from an active r-mode, then the resulting braking index is 7 (Owen et al. 1998), although it can also be less than 7 (Alford & Schwenzer 2014). As we show in Section 3.2 (see also Andersson et al. 2018; Ferdman et al. 2018), the braking index between glitches of PSR J0537–6910 seems to relax over time towards a value of 7, as effects of the glitch on long-term spin evolution decrease. If correct, this suggests an active r-mode and the spin evolution of PSR J0537–6910 is determined by GW emission. Such a situation is examined in Andersson et al. (2018), who conclude that an active r-mode is marginally possible, especially with uncertainties and discrepancies in our understanding of r-modes and their impact on observations (see, e.g., Ho et al. 2019, and references therein).
Narrow-band searches for GWs generated by r-modes in PSR J0537–6910 have been conducted using O1 and O2 data (Fesik & Papa 2020a,b; see also Caride et al. 2019). We estimate, using the GW h0 sensitivity upper limit of O2 data at vgw ≈ 90 Hz from Abbott et al. (2019c), that an improved targeted search of r-modes in PSR J0537–6910 using a contemporaneous timing model and accounting for glitches would yield h0/hsd < 0.3, which would set the limit α < 0.06 and limit the percentage of rotational energy loss that is due to GW emission to < 10 percent. Efforts are underway to search the latest, most sensitive GW data from the third observing run (O3), which collected data from 2019 April 1 to 2020 March 27. The timing model provided here using NICER data, with 3 glitches occurring during O3 (see Figure 8), will produce the best limits on ellipticity and r-mode amplitude of PSR J0537–6910.
ACKNOWLEDGEMENTS
The authors thank the anonymous referee for comments which led to improvements in the manuscript. WCGH greatly appreciates advice and support on timing analyses by S. Bogdanov, A. Lommen, and E. Teng and thanks N. Andersson and D.I. Jones for discussions and A. Beri, A.K. Harding, A. Królak, S. Mastrogiovanni, M.A. Papa, M. Pitkin, G. Raman, K. Riles, and G. Woan for support. WCGH acknowledges support through grant 80NSSC19K1444 from NASA. CME acknowledges support from FONDECYT/Regular 1171421 and USA1899-Vridei 041931SSSA-PAP (Universidad de Santiago de Chile, US-ACH). MB is partially supported by Polish NCN grant no. 2017/26/M/ST9/00978. BH is supported by Polish NCN grant no. 2015/18/E/ST9/00577. This work is supported by NASA through the NICER mission and the Astrophysics Explorers Program and makes use of data and software provided by the High Energy Astrophysics Science Archive Research Center (HEASARC), which is a service of the Astrophysics Science Division at NASA/GSFC and High Energy Astrophysics Division of the Smithsonian Astrophysical Observatory.
Footnotes
DATA AVAILABILITY
The data underlying this article will be shared on reasonable request to the corresponding author.
This paper has been typeset from a TEX/LATEX file prepared by the author.
The first NICER observations of PSR J0537–6910 with significant exposure time occur in 2017 July. While we are able to construct 3 TOAs from these observations, we are unable to obtain a sensible phase-connection between these TOAs and others that follow them. This may be due to a small magnitude glitch (with Δv < 0.06 μHz) between MJDs 57963 and 57984, but we are unable to determine this conclusively or characterize this possible glitch because of the insufficient number of TOAs provided by the 2017 July data.
REFERENCES
- Abbott et al. 2019a, Phys. Rev. D, 99, 122002 [Google Scholar]
- Abbott et al. 2019b, ApJ, 875, 122 [Google Scholar]
- Abbott et al. 2019c, ApJ, 879, 10 [Google Scholar]
- Akbal O, Alpar MA, Buchner S, Pines D, 2017, MNRAS, 469, 4183 [Google Scholar]
- Alford MG, Schwenzer K, 2014, ApJ, 781, 26 [Google Scholar]
- Alpar MA, Pines D, Anderson PW, Shaham J, 1984, ApJ, 276, 325 [Google Scholar]
- Anderson PW, Itoh N, 1975, Nature, 256, 25 [Google Scholar]
- Andersson N, 1998, ApJ, 502, 708 [Google Scholar]
- Andersson N, Kokkotas KD, 2001, International Journal of Modern Physics D, 10, 381 [Google Scholar]
- Andersson N, Glampedakis K, Ho WCG, Espinoza CM, 2012, Phys. Rev. Lett, 109, 241103. [DOI] [PubMed] [Google Scholar]
- Andersson N, Jones DI, Ho WCG, 2014, MNRAS, 442, 1786 [Google Scholar]
- Andersson N, Antonopoulou D, Espinoza CM, Haskell B, Ho WCG, 2018, ApJ, 864, 137 [Google Scholar]
- Antonopoulou D, Espinoza CM, Kuiper L, Andersson N, 2018, MNRAS, 473, 1644 [Google Scholar]
- Ashton G, Prix R, Jones DI, 2017, Phys. Rev. D, 96, 063004. [DOI] [PubMed] [Google Scholar]
- Caride S, Inta R, Owen BJ, Rajbhand ari B, 2019, Phys. Rev. D, 100, 064013 [Google Scholar]
- Chamel N, 2012, Phys. Rev. C, 85, 035801 [Google Scholar]
- Chamel N, 2013, Phys. Rev. Lett, 110, 011101. [DOI] [PubMed] [Google Scholar]
- Chamel N, 2017, Journal of Low Temperature Physics, 189, 328. [DOI] [PMC free article] [PubMed] [Google Scholar]
- Chen Y, Wang QD, Gotthelf EV, Jiang B, Chu Y-H, Gruendl R, 2006, ApJ, 651, 237 [Google Scholar]
- Dodson R, Lewis D, McCulloch P, 2007, Ap&SS, 308, 585 [Google Scholar]
- Edwards RT, Hobbs GB, Manchester RN, 2006, MNRAS, 372, 1549 [Google Scholar]
- Espinoza CM, Lyne AG, Stappers BW, Kramer M, 2011, MNRAS, 414, 1679 [Google Scholar]
- Espinoza CM, Lyne AG, Stappers BW, 2017, MNRAS, 466, 147 [Google Scholar]
- Feng H, et al. , 2020, Nature Astronomy, 4, 511 [Google Scholar]
- Ferdman RD, Archibald RF, Gourgouliatos KN, Kaspi VM, 2018, ApJ, 852, 123 [Google Scholar]
- Fesik L, Papa MA, 2020a, ApJ, 895, 11 [Google Scholar]
- Fesik L, Papa MA, 2020b, ApJ, 897, 185 [Google Scholar]
- Friedman JL, Morsink SM, 1998, ApJ, 502, 714 [Google Scholar]
- Fuentes JR, Espinoza CM, Reisenegger A, Shaw B, Stappers BW, Lyne AG, 2017, A&A, 608, A131 [Google Scholar]
- Fuentes JR, Espinoza CM, Reisenegger A, 2019, A&A, 630, A115 [Google Scholar]
- Gourgouliatos KN, Cumming A, 2015, MNRAS, 446, 1121 [Google Scholar]
- Graber V, Andersson N, Hogg M, 2017, International Journal of Modern Physics D, 26, 1730015 [Google Scholar]
- Haskell B, Melatos A, 2015, International Journal of Modern Physics D, 24, 1530008 [Google Scholar]
- Ho WCG, 2015, MNRAS, 452, 845 [Google Scholar]
- Ho WCG, Andersson N, 2012, Nature Physics, 8, 787 [Google Scholar]
- Ho WCG, Espinoza CM, Antonopoulou D, Andersson N, 2015, Science Advances, 1, e1500578. [DOI] [PMC free article] [PubMed] [Google Scholar]
- Ho WCG, Espinoza CM, Antonopoulou D, Andersson N, 2017, in Kubono S, Kajino T, Nishimura S, Isobe T, Nagataki S, Shima T, Takeda Y, eds, 14th International Symposium on Nuclei in the Cosmos (NIC2016). p. 010805 (arXiv:1703.00932), doi: 10.7566/JPSCP.14.010805 [DOI] [Google Scholar]
- Ho WCG, Heinke CO, Chugunov AI, 2019, ApJ, 882, 128 [Google Scholar]
- Ho WCG, Jones DI, Andersson N, Espinoza CM, 2020, Phys. Rev. D, 101, 103009 [Google Scholar]
- Hobbs GB, Edwards RT, Manchester RN, 2006, MNRAS, 369, 655 [Google Scholar]
- Howitt G, Melatos A, Delaigle A, 2018, ApJ, 867, 60 [Google Scholar]
- Idrisy A, Owen BJ, Jones DI, 2015, Phys. Rev. D, 91, 024001 [Google Scholar]
- Jasiulek M, Chirenti C, 2017, Phys. Rev. D, 95, 064060 [Google Scholar]
- Johnston S, Karastergiou A, 2017, MNRAS, 467, 3493 [Google Scholar]
- Keitel D, et al. , 2019, Phys. Rev. D, 100, 064058 [Google Scholar]
- Kuiper L, Hermsen W, 2015, MNRAS, 449, 3827 [Google Scholar]
- Link B, Epstein RI, Lattimer JM, 1999, Phys. Rev. Lett, 83, 3362 [Google Scholar]
- Lyne AG, Jordan CA, Graham-Smith F, Espinoza CM, Stappers BW, Weltevrede P, 2015, MNRAS, 446, 857 [Google Scholar]
- Manchester RN, Hobbs GB, Teoh A, Hobbs M, 2005, AJ, 129, 1993 [Google Scholar]
- Marshall FE, Gotthelf EV, Zhang W, Middleditch J, Wang QD, 1998, ApJ, 499, L179 [Google Scholar]
- Marshall FE, Gotthelf EV, Middleditch J, Wang QD, Zhang W, 2004, ApJ, 603, 682 [Google Scholar]
- McKenna J, Lyne AG, 1990, Nature, 343, 349 [Google Scholar]
- Melatos A, Drummond LV, 2019, ApJ, 885, 37 [Google Scholar]
- Melatos A, Peralta C, Wyithe JSB, 2008, ApJ, 672, 1103 [Google Scholar]
- Melatos A, Howitt G, Fulgenzi W, 2018, ApJ, 863, 196 [Google Scholar]
- Michel FC, 1969, ApJ, 158, 727 [Google Scholar]
- Michel FC, Tucker WH, 1969, Nature, 223, 277 [Google Scholar]
- Middleditch J, Marshall FE, Wang QD, Gotthelf EV, Zhang W, 2006, ApJ, 652, 1531 [Google Scholar]
- Owen BJ, 2010, Phys. Rev. D, 82, 104002 [Google Scholar]
- Owen BJ, Lindblom L, Cutler C, Schutz BF, Vecchio A, Andersson N, 1998, Phys. Rev. D, 58, 084020 [Google Scholar]
- Palfreyman J, Dickey JM, Hotan A, Ellingsen S, van Straten W, 2018, Nature, 556, 219. [DOI] [PubMed] [Google Scholar]
- Parthasarathy A, et al. , 2020, MNRAS, 494, 2012 [Google Scholar]
- Pietrzyński G, et al. , 2019, Nature, 567, 200. [DOI] [PubMed] [Google Scholar]
- Ransom SM, Eikenberry SS, Middleditch J, 2002, AJ, 124, 1788 [Google Scholar]
- Ray PS, et al. , 2019, ApJ, 879, 130 [Google Scholar]
- Romani RW, 1990, Nature, 347, 741 [Google Scholar]
- Sauls JA, Chamel N, Alpar MA, 2020, arXiv e-prints, p. arXiv:2001.09959 [Google Scholar]
- Shapiro SL, Teukolsky SA, 1983, Black holes, white dwarfs, and neutron stars : the physics of compact objects. Wiley [Google Scholar]
- Tong H, Xu RX, Song LM, Qiao GJ, 2013, ApJ, 768, 144 [Google Scholar]
- Townsley LK, Broos PS, Feigelson ED, Garmire GP, Getman KV, 2006, AJ, 131, 2164 [Google Scholar]
- Wang QD, Gotthelf EV, 1998, ApJ, 494, 623 [Google Scholar]
- Yu M, et al. , 2013, MNRAS, 429, 688 [Google Scholar]


