

Abstract
Objective:
Symptomatic peripheral arterial disease (PAD) impairs walking, but data on the impact of PAD on community mobility is limited. Life-space mobility measures the distance, frequency, and assistance needed as older adults move through geographic areas extending from their bedroom (life-space mobility score: 0) to beyond their town (life-space mobility score: 120). We evaluated the association of PAD with longitudinal life-space mobility trajectory.
Methods:
Participants were part of the University of Alabama at Birmingham (UAB) Study of Aging, a longitudinal study of community-dwelling older adults who were followed from 2001–2009. We limited our analysis to those who survived at least 6 months (N=981). PAD was based on self-report with verification by physician/hospital records. Our primary outcome was life-space mobility score assessed every six-months. A multilevel change model (mixed model) was used to determine the association between PAD and life-space mobility trajectory over a median 7.9 years of follow-up.
Results:
Participants had a mean age of 75.7 (SD 6.7), 50.5% were female, and 50.4% were African American. PAD prevalence was 10.1%, and 57.1% of participants with PAD died. In participants with both PAD and life-space restriction, defined as life-space mobility score <60, we observed the highest mortality (73.1%). In a multivariable adjusted mixed effects model, participants with PAD had a more rapid decline in life-space mobility by −1.1 (95% CI −1.9, −0.24) points per year compared to those without PAD. At five-year follow-up, model adjusted mean life-space mobility (95% CI) was 48.1 (43.5, 52.7) and 52.4 (50.9, 53.8), among those with and without PAD, respectively, corresponding to a restriction in independent life-space mobility at the level of one’s neighborhood.
Conclusions:
Life-space mobility is a novel, patient-centered measure of community mobility, and PAD is associated with significant life-space mobility decline among community-dwelling older adults. Further study is needed to mechanistically confirm these findings and determine if better recognition and treatment of PAD alter the trajectory of life-space mobility.
Keywords: peripheral arterial disease, life-space mobility, mortality
Table of Contents Summary
PAD was associated with significant life-space mobility decline in in this analysis of the University of Alabama at Birmingham Study-of-Aging. Life-space mobility may be an important tool for measuring the impact of PAD mobility.
Introduction
Peripheral artery disease (PAD) affects 15–20% of people ≥65 years, and the prevalence increases with older age.1,2 Walking impairments due to claudication are the clinical hallmark of PAD, whereby reduced lower extremity arterial perfusion and skeletal muscle damage from ischemia–reperfusion injury prevents patients from walking long distances without stopping.3,4 Older adults with increasing PAD severity, as measured by ankle brachial index (ABI), have significant functional decline and mortality.5,6 The functional limitations associated with PAD have also been characterized in terms of decreased clinic-based measures of walking distance,3,5 reduced activities of daily living (ADLs),7,8 and accelerated physical decline.6 Depressed lower extremity function in older adults is also associated with subsequent disability.9 While these objective functional and walking measurements are important outcomes, patients often describe their health goals in terms of getting out of the house, visiting with friends and family, or attending religious services.10 However, measuring the impact of PAD on these patient-centered outcomes is not routinely done in clinical practice.
Life-space mobility is a measure of community mobility and social participation that quantifies the distance, frequency, and independence obtained as an older adult moves through his or her environment.11,12 Among community-dwelling older adults, life-space mobility decline has been independently associated with higher mortality;13 and when followed longitudinally, life-space mobility decline can reflect acute life changes such as hospitalization.14 In contrast to task-specific measures that do not capture mobility across the full continuum of function, life-space mobility measures movement through five life-space levels (rooms beyond the bedroom, areas outside of the house, places in the neighborhood, one’s town, and beyond one’s town), and reflects social participation to the degree that mobility is associated with such activities.15 While all older adults are expected to have small amounts of life-space mobility decline over time as they age, specific disease processes, such as kidney disease, have been shown to accelerate life-space mobility decline.16
Life-space mobility has not yet been studied in people with PAD. Evidence suggesting that PAD is associated with life-space mobility decline could be used to support routine measurement in clinical practice to help guide management and assess response to treatment. We therefore sought to determine if PAD is associated with life-space mobility decline by evaluating the association of PAD with longitudinal life-space mobility trajectory over 7.9 years of follow-up among community-dwelling older adults in the University of Alabama at Birmingham (UAB) Study of Aging. We also explored the association of concurrent PAD and life-space mobility decline on mortality. We hypothesized that PAD is independently associated with life-space mobility decline and subsequent mortality.
Methods
Participants
The UAB Study of Aging was a prospective observational study of community-dwelling older adults (age ≥65 years). A random sample of Medicare beneficiaries were recruited and stratified by race (African American/white), county (rural/urban), and gender to achieve a balanced sample with respect to these factors.17 To provide a balanced sample in terms of race, gender, and rural-urban residence, the UAB Study of Aging oversampled African Americans, men, and residents of rural areas. Study participants were recruited from late 1999 to early 2001 and were followed every 6 months for 9 years, until the end of 2009. Interview questions targeted factors related to mobility and everyday function, and were gathered during in-home interviews at baseline and at 4 years, with telephone follow-up every 6 months. Of the initial 1000 participants, the 19 who died within first 6 months of study were excluded. Participants with missing baseline PAD status were also excluded resulting in final analytic sample of 981. All study participants had a baseline life-space mobility score. This study protocol was reviewed and approved by the institutional review board at Emory University. The need for patient consent was waived because all data were deidentified, and no direct patient contact or harm occurred as a result of the study.
Measures
Our primary exposure of interest was PAD defined by self-report, which was subsequently verified by primary physician report or hospital records. Other measures of interest included demographic variables: age, sex, marital status, race, county of residence (rural versus non-rural), access to transportation, years smoked, and education were self-reported. Body mass index (BMI) was calculated using the measured weight and height by the interviewer, and used self-reported weight in rare cases, such as when participants were not able to stand to get on the scale. Chronic conditions including hypertension, coronary artery disease, stroke, heart failure, and arthritis or gout were also self-reported, and considered verified if the person took a medication for the condition, the primary physician reported the condition, or hospital records listed the condition (any of these three was sufficient). Participants’ primary care physicians also filled out a medical history questionnaire for validation and participants were asked to show the interviewer all medications they currently used. Medication names were recorded and coded into drug classes. The Mini-Mental State Examination (MMSE) was used to measure cognitive ability; MMSE scores range from 0–30, with higher scores indicating better cognitive function.18 Depressive symptoms were scored using the 15-item Geriatric Depression Scale (GDS).13 The GDS scale involves yes/no responses to potential depressive symptoms, and higher scores reflect higher depressive symptoms. Data on all baseline participant characteristics were obtained at the time of participant recruitment.
Life-Space Mobility
The UAB Study of Aging Life-Space Assessment is a validated measure of participant mobility and social participation, which is reflected in an life-space mobility assessment score.12 First introduced in 2003, Life-Space Assessment has been shown to have test-retest reliability over short follow-up [intraclass correlation coefficient (95% CI) =0.96 (0.95–0.97)] over two weeks, and is responsive to change over follow-up.11 Ranging from 0–120, life-space mobility scores have been shown to be normally distributed in the UAB Study of Aging population.19 The mean (SD) total life-space mobility scores by life-space levels among all participants in the study are shown in Figure I. Each life-space level (bedroom, home, yard, neighborhood, town, and out of town) has incrementally more points, thus a higher total score demonstrates more mobility.
Figure I.
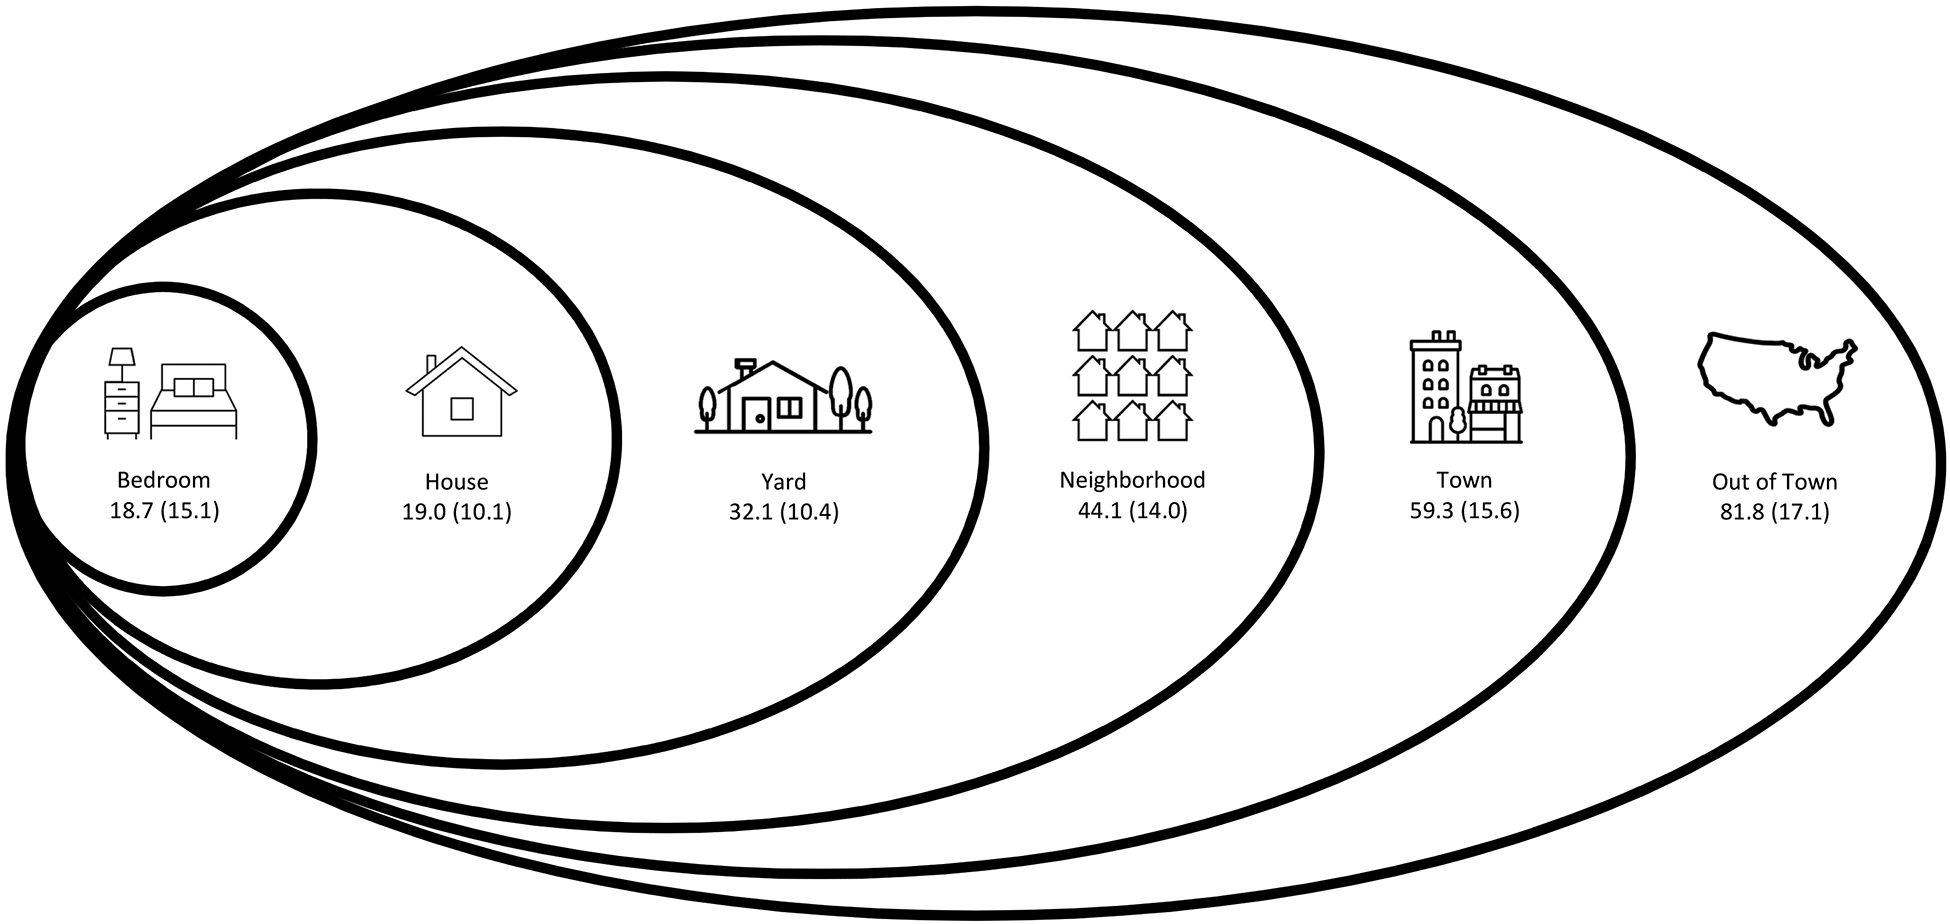
Conceptual model demonstrating the life-space mobility levels with mean +/− standard deviation for composite life-space score among all University of Alabama at Birmingham Study of Aging participants (N=1,000) by level reached independently in the 4 weeks before the baseline assessments completed in 1999–2001 (adapted from Bowling, et al.16).
To obtain an life-space mobility score, participants are asked in person or over the telephone11 about how frequently they reach each life-space level and what degree of assistance they need at each life-space level. Within each life-space level, a sub-score is calculated by multiplying together the life-space level score, frequency score, and independence score. These sub-level scores are then added to obtain the total score (Supplemental Table I). In previous studies, life-space mobility scores have been shown to be consistent over short periods of follow-up, but also reflect changes in mobility after acute events such as hospitalization (estimated decline of ≥10 points) and natural decline demonstrated by longer-term follow-up.12,14 A minimal important change in life-space mobility has been reported to be as small as 1.7 points.20
Statistical Analysis
The numbers, percentages, and means for demographics, health-related factors, and medical conditions at baseline were calculated overall, and by PAD status. Two analyses were done; for the first analysis, life-space trajectories for people with and without baseline PAD were observed. The second was a survival analysis stratified by those with PAD and those with life-space mobility restriction, defined as a life-space score ≤ 60. Prior studies have shown that a level of 60 corresponds to a person’s ability to go to life-space zones beyond one’s neighborhood independently, and has been shown to be an important threshold at which older adults restrict their mobility and social participation.19 For the first analysis, multilevel change (random-coefficients) regression models were used to determine the association between PAD and life-space mobility trajectory over time. In the multilevel change model, level 1 consisted of longitudinal (within-person) trajectories with life-space as a function of time. Level 2 consisted of group intercepts and growth factors, as well as between-person predictors of individual differences in those intercepts and growth factors.14 This method allows for the evaluation of overall group effects with random individual deviations in life-space mobility slope.
First, unconditional mean models that included only PAD status and time, evaluating linear life- space trajectories were done. In order to evaluate the impact of PAD status independent of potential confounders, we adjusted for factors known to be associated with life-space mobility. Variable selection for this model was informed by the World Health Organization International Classification of Functioning, Disability, and Health, and included adjustment for personal factors (age, gender, race, marital status, BMI, smoking status, cognition, and depression), environmental factors (rural residence and difficulty accessing transportation), as well as health conditions (diabetes, hypertension, stroke, coronary artery disease, kidney disease, chronic obstructive pulmonary disease, heart failure, and arthritis or gout. Using the multivariable adjusted model, growth curves for change in life-space mobility from baseline were plotted.
Second, survival analysis was used to obtain crude and multivariable adjusted hazard ratios for the joint association between baseline PAD status and life-space mobility decline with mortality. Participants were grouped into four categories: 1) no PAD, unrestricted life-space, 2) no PAD, restricted life-space, 3) PAD, unrestricted life-space, 4) PAD, restricted life-space. Kaplan-Meier curves were generated by the four categories of PAD and life-space mobility restriction to show the difference in survival. A multivariable adjusted survival analysis included adjustment for the same characteristics described for the mixed model with the no PAD/unrestricted life-space serving as the reference. All analyses were conducted using SAS version 9.4 (SAS Institute Inc., Cary, NC).
RESULTS
Baseline Participant Characteristics
There were a total of 981 study participants with a mean (SD) age of 75.7 (6.7). 50.9% were female and 50.5% were African American (Table I). Overall there were 99 (10.1%) people with diagnosed and verified PAD at baseline. Participants with PAD were more likely to be male, have less than a high school education, more active years smoking, and more transportation difficulty. Participants with PAD also had higher burden of chronic conditions like diabetes, hypertension, CAD, stroke, chronic kidney disease, chronic obstructive pulmonary disease, heart failure, and arthritis or gout.
Table I.
Baseline characteristics of the study participants by peripheral artery disease (PAD) status.
| Characteristic | All N = 981 | No PAD N = 882 | PAD N = 99 | P-Value |
|---|---|---|---|---|
| Age, mean (SD) | 75.7 (6.7) | 75.6 (6.6) | 77.2 (7.2) | 0.02 |
| Female, N (%) | 495 (50.5) | 449 (50.9) | 46 (46.5) | 0.40 |
| Married, N (%) | 500 (51.0) | 452 (51.2) | 48 (48.5) | 0.60 |
| African American, N (%) | 494 (50.4) | 445 (50. 5) | 49 (49.5) | 0.86 |
| Rural Residence, N (%) | 500 (51.0) | 450 (51.0) | 50 (50.5) | 0.92 |
| Transportation Difficulty, N (%) | 167 (17.0) | 143 (16.2) | 24 (24.2) | 0.04 |
| Years Smoked, mean (SD) | 18.5 (21.9) | 17.9 (21.6) | 23.8 (24.1) | 0.01 |
| Less than High School Education, N (%) | 485 (49.4) | 431 (48.8) | 54 (54.5) | 0.77 |
| Chronic Conditions, N (%) | ||||
| Diabetes Mellitus | 247 (25.2) | 209 (23.7) | 38 (38.4) | 0.001 |
| Hypertension | 694 (70.7) | 605 (68.6) | 89 (89.9) | <0.001 |
| Coronary Artery Disease | 144 (14.7) | 110 (12.5) | 34 (34.3) | <0.001 |
| Stroke | 109 (11.1) | 86 (9.8) | 23 (23.2) | <0.001 |
| Kidney Disease | 56 (5.7) | 44 (4.9) | 12 (12.1) | 0.003 |
| Chronic Obstructive Pulmonary Disease | 59 (6.0) | 51 (5.8) | 8 (8.0) | <0.001 |
| Congestive Heart Failures | 123 (12.5) | 96 (10.9) | 27 (27.3) | <0.001 |
| Arthritis/Gout | 476 (48.5) | 410 (46.5) | 66 (66.7) | <0.001 |
| Health Related Factors | ||||
| Body Mass Index, mean (SD) | 27.8 (5.6) | 27.9 (5.6) | 27.5 (5.8) | 0.46 |
| MMSE, mean (SD) | 25.0 (4.8) | 25.2 (4.7) | 23.9 (5.6) | 0.01 |
| GDS, mean (SD) | 2.3 (2.3) | 2.3 (2.3) | 2.8 (2.4) | 0.03 |
| Baseline Life-Space, mean (SD) | 64.3 (24.8) | 64.9 (24.8) | 58.5 (24.7) | <0.001 |
| Baseline Life-Space, N (%) | 0.17 | |||
| 80 – 120 | 290 (29.6) | 270 (30.6) | 20 (20.2) | |
| 60 – 79 | 289 (29.5) | 261 (29.6) | 28 (28.2) | |
| 40 – 59 | 226 (23.0) | 197 (22.3) | 29 (29.2) | |
| 20 – 39 | 140 (14.3) | 123 (13.9) | 17 (17.1) | |
| <20 | 36 (3.7) | 31 (3.5) | 5 (5.0) | |
| Life-Space Mobility, N (%) | 0.02 | |||
| Restricted (Life-Space Mobility < 60) | 405 (41.3) | 353 (40.0) | 52 (52.5) | |
| Unrestricted (Life-Space Mobility ≥ 60) | 576 (58.7) | 529 (60.0) | 47 (47.5) |
PAD and Life-Space Mobility
At baseline the mean life-space mobility score for people with PAD was lower than those without PAD, with a mean (SD) of 58.5 (24.6) compared to 64.9 (24.8); p=0.014. After adjusting for demographic variables, chronic comorbid conditions and GDS/MMSE scores, this association was no longer present. However, participants with PAD continued to show a more rapid decline in life-space mobility (slope of −1.09 points per year), (95% CI −1.9, −0.24)], compared to those without PAD (Table II) in the multivariable adjusted mixed effects model. Figure II shows the difference in the rate of decline for people with PAD versus without PAD over the 9-year study period.
Table II. Multilevel model showing the association of peripheral artery disease (PAD) and life-space mobility (LSM) trajectory.
In the multilevel model, results for PAD are interpreted as the difference in baseline life-space mobility associated with PAD. Results for the PAD*time interaction represent the difference in change in life-space mobility overtime (i.e., slope) associated with PAD.
Model 1: Unadjusted model showing the association of PAD with LSM trajectory.
Model 2: Model adjusted for all covariates including demographics, diabetes, hypertension, coronary artery disease, stroke, kidney disease, chronic obstructive pulmonary disease, congestive heart failure, gout/arthritis, Geriatric Depression Scale score, and Mini-Mental State Examination score.
| Model 1 Parameter Estimate (95% CI) | P-Value | Model 2 Parameter Estimate (95% CI) | P-Value | |
|---|---|---|---|---|
| Overall model intercept | 62.02 (60.6, 63.4) | <0.001 | 40.06 (32.2, 47.9) | <0.001 |
| PAD | −6.3(−10.8, −1.8) | 0.006 | 1.70 (−1.2, 5.2) | 0.24 |
| PAD*time interaction (slope) | −1.05 (−1.9, −0.2) | 0.01 | −1.09 (−1.9, −0.2) | 0.01 |
Figure II. Mixed model trajectories for decline in life-space mobility score by peripheral artery disease (PAD) status.

The model was adjusted for all covariates including demographics, diabetes, hypertension, coronary artery disease, stroke, kidney disease, chronic obstructive pulmonary disease, congestive heart failure, gout/arthritis, and Geriatric Depression Scale score and Mini-Mental State Examination score. Participants with PAD had a more rapid decline in life-space mobility [(slope of - 1.09 points per year), (95% CI −1.9, −0.2); p-value = 0.01)] compared to those without PAD.
Life-Space Mobility Restriction and Mortality
Mortality rate was highest (144.8/1000 person-years [PY]) for people with both PAD and life- space mobility restriction, followed by people with life-space mobility restriction and no PAD (98.3/1000 PY), PAD-only and no life-space mobility restriction (83.4/1000 PY), and people without either PAD or life-space mobility restriction (40.9/1000 PY). Figure III shows Kaplan-Meier survival curves, comparing the survival probabilities of people in different categories in terms of their PAD and life-space mobility restriction status. At five years, participants without life-space mobility restriction or PAD had over twice the survival probability of participants with PAD. Of the participants without PAD, those with life-space mobility restriction also had a much lower survival probability than those without. Compared to those with no life-space mobility restriction and no PAD, the unadjusted hazard ratio (95% CI) for decline in life-space mobility was 2.06 (1.3–3.1) for people with no life-space mobility restriction and PAD, 2.61 (2.1–3.2) for people with no PAD and life-space mobility restriction and 4.03 (2.8–5.7) among participants with reduced life-space mobility and PAD (Table III). All hazard ratios were attenuated with multivariable adjustment. Presence of life-space mobility restriction had a higher impact on mortality than presence of PAD alone.
Figure III. Kaplan-Meier curves showing survival curves for study subjects categorized in four different categories.
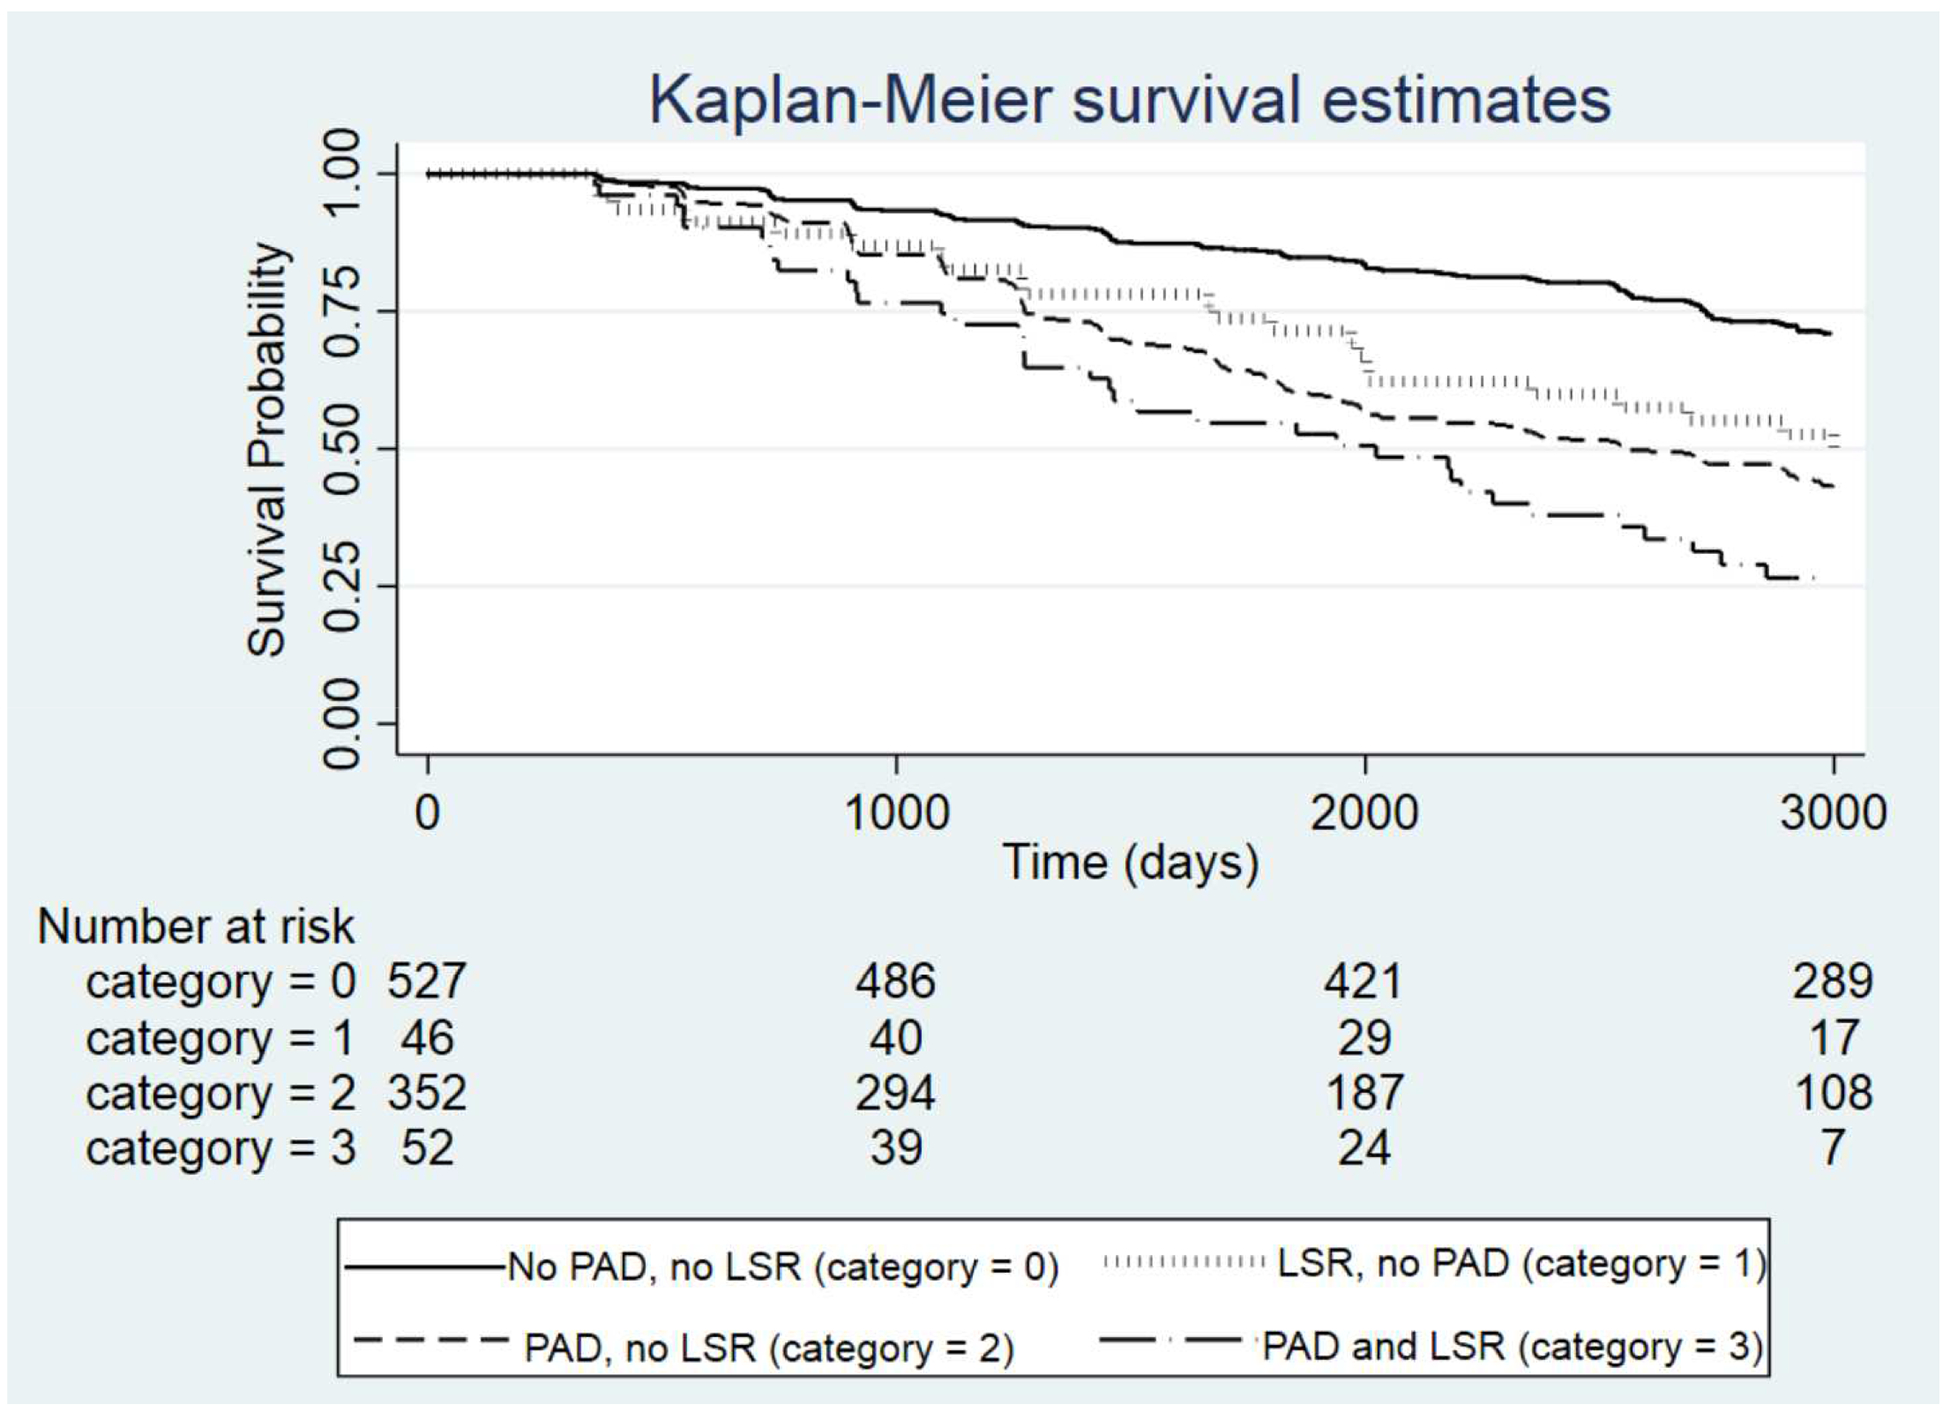
Categories were based on peripheral artery disease (PAD) and life-space mobility restriction (LSR) status, defined as life-space mobility score < 60). Subjects with both PAD and LSR showed a more rapid drop in survival probability compared to other categories.
Table III. Joint association of life-space mobility restriction (LSR), defined as life-space mobility score <60, and peripheral artery disease (PAD) with all-cause mortality.
Model 1: Unadjusted model showing the association of PAD and life-space restriction with all-cause mortality.
Model 2: Model adjusting for all covariates including demographics, diabetes, hypertension, coronary artery disease, stroke, kidney disease, chronic obstructive pulmonary disease, congestive heart failure, gout/arthritis, Geriatric Depression Scale score, and Mini-Mental State Examination score.
| No PAD/No LSR | PAD/No LSR | No PAD/LSR | PAD/LSR | |
|---|---|---|---|---|
| N (%) | 529 (53.9) | 47 (4.8) | 353 (36.0) | 52 (5.3) |
| Mortality, N (%) | 156 (29.5) | 24 (51.1) | 202 (57.1) | 38 (73.1) |
| Mortality rate, per 1000 PY | 40.9 | 83.4 | 98.3 | 144.8 |
| Model 1, HR (95% Confidence Interval) | 1 (ref) | 2.06 (1.3–3.1)* | 2.61 (2.1–3.2)* | 4.03 (2.8–5.7)* |
| Model 2, HR (95% Confidence Interval) | 1 (ref) | 1.51 (0.9–2.4)* | 2.17 (1.7–2.8)* | 1.96 (1.3–3.1)* |
P-value <0.05
DISCUSSION
In this study, we demonstrated that among community-dwelling older adults, participants with PAD experienced a significantly faster longitudinal life-space mobility decline compared to those without PAD. Further, the presence of life-space restriction may also have important prognostic information for older adults with PAD. Compared to participants with PAD and no life-space mobility restriction, those with PAD and life-space restriction were associated with a near doubling of mortality rate (83 vs. 144 per 1,000 person years). To our knowledge, this study is the first to apply the life-space mobility model to participants with PAD, and it demonstrates that life-space mobility can be used to measure declining function and independently predict mortality in this population.
PAD is very common in older adults; up to 1 in 5 patients ≥65 years have a PAD diagnosis,1,2 and PAD is closely associated with decreased mobility and functional decline.5,6 Despite its prevalence and well-known classic claudication symptoms, PAD can be a difficult disease to monitor. Well over half of patients with PAD are asymptomatic or suffer from difficult to characterize atypical symptoms,21,22 yet they still experience a significant decline in functional performance and quality of life.22 Also, some patients with PAD reduce their activity to avoid claudication symptoms, thus patient-reported improvement or stabilization may mask PAD- associated functional decline. Therefore, rather than claudication symptom monitoring and questionnaires, validated measures such as the 6-Minute Walk Test (6MWT) are better at objectively demonstrating disease severity, functional decline, and predicting mortality.21,23,24 In patients with PAD, the disease severity is reliably related to 6MWT results,5,25,26 walking velocity,5,26 and exercise capacity.27 In addition, functional decline as measured by 6MWT, four-meter walking velocity, repeated chair rises, standing balance, and Short Physical Performance Battery, can predict future mobility loss and mortality in patients with PAD.6 While these established physical measurements, such as walk tests, are good static measurements of functional ability, they can be cumbersome to test, and they cannot quantify functioning over time and in different circumstances, such as recent surgery or hospitalization. For example, the 6MWT requires a large enough space for a patient to walk, unencumbered, for 6 minutes, while being supervised by clinic personnel. Walk tests are also difficult to extrapolate into real world settings; McDermott et al. found that functional performance was more strongly associated with physical activity levels during daily life than with treadmill-based tests.28 These measures therefore fail to capture PAD’s more global effect on patients’ mobility and mortality.
Instead of a traditional physical measurement, our study used life-space mobility, which is easy and quick to obtain, and it measures both distance and frequency of mobility as older adults move through different environments and communities. Life-space mobility has also been found to reflect not only physical function and performance, but also sociodemographic and neuropsychological factors.12 As older adults move through different life-space levels, they not only cover distance, but engage in social interactions and activities that better describe overall function and health. In Boyle et al.’s study, the association between life-space mobility restriction and mortality persisted even after performance-based measures for physical function were controlled for, suggesting that life-space mobility is more than just a measure of physical function and walking ability, and may encompass psychosocial factors or personality traits.29
Life-space mobility has previously been validated in other populations as well. Kennedy et al. showed that in the UAB Study of Aging, a 10-point decrease in life-space mobility over 6 months was associated with 72% increased odds of mortality,13 and over 8 years follow-up, older adults with life-space mobility restriction (confined to the immediate home environment), were 1.6 times more likely to die than those who traveled out of town.29 Our findings expand this to include participants with and without PAD. In unadjusted hazard models, we found that those with the combination of PAD and life-space restriction had the highest risk of mortality. After multivariable adjustment, the magnitude of the association among those with both PAD and LSR was reduced, which may be due to the relative smaller number of participants in the PAD/LSR category. In other studies, rapid life-space mobility decline was associated with unintentional weight loss; and in participants with chronic kidney disease, it was associated with a reduced estimated glomerular filtration rate.16,30 Though PAD is commonly associated with many comorbidities that also increase functional decline and mortality rates, PAD is known to be an independent risk factor for mortality.2 We were also able to demonstrate that life-space mobility can measure function and mobility decline over time in PAD participants over and above the expected age-related decline. We further showed that the life-space mobility restriction in participants with PAD increases risk of mortality two-fold compared to those without PAD and life-space mobility restriction. Both presence of PAD and life-space mobility restriction had a higher risk of mortality (HR 2.0) compared to presence of PAD alone (HR 1.5) in adjusted models. In a chronic, disabling disease such as PAD, life-space mobility may be a useful tool to predict both short- and long-term mortality.
Life-space mobility restriction probably portends higher mortality in PAD compared to walking ability alone due to a complex interplay of factors such as psychosocial interactions, functional dependence, and loss of muscle mass, of which the additive effects likely increase mortality. For example, in patients with PAD, depressive symptoms are also associated with a decline in functional performance.31 Furthermore, recent data shows PAD is associated with comorbidities like depression that increase the risk of limb loss.32 Social participation is also important for physical performance in older adults, and was found to play a key role in delaying mobility disability with physical activity.33 Functional dependence, inability to perform self-care, and decreased muscle mass are associated with increased mortality in older adults with chronic disease.34–37 Within the PAD population, these risk factors for mortality are all likely intertwined as chronic PAD is associated with decreased mobility and therefore also associated with increased loss of muscle mass and functional dependence, more so than other chronic disease.38 The association between PAD and life-space mobility decline therefore helps demonstrate the broad pathway toward increased mortality in an aging population, and emphasizes the need for a more global understanding of each patient’s walking restrictions, functional decline, and quality of life in PAD.
There are several ways that life-space mobility could be used to improve care for older adults with PAD. First, routine measurement of life-space may be useful for guiding PAD treatment decisions (e.g., medical versus surgical) and monitoring response to therapy. Life-space mobility has been previously used to characterize post-surgical improvement.14 In patients with PAD, it is known that supervised exercise training can improve walking and functional performance,39 and this would likely be reflected in a life-space mobility score. Since meaningful improvement in walking performance may reflect life-space mobility changes, there is potential for improved quality of life and patient-reported outcomes. Medical and surgical treatments also improve walking ability. Therefore, future studies may benefit from determining the effect of medical or surgical PAD management on life-space mobility. Also, life-space mobility may be able to provide important prognostic information about mortality and incident functional impairment. This information could help risk-stratify patients, as well as facilitate shared-decision making discussions and advanced care planning.
Our study limitations are the same as others who have used the UAB Study of Aging. The population sampled in this study were older adults from five central Alabama counties, and therefore may not be generalizable to the entire country. The centralized study population did, however, allow for longitudinal participant follow-up and multiple life-space mobility measurements, thus we were able to trend mobility over time. Though this study relied on self-reported PAD, which could lead to some misclassification, chart review by the original investigators was done to support PAD diagnosis. This may have led to either over- or under-reporting PAD prevalence, thus these findings may need to be replicated in studies that include more objective PAD measures. Older adults with PAD and life-space restriction may have been less likely to participate in the UAB Study of Aging, resulting in a smaller number of participants in that category. This may have limited our ability to accurately estimate hazard ratios for mortality in the multivariable adjusted model for that group. We were able to adjust our multivariable models for gout, arthritis, and MMSE score to represent other comorbid conditions that could lead to decreased mobility, however did not have access to other causes of decreased mobility such as peripheral neuropathy; visual, auditory, or balance deficits; or vertigo. Also, incident PAD was not assessed during the study period, so some participants classified as non-PAD could have developed PAD over the course of the study and not been detected in the analysis; however this would be expected to bias the findings toward the null. Lastly, we do not have information on the severity of PAD or the interventions for PAD, thus cannot comment on impact of PAD treatment on life-space mobility restriction.
CONCLUSION
PAD was associated with an accelerated life-space mobility decline over time, and together with PAD, life-space mobility restriction was associated with a higher mortality rate. Life-space mobility may allow for more comprehensive study of the PAD population, and identify important quality of life/patient-reported information not already captured by traditional measures of walking performance. Further study is needed to confirm these findings in other cohorts and identify the causative factors associated with life-space mobility decline in this population. A better mechanistic understanding of the association between PAD severity/progression and life-space mobility would help us evaluate whether PAD treatment can alleviate life-space mobility, and whether that improvement can lead to increased longevity.
Supplementary Material
Type of Research:
Secondary analysis of a prospective cohort study (University of Alabama at Birmingham Study of Aging).
Key Findings:
Older adults with PAD declined more rapidly in life-space mobility compared to those without PAD. After five years, model-adjusted life-space mobility (95% CI) was 48.1 (43.5, 52.7) and 52.4 (50.9–53.8), among those with/without PAD, respectively, corresponding to a restriction in life-space mobility at the level of one’s neighborhood.
Take Home Message:
The presence of PAD is associated with significant decline in life-space mobility among community-dwelling older adults.
Acknowledgements:
Support was provided by the Atlanta Clinical and Translational Science Institute and the Department of Health and Human Services of the National Institutes of Health under Award number R03-AG050930-02 (Shipra Arya). Support was also provided by the US Department of Veterans Affairs; I01HX002704 (C. Barrett Bowling) and the National Heart, Lung, and Blood Institute; R01HL133618 (C. Barrett Bowling). This content is solely the responsibility of the authors and does not necessarily represent the official views of the Atlanta Clinical and Translational Science Institute, the National Institutes of Health, or the US Department of Veterans Affairs. No sponsor had any involvement in the study design, manuscript writing, or decision to submit the manuscript for publication.
Footnotes
Publisher's Disclaimer: This is a PDF file of an unedited manuscript that has been accepted for publication. As a service to our customers we are providing this early version of the manuscript. The manuscript will undergo copyediting, typesetting, and review of the resulting proof before it is published in its final form. Please note that during the production process errors may be discovered which could affect the content, and all legal disclaimers that apply to the journal pertain.
REFERENCES
- 1.Allison MA, Ho E, Denenberg JO, Langer RD, Newman AB, Fabsitz RR, et al. Ethnic-specific prevalence of peripheral arterial disease in the United States. Am J Prev Med. 2007;32(4):328–33. [DOI] [PubMed] [Google Scholar]
- 2.Criqui MH, Aboyans V. Epidemiology of peripheral artery disease. Circ Res. 2015;116(9):1509–26. [DOI] [PubMed] [Google Scholar]
- 3.McDermott MM, Liu K, Guralnik JM, Martin GJ, Criqui MH, Greenland P. Measurement of walking endurance and walking velocity with questionnaire: validation of the walking impairment questionnaire in men and women with peripheral arterial disease. J Vasc Surg. 1998;28(6):1072–81. [DOI] [PubMed] [Google Scholar]
- 4.Myers SA, Johanning JM, Stergiou N, Lynch TG, Longo GM, Pipinos II. Claudication distances and the Walking Impairment Questionnaire best describe the ambulatory limitations in patients with symptomatic peripheral arterial disease. J Vasc Surg. 2008;47(3):550–5. [DOI] [PubMed] [Google Scholar]
- 5.McDermott MM, Liu K, Greenland P, Guralnik JM, Criqui MH, Chan C, et al. Functional decline in peripheral arterial disease: associations with the ankle brachial index and leg symptoms. JAMA. 2004;292(4):453–61. [DOI] [PubMed] [Google Scholar]
- 6.McDermott MM, Liu K, Ferrucci L, Tian L, Guralnik JM, Liao Y, et al. Decline in functional performance predicts later increased mobility loss and mortality in peripheral arterial disease. J Am Coll Cardiol. 2011;57(8):962–70. [DOI] [PMC free article] [PubMed] [Google Scholar]
- 7.Garg PK, Liu K, Tian L, Guralnik JM, Ferrucci L, Criqui MH, et al. Physical activity during daily life and functional decline in peripheral arterial disease. Circulation. 2009;119(2):251–60. [DOI] [PMC free article] [PubMed] [Google Scholar]
- 8.Kuo HK, Yu YH. The relation of peripheral arterial disease to leg force, gait speed, and functional dependence among older adults. J Gerontol A Biol Sci Med Sci. 2008;63(4):384–90. [DOI] [PubMed] [Google Scholar]
- 9.Guralnik JM, Ferrucci L, Simonsick EM, Salive ME, Wallace RB. Lower-extremity function in persons over the age of 70 years as a predictor of subsequent disability. N Engl J Med. 1995;332(9):556–61. [DOI] [PMC free article] [PubMed] [Google Scholar]
- 10.Coylewright M, Palmer R, O’Neill ES, Robb JF, Fried TR. Patient-defined goals for the treatment of severe aortic stenosis: a qualitative analysis. Health Expect. 2016;19(5):1036–43. [DOI] [PMC free article] [PubMed] [Google Scholar]
- 11.Baker PS, Bodner EV, Allman RM. Measuring life-space mobility in community-dwelling older adults. J Am Geriatr Soc. 2003;51(11):1610–4. [DOI] [PubMed] [Google Scholar]
- 12.Peel C, Sawyer Baker P, Roth DL, Brown CJ, Brodner EV, Allman RM. Assessing mobility in older adults: the UAB Study of Aging Life-Space Assessment. Phys Ther. 2005;85(10):1008–119. [PubMed] [Google Scholar]
- 13.Kennedy RE, Sawyer P, Williams CP, Lo AX, Ritchie CS, Roth DL, et al. Life-Space Mobility Change Predicts 6-Month Mortality. J Am Geriatr Soc. 2017;65(4):833–8. [DOI] [PMC free article] [PubMed] [Google Scholar]
- 14.Brown CJ, Roth DL, Allman RM, Sawyer P, Ritchie CS, Roseman JM. Trajectories of life-space mobility after hospitalization. Ann Intern Med. 2009;150(6):372–8. [DOI] [PMC free article] [PubMed] [Google Scholar]
- 15.Sawyer P, Allman R. Resilience in mobility in the context of chronic disease and aging: Cross-sectional and prospective findings from the University of Alabama at Birmingham (UAB) study of aging. New Frontiers in Resilient Aging: Life-Strengths and Well-Being in Late Life. 2010:310–39. [Google Scholar]
- 16.Bowling CB, Muntner P, Sawyer P, Sanders PW, Kutner N, Kennedy R, et al. Community mobility among older adults with reduced kidney function: a study of life-space. Am J Kidney Dis. 2014;63(3):429–36. [DOI] [PMC free article] [PubMed] [Google Scholar]
- 17.Allman R, Sawyer P, Roseman JM. The UAB Study of Aging: background and prospects for insights into life-space mobility among older African-Americans and Whites in rural and urban settings. Aging Health. 2006;2(3):417–28. [Google Scholar]
- 18.Folstein MF, Folstein SE, McHugh PR. “Mini-mental state”. A practical method for grading the cognitive state of patients for the clinician. J Psychiatr Res. 1975;12(3):189–98. [DOI] [PubMed] [Google Scholar]
- 19.Sawyer P, Allman R. Resilience in mobility in the context of chronic disease and aging In: Fry P, Keyes C, editors. New Frontiers in Resilient Aging: Life-Strengths and Well-Being in Late Life. Cambridge: Cambridge University Press; 2010. p. 310–39. [Google Scholar]
- 20.Kennedy RE, Almutairi M, Williams CP, Sawyer P, Allman RM, Brown CJ. Determination of the Minimal Important Change in the Life-Space Assessment. J Am Geriatr Soc. 2019;67(3):565–9. [DOI] [PubMed] [Google Scholar]
- 21.Schorr EN, Treat-Jacobson D. Methods of symptom evaluation and their impact on peripheral artery disease (PAD) symptom prevalence: a review. Vasc Med. 2013;18(2):95–111. [DOI] [PMC free article] [PubMed] [Google Scholar]
- 22.McDermott MM, Guralnik JM, Ferrucci L, Tian L, Liu K, Liao Y, et al. Asymptomatic peripheral arterial disease is associated with more adverse lower extremity characteristics than intermittent claudication. Circulation. 2008;117(19):2484–91. [DOI] [PMC free article] [PubMed] [Google Scholar]
- 23.McDermott MM, Greenland P, Liu K, Guralnik JM, Criqui MH, Dolan NC, et al. Leg symptoms in peripheral arterial disease: associated clinical characteristics and functional impairment. JAMA. 2001;286(13):1599–606. [DOI] [PubMed] [Google Scholar]
- 24.Jain A, Liu K, Ferrucci L, Criqui MH, Tian L, Guralnik JM, et al. The Walking Impairment Questionnaire stair-climbing score predicts mortality in men and women with peripheral arterial disease. J Vasc Surg. 2012;55(6):1662–73 e2. [DOI] [PMC free article] [PubMed] [Google Scholar]
- 25.Montgomery PS, Gardner AW. The clinical utility of a six-minute walk test in peripheral arterial occlusive disease patients. J Am Geriatr Soc. 1998;46(6):706–11. [DOI] [PubMed] [Google Scholar]
- 26.Morris DR, Rodriguez AJ, Moxon JV, Cunningham MA, McDermott MM, Myers J, et al. Association of lower extremity performance with cardiovascular and all-cause mortality in patients with peripheral artery disease: a systematic review and meta-analysis. J Am Heart Assoc. 2014;3(4). [DOI] [PMC free article] [PubMed] [Google Scholar]
- 27.Leeper NJ, Myers J, Zhou M, Nead KT, Syed A, Kojima Y, et al. Exercise capacity is the strongest predictor of mortality in patients with peripheral arterial disease. J Vasc Surg. 2013;57(3):728–33. [DOI] [PMC free article] [PubMed] [Google Scholar]
- 28.McDermott MM, Ades PA, Dyer A, Guralnik JM, Kibbe M, Criqui MH. Corridor-based functional performance measures correlate better with physical activity during daily life than treadmill measures in persons with peripheral arterial disease. J Vasc Surg. 2008;48(5):1231–7, 7 e1. [DOI] [PMC free article] [PubMed] [Google Scholar]
- 29.Boyle PA, Buchman AS, Barnes LL, James BD, Bennett DA. Association between life space and risk of mortality in advanced age. J Am Geriatr Soc. 2010;58(10):1925–30. [DOI] [PMC free article] [PubMed] [Google Scholar]
- 30.Ritchie CS, Locher JL, Roth DL, McVie T, Sawyer P, Allman R. Unintentional weight loss predicts decline in activities of daily living function and life-space mobility over 4 years among community-dwelling older adults. J Gerontol A Biol Sci Med Sci. 2008;63(1):67–75. [DOI] [PubMed] [Google Scholar]
- 31.Ruo B, Liu K, Tian L, Tan J, Ferrucci L, Guralnik JM, et al. Persistent depressive symptoms and functional decline among patients with peripheral arterial disease. Psychosom Med. 2007;69(5):415–24. [DOI] [PMC free article] [PubMed] [Google Scholar]
- 32.Arya S, Lee S, Zahner GJ, Cohen BE, Hiramoto J, Wolkowitz OM, et al. The association of comorbid depression with mortality and amputation in veterans with peripheral artery disease. J Vasc Surg. 2018;68(2):536–45 e2. [DOI] [PMC free article] [PubMed] [Google Scholar]
- 33.Corbett DB, Rejeski WJ, Tudor-Locke C, Glynn NW, Kritchevsky SB, McDermott MM, et al. Social Participation Modifies the Effect of a Structured Physical Activity Program on Major Mobility Disability Among Older Adults: Results From the LIFE Study. J Gerontol B Psychol Sci Soc Sci. 2018;73(8):1501–13. [DOI] [PMC free article] [PubMed] [Google Scholar]
- 34.Jassal SV, Karaboyas A, Comment LA, Bieber BA, Morgenstern H, Sen A, et al. Functional Dependence and Mortality in the International Dialysis Outcomes and Practice Patterns Study (DOPPS). Am J Kidney Dis. 2016;67(2):283–92. [DOI] [PMC free article] [PubMed] [Google Scholar]
- 35.Covinsky KE, Palmer RM, Counsell SR, Pine ZM, Walter LC, Chren M. Functional Status Before Hospitalization in Acutely Ill Older Adults: Validity and Clinical Importance of Retrospective Reports. J Am Geriatr Soc. 2000;48:164–9. [DOI] [PubMed] [Google Scholar]
- 36.Androga L, Sharma D, Amodu A, Abramowitz MK. Sarcopenia, obesity, and mortality in US adults with and without chronic kidney disease. Kidney Int Rep. 2017;2(2):201–11. [DOI] [PMC free article] [PubMed] [Google Scholar]
- 37.Hale AL, Twomey K, Ewing JA, Langan EM 3rd, Cull DL, Gray BH. Impact of sarcopenia on long-term mortality following endovascular aneurysm repair. Vasc Med. 2016;21(3):217–22. [DOI] [PubMed] [Google Scholar]
- 38.Matsubara Y, Matsumoto T, Aoyagi Y, Tanaka S, Okadome J, Morisaki K, et al. Sarcopenia is a prognostic factor for overall survival in patients with critical limb ischemia. J Vasc Surg. 2015;61(4):945–50. [DOI] [PubMed] [Google Scholar]
- 39.McDermott MM, Ades P, Guralnik JM, Dyer A, Ferrucci L, Liu K, et al. Treadmill exercise and resistance training in patients with peripheral arterial disease with and without intermittent claudication: a randomized controlled trial. JAMA. 2009;301(2):165–74. [DOI] [PMC free article] [PubMed] [Google Scholar]
Associated Data
This section collects any data citations, data availability statements, or supplementary materials included in this article.