

Supplemental Digital Content is available in the text.
Keywords: Activities of Daily Living, Healthy Longevity, Instrumental Activities of Daily Living, Residential Greenness
Abstract
Background:
We aimed to explore whether higher levels of residential greenness were related to lower odds of disabilities in activities of daily living (ADL) and instrumental activities of daily living (IADL).
Methods:
We included older adults 65 years of age or older from the Chinese Longitudinal Healthy Longevity Survey. Our exposure was Normalized Difference Vegetation Index in 500 m radius around residence. Our outcome was ADL and IADL. We used binary logistic regression and mixed-effects logistic regression to estimate the odds of ADL and IADL disabilities.
Results:
A total of 36,803 and 32,316 participants were included for the analysis of ADL and IADL, with 71.6% free of ADL disability and 47.3% free of IADL disability. In the logistic regression model, compared with the participants living in the lowest quartile of residential greenness, those in the highest quartile had a 28% (odds ratio [OR] = 0.72; 95% confidence interval [CI] = 0.65, 0.79) lower odds of ADL disability and a 14% (OR = 0.86; 95% CI = 0.77, 0.95) lower odds of IADL disability. A similar association was found in the mixed-effects logistic regression models. During the follow-up period, 5,004 and 4,880 healthy participants developed ADL and IADL disabilities. Per 0.1-unit increase in baseline annual average Normalized Difference Vegetation Index (NDVI) was related to an OR of 0.95 of developing ADL disability (95% CI = 0.93, 0.98) and IADL disability (95% CI = 0.91, 0.98).
Conclusions:
Our study suggests that increasing green space is associated with lower odds of ADL and IADL disabilities, which may reduce caregiver burden of long-term care for Chinese older adults.
What this study adds
More green space has been linked to better physical health. But there is no evidence on whether higher levels of residential greenness are associated with lower odds of activities of daily living (ADL) and instrumental activities of daily living (IADL) disabilities. To address this evidence gap, our study conducted cross-sectional and longitudinal analysis among 36,803 and 32,316 Chinese older adults, separately. We found that the highest quartile compared with the lowest quartile of residential greenness was associated with a 28% lower odds of ADL disability and 14% lower odds of IADL disability. Our study suggests that more green space might prevent or delay the onset of ADL and IADL disabilities, which has significant implications for reducing caregiver burden of long-term care for Chinese older adults.
Introduction
Declines in vital capacity, muscular strength, and flexibility are more prevalent among older adults. These physiologic changes can cause assistance in performing activities of daily living (ADL) and instrumental activities of daily living (IADL).1 ADL consist of basic tasks in daily life: eating, bathing, dressing, toileting, transferring, and continence, reflecting essential self-care capacity.2 IADL indicate independent skills in a given environment, like shopping, cooking, and taking public transportation. ADL disability (unable to perform one or more of tasks) is more severe than IADL disability and often occurs at a more advanced age.3 Prior estimates of the prevalence of ADL disability among older adults 65 years of age or older varied regionally: 6.4%–18.6% in the United States, 26.6% in Spain, 1.6% in Hong Kong,4–6 which were less prevalent than IADL disability.7 ADL and IADL disabilities were linked to higher rates of mortality and comorbidities, more health service utilization, and long-term care.8–10 Furthermore, up to 20% of older adults with ADL disability reported unmet need for ADL assistance around the globe.11–13
A number of studies reported benefits of residential greenness on lower mortality rate.14–16 To our knowledge, there is no study on the effects of residential greenness on ADL and IADL disabilities among older adults. We hypothesized that higher levels of residential greenness were associated with lower odds of ADL and IADL disabilities and might prevent the onset of ADL and IADL disabilities. The potential mechanisms of health benefits of residential greenness on ADL and IADL could be that green space promotes physical activity and social engagement,17,18 which have been liked to better performance in ADL and IADL.1,19–21
China has the largest number of older population 65 years of age or older, about 148 million in 2017, which is currently under a rapid increase.22 A cross-sectional study in China showed that about 12.1%–16.8% of older adults 80 years of age or older needed assistance in ADL. However, more than half of them reported unmet needs for assistance in ADL, with higher vulnerabilities observed in rural areas.23 The prevalence of IADL disability was higher, up to 30.1% among older adults 65 years of age or older in Shanghai, China.24 We aimed to generate evidence on whether high levels of residential greenness could reduce odds of ADL and IADL disabilities among older adults, using the Chinese Longitudinal Healthy Longevity Survey (CLHLS).
Methods
Study population
Established in 1998, the CLHLS aimed to investigate the determinants of healthy longevity among Chinese older adults. The CLHLS used a multistage, stratified sampling design to recruit the participants from 631 randomly selected cities and counties, 22 out of 31 provinces in China. The sample sites represent about 85% of the Chinese population. This survey included only the participants 80 years of age or older in 1998 and 2000 and expanded to the participants 65 years of age or older since 2002. The CLHLS conducted follow-up surveys among the survivors and recruited new participants in 2000, 2002, 2005, 2008, 2011, 2014, and 2018. Extensive data on determinants of health have been collected, including demographic and socioeconomic characteristics, lifestyle, ADL, IADL, cognitive function, psychological status, and chronic diseases. Extra data regarding causes of death, health service utilization, and health status before death were collected from the family members of deceased participants. More details on study design and data quality could be found elsewhere.25
Our study utilized 2000, 2002, 2005, 2008, and 2011 waves of the CLHLS for the analysis of Normalized Difference Vegetation Index (NDVI) and ADL. The total sample size of five pooled waves consisted of 39,225 participants. We excluded the participants who were missing NDVI values (n = 353), were younger than 65 years (n = 545), and were missing particulate matter (PM)2.5 values (n = 1,524). We included 36,803 participants for the cross-sectional analysis. We additionally excluded those who were lost follow-up after the baseline survey (n = 5,766) and died before the follow-up survey (n = 11,961) for the longitudinal analysis (n = 19,076).
Because the variables used for coding IADL were available since 2002, we used 2002, 2005, 2008, and 2011 wave, including 34,342 participants, for the analysis of NDVI and IADL. We excluded the participants who were missing NDVI values (n = 17), were younger than 65 years (n = 545), and were missing PM2.5 values (n = 1,464). We included 32,316 participants for the cross-sectional analysis. We additionally excluded those who were lost follow-up after the baseline survey (n = 5,062) and died before the follow-up survey (n = 11,598) for the longitudinal analysis (n = 15,656).
Greenness assessment
We calculated NDVI, a satellite image-based vegetation index, to reflect residential greenness. The plants absorb red visible light during the process of photosynthesis, while leaves reflect near-infrared light to scatter extra heat.26 NDVI is equal to the ratio of the difference between the near-infrared region and red visible reflectance to the sum of these two measures. NDVI ranges from −1.0 to 1.0, with larger values indicating more green space.27,28
Based on participants’ residential addresses, we obtained NDVI values from the Moderate-Resolution Imaging Spectro-Radiometer (MODIS) in the National Aeronautics and Space Administration’s Terra Satellite.29,30 Due to the temporal resolution of 16 days at MODIS, we measured two NDVI values for January, April, July, and October from 2000 to 2014 to reflect seasonal variation in greenness.
We calculated baseline NDVI in the 500 m radius around residential addresses of participants. Baseline NDVI was the annual average NDVI value at the year of study entry. In addition, we categorized baseline annual average NDVI into quartiles and calculated their 0.1 unit of values.
ADL and IADL assessment
ADL assessed self-care capacity by using six self-reported questions: “Do you need assistance in bathing/dressing/toileting/transferring/eating/continence?”31 ADL had a continuous scale of zero to six with each question scored zero (without assistance) or one (with assistance). Higher ADL scores indicated more ADL disabilities. In our analysis, we dichotomized ADL scores to zero, defined as free of ADL disability, as the reference group, and one to six, defined as with ADL disability.
IADL assessed independent living skills including eight activities: visiting neighbors, shopping, cooking, washing clothes, walking 1 km, lifting 5 kg, crouching and standing up three times, and taking public transportation.31 We scored each activity zero (able to do without help) or one (need help). Ranging from zero to eight, we dichotomized IADL scores to zero, defined as free of IADL disability, as the reference group, and one to eight, defined as with IADL disability.
Covariates
We measured a range of baseline characteristics, including age, sex, ethnicity, marital status, geographic region, urban/rural residence, education, occupation, financial support, social and leisure activity, smoking status, drinking status, physical activity, annual average PM2.5, and Mini-Mental State Examination (MMSE). We also generated a variable of time to reflect the number of years for each follow-up survey since entering the cohort for the longitudinal analysis.
Age was the difference between the interview dates and birth dates.25 We dichotomized sex to males and females. We divided ethnicity into Han Chinese and ethnic minorities (Hui, Korean, Manchurian, Mongolian, Yao, Zhuang, and others). We categorized marital status into married and not married at the time of interview (separated, or divorced, or widowed, or never married). We categorized the participants into seven geographical regions based on their residential addresses: Central China (Henan, Hubei, and Hunan Provinces), Eastern China (Anhui, Fujian, Jiangxi, Jiangsu, Shandong, Shanghai, and Zhejiang Provinces), Northeastern China (Heilongjiang, Jilin, and Liaoning Provinces), Northern China (Hebei, Shanxi, and Tianjin Provinces), Northwestern China (Shaanxi Province), Southern China (Guangdong, Guangxi, and Hainan Provinces), and Southwestern China (Chongqing and Sichuan Provinces). Residence was dichotomized to urban and rural area.
We divided education into groups of formal education (≥1-year schooling) and no formal education. We dichotomized occupation to professional work (professional and technical personnel, government and management) and nonprofessional work (agriculture, fishing, service, industry, and housework). We assessed financial support depending on whether participants relied on their own work and retirement wage (defined as financial independence) or received financial assistance from other family members (defined as financial dependence). We took into consideration seven activities into social and leisure activity index, including gardening, personal outdoor activities excluding exercise, raising poultry or pets, reading, playing cards or mahjong, listening to the radio or watching TV, and participating in organized social activities, with each scored zero or one.32 We evaluated smoking status by asking “smoke or not at present.” We evaluated drinking status and physical activity using similar questions. We used the adapted Chinese version of MMSE to reflect cognitive function. MMSE scores ranged from 0 to 30, with higher scores indicating better cognitive function. Based on participants’ residential addresses, we obtained the estimates of ground-level concentrations of PM2.5 from Atmospheric Composition Analysis Group.33 We used annual average PM2.5 at baseline year to indicate air pollution levels.
Statistical analysis
We used binary logistic regression and mixed-effects logistic regression models to examine the associations between residential greenness and ADL disability, adjusted for age, sex, ethnicity, marital status, geographic region, urban/rural residence, education, occupation, financial support, social and leisure activity, smoking status, drinking status, physical activity, annual average PM2.5, and MMSE at baseline. Firstly, we used binary logistic regression models to assess the association between annual average NDVI and ADL disability at baseline. We stratified the analysis by age, sex, marital status, urban/rural residence, education, occupation, financial support, social and leisure activity index, smoking status, drinking status, and physical activity. Secondly, we applied mixed-effects logistic regression models to explore the relationship between annual average NDVI at baseline and ADL disability among the participants with follow-up surveys. Annual average NDVI was measured at baseline. The outcome ADL disability was repeatedly measured at baseline and subsequent follow-up surveys. The regression models were also adjusted for the variable of time elapsed. In addition, about half of the participants died or were lost before the follow-up survey. We conducted a sensitivity analysis on the participants with/without follow-up surveys using the binary logistic regression, to see how possible informative censoring may influence the association between residential greenness and ADL disability. Furthermore, we used binary logistic regression to test whether higher levels of annual average NDVI at baseline were related to lower odds of developing ADL disability among healthy participants who were free of ADL disability at baseline. We stratified the analysis by age group. We used the same statistical analysis to explore the association between NDVI and IADL disability.
We calculated odds ratios (ORs) and 95% confidence intervals (CIs) to estimate the magnitude of the associations. We reported the results of quartiles and per 0.1-unit increase in baseline annual average NDVI. We plotted the cubic splines with three knots to examine nonlinearity of the associations. We used STATA 14.0 (College Station, TX) for statistical analysis.
Ethical approval
The CLHLS study was approved by the Institutional Review Board, Duke University (Pro00062871) and the Biomedical Ethics Committee, Peking University (IRB00001052-13074). All participants signed a written informed consent.
Results
Table 1 describes the baseline characteristics of CLHLS participants. Participants (36,803) were included for the analysis of NDVI and ADL disabilities. The mean age was 88 years (SD = 11.5 years), 41.1% were male, and 76.1% lived in rural areas. The mean baseline NDVI was 0.40 (SD = 0.15). About 71.6% of participants were free of ADL disability at baseline.
Table 1.
Baseline characteristics of CLHLS participants
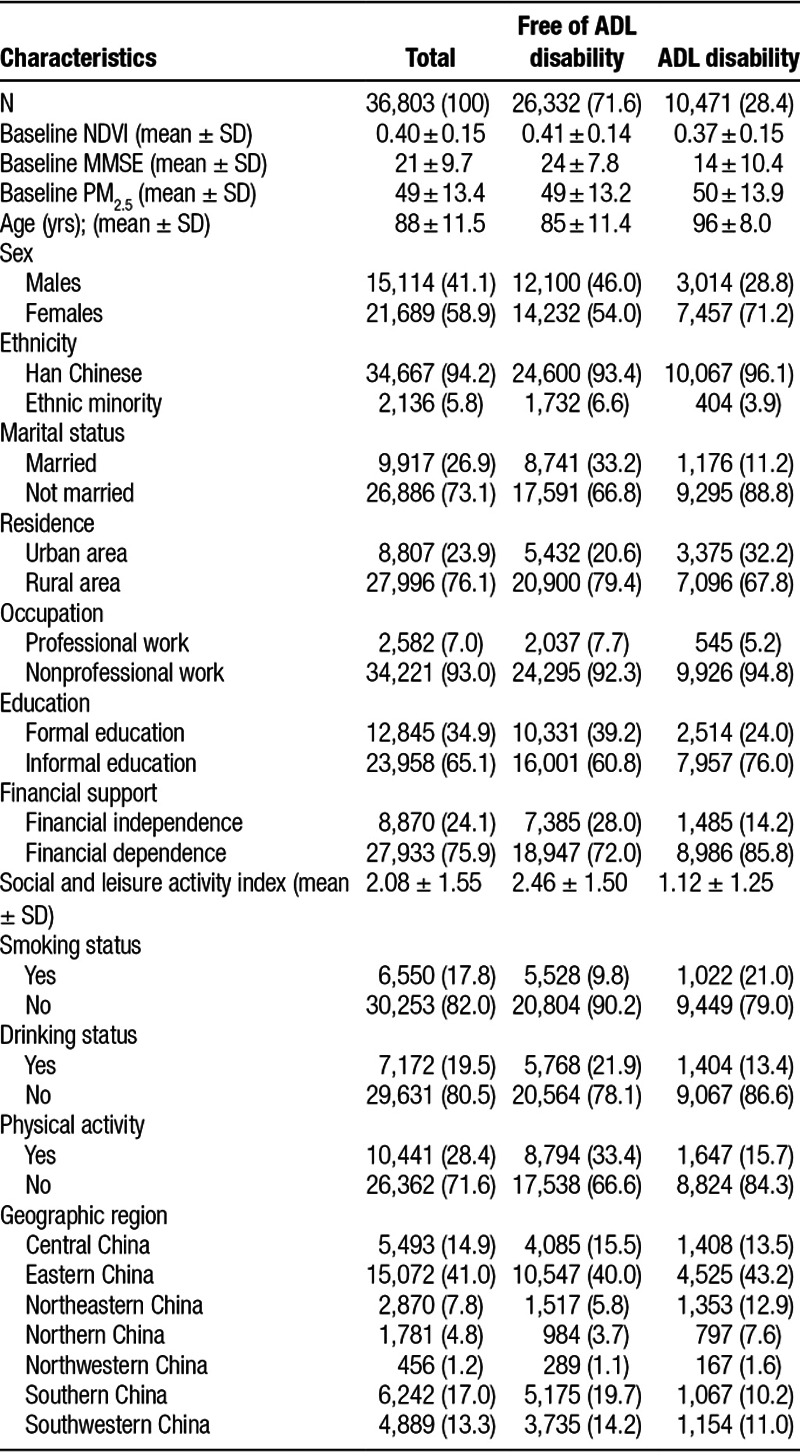
Table 2 shows ORs and 95% CIs for baseline annual average NDVI, ADL, and IADL disabilities. In the fully adjusted logistic regression, compared with the participants living in the lowest quartile of residential greenness, those in the highest quartile had a 28% (OR = 0.72; 95% CI = 0.65, 0.79) lower odds of ADL disability at baseline. Per 1-year increase in age was related to a 7% increase in ADL disability (OR = 1.07; 95% CI = 1.06, 1.07), indicating that living in the highest quartile of residential greenness has a protective effect size equivalent to roughly 4-year reduction in age, when comparing the ORs. Per 0.1-unit increase in baseline annual average NDVI was associated with an OR of 0.92 (95% CI = 0.90, 0.94) of ADL disability at baseline. The fully adjusted mixed-effects logistic regression showed the similar association (the highest quartile of NDVI: OR = 0.72; 95% CI = 0.64, 0.82; 0.1-unit of NDVI: OR = 0.92; 95% CI = 0.89, 0.95). Compare to those with follow-up surveys, the participants died or were lost before the follow-up survey were much older (92 vs. 84), had more ADL disability (41.3% vs. 16.5%), and lower MMSE scores (18 vs. 23) at baseline (Supplemental Table 1, http://links.lww.com/EE/A57). Our sensitivity analysis found a similar association between baseline annual average NDVI and ADL disabilities among those without follow-up surveys (0.1-unit NDVI: OR = 0.91; 95% CI = 0.88, 0.94). Cubic splines (Figure 1) also illustrate consistent findings with the cross-sectional analysis and longitudinal analysis, indicating a linear relationship between baseline annual average NDVI and ADL disabilities. Additionally, we observed similar protective effects of baseline annual average NDVI on IADL disability (the highest quartile of NDVI in the fully adjusted logistic regression: OR = 0.86, 95% CI = 0.77, 0.95; the highest quartile of NDVI in the fully adjusted mixed-effect logistic regression: OR = 0.83, 95% CI = 0.75, 0.93). The association between baseline annual average NDVI and IADL disabilities among those without follow-up surveys was weak (0.1-unit NDVI: OR = 0.96; 95% CI = 0.93, 1.00).
Table 2.
Odds ratios and 95% CI for baseline annual average NDVI, ADL, and IADL disabilities
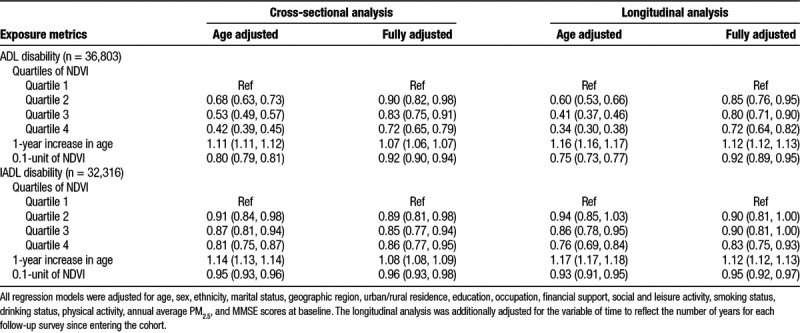
Figure 1.

Curve association between baseline annual average NDVI, ADL, and IADL disabilities. A, The cross-sectional analysis between baseline annual average NDVI and ADL disabilities. B, The longitudinal analysis between baseline annual average NDVI and ADL disabilities. C, The cross-sectional analysis between baseline annual average NDVI and IADL disabilities. D, The longitudinal analysis between baseline annual average NDVI and IADL disabilities.
Figure 2 reports the stratified analysis on per 0.1-unit increase in baseline annual average NDVI, ADL, and IADL disabilities. Slightly stronger protective effects on ADL disability were observed among the participants who were centenarians (100 years of age or older), females, not married, living in rural areas, had nonprofessional work, had no formal education, financial dependent, and not exercise. Additionally, the participants who lived in urban area, had formal education, no drink, and not exercise benefited more from residential greenness on IADL disability.
Figure 2.
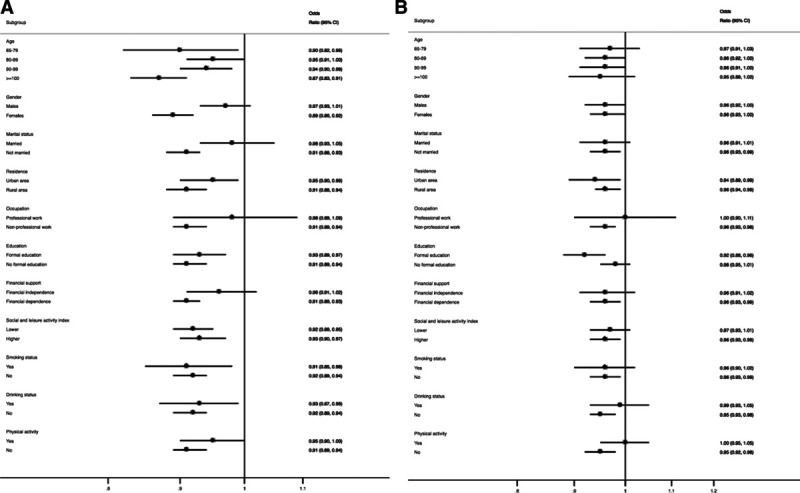
Stratified cross-sectional analysis for per 0.1-unit increase in baseline annual average NDVI, ADL, and IADL disabilities by subgroups. A, Stratified analysis on ADL disability. B, Stratified analysis on IADL disability. Note: All the stratified analysis were adjusted for age, sex, ethnicity, marital status, geographic region, urban/rural residence, education, occupation, financial support, social and leisure activity, smoking status, drinking status, physical activity, annual average PM2.5, and MMSE scores at baseline, except the stratified covariates.
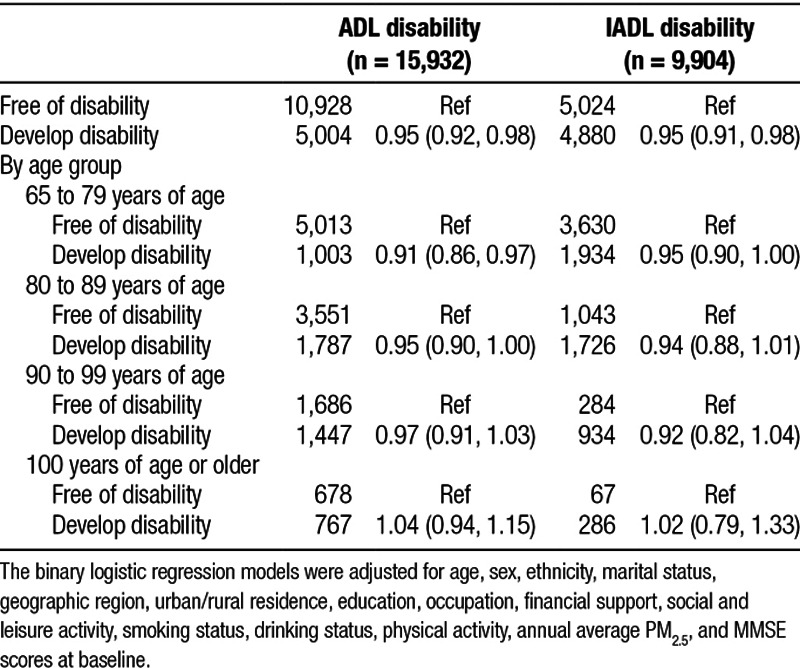
Table 3 presents ORs and 95% CI for per 0.1-unit increase in baseline annual average NDVI and odds of developing ADL and IADL disabilities among the healthy participants at baseline. During the follow-up surveys between 2000 and 2014, 5,004 out of 15,932 participants without ADL disability at baseline developed ADL disability. Per 0.1-unit increase in baseline annual average NDVI was related to an OR of 0.95 (95% CI = 0.92, 0.98) of developing ADL disability. The association was only statistically significant among the participants who were younger than 89 years old. In addition, from 2002 to 2014, 4,880 out of 9,904 participants without IADL disability at baseline developed IADL disability. Per 0.1-unit increase in baseline annual average NDVI was associated with a 5% (OR = 0.95; 95% CI = 0.91, 0.98) lower odds of developing IADL disability.
Table 3.
Odds ratios and 95% CI for per 0.1-unit increase in baseline annual average NDVI and development of ADL and IADL disabilities among healthy participants at baseline
Discussion
Our study found that the highest quartile of residential greenness was associated with a 28% lower odds of ADL disability and a 17% lower odds of IADL disability compared with the lowest quartile. Both the cross-sectional and longitudinal analyses showed consistent findings. Together with our previous study,34 these findings make health benefits of residential greenness more convincing. Our study may also provide evidence on the potential mechanisms of residential greenness and mortality.
We observed that the more social and leisure activity and physical activity were associated with lower odds of ADL and IADL disabilities, which could be the potential mechanisms according to prior findings.35–38 Physical activity has been widely used as the key intervention on physical function. Studies have been showed that increased physical activity could prevent mobility disability, slow down mobility decline, and improve ADL and IADL functions among older adults.1,39–41 But some studies reported no associations.42 The inconsistent evidence is probably due to the different measurement of physical activity or lack of control for the confounding variables. Furthermore, social support is the other potential mechanism. Residential greenness could provide a supportive environment for more social engagement. Independent of physical activity, social activity is associated with slower ADL and IADL decline, although socially active people tend to be more physically active.19,21,38,43,44 However, the relationship could be reversed because physical function is essential for physical activity and social activity. Overall, the relationship among physical activity, social activity, ADL disability, and IADL disability is unclear. Additionally, our study lacked information on the usage pattern of green space around participants’ residence. It is hard to illustrate the mechanisms mediating the residential greenness and ADL disability.
Our stratified analysis showed that the participants who were not married, lived in rural areas, had no informal education, had nonprofessional work, and were financially dependent had stronger protective effects of residential greenness on ADL disability. One potential reason is the difference in residential greenness by subgroups. For instance, in our study, baseline annual average NDVI in rural areas is higher than in urban area (0.45 vs. 0.24). The difference in health effects could also be caused by the difference in time spent in green space, access to health care, baseline health status, and socioeconomic status. Health effects of green space differed by socioeconomic status in our study are in line with prior studies. An observational study of 40 million population in the United Kingdom reported that income-related health inequalities were smaller in more green areas.45 Other studies reported stronger protective effects of green space among people with lower socioeconomic status.46–48 However, the Swiss National Cohort showed stronger protective effects among people with higher income.49 In addition, we observed stronger protective effects on IADL disability among those who were living in urban areas and with formal education. The difference in the stratified analysis between ADL and IADL disabilities may be explained by differed health effects by socioeconomic status and different mechanisms of protective effects.
There are several limitations to our study. Firstly, although NDVI reflects overall greenness, it could not indicate exposure to a specific type of vegetation. We also had no information on activity patterns of participants. How these differences could influence the association between residential greenness and ADL and IADL disabilities is unclear. Secondly, there may be concerns in informative censoring in the longitudinal analysis. Our mixed-effects logistic regression models only included the participants with follow-up surveys, consist of only about half of the total sample. Those without follow-up surveys who were excluded from the longitudinal analysis were more vulnerable. However, our sensitivity analysis reported similar protective effects on ADL and IADL disabilities, compared with the longitudinal analysis. Thirdly, reverse causation relationship among residential greenness, ADL disability, and IADL disability is possible. In our study, the older adults with ADL or IADL disability live in the less green area (baseline annual average NDVI: 0.37 vs. 0.41) than those without ADL or IADL disability at baseline. This indicates that older adults with ADL disability probably may be more likely to live in urban areas, where has more healthcare resources but less green space. But our analysis of baseline annual average NDVI and development of ADL disability among the healthy participants indicates that the potential reverse association shall not greatly bias the association between residential greenness and ADL disability. Additionally, socioeconomic status is unlikely to confound the association between residential greenness and ADL disability. Our study found that the older adults living in greener area have lower socioeconomic status.
Our study has several strengths. To our knowledge, this is the first study assessing the effects of residential greenness on ADL and IADL disabilities among older adults. The protective effects of residential greenness observed in our study add to the mechanism of residential greenness and overall mortality and also provide evidence for preventing ADL and IADL disabilities in further research. In addition, our study included a large size of nationally representative sample, from 22 provinces in Mainland, China. Furthermore, our study used both the cross-sectional and longitudinal designs, which showed consistent findings. We used aerial satellite-derived measurements, which take into consideration the seasonal variation of greenness, for the exposure assessment. This more objective measurement of greenness exposure by using NDVI and mixed analysis provided stronger evidence on the relationship among residential greenness, ADL disability, and IADL disability.
Conclusions
Our study showed that higher levels of residential greenness were associated with lower odds of ADL and IADL disabilities among older adults. These protective effects indicated that more green space might help prevent or delay the onset of ADL and IADL disabilities. Our findings have public health implications for reducing caregiver burden of long-term care for the large and ongoing increase group of Chinese older adults.
Acknowledgments
We would like to acknowledge Chen Bai, Chengcheng Qiu, Anran Tan, Jingyu Tong, and Longkai Zang for their contribution in geocoding residential addresses; Yinq-Rong Chern for NDVI data preparation.
Conflicts of interest statement
The authors declare that they have no conflicts of interest with regard to the content of this report.
This study was supported by Bill & Melinda Gates Foundation (Grant Number: OOP1148464), and NCI (Grant Number: R00 CA201542). The data analyzed in this paper were provided by the Chinese Longitudinal Healthy Longevity Study (CLHLS) which has been jointly supported by National Natural Sciences Foundation of China (71490732) and the National Key R&D Program of China (2018YFC2000400).
Data used in this study are available upon request from Center for Healthy Aging and Development Studies, National School of Development, Peking University. Computer code will be made available upon request.
Supplementary Material
Footnotes
Published online 30 August 2019
Sponsorships or competing interests that may be relevant to content are disclosed at the end of the article.
Supplemental digital content is available through direct URL citations in the HTML and PDF versions of this article (www.environepidem.com).
References
- 1.Chou CH, Hwang CL, Wu YT. Effect of exercise on physical function, daily living activities, and quality of life in the frail older adults: a meta-analysis. Arch Phys Med Rehabil 201293237–244 [DOI] [PubMed] [Google Scholar]
- 2.Covinsky KE, Palmer RM, Fortinsky RH, et al. Loss of independence in activities of daily living in older adults hospitalized with medical illnesses: increased vulnerability with age. J Am Geriatr Soc 200351451–458 [DOI] [PubMed] [Google Scholar]
- 3.Gobbens RJ. Associations of ADL and IADL disability with physical and mental dimensions of quality of life in people aged 75 years and older. PeerJ 20186e5425. [DOI] [PMC free article] [PubMed] [Google Scholar]
- 4.Freedman VA, Martin LG, Schoeni RF. Recent trends in disability and functioning among older adults in the United States: a systematic review. JAMA 20022883137–3146 [DOI] [PubMed] [Google Scholar]
- 5.Zunzunegui MV, Nunez O, Durban M, García de Yébenes MJ, Otero A. Decreasing prevalence of disability in activities of daily living, functional limitations and poor self-rated health: a 6-year follow-up study in Spain. Aging Clin Exp Res 200618352–358 [DOI] [PubMed] [Google Scholar]
- 6.Yu R, Wong M, Chang B, et al. Trends in activities of daily living disability in a large sample of community-dwelling Chinese older adults in Hong Kong: an age-period-cohort analysis. BMJ Open 20166e013259. [DOI] [PMC free article] [PubMed] [Google Scholar]
- 7.Chatterji S, Byles J, Cutler D, Seeman T, Verdes E. Health, functioning, and disability in older adults–present status and future implications. Lancet 2015385563–575 [DOI] [PMC free article] [PubMed] [Google Scholar]
- 8.Lane NE, Stukel TA, Boyd CM, Wodchis WP. Long-term care residents’ geriatric syndromes at admission and disablement over time: an observational cohort study. J Gerontol A Biol Sci Med Sci 201974917–923 [DOI] [PMC free article] [PubMed] [Google Scholar]
- 9.Sands LP, Wang Y, McCabe GP, Jennings K, Eng C, Covinsky KE. Rates of acute care admissions for frail older people living with met versus unmet activity of daily living needs. J Am Geriatr Soc 200654339–344 [DOI] [PubMed] [Google Scholar]
- 10.Murad K, Goff DC, Jr, Morgan TM, et al. Burden of comorbidities and functional and cognitive impairments in elderly patients at the initial diagnosis of heart failure and their impact on total mortality: the Cardiovascular Health Study. JACC Heart Fail 20153542–550 [DOI] [PMC free article] [PubMed] [Google Scholar]
- 11.Desai MM, Lentzner HR, Weeks JD. Unmet need for personal assistance with activities of daily living among older adults. Gerontologist 20014182–88 [DOI] [PubMed] [Google Scholar]
- 12.Wang HH, Shyu YI, Chang HY, et al. Prevalence, characteristics, and acute care utilization of disabled older adults with an absence of help for activities of daily living: findings from a nationally representative survey. Arch Gerontol Geriatr 20166728–33 [DOI] [PubMed] [Google Scholar]
- 13.Millán-Calenti JC, Tubío J, Pita-Fernández S, et al. Prevalence of functional disability in activities of daily living (ADL), instrumental activities of daily living (IADL) and associated factors, as predictors of morbidity and mortality. Arch Gerontol Geriatr 201050306–310 [DOI] [PubMed] [Google Scholar]
- 14.Fong KC, Hart JE, James P. A review of epidemiologic studies on greenness and health: updated literature through 2017. Curr Environ Health Rep 2018577–87 [DOI] [PMC free article] [PubMed] [Google Scholar]
- 15.Gascon M, Triguero-Mas M, Martínez D, et al. Residential green spaces and mortality: a systematic review. Environ Int 20168660–67 [DOI] [PubMed] [Google Scholar]
- 16.van den Berg M, Wendel-Vos W, van Poppel M, Kemper H, van Mechelen W, Maas J. Health benefits of green spaces in the living environment: a systematic review of epidemiological studies. Urban For Urban Green 201514806–816 [Google Scholar]
- 17.Koohsari MJ, Mavoa S, Villanueva K, et al. Public open space, physical activity, urban design and public health: concepts, methods and research agenda. Health Place 20153375–82 [DOI] [PubMed] [Google Scholar]
- 18.Hunter RF, Christian H, Veitch J, Astell-Burt T, Hipp JA, Schipperijn J. The impact of interventions to promote physical activity in urban green space: a systematic review and recommendations for future research. Soc Sci Med 2015124246–256 [DOI] [PubMed] [Google Scholar]
- 19.Mendes de Leon CF, Glass TA, Berkman LF. Social engagement and disability in a community population of older adults: the New Haven EPESE. Am J Epidemiol 2003157633–642 [DOI] [PubMed] [Google Scholar]
- 20.Boyle PA, Buchman AS, Wilson RS, Bienias JL, Bennett DA. Physical activity is associated with incident disability in community-based older persons. J Am Geriatr Soc 200755195–201 [DOI] [PubMed] [Google Scholar]
- 21.James BD, Boyle PA, Buchman AS, Bennett DA. Relation of late-life social activity with incident disability among community-dwelling older adults. J Gerontol A Biol Sci Med Sci 201166467–473 [DOI] [PMC free article] [PubMed] [Google Scholar]
- 22.World Bank. Total population ages 65 and above. 2017 https://data.worldbank.org/indicator/SP.POP.65UP.TO.ZS. Accessed August 21, 2019.
- 23.Peng R, Wu B, Ling L. Undermet needs for assistance in personal activities of daily living among community-dwelling oldest old in China from 2005 to 2008. Res Aging 201537148–170 [DOI] [PubMed] [Google Scholar]
- 24.Feng Q, Zhen Z, Gu D, Wu B, Duncan PW, Purser JL. Trends in ADL and IADL disability in community-dwelling older adults in Shanghai, China, 1998-2008. J Gerontol B Psychol Sci Soc Sci 201368476–485 [DOI] [PMC free article] [PubMed] [Google Scholar]
- 25.Zeng Y, Poston DL, Vlosky DA, Gu D. Healthy Longevity in China: Demographic, Socioeconomic, and Psychological Dimensions 2008Netherlands: Springer Science & Business Media [Google Scholar]
- 26.Villeneuve PJ, Jerrett M, Su JG, et al. A cohort study relating urban green space with mortality in Ontario, Canada. Environ Res 201211551–58 [DOI] [PubMed] [Google Scholar]
- 27.James P, Hart JE, Banay RF, Laden F. Exposure to greenness and mortality in a nationwide prospective cohort study of women. Environ Health Perspect 20161241344–1352 [DOI] [PMC free article] [PubMed] [Google Scholar]
- 28.Pereira G, Foster S, Martin K, et al. The association between neighborhood greenness and cardiovascular disease: an observational study. BMC Public Health 201212466. [DOI] [PMC free article] [PubMed] [Google Scholar]
- 29.McMorris O, Villeneuve PJ, Su J, Jerrett M. Urban greenness and physical activity in a national survey of Canadians. Environ Res 201513794–100 [DOI] [PubMed] [Google Scholar]
- 30.Thiering E, Markevych I, Brüske I, et al. Associations of residential long-term air pollution exposures and satellite-derived greenness with insulin resistance in German adolescents. Environ Health Perspect 20161241291–1298 [DOI] [PMC free article] [PubMed] [Google Scholar]
- 31.Wen M, Gu D. Air pollution shortens life expectancy and health expectancy for older adults: the case of China. J Gerontol A Biol Sci Med Sci 2012671219–1229 [DOI] [PubMed] [Google Scholar]
- 32.Zeng Y, Gu D, Purser J, Hoenig H, Christakis N. Associations of environmental factors with elderly health and mortality in China. Am J Public Health 2010100298–305 [DOI] [PMC free article] [PubMed] [Google Scholar]
- 33.Li T, Zhang Y, Wang J, et al. All-cause mortality risk associated with long-term exposure to ambient PM2·5 in China: a cohort study. Lancet Public Health 20183e470–e477 [DOI] [PubMed] [Google Scholar]
- 34.Ji JS, Zhu A, Bai C, et al. Residential greenness and mortality in oldest-old women and men in China: a longitudinal cohort study. Lancet Planet Health 20193e17–e25 [DOI] [PMC free article] [PubMed] [Google Scholar]
- 35.Astell-Burt T, Feng X, Kolt GS. Green space is associated with walking and moderate-to-vigorous physical activity (MVPA) in middle-to-older-aged adults: findings from 203 883 Australians in the 45 and Up Study. Br J Sports Med 201448404–406 [DOI] [PubMed] [Google Scholar]
- 36.Kaczynski AT, Potwarka LR, Smale BJ, Havitz ME. Association of parkland proximity with neighborhood and park-based physical activity: variations by gender and age. Leis Sci 200931174–191 [Google Scholar]
- 37.Gong Y, Gallacher J, Palmer S, Fone D. Neighbourhood green space, physical function and participation in physical activities among elderly men: the Caerphilly Prospective study. Int J Behav Nutr Phys Act 20141140. [DOI] [PMC free article] [PubMed] [Google Scholar]
- 38.Haselwandter EM, Corcoran MP, Folta SC, Hyatt R, Fenton M, Nelson ME. The built environment, physical activity, and aging in the United States: a state of the science review. J Aging Phys Act 201523323–329 [DOI] [PubMed] [Google Scholar]
- 39.de Souto Barreto P, Morley JE, Chodzko-Zajko W, et al. ; International Association of Gerontology and Geriatrics – Global Aging Research Network (IAGG-GARN) and the IAGG European Region Clinical Section Recommendations on physical activity and exercise for older adults living in long-term care facilities: a taskforce report. J Am Med Dir Assoc 201617381–392 [DOI] [PubMed] [Google Scholar]
- 40.Toots A, Littbrand H, Lindelöf N, et al. Effects of a high-intensity functional exercise program on dependence in activities of daily living and balance in older adults with dementia. J Am Geriatr Soc 20166455–64 [DOI] [PMC free article] [PubMed] [Google Scholar]
- 41.Pahor M, Guralnik JM, Ambrosius WT, et al. ; LIFE Study Investigators Effect of structured physical activity on prevention of major mobility disability in older adults: the LIFE study randomized clinical trial. JAMA 20143112387–2396 [DOI] [PMC free article] [PubMed] [Google Scholar]
- 42.Keysor JJ. Does late-life physical activity or exercise prevent or minimize disablement? A critical review of the scientific evidence. Am J Prev Med 2003253 Suppl 2129–136 [DOI] [PubMed] [Google Scholar]
- 43.Connolly D, Garvey J, McKee G. Factors associated with ADL/IADL disability in community dwelling older adults in the Irish longitudinal study on ageing (TILDA). Disabil Rehabil 201739809–816 [DOI] [PubMed] [Google Scholar]
- 44.Sugiyama T, Thompson CW. Outdoor environments, activity and the well-being of older people: conceptualising environmental support. Environ Plan A 2007391943–1960 [Google Scholar]
- 45.Mitchell R, Popham F. Effect of exposure to natural environment on health inequalities: an observational population study. Lancet 20083721655–1660 [DOI] [PubMed] [Google Scholar]
- 46.Dadvand P, de Nazelle A, Figueras F, et al. Green space, health inequality and pregnancy. Environ Int 201240110–115 [DOI] [PubMed] [Google Scholar]
- 47.Xu L, Ren C, Yuan C, Nichol JE, Goggins WB. An ecological study of the association between area-level green space and adult mortality in Hong Kong. Climate 2017555 [Google Scholar]
- 48.Maas J, Verheij RA, Groenewegen PP, de Vries S, Spreeuwenberg P. Green space, urbanity, and health: how strong is the relation? J Epidemiol Community Health 200660587–592 [DOI] [PMC free article] [PubMed] [Google Scholar]
- 49.Vienneau D, de Hoogh K, Faeh D, Kaufmann M, Wunderli JM, Röösli M; SNC Study Group More than clean air and tranquillity: residential green is independently associated with decreasing mortality. Environ Int 2017108176–184 [DOI] [PubMed] [Google Scholar]