Abstract
Malignant neoplasms evolve in response to changes in oncogenic signalling1. Cancer cell plasticity in response to evolutionary pressures is fundamental to tumour progression and the development of therapeutic resistance2,3. Here we elucidate the molecular and cellular mechanisms of cancer cell plasticity in a conditional oncogenic Kras mouse model of pancreatic ductal adenocarcinoma (PDAC), a malignancy that displays considerable phenotypic diversity and morphological heterogeneity. In this model, stochastic extinction of oncogenic Kras signalling and emergence of Kras-independent escaper populations (cells that acquire oncogenic properties) are associated with de-differentiation and aggressive biological behaviour. Transcriptomic and functional analyses of Kras-independent escapers reveal the presence of Smarcb1–Myc-network-driven mesenchymal reprogramming and independence from MAPK signalling. A somatic mosaic model of PDAC, which allows time-restricted perturbation of cell fate, shows that depletion of Smarcb1 activates the Myc network, driving an anabolic switch that increases protein metabolism and adaptive activation of endoplasmic-reticulum-stress-induced survival pathways. Elevated protein turnover renders mesenchymal sub-populations highly susceptible to pharmacological and genetic perturbation of the cellular proteostatic machinery and the IRE1-α–MKK4 arm of the endoplasmic-reticulum-stress-response pathway. Specifically, combination regimens that impair the unfolded protein responses block the emergence of aggressive mesenchymal subpopulations in mouse and patient-derived PDAC models. These molecular and biological insights inform a potential therapeutic strategy for targeting aggressive mesenchymal features of PDAC.
Normal and neoplastic pancreatic epithelia display remarkable plasticity, enabling them to adapt to oncogenic and environmental stresses. The prominent cellular plasticity of PDAC has fueled speculation that these properties may contribute to its aggressive clinical behaviour4–6.
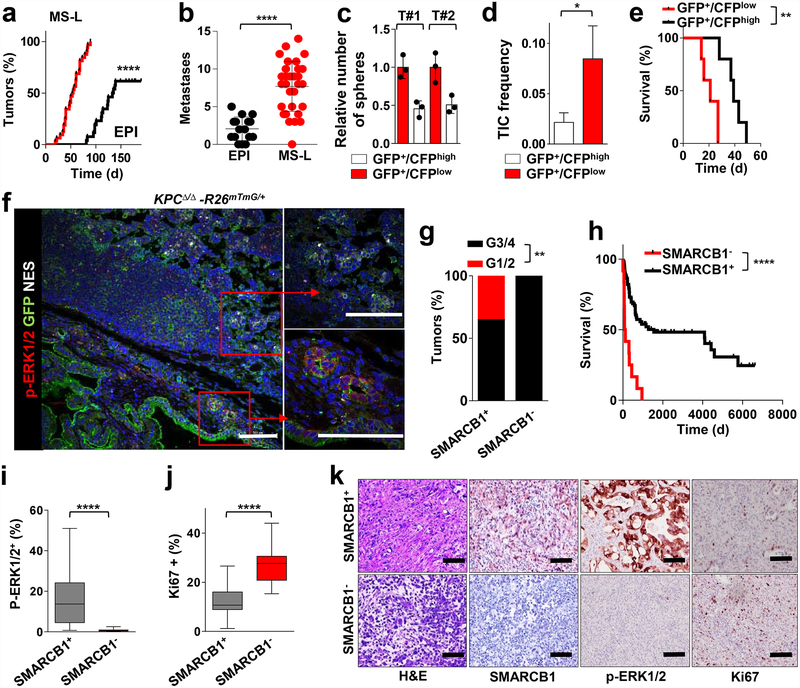
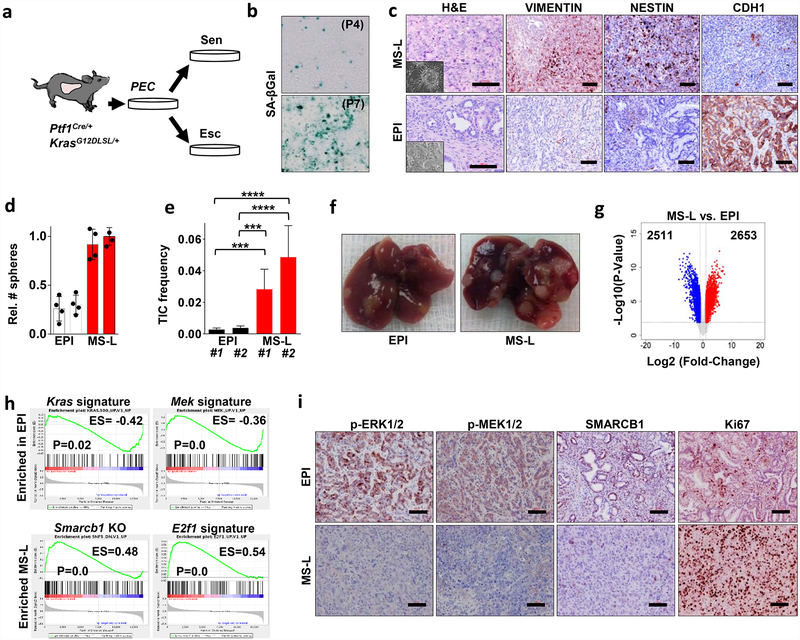
To understand how malignant pancreatic cells adapt to an oncogenic insults, we established a stochastic model of PDAC progression by isolating KrasG12D-expressing pancreatic epithelial cells from 3–6-week-old Ptf1aCre/+-KrasG12DLSL/+ mice for ex vivo cultures7,8(Extended Data Fig. 1a and Methods). Under these conditions, we observed cellular senescence upon passaging followed by the emergence of escaper clones in 10–20% of cultures (Extended Data Fig. 1b). Spontaneous escapers generated tumours with high penetrance upon orthotopic transplantation, displaying a dichotomous morphology of either well-differentiated epithelial lesions (EPI) or anaplastic, mesenchymal-like tumours (MS-L) based on microscopic and immunohistochemical characterization (Extended Data Fig. 1c). MS-L cultures displayed higher spherogenic potential in vitro, higher tumour-initiating cell (TIC) frequency in in vivo limiting-dilution experiments and a global increase in tumorigenic and metastatic potential, whereas EPI cultures exhibited less aggressive behaviour both in vitro and in vivo (Fig. 1a, b and Extended Data Fig. 1d–f).
Figure 1 |. Identification and functional characterization of mesenchymal sub-populations in pancreatic cancer.
a, Kaplan–Meier analysis of tumour incidence in NCr Nude mice orthotopically transplanted with MS-L (n = 32) or EPI (n = 26) escapers. b, Metastatic burden (macroscopic liver, peritoneal and lung metastasis) from the experiment above (MS-L n = 32, EPI n = 16). c, Spherogenic potential in 3D of GFP+/CFPhigh and GFP+/CFPlow cell populations isolated from two independent tumours arising in the KPCΔ/Δ-R26mTmG/+-Cdh1Cfp/+ model (n = 3) (see Methods for details). d, TIC frequency of GFP+CFPhigh and GFP+CFPlow cells assessed by limiting-dilution experiments in NCr Nude mice (n = 20 per group) and calculated using L-Calc software. e, Kaplan–Meier survival analysis of NCr Nude mice orthotopically transplanted with the subpopulations described in d (n = 5 per group). f, In vivo characterization of tumour heterogeneity in the KPCΔ/Δ-R26mTmG/+ model of PDAC. Immunofluorescence staining for GFP, phospho-ERK1/2 and nestin identify distinct sub-population of invasive GFP+ cells. g, Histopathological grade distribution in a cohort of surgically resected human PDAC (SMARCB1+, n = 138; SMARCB1−, n = 16). h, Kaplan–Meier analysis of overall survival in surgically resected PDAC with available follow up data. Patients were clustered on presence (n = 122) or absence (n = 12) of SMARCB1 immunostaining. i, Quantification of phospho-ERK1/2 immunohistochemical staining in SMARCB1+ (n = 51) versus SMARCB1− (n = 15) samples. j, Quantification of Ki67 immunohistochemical staining in SMARCB1+ (n = 45) versus SMARCB1− (n = 15) samples. k, Representative panels showing the morphology (haematoxylin and eosin stain (H&E)) and the expression of SMARCB1, Phospho-ERK1/2 and Ki67 in surgically resected human PDAC samples. Data are mean ± s.d. of biological replicates (a, b, e, i, j) or of technical replicates (one representative experiment out of three; c). d, Error bars show the proportion of TIC ± s.e.m. *P < 0.05, **P < 0.01, ****P < 0.0001 by unpaired two-tailed t-test (b, i, j) log-rank (Mantel–Cox) test (a, e, h), two-tailed chi-squared test (d) or two-tailed Fisher’s exact test (g). Scale bars: 100 μm (f, k).
Transcriptomic profiling of EPI and MS-L escapers (4 lines each) revealed 5,164 differentially expressed genes (corrected false discovery rate < 0.05) (Extended Data Fig. 1g). Gene set enrichment analysis (GSEA) and proteomic analysis revealed that MS-L clones exhibited downregulation of Kras signature genes, dysregulation of transcriptomic targets of the SWI/SNF chromatin remodeller Smarcb1 and activation of programs involved in cell-cycle progression9–12 (Extended Data Fig. 1h, i).
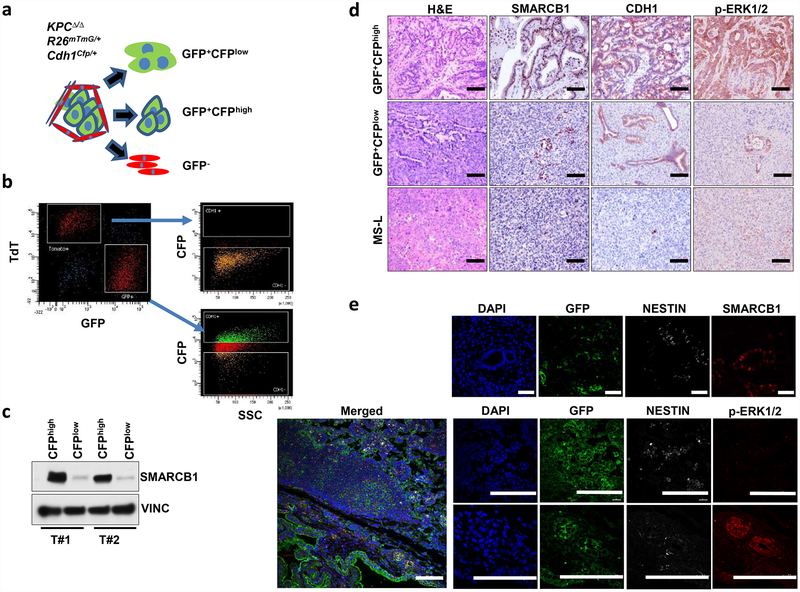
We validated these findings by in vivo lineage-tracking methods, allowing the isolation and characterization of emerging malignant sub-populations with respect to their differentiation state by combining a conditional fluorescence lineage-tracing reporter (R26mTmG) and the Cdh1Cfp reporter (expressing a fusion product of E-cadherin and CFP) into the spontaneous KPCΔ/Δ (KrasG12DLSL/+-Tp53LoxP/LoxP-Pdx1-Cre) model of PDAC (Extended Data Fig. 2a, b and Methods). The system yielded two distinct malignant sub-populations: a GFP+CFPlowSMARCB1low sub-population characterized by low engagement of the MAPK signalling, expression of mesenchymal markers and an aggressive phenotype, and a GFP+CFPhighSMARCB1high epithelial sub-population exhibiting high levels of phospho-ERK1/2 and a more indolent behaviour (Fig. 1c–f and Extended Data Fig. 2c–e). The clinical relevance of our findings was assessed in a cohort of surgically resected PDAC; we identified a subset of patients characterized by dismal prognosis and poorly differentiated tumours that showed low MAPK activity, low SMARCB1 expression and an increased proliferative index (Fig. 1g–k).
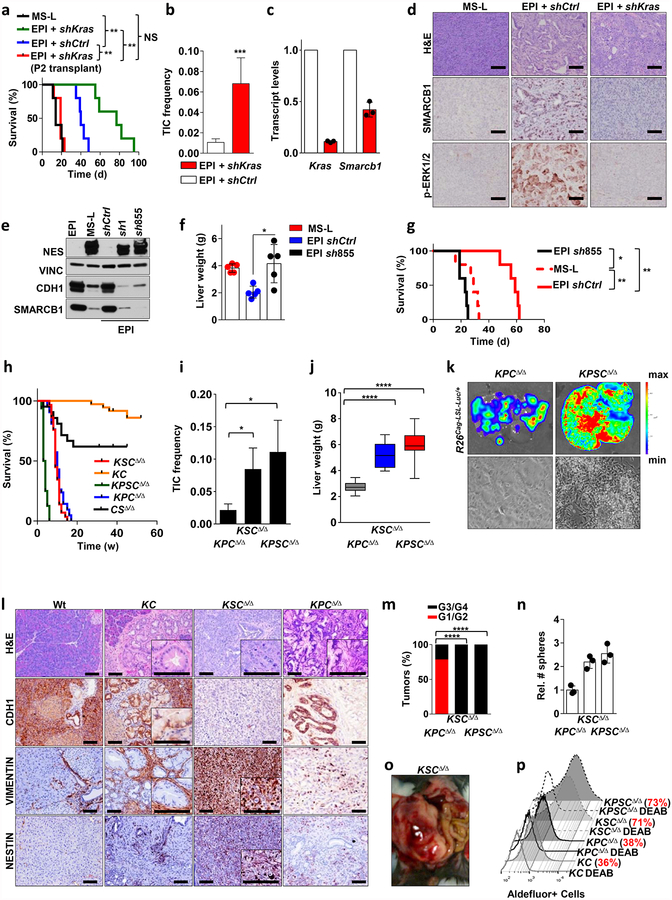
We further investigated the role of Kras and Smarcb1 in cell plasticity through functional genetic studies. Using RNA interference (RNAi) experiments, we found that ablation of either Kras or Smarcb1 resulted in the mesenchymal reprogramming of epithelial clones and aggressive biological behaviour (Extended Data Fig. 3a–g). Additionally, the conditional ablation of the Smarcb1 gene in the KC (KrasG12DLSL/+-Pdx1-Cre) and KPCΔ/Δ backgrounds, to generate KSCΔ/Δ and KPSCΔ/Δ models, respectively, resulted in markedly accelerated tumorigenesis, increased metastatic spread and mesenchymal reprogramming (Extended Data Fig. 3h–p).
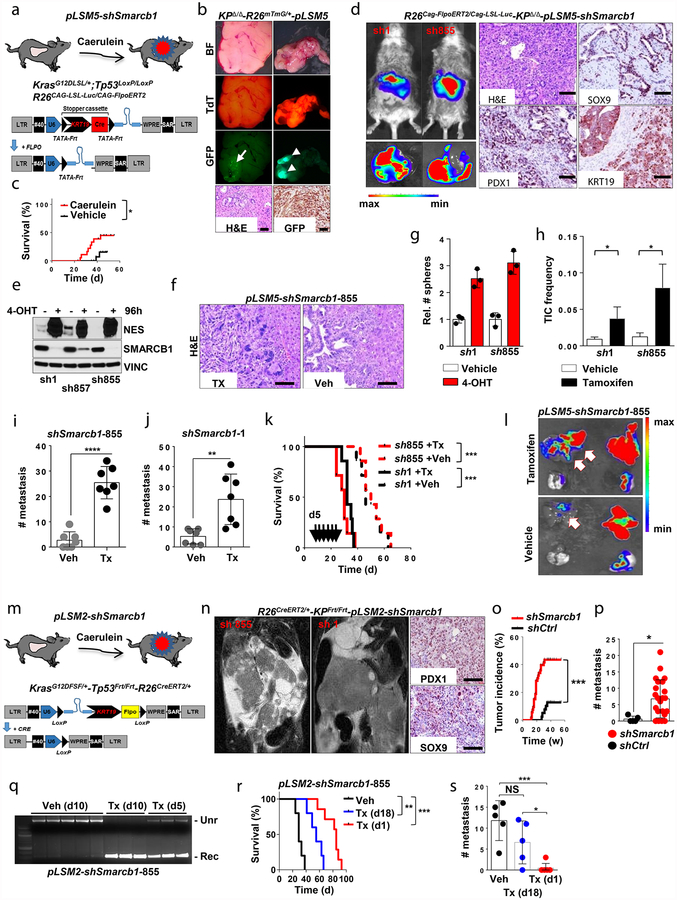
We next investigated whether time-restricted Smarcb1 extinction could promote the mesenchymal reprogramming of established tumours in vivo through a lentiviral-based somatic-mosaic system (pLSM5), allowing the tissue-specific mosaic generation of PDAC in adult mice (R26Cag-FlpoERT2/Cag-LSL-Luc-KPΔ/Δ-pLSM5-shSmarcb1)13 (Extended Data Fig. 4a–d and Methods). In these settings, acute Smarcb1 ablation resulted in the rapid expansion of a mesenchymal sub-population exhibiting increased TIC frequency, enhanced growth and metastatic dissemination (Extended Data Fig. 4e–l).
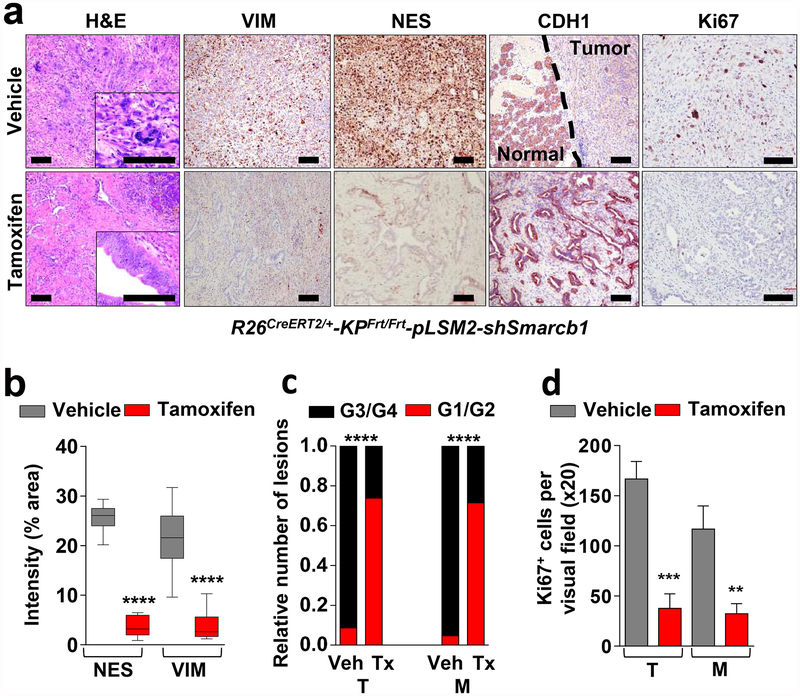
Similarly, the time-restricted restoration of Smarcb1 in Smarcb1-depleted tumours (R26CreERT2/+-KPFrt/frt-pLSM2-shSmarcb1) resulted in mesenchymal-to-epithelial reversion, depletion of nestin/vimentin-positive populations, and indolent tumour growth (Fig. 2a–d, Extended Data Fig. 4m–q and Methods). These profound phenotypic changes were accompanied by increased survival and impaired metastatic dissemination of orthotopically transplanted syngeneic C57BL/6 recipient mice (Extended Data Fig. 4r, s). Together, these data suggest that Smarcb1 serves as a gatekeeper of epithelial identity because its loss provokes mesenchymal features and aggressive malignant behaviour. Furthermore, maintenance of the mesenchymal phenotype requires sustained repression of Smarcb1.
Figure 2 |. Smarcb1 restrains the expansion of aggressive mesenchymal clones in PDAC.
a, Morphological and immuno-phenotypic characterization of Smarcb1-restored tumours (tamoxifen) compared to vehicle-treated controls (see Methods). Haematoxylin and eosin, vimentin (VIM), nestin (NES), E-cadherin (CDH1) and Ki67 stains of lesions collected 10 days after tamoxifen or vehicle treatment. Scale bars: 100 μm. b, Quantification of the vimentin- and nestin-positive areas in Smarcb1 depleted and restored primary tumours (n = 12 per group). c, Histopathological grade distribution in Smarcb1-depleted and restored primary tumours (T) and metastatic lesions (M) (n = 23 primary tumours, n = 21 metastatic lesions). Tx, tamoxifen; Veh, vehicle. d, Quantification of the proliferative index measured by Ki67 staining (n = 3 per group). Data are mean ± s.d. of biological replicates. **P < 0.01, ***P < 0.001, ****P < 0.0001 by unpaired two-tailed t-test (b, d) or two-tailed Fisher’s exact test (c).
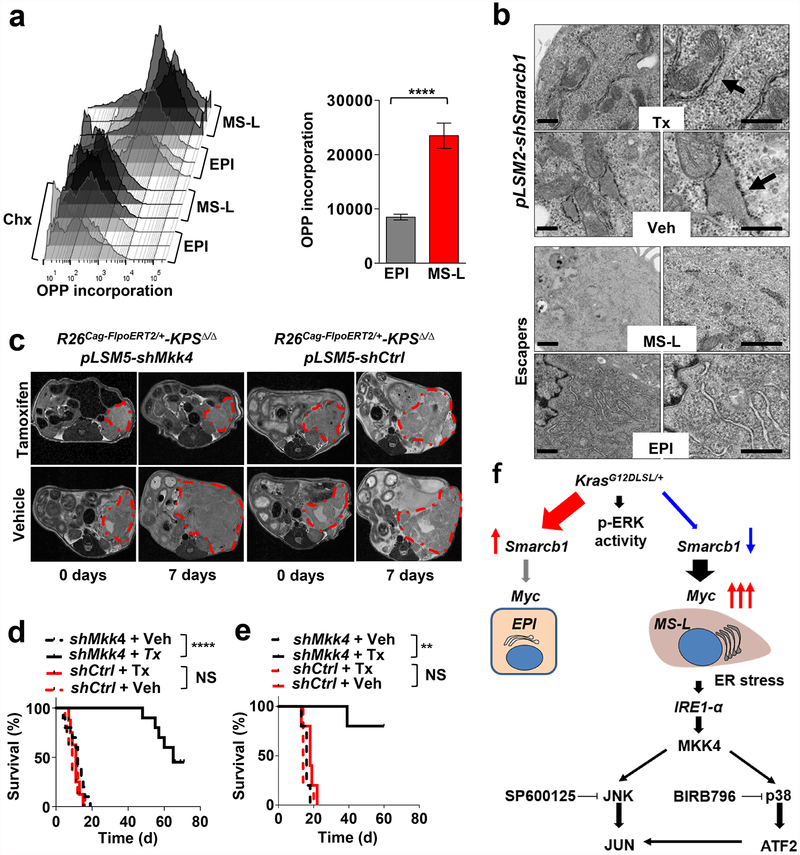
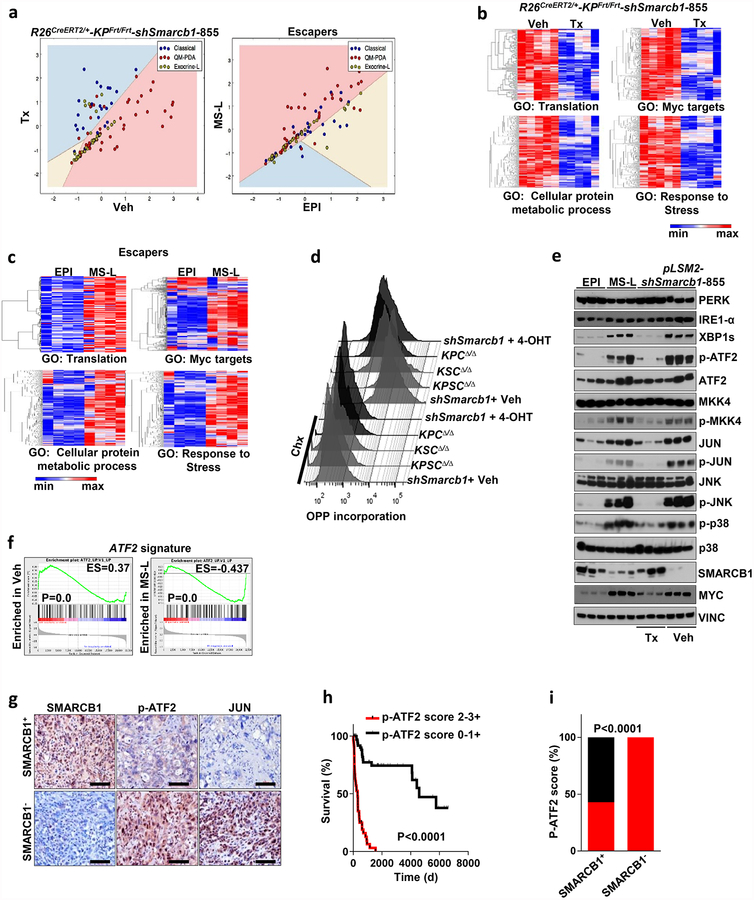
Transcriptomic analysis of Smarcb1-ablated tumours and Smarcb1-deficient escapers revealed enrichment for quasi-mesenchymal signature genes (QM-PDA)14,15 (Extended Data Fig. 5a), upregulation of Myc transcriptomic target and enrichment for genes involved in protein anabolism, biomass accumulation, and adaptive response to stress (Extended Data Fig. 5b, c). In line with expression data, Smarcb1-deficient cells displayed increased protein synthesis rates, as assessed by fluorescence-activated cell sorting (FACS) analysis of O-propargyl-puromycin (OPP) incorporation in short-term cultures that were established from tumours derived from escaper clones and conditional somatic models16 (Fig. 3a and Extended Data Fig. 5d). Furthermore, as a consequence of the perturbation of proteostatic balance, Smarcb1-deficient and Smarcb1-depleted cancer cells showed prominent accumulation of cytoplasmic protein aggregates, signs of endoplasmic reticulum (ER) stress (as assessed by transmission electron microscopy (TEM)) and engagement of the JNK and p38 stress kinases through the IRE1-α–MKK4 arm of the ER-stress-response pathway, leading to the activation of the Atf2 transcriptional network (Fig. 3b and Extended Data Fig. 5e, f). Overall, this experimental evidence strongly suggests that global perturbation of the cellular proteostatic machinery is an adaptive response to increased metabolic requirements17–21. In line with these data, examination of surgically resected PDAC specimens revealed a strong association between decreased SMARCB1 levels, activation of the stress response pathway (as assessed by phospho-ATF2 immunochemical staining) and poor post-operative outcome (P < 0.0001; Extended Data Fig. 5g–i).
Figure 3 |. Genetic perturbation of ER-stress response pathway is lethal in a Smarcb1-deficient context.
a, Quantification of protein biosynthesis by OPP incorporation analysis (measured by FACS). Representative graphics (left) and bar plots (right) from short-term cultures established from escapers-derived tumours (n = 4 per group). Cycloheximide (Chx)-treated cultures were used as negative controls. b, Transmission electron microscopy (TEM) sections from Smarcb1-proficient and -deficient tumours generated from somatic GEMMs and from stochastic escapers. Arrows indicate ER. Enlarged ER and cytoplasmic protein aggregates were observed in Smarcb1-deficient cells. Scale bars: 500 nm. c, Representative MRI axial sections of R26Cag-FlpoERT2/+-KPSΔ/Δ-pLSM5-shMkk4 and R26Cag-FlpoERT2/+-KPSΔ/Δ-pLSM5-shCtrl (containing a non-targeted control shRNA) tumour-bearing mice upon vehicle or tamoxifen treatment (see Methods). d, Kaplan–Meier survival analysis for the experimental groups described above assigned to tamoxifen (continuous lines) or vehicle (interrupted lines) treatment. shMkk4, n = 10 per group; shCtrl, n = 8 per group. e, Secondary orthotopic transplants (n = 5 per group). f, Schematic model showing the engagement of stress pathways defining malignant mesenchymal sub-populations in PDAC. Data are mean ± s.d. of biological replicates. **P < 0.01, ****P < 0.0001, by unpaired two-tailed t-test (a) or Mantel–Cox log-rank test (d, e). NS, not significant.
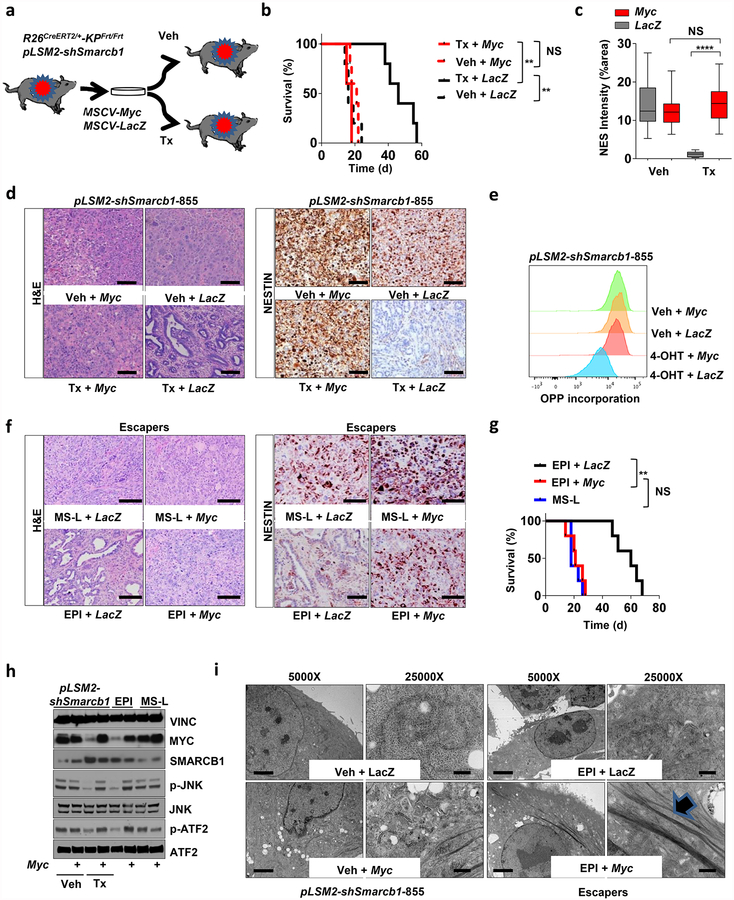
Notably, whereas in vivo restoration of Smarcb1 suppressed stress-response signalling in mesenchymal tumours, resulting in the normalization of the ultramicroscopic findings (Fig. 3b), exogenous expression of Myc in functional rescue experiments forced malignant cells into a mesenchymal, anabolic state and restored molecular and ultrastructural signs of proteotoxic stress (Extended Data Fig. 6a–i). These findings are consistent with the view that Myc is required for the maintenance of the mesenchymal state in Smarcb1-deficient cell populations and is responsible for the anabolic switch, the perturbation of protein metabolism, and the engagement of the IRE1-α/MKK4 pathway.
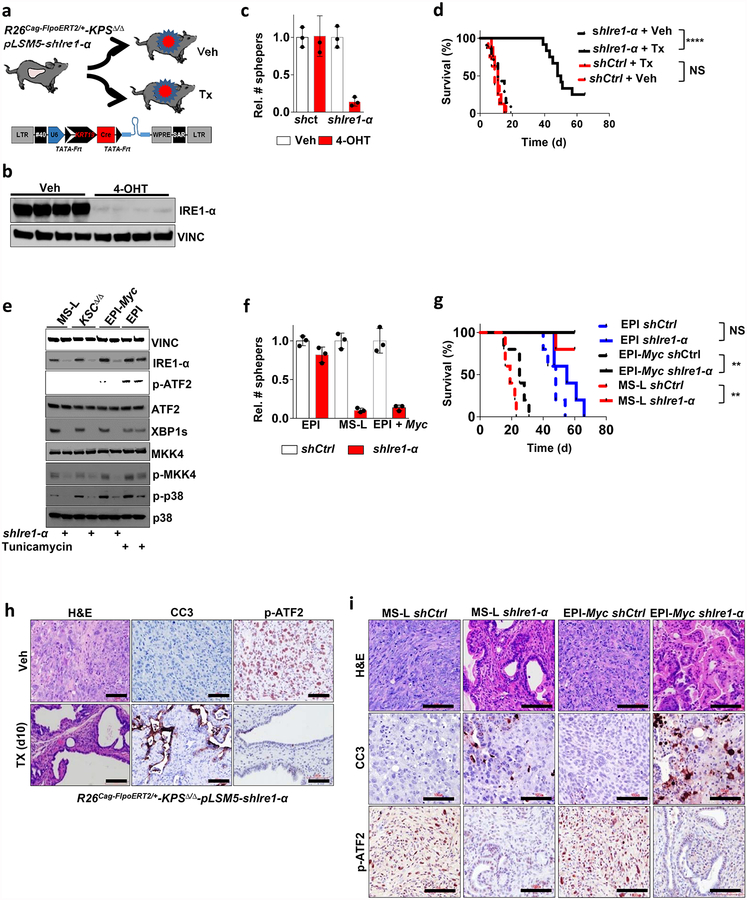
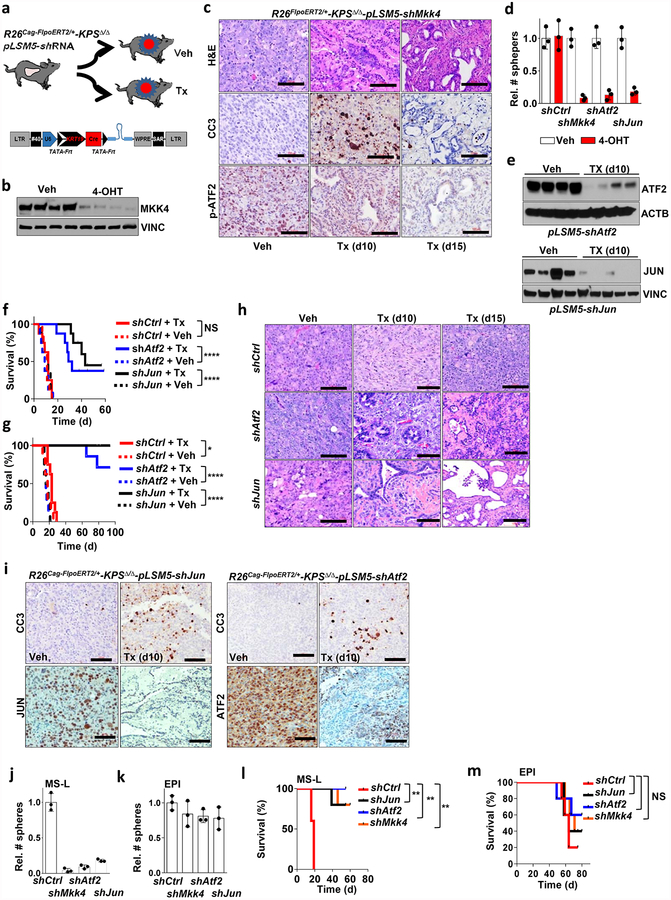
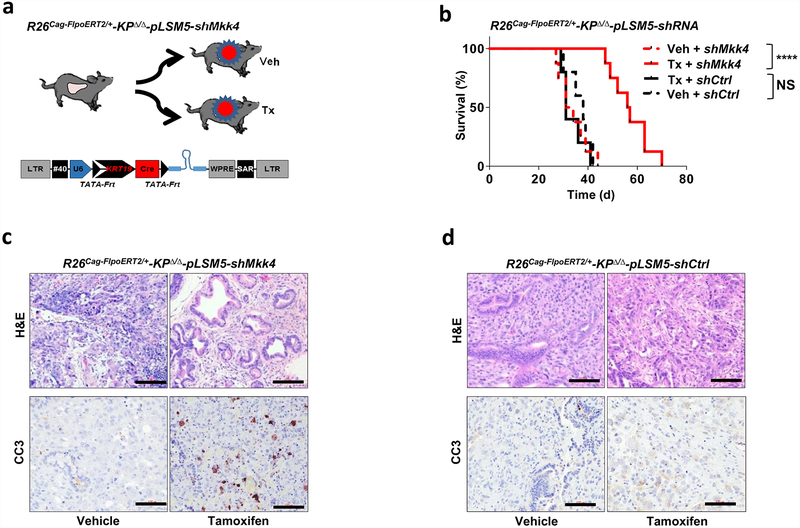
On the basis of these experimental observations, we proposed that Smarcb1-deficient mesenchymal cells might be highly sensitive to pharmacological or genetic perturbation of adaptive stress-response signalling. To test this in vivo, we used somatic mosaic technology to generate Smarcb1-deficient tumours carrying latent short hairpin RNAs (shRNAs) specific for the stress response effector genes in R26Cag-FlpoERT2/+-KPSΔ/Δ mice (Extended Data Fig. 7a). When injected mice developed palpable tumours, time-restricted ablation of Ern1 (encoding IRE1-α) resulted in durable tumour regression, prolonged survival in vivo, and marked reduction of clonogenic growth in vitro when compared to vehicle-treated and control tumours (Extended Data Fig. 7b–d). Similarly, the constitutive knockdown of Ern1 in MS-L cells and in Myc-reprogrammed EPI escapers potently suppressed tumorigenicity in orthotopic transplants in vivo and impaired clonogenic growth in 3D but showed no effects on EPI-derived transplants and cultures (Extended Data Fig. 7e–g). These findings were supported by a decrease in the levels of phospho-ATF2 and apoptotic response (Extended Data Fig. 7h, i). Furthermore, systematic depletion of Mkk4, Atf2 and Jun both in vitro and in vivo confirmed that the engagement of the IRE1-α–MKK4 pathway is required for adaptation to the metabolic requirements and survival of Smarcb1-deficient cells (Fig. 3c–f and Extended Data Fig. 8a–m). Similarly, acute deletion of Mkk4 in R26Cag-FlpoERT2/+-KPΔ/Δ-pLSM5-shMkk4 (containing shMkk4, an shRNA targeting Mkk4) resulted in a less strong (but still significant) response, suggesting that in a heterogeneous background, abrogation of stress response can selectively impair the survival and propagation of a substantial fraction of malignant cells (Extended Data Fig. 9a–d).
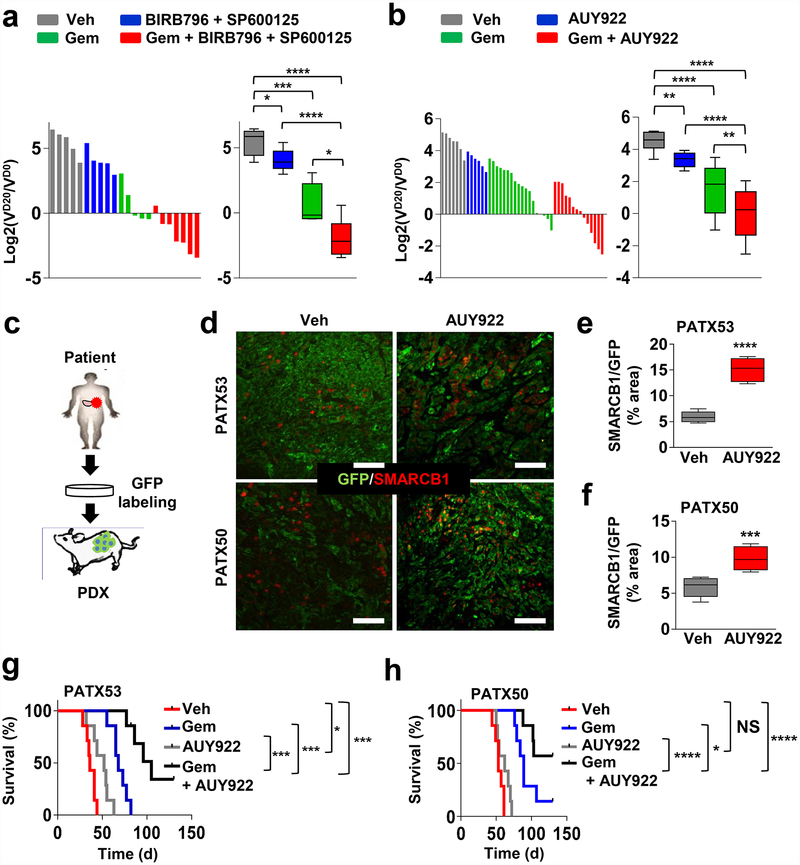
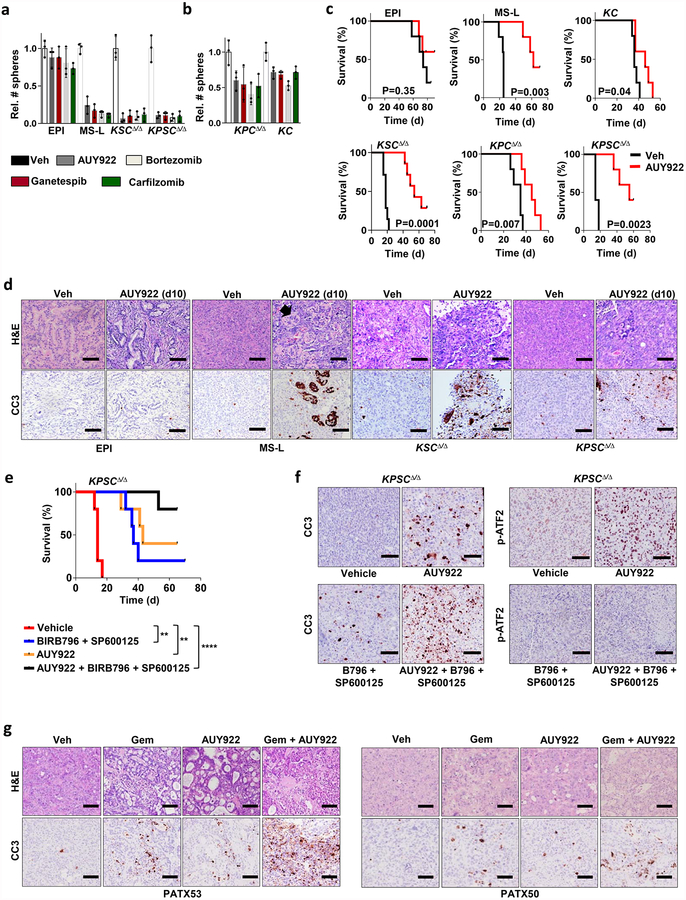
In line with our genetic studies, we established a notable correlation between Smarcb1 expression status and sensitivity to pharmacological manipulation of cellular proteostasis with HSP90 inhibitors and proteasome inhibitors in vitro (Extended Data Fig. 10a, b). Furthermore, treatment of Smarcb1-deficient tumour-bearing mice with the HSP90 inhibitor AUY922 resulted in the induction of apoptosis and delayed tumour growth, but showed limited efficacy in Smarcb1-proficient models (Extended Data Fig. 10c, d). Notably, therapeutic efficacy could be improved by the simultaneous impairment of cellular proteostasis and the ER-stress response, combining the HSP90 inhibitor AUY922 with p38/JNK inhibitor doublets (BIRB796 and SP600125), which suggests that Smarcb1-deficient tumours are particularly vulnerable to the coordinated perturbation of the protein-folding machinery and stress response (Extended Data Fig. 10e, f). Furthermore, perturbation of proteostasis was effective in geneticall engineered mouse model (GEMM)-derived-allograft and patient-derived-xenograft (PDX) models, which recapitulate the complexity and phenotypic heterogeneity of human PDAC22–25. In both models, the addition of AUY922 to a gemcitabine-based regimen induced a robust apoptotic response and prolonged survival compared to single-agent treatments (Fig. 4a–h and Extended Data Fig. 10g).
Figure 4 |. Pharmacological perturbation of proteostasis induces tumour regression in cooperation with gemcitabine in pre-clinical models of pancreatic cancer.
a, b, Waterfall plots (left) and box plots (right) of KPCΔ/Δ GEMM-derived-allografts (GDAs) transplanted subcutaneously in NCr Nude mice assigned to a vehicle (n = 5), BIRB796 and SP600125 (n = 5), gemcitabine (n = 5), gemcitabine, BIRB796 and SP600125 (n = 7) (a); and vehicle (n = 7), AUY922 (n = 6), gemcitabine (n = 18), gemcitabine and AUY922 (n = 14) (b). VD20 and VD0, tumour volumes at day 20 and 0 of treatment, respectively. c, Schematic of experimental design for the establishment of PDX models of PDAC. There were two independent lines used, PATX53 and PATX50. d, Representative sections from tumour-bearing mice treated with AUY922 or vehicle. Scale bars: 100 μm. e, f, Bar graph showing the relative enrichment of SMARCB1highGFP+ subpopulations upon treatment with AUY922 in orthotopic transplants of PDXs PATX53 (e) and PATX50 (f); n = 6 per group. g, h, Kaplan–Meier survival analysis of NOD SCID mice orthotopically transplanted with low-passage, PDAC PDX lines. Treatment with combined gemcitabine and AUY922 results in a significantly higher response rate and prolonged survival than treatment with monotherapies (PATX53, n = 7 per group; PATX50 vehicle, AUY992 and gemcitabine, n = 7 per group; PATX50, gemcitabine and AUY922, n = 14). Error bars denote mean ± s.d. of biological replicates (a, b, e, f). NS, not significant; *P < 0.05, **P < 0.01, ***P < 0.001, ****P < 0.0001, by unpaired two-tailed t-test (a, b, e, f) or Mantel–Cox log-rank test (g, h).
By using complementary functional approaches, we demonstrate that, in pancreatic cancer, neoplastic cells reside within a spectrum of phenotypic states and that the functional heterogeneity of different sub-populations of tumour cells stems from a remarkable plasticity of malignant clones. Our work highlights a novel mechanism of Kras-driven tumorigenesis, involving malignant sub-populations that fail to activate signalling downstream of Kras (for example, through MAPK)26. Eventually this results in the de-repression of growth and metabolic programs normally kept in check by the SWI/SNF chromatin-remodelling factor SMARCB1 and driven by Myc. Our study sheds light on the crucial tumour-suppressive role of SMARCB1 as a differentiation checkpoint and a gatekeeper of epithelial–mesenchymal transition. Transcriptomic and functional analyses revealed that such sub-populations display an increased anabolic rate and rely on the adaptive activation of the unfolded-protein and ER-stress responses for survival. This establishes a rationale for the pharmacological perturbation of proteostasis in addition to chemotherapy in the treatment of patients with de-differentiated tumours and poor prognosis who may benefit most from trials involving these combinations27–29.
METHODS
Mouse strains
KrasG12DLSL/+, KrasG12DFSF/+, R26CreERT2 and R26Cag-LSL-Luc mice were generated by T. Jacks and obtained through the Jackson Laboratory30–33. Tp53Frt/Frt mice were generated by D. Kirsch and obtained through the Jackson Laboratory34. The R26mTmG strain was generated by L. Luo and obtained through the Jackson Laboratory35. The Smarcb1Loxp/LoxP strain was provided by C. Roberts36. The Pdx1-Cre strain was obtained from A. M. Lowy through the Jackson Laboratory37. The Ptf1aCre/+ and Tp53LoxP/LoxP strains were provided by R.A.D.38,39. The R26Cag-FlpoERT2 was generated by A. Joyner and obtained from the Jackson Laboratory40. The Cdh1Cfp strain was generated by H. Clevers and obteined through the Jackson Laboratory41. The KrasG12DFSF/+; Tp53Frt/Frt; R26CreERT2 were kept in a C57BL/6 background, the other strains were kept in a mixed C57BL/6 and 129Sv/Jae background. All animal studies and procedures were approved by the UTMDACC Institutional Animal Care and Use Committee. Animals were killed when sick or when they developed tumours larger than 15 mm in their greater diameter or ulcerated lesions.
GEMM nomenclature
KC : KrasG12DLSL/+-Pdx1-Cre; KPCΔ/Δ: KrasG12DLSL/+-Tp53LoxP/LoxP-Pdx1-Cre; KSCΔ/Δ: KrasG12DLSL/+-Smarcb1LoxP/LoxP-Pdx1-Cre; KPSCΔ/Δ: KrasG12DLSL/+-Tp53LoxP/LoxP-Smarcb1LoxP/LoxP-Pdx1-Cre; CSΔ/Δ: Smarcb1LoxP/LoxP-Pdx1-Cre; KPCΔ/Δ-R26mTmG-Cdh1Cfp: KrasG12DLSL/+-Tp53LoxP/LoxP-Pdx1-Cre-R26mTmG/+-Cdh1Cfp/+; R26CreERT2/+-KPFrt/Frt: R26CreERT2/+-KrasG12DFSF/+-Tp53Frt/Frt; R26Cag-FlpoERT2/+-KPΔ/Δ: R26Cag-FlpoERT2/+-KrasG12DLSL/+-Tp53LoxP/LoxP; R26Cag-FlpoERT2/Cag-LSL-Luc-KPΔ/Δ: R26Cag-FlpoERT2/Cag-LSL-Luc-KrasG12DLSL/+-Tp53LoxP/LoxP; R26Cag-FlpoERT2/+-KPSΔ/Δ: R26Cag-FlpoERT2/+-KrasG12DLSL/+-Tp53LoxP/LoxP-Smarcb1LoxP/LoxP. Correct geneotype was determined by PCR analysis and gel electrophoresis at birth and at death. Males and females were equally represented in experimental cohorts. R26Cag-FlpoERT2/Cag-LSL-Luc-KPΔ/Δ: KrasG12DLSL and R26Cag-LSL-Luc are in cis. No sex bias was introduced during the generation of experimental cohorts.
Somatic lentiviral vectors and other plasmids
To generate pLSM5, a synthetic cassette (Geneart, Life Technologies) containing the U6 promoter and the Cre recombinase sequence under the human keratin 19 promoter (−1,114, +141) flanked by 2 TATA-Frt sites (XbaI-U6-TATA-Frt-EcoRI-hKrt19-NheI-Cre-TATA-Frt-HpaI) was cloned into the XbaI/HpaI site of the pSICO vector. A DNA fragment was liberated by XbaI/KpnI digestion and cloned into the XbaI/KpnI sites of the pLB vector42. The introduction of the TATA box into the Frt sites was designed as previously described43. To generate pLSM2, the human Keratin 19 promoter was cloned into the NotI/NheI sites of the pSICO vector. The Flpo cassette was cloned into the NheI/EcoRI sites of the pSICOR-hKrt19 (pLSM1). A DNA fragment was liberated by KpnI/XbaI digestion and inserted into the KpnI/XbaI sites of the pLB vector to obtain the pLSM2 vector. The shRNA oligos were cloned into the HpaI/XhoI site as previously described43. All the constructs were verified by restriction digestion and sequencing. The pSICO, pSICOR, and pSICO-Flpo were made by T. Jacks31,43. The pLB vector was created by S. Kissler. The pMSCV-LoxP-dsRed-Loxp-eGFP-Puro-WPRE vector was used for virus titration in HEK293 cells and provided by H. Clevers44. All plasmids were obtained through Addgene. The pMSCV-Neo vector was purchased from Clontech. shRNA sequences: Smarcb1-1 (5ʹ-GGAAGAGGTGAATGATAAA-3ʹ), Smarcb1-855 (5ʹ-AGATAGGAACACAAGGCGAAT-3ʹ), Smarcb1-857 (GCCATCCGAAATACCGGAGAT), Atf2 (5ʹ-GAAGTTTCTAGAACGAAATAG-3ʹ), c-Jun (5ʹ-CAGTAACCCTAAGATCCTAAA-3ʹ), Kras (5ʹ-GGAAACAAGTAGTAATTGA-3ʹ), Ern1 (5ʹ-GCTGAACTACTTGAGGAATTA-3ʹ), Mkk4 (5ʹ-CCCATACATTGTTCAGTTCTA-3ʹ), negative control (5ʹ-GCAAGCTGACCCTGAAGTTCAT-3ʹ). To amplify integrated vector from genomic DNA the following oligonucleotides were used: forward, 5ʹ-CCCGGTTAATTTGCATATAATATTTC-3ʹ; reverse, 5ʹ-CATGATACAAAGGCATTAAAGCAG-3ʹ. For constitutive knock-down experiments, the pLKO.1 system was used. Cells were briefly selected in puromycin before experiments. The murine Myc open reading frame was purchased from Genecopoeia and subcloned into the EcoRI/BglII sites of the pMSCV-Neo vector. The pLenti-PKG Gfp-Puro was obtained from Addgene45.
Vectors and experimental design
In the pLSM2-shRNA system/mouse strain, we crossed a latent allele of oncogenic KrasG12DFSF/+ that can be activated by Flpo-mediated recombination with a conditional Tp53Frt/Frt allele that, similarly, can be ablated in a time-restricted, tissue-specific manner by expressing a codon-optimized Flpo recombinase (provided by lentiviral delivery and under a tissue specific promoter)31,34,46. In addition, we introduced a tamoxifen-inducible Cre recombinase (CreERT2) that is expressed in virtually all tissues30.
The pLSM2-shRNA system/vector was designed as follows. The lentiviral vector expresses the codon-optimized Flpo recombinase under the human KRT19 promoter and a constitutive shRNA under the U6 promoter. The entire cassette is flanked by LoxP sites and can be removed by Cre-mediated recombination in a time-restricted manner. The orthotopic injection of the virus results in the activation of oncogenic Kras and inactivation of Tp53 along with the RNAi-mediated depletion of Smarcb1 in the pancreatic epithelial compartment. The treatment with caerulein (performed according to the staggered protocol described previously6), starts 1 week after the viral injection and results in robust activation of a ductal differentiation program in the acinar compartment (acinar ductal metaplasia) and in a proliferative response6. Tamoxifen treatment results in Cre-mediated recombination at the LoxP sites in the genome of the integrated provirus, deletion of the shRNA cassette and restoration of expression of the gene target.
In the pLSM5-shRNA system/mouse strain, we crossed mouse strains carrying a latent oncogenic KrasG12DLSL/+ allele (activated by Cre-mediated recombination) with a conditional Tp53LoxP/LoxP allele (along with a conditional Smarcb1LoxP/LoxP allele in some experiments) that, similarly, can be ablated in a time-restricted, tissue-specific manner by expressing a Cre recombinase (provided by lentiviral delivery)32,36,38. In addition, we introduced a tamoxifen-inducible Flpo recombinase (FlpoERT2) which is expressed in virtually all tissues under a strong promoter (CAG)40.
The pLSM5-shRNA lentiviral vector expresses a codon-optimized Cre recombinase under the human KRT19 promoter and a latent shRNA that can be activated by Flpo-mediated recombination and the deletion of a Frt-Stop-Frt cassette. A TATA-box cassette was introduced into the Frt sites to increase shRNA expression upon Flpo-mediated recombination. The system allows the generation of primary tumours and the depletion of a gene of interest at a desired time.
Virus preparation, lentiviral somatic mosaic GEMM and surgical procedures
Infectious viral particles were produced using psPAX2 and pMD2G helper plasmids. For transfection, 293T cells were cultured in DMEM containing 10% FBS (Gibco), 100 IU ml−1 penicillin (Gibco), 100 μg ml−1 streptomycin (Gibco) and 4 mM caffeine (Sigma-Aldrich) and transfected using the polyethylenimine method. Virus-containing supernatant was collected 48–72 h after transfection, spun at 3,000 r.p.m. for 10 min and filtered through 0.45-μm low-protein-binding filters (Corning)47. High-titre preparations were obtained by multiple rounds of ultracentrifugation at 23,000 r.p.m. for 2 h each. Viral titre was quantified in HEK293T cells stably transduced with a Cre-inducible Gfp reporter44. For orthotopic injections, a previously described protocol was partially modified13. In brief, virus was resuspended in a solution of OPTI-MEM and polybrene (8 μg ml−1). Mice were anaesthetized using a ketamine/xylazine solution (150 mg kg−1 and 10 mg kg−1, respectively). Shaved skin was disinfected with betadine and ethanol and 1-cm incisions were performed through the skin/subcutaneous and muscular/peritoneal layers. The spleen and tail of the pancreas were identified and exposed and multiple injections were performed in the pancreatic tail and body (2–5 × 10⁸ IU per mouse). The muscular/peritoneal planes were closed using continuous absorbable sutures. The skin/subcutaneous planes were closed using interrupted absorbable sutures. Analgesia was achieved with buprenorphine (0.1 mg kg−1 BID). At 7 days after surgery, mice were treated with caerulein as previously described6. Mice were monitored for tumour formation twice per week. For tamoxifen treatment, after tumours were detected, mice were treated with tamoxifen (Sigma) by intraperitoneal injection. A total of 100 μl of tamoxifen solution (15 mg ml−1 in corn oil) was injected every other day, giving five injections in total. Treatment cycles were repeated every 2 weeks if appropriate. In orthotopic secondary transplantation studies, tamoxifen treatment was started 5 days after surgery. For orthotopic transplantations experiments, 2 × 10⁵ cells were resuspended in a 2:1 solution of OPTI-MEM (Gibco) and Matrigel (BD Biosciences, 356231) and transplanted into the tail of the pancreas of 6–9-week-old mice in a single injection (25 μl). For subcutaneous transplantation studies, tumour cells were resuspended in OPTI-MEM (Gibco) and Matrigel (BD Biosciences, 356231) (2:1 dilution) and injected subcutaneously into the flank of 6–9-week-old NCr Nude female mice (Taconic). Liver-seeding experiments were performed as described previously48. Liver weight was measured fresh at necropsy. For transplantation in a limiting dilution, 1 × 10³, 2 × 10² or 2 × 10 tumour cells were resuspended in a 2:1 solution of OPTI-MEM (Gibco) and Matrigel (BD Biosciences, 356231) and injected into the flank of 6–9-week-old NCr Nude female mice (Taconic). Mice were observed for 24–34 weeks. The TIC frequency was calculated using L-Calc Limiting Dilutions Software (Stem Cell Technologies) and expressed as proportion of TIC ± s.e.m.
Antibodies and chemical reagents
The following primary antibodies were used for immunofluorescence, immunohistochemistry and immunoblotting: Phospho-p44/42 MAPK (ERK1/2, Thr202/Tyr204) (D13.14.4E, Cell Signaling Technologies #4370); phospho-MEK1/2 (Ser221, 166F8) (Cell Signaling Technologies #2338), SMARCB1 (Sigma Aldrich # HPA018248); SMARCB1 (BD Transduction Laboratories #612111); Vinculin (E1E9V, Cell Signaling Technologies #13901); vimentin (D21H3, Cell Signaling Technologies #5741); CDH1 (4A2, Cell Signaling Technologies #14472); nestin (rat-401 Millipore #Mab 353); Ki67 (Thermo Scientific #RM9106); Sox9 (Millipore #AB-5535); Pdx1 (Millipore # 06–1385); cleaved caspase 3 (A175, Cell Signaling Technologies #9661); phospho-p38 (D3F9) (Cell Signaling Technologies #4511); p38α (Cell Signaling Technologies #9218); JNK (Cell Signaling Technologies #9252); phospho-JNK (Thr183/Tyr185, 81E11, Cell Signaling Technologies #4668); ATF2 (20F1 Cell Signaling Technologies #9226), phospho-ATF2 (Thr69/71, Cell Signaling Technologies #9225); c-Jun (60A8, Cell Signaling Technologies #9165); phospho-c-Jun (Ser73, D47G9, Cell Signaling Technologies #3270); ubiquitin (Cell Signaling Technologies #3933); IRE1α (14C10, Cell Signaling Technologies #3294); PERK (D11A8, Cell Signaling Technologies #5683); XBP-1 s (D2C1F, Cell signaling Technologies #12782); ATF6 (70B1413, Abcam #11909); ATF6 (NovusBio # NBP1–77251); SEK1/MKK4 (Cell Signaling Technologies #9152); phospho-SEK1/MKK4 (Ser257, C36C11, Cell Signaling Technologies #4514); c-Myc (D3N8F, Cell Signaling Technologies #13987).
The following chemical reagents were used: gemcitabine (LC Laboratories), bortezomib (LC Laboratories), carfilzomib (LC Laboratories), NVP-AUY-922 (LC Laboratories), ganetespib (Selleck Chemicals) SP600125 (LC Labs), BIRB796 (LC Labs), tunicamycin (Selleck Chemicals). Senescence-associated β-galactosidase staining was performed with a senescence β-Galactosidase Staining Kit (Cell Signaling Technologies) according to the manufacturer’s instructions.
Flow cytometry, cell sorting and analysis of protein synthesis ex vivo
Tumour-derived cells and primary lines were cultured in vitro for <5 passages prior to experimentation. Aldefluor-based cell sorting (Stem Cell Technologies) was performed according to the manufacturer’s instructions. Cells showing a fluorescence signal above the average of the diethylaminobenzaldehyde-treated negative controls were considered positive. Protein synthetic rate was assessed using the Click-iT Plus OPP Alexa Fluor 594 Protein Synthesis Assay Kit (Life Technologies) according to the manufacturer’s instructions. The rate of incorporation of OPP was assessed by FACS analysis. Cells cultured in the presence of 20 μM Cycloheximide (Sigma Aldrich) were used as negative technical controls. After staining, samples were acquired using a BD FACS Canto II flow cytometer. Cell sorting experiments were performed using BD Influx cell sorter. For details see ref. 49. Data were analysed by FlowJo (Tree Star).
Patient-derived samples
Patient-derived samples were obtained from patients who had given informed consent under Institutional Review Board (IRB)-approved protocols LAB07–0854 chaired by J.B.F. (UTMDACC) and IRB00044588 chaired by L. D. Wood (JHMI). The establishment of human PDX lines was described in detail previously50,51. Passage-1 PDXs were dissociated using collagenase and dispase (collagenase IV–dispase 4 mg ml−1; Invitrogen) at 37 °C for 1 h and single-cell suspensions were then transduced with a lentiviral GFP reporter (pLenti-PKG GFP-Puro) and transplanted into NOD SCID immunocompromised mice. Experimental cohorts were generated by serial transplantations in vivo.
Tumour cell isolation and culture
Cells were isolated from primary pancreatic tumours as previously described. Cells derived from primary mouse tumours were kept in culture as spheres in semi-solid media for <5 passages. After explant, tumours were digested at 37 °C for 1 h (collagenase IV-dispase 4 mg ml−1; Invitrogen). Single-cell suspensions were plated in DMEM (Lonza) supplemented with 2 mM glutamine (Invitrogen), 10% FBS (Lonza), 40 ng ml−1 hEGF (PeproTech), 20 ng ml−1 hFGF (PeproTech), 5 μg ml−1 h-insulin (Roche), 0.5 μM hydrocortisone (Sigma), 100 μM β-mercaptoethanol (Sigma), 4 μg ml−1 heparin (Sigma), penicillin (Gibco) 100 IU ml−1 and streptomycin (Gibco) 100 μg ml−1. Methocult M3134 (StemCell Technologies) was added to the culture medium to a final concentration of 0.8% (v/v)) to keep tumour cells growing as clonal spheres and not aggregates. Spheres were collected and digested with 0.25% trypsin (Gibco) to single cells and re-plated. For 2D tumour cultures, cells were kept in DMEM containing 10% FBS (Gibco), 100 IU ml−1, penicillin (Gibco) and 100 μg ml−1 streptomycin (Gibco). For in vivo transplantation studies, low-passage (<5) tumour cells were used. For GDAs, single-cell suspensions were generated using collagenase and dispase (collagenase IV–dispase 4 mg ml−1, Invitrogen) and transplanted immediately into recipient mice. Experimental cohorts were generated by serial transplantations in vivo.
Isolation and expansion of primary pancreatic epithelial cells
The following was performed as previously described53 with modifications. Pancreata were harvested and digested at 37 °C for 45 min (collagenase IV, 4 mg ml−1) and passed through a 100-μm nylon cell strainer to separate the acinar fraction from larger ducts. The ductal fraction underwent additional digestion with 0.25% trypsin (Gibco) for 5 min at 37 °C and mechanical disruption. The two fractions were combined and plated on collagen IV-coated plates (Corning) in modified PDEC medium: DMEM/F12 (Gibco), 15 mM HEPES (Invitrogen), 5 mg ml−1 d-glucose (Sigma Aldrich), 1.22 mg ml−1 nicotinamide (Sigma Aldrich), 5 nM 3,3,5-tri-iodo-l-thyronine (Sigma Aldrich), 1 μM dexamethasone (Sigma Aldrich), 100 ng ml−1 cholera toxin (Sigma Aldrich), 5 ml l−1 insulin-transferrin-selenium (BD), penicillin (Gibco), 100 μg ml−1 streptomycin (Gibco), 0.1 mg ml−1 soybean trypsin inhibitor (Sigma Aldrich), 40 ng ml−1 EGF (Sigma Aldrich), 25 μg ml−1 bovine pituitary extract (Invitrogen), 100 μM β-mercaptoethanol (Sigma) and 10% FBS (Gibco). Cells were passaged at low confluency until exhaustion or escaper clones were established.
In vitro treatments
For drug treatments, spheres were collected, washed, digested with trypsin and repeatedly counted (Countless, Invitrogen). Equal numbers of live cells were incubated with bortezomib (5 nM), carfilzomib (5 nM), NVP-AUY-922 (50 nM), ganetespib (50 nM), 4-hydroxy-tamoxifen (250 nM) and tunicamycin (200 nM). Spheroids were manually counted under a Nikon Eclipse Ti microscope using a click-counter. Experiments were repeated at least three times and error bars represent the s.d. of technical replicates from a representative experiment.
In vivo studies and treatment schedules
For orthotopic end point survival studies, 6–9-week-old female mice were transplanted orthotopically with 2 × 10⁵ cells resuspended in a 2:1 solution of OPTI-MEM (Gibco) and Matrigel (BD Biosciences, 356231). GEMM-derived-allografts and PDXs were briefly dissociated and passaged in vivo in NCr Nude and NOD SCID female mice, respectively, to limit the phenotypic changes associated with 2D cultures. Tumour volumes were measured according to the formula l × w2/2, where w represents tumour width. Clinical response was determined as the ratio of tumour volume at the end of the treatment to the volume at the beginning of the treatment. Gemcitabine was administered intraperitoneally at 100 mg kg−1 every 4 days for 16 days; NVP-AUY-922 was administered intraperitoneally at 75 mg kg−1 every other day for 16 days; BIRB796 was administered by oral gavage every second day at 40 mg kg−1 for 16 days; SP600125 was administered intraperitoneally at 40 mg kg−1 every day for 16 days. Gemcitabine was dissolved in phosphate buffer saline, AUY922 was dissolved 10% DMSO/25% water/65% PEG 400, SP600125 was resuspended in PBS and DMSO and BIRB796 was prepared as previously reported54.
MRI and IVIS imaging
Animals were imaged on a 4.7T Bruker Biospec (Bruker BioSpin) equipped with 6-cm inner-diameter gradients and a 35-mm inner-diameter volume coil. Multi-slice T2-weighted images were acquired in coronal and axial geometries using a rapid acquisition with relaxation enhancement (RARE) sequence with TR/TE of 2,000/38 ms, matrix size 256 × 192, 0.75-mm slice thickness, 0.25-mm slice gap, 4 × 3-cm FOV, 101-kHz bandwidth, 3 NEX. Axial scan sequences were gated to reduce respiratory motion. Detection of luciferase activity was performed in an IVIS-100 imaging system. Five minutes before the procedure, mice were injected intraperitoneally with d-luciferin, bioluminescence substrate (Perkin Elmer) according to the manufacturer’s instructions. Living Image 4.3 software (Perkin Elmer) was used for analysis of the images after acquisition.
Immunohistochemistry and immunofluorescence
Tumour samples were fixed in 4% formaldehyde for 24 h at room temperature, moved into 70% ethanol for 12 h, and then embedded in paraffin (Leica ASP300S). After cutting (Leica RM2235) and baking at 60 °C for 20 min for de-paraffinization, slides were treated with Citra-Plus Solution (BioGenex) for antigen unmasking according to the manufacturer’s instructions. For immunohistochemical staining, endogenous peroxidases were inactivated by 3% hydrogen peroxide at room temperature for 15 min. Non-specific signals were blocked using 5% BSA and 5% goat serum for 1 h. Tumour samples were stained with primary antibodies for 12 h at 4 °C and the Mouse on Mouse Kit (Vector Laboratory) was used when appropriate according to the manufacturer’s instructions. For immunostaining, ImmPress (Vector Laboratory) were used as secondary antibodies and Nova RED (Vector Laboratory) was used for detection. Images were captured with a Nikon DS-Fi1 digital camera using a wide-field Nikon Eclipse Ci microscope. For immunofluorescence, secondary antibodies conjugated to Alexa488, Alexa647 and Alexa555 (Molecular Probes) were used. Images were captured with a Hamamatsu C11440 digital camera, using a wide-field Nikon EclipseNi microscope and a Nikon high-speed multi-photon confocal microscope A1 R MP. Total staining score was weighed to the intensity and prevalence (percentage of positive tumour cells and intensity score of 0 to 3) in random fields at 20× magnification. Quantitative analysis was performed using Image J and Immunoratio programs according to the providers’ instructions at 20× original magnification.
Transmission electron microscopy
TEM was performed at the UTMDACC High Resolution Electron Microscopy Facility. Samples were fixed with a solution containing 3% glutaraldehyde plus 2% paraformaldehyde in 0.1 M cacodylate buffer, pH 7.3, for 1 h. After fixation, the samples were washed and treated with 0.1% Millipore-filtered cacodylate-buffered tannic acid, post-fixed with 1% buffered osmium tetroxide for 30 min, and stained en bloc with 1% Millipore-filtered uranyl acetate. The samples were dehydrated in increasing concentrations of ethanol, infiltrated and embedded in LX-112 medium. The samples were polymerized at 60 °C for 2 days. Ultra-thin sections were cut using a Leica Ultracut microtome, stained with uranyl acetate and lead citrate in a Leica EM Stainer and examined using a JEM 1010 transmission electron microscope (JEOL) at an accelerating voltage of 80 kV. Digital images were obtained using an AMT Imaging System (Advanced Microscopy Techniques Corp).
Western blotting
Protein lysates were resolved on 5–15% gradient polyacrylamide SDS gels (Bio-Rad) and transferred onto PVDF membranes (Bio-Rad) according to the manufacturer’s instructions. Membranes were incubated with the indicated primary antibodies, washed in TBST buffer and probed with HRP-conjugated secondary antibodies. The detection of bands was carried out upon chemi-luminescence reaction followed by film exposure (Denville Scientific).
Statistical analysis
In vitro and in vivo data are presented as the mean ± s.d. Results from limiting dilutions analysis (LDA) were expressed as the proportion of TIC ± s.e.m. Differences in stem cell frequencies between groups were determined using a chi-squared test (2-tailed)55,56. Comparisons between biological replicates were performed using a two-tailed Student’s t-test. Results from survival and incidence experiments were analysed with a log-rank (Mantel–Cox) test and expressed as Kaplan–Meier survival curves. Results from contingency tables were analysed using the two-tailed Fisher’s exact test (GraphPad software). Group size was determined on the basis of the results of preliminary experiments. No statistical methods were used to determine sample size. Group allocation and analysis of outcome were not performed in a blinded manner. Samples that did not meet proper experimental conditions were excluded from the analysis.
DNA and RNA isolation, expression profiling and data analysis
DNA and RNA were isolated using DNeasy Blood and Tissue Kit (Qiagen) and RNeasy Mini Kit (Qiagen) according to the manufacturer’s instructions. Gene expression profiling was performed at the UTMDACC Microarray Core Facility on a Gene Chip Mouse Genome 430 2.0 Array (Affymetrix). The robust multi-array average method was used with default options (with background correction, quantile normalization, and log transformation) to normalize raw data from batches using R/Bioconductor’s affy package (12925520) and analysed with GSEA c3.tft.v4.0 (TFT) and c6.all.v4.0. (Oncogenic Signatures); HOMER (20513432) was also used to identify significantly enriched biological pathways or processes for the differentially expressed genes57,58.
Enrichment for subgroup of PDA signature genes
Subgroup information (Classical, QM-PDA, Exocrine-like) for each gene was provided to a heuristic optimization method (stochastic gradient descent) to minimize objective function. The objective function output was used to calculate decision boundaries with a support vector machine approach to optimize the partitioning of subtypes. The obtained microarray signal values for each probe were used for proper classification. The decision surface for multi-class datasets was plotted with Python package matplotlib. To control for random occurrence, we permutated the classification subtypes provided to the stochastic gradient descent function and randomized trainings yield ambiguous classifications, suggesting that gene expression signatures in our model is overlapping with the previous pancreas cancer subgroups.
Data Availability
Clinical and pathological data for patient samples are provided in Supplementary Table 1. Microarray data supporting the findings of this study have been deposited in the Gene Expression Omnibus (GEO; https://www.ncbi.nlm.nih.gov/geo/) under accession number GSE83754. All other data are available from the corresponding author (G.G.) upon reasonable request.
Extended Data
Extended Data Figure 1 |. Molecular characterization of escaper clones.
a, Schematic representation of the experimental workflow. Pancreatic epithelial cells (PEC) were isolated from KrasG12D-mutant pancreata and cultured ex vivo under the selective pressure of oncogenic stress. Serial passaging resulted in two different outputs: senescence or the establishment of escaper clones. b, Representative panels of senescence-associated β-galactosidase staining in pancreatic epithelial cells at passages P4 and P7. c, Far left, representative sections of escaper-derived tumours, haematoxylin and eosin stained, displaying mesenchymal-like or epithelial morphology. Insets show the morphology of the original clone in 2D culture. Mid-left to far right, immunohistochemical staining for the EMT markers vimentin, nestin and CDH1, respectively, in tumours derived from EPI and MS-L transplants. d, Assessment of clonogenic growth in 3D in vitro (n = 4 per group). Data are mean ± s.d. of technical replicates (one representative experiment of three). MS-L cells show an enhanced ability to form spheres in methylcellulose-based semi-solid culture medium. e, TIC frequency of EPI and MS-L cells as assessed by limiting dilution experiments in immunocompromised (NCr Nude) mice. Two individual clones per group were tested (EPI#1: n = 19, EPI#2: n = 23, MS-L#1: n = 20, MS-L#2: n = 20). TIC was calculated using the L-Calc software. Data are the mean proportion of TICs ± s.e.m. ***P < 0.001, ****P < 0.0001 by two-tailed chi-squared test. f, Representative pictures of livers from mice orthotopically injected with EPI or MS-L cells. g, Volcano plot showing the number of differentially expressed genes between EPI and MS-L escapers. h, GSEA enrichment analysis plots for gene sets upregulated in EPI (top) and MS-L (bottom) escaper cells. EPI escapers display enrichment for Kras- and Mek-driven transcriptomic gene signatures, MS-L escapers are characterized by the perturbation of transcriptomic targets of the SWI/SNF chromatin remodelling factor Smarcb1 and dysregulation of genetic programs involved in progression through the cell cycle. i, Immunohistochemical profile of EPI and MS-L escapers and validation of the transcriptomic analysis. EPI escapers exhibit robust MAPK signalling, as assessed with antibodies specific for phospho-p44/42 MAPK (ERK1/2) (Thr202/Tyr204) and phospho-MEK1/2 (Ser221); by contrast, MS-L escapers display a lack of MAPK signalling activation, downregulation of SMARCB1 levels and an increase in the proliferative index assessed by Ki67 staining. Scale bars: 100 μm (c, i).
Extended Data Figure 2 |. Isolation and functional characterization of epithelial and mesenchymal clones from primary tumours in a conditional reporter GEMM of PDAC.
a, Schematic model of the GEMM. KrasG12DLSL/+-Tp53LoxP/LoxP-Pdx1-Cre (KPCΔ/Δ) mice were crossed with a strain expressing a lineage-tracing fluorescent reporter (R26mTmG) and a strain expressing a Cdh1Cfp reporter, in which CFP (cyan fluorescent protein) is expressed as a fusion protein with endogenous E-cadherin to generate the KPCΔ/Δ-R26mTmG/+-Cdh1Cfp/+ dual-reporter model of PDAC. This system allows the isolation of GFP-positive malignant cells and the separation of CFPhigh (epithelial) from CFPlow (mesenchymal) sub-populations. b, FACS experiment showing the distribution of CFPhigh and CFPlow sub-populations in both the GFP+ (tumour cells) compartment and the TdTomato+ (stromal) compartment. The reporter shows an absence of CFP+ cells in the stromal (TdTomato+) compartment and a spectrum of sub-populations in the tumour (GFP+) compartment. c, Western blot analysis of the expression levels of SMARCB1 in the GFP+CFPhigh and GFP+CFPlow sub-populations. Vinculin was used as loading control. d, Representative sections showing the levels of SMARCB1, CDH1 and phospho-ERK1/2 in orthotopic transplants of malignant sub-populations, isolated as described above. MS-L-derived transplants were used as controls. e, In vivo characterization of the PDAC sub-populations in the KPCΔ/Δ-R26mTmG/+ model of PDAC. Immunofluorescence staining for GFP, SMARCB1, phospho-ERK1/2 and nestin in PDAC originated in the KPCΔ/Δ-R26mTmG/+ background strain. Low levels of SMARCB1 and phospho-ERK1/2 and high levels of nestin are a hallmark of the sub-population of invasive GFP+ cells. Scale bars: 100 μm (d; e, bottom nine panels), 20 μm (e, top four panels). For gel source data, see Supplementary Figures.
Extended Data Figure 3 |. Functional characterization of a Kras/Smarcb1 axis in the maintenance of epithelial identity and in mesenchymal reprograming.
a, RNAi-mediated knockdown of Kras in EPI-derived orthotopic transplants achieved with a lentiviral-based technology results in aggressive tumours that faithfully recapitulate the biological behaviour of MS-L transplants. Kaplan–Meier survival analysis of NCr Nude mice transplanted with MS-L escapers and EPI escapers transduced with either shCtrl or shKras constructs (n = 5 per group). Tumours emerging in the Kras-depleted group display longer latencies; however, once established, they faithfully recapitulate the behaviour of MS-L tumours in secondary transplants. b, TIC frequencies for shCtrl and shKras reprogrammed EPI escapers assessed by limiting dilution transplantation studies in immunocompromised (NCr Nude) mice (EPI and shCtrl: n = 27; EPI and shKras: n = 25) and calculated using the L-Calc software. Data are the mean proportion of TICs ± s.e.m. c, Transcript levels for Kras and Smarcb1 in EPI cells transduced with shCtrl or shKras constructs assessed by qPCR 96 h after transduction. RNAi-mediated depletion of Kras results in an acute drop in the levels of Smarcb1 (n = 3). Data are mean ± s.d. of technical replicates (one representative experiment out of three). d, Immunohistochemical quantification of the levels of phospho- ERK1/2 and SMARCB1 in tumours generated by EPI cells transduced with shCtrl or shKras constructs. Depletion of Kras results in tumours characterized by lack of activation of the MAPK signalling and a profound drop in the levels of nuclear SMARCB1. e, Western blot analysis of the expression of SMARCB1, E-cadherin (CDH1) and nestin in EPI, MS-L clones and EPI clones re-programmed with lentiviral-based shRNAs against Smarcb1 (sh1 and sh855). Vinculin was used as loading control. f, Liver-seeding assay for the quantification of metastatic potential. Liver weight of NCr Nude mice that receievd an intra-splenic injection of EPI cells infected with a lentiviral vector harbouring a control shRNA or a shRNA against Smarcb1 (sh855). MS-L cells were used as positive controls (n = 5 per group). Data are mean ± s.d. of biological replicates. RNAi-mediated ablation of Smarcb1 results in higher metastatic burden. g, Kaplan–Meier analysis of survival of NCr Nude mice orthotopically injected with EPI cells that were infected with a lentiviral vector harbouring a control shRNA or a shRNA against Smarcb1 (sh855). MS-L cells were used as positive control (n = 5 per group). h, Ablation of Smarcb1 in the pancreatic epithelia potently co-operates with mutant KrasG12D in driving aggressive tumours with full penetrance and a median latency of 5–7 weeks. Kaplan–Meier survival analysis. Pdx1-Cre-KrasG12DLSL/+-Smarcb1LoxP/LoxP (KSCΔ/Δ), n = 29; Pdx1-Cre-KrasG12DLSL/+-Tp53LoxP/+\LoxP (KPCΔ/Δ), n = 42; Pdx1-Cre-Smarcb1LoxP/LoxP (CSΔ/Δ), n = 21; Pdx1-Cre-KrasG12DLSL/+(KC), n = 36; Pdx1-Cre-KrasG12DLSL/+-Tp53LoxP/LoxP-Smarcb1LoxP/LoxP (KPSCΔ/Δ), n = 16). KSCΔ/Δ versus KC, P < 0.0001; KPSCΔ/Δ versus KSCΔ/Δ, P < 0.0001; KPSCΔ/Δ versus KPCΔ/Δ, P < 0.0001 by Mantel–Cox log-rank test. i, TIC frequency in Smarcb1-ablated tumours (KSCΔ/Δ, KPSCΔ/Δ) compared to the Smarcb1-proficient background (KPCΔ/Δ), as assessed by limiting-dilution transplantation experiments in NCr Nude mice (KPCΔ/Δ, n = 20; KSCΔ/Δ, n = 20; KPSCΔ/Δ, n = 18) and calculated using the L-Calc software. Data shown as the mean proportion of TICs ± s.e.m. j, Liver weight of NCr Nude mice receiving intra-splenic transplants of low-passage tumour cells isolated from KPCΔ/Δ-R26Cag-LSL-Luc/+, KSCΔ/Δ-R26Cag-LSL-Luc/+ and KPSCΔ/Δ-R26Cag-LSL-Luc/+ tumours (n = 10 per group). Data are mean ± s.d. of biological replicates. k, Top, representative luciferase images for liver-seeding assays described in j. The intensity of the signal is proportional to the metastatic burden. Colour scale bar is a reference for the intensity of the luminescence signal. Bottom panels show representative images of low-passages tumour cells in 2D. Original image magnification, ×20. Cells lacking Smarcb1 are loosely cohesive and characterized by a prominent mesenchymal morphology and a propensity for growth in suspension. l, Immunohistochemical profile of Smarcb1-deficient tumours (KSCΔ/Δ) compared to Smarcb1-proficient lesions (KC, KPCΔ/Δ) and wild-type (Wt) pancreata. Samples were stained for the EMT markers vimentin, nestin and CDH1. Normal wild-type pancreata, pre-neoplastic lesions from the KC background and PDAC from the KPCΔ/Δ background were used as controls. At 8–10 weeks old, mice were killed and pancreata/pancreatic lesions were collected. Hallmarks of Smarcb1-ablated tumours are the complete loss of CDH1 and the robust expression of the mesenchymal markers vimentin and nestin when compared to neoplastic and pre-malignant lesions originating in the Smarcb1-proficient backgrounds (KC and KPCΔ/Δ). m, Histopathological grade distribution in conditional GEMMs of PDAC (KPCΔ/Δ, n = 28; KSCΔ/Δ, n = 29; KPSCΔ/Δ, n = 15). n, Spherogenic potential of low-passage spheroids obtained from tumours arising in the KPCΔ/Δ, KSCΔ/Δ and KPSCΔ/Δ genetic background (n = 3 per group). Data are mean ± s.d. of technical replicates (one representative experiment out of three). o, Representative gross image of a KSCΔ/Δ mouse at necropsy. p, FACS analysis for the putative stem-cell marker aldefluor in freshly isolated tumour cells from the KC, KPCΔ/Δ, KSCΔ/Δ and KPSCΔ/Δ backgrounds. Diethylaminobenzaldehyde-treated cells were used as negative control. Smarcb1-deficient cells display a robust increase in the relative number of aldefluor positive cells. For gel source data see Supplementary figures. NS, not significant; *P < 0.05, ** P < 0.01, *** P < 0.001, ****P < 0.0001, by Mantel–Cox log-rank test (a, g), two-tailed chi-squared test (b, i), unpaired two-tailed t-test (f, j) or two-tailed Fisher’s exact test (m). Scale bars: 100 μm (d, l).
Extended Data Figure 4 |. Smarcb1 restrains the expansion of mesenchymal clones in PDAC.
a, Schematic showing the lentiviral construct for Flpo-mediated tissue-specific, time-restricted gene inactivation in vivo (pLSM5). High-titre-purified lentiviral particles (2–5 × 10⁸ IU) were introduced surgically into the tail of the pancreas. At 7 days after surgery, mice were treated with caerulein to induce inflammation, proliferation and the expression of genes under the Krt19 promoter in the acinar compartment. The tissue specificity is provided by the human Krt19 promoter driving the expression of the Cre recombinase resulting in the activation of the latent mutant KrasG12DLSL/+, the inactivation of the conditional Tp53LoxP allele and the activation of the R26CAG-LSL-Luc reporter. The time-restricted activation of the shRNA is mediated by the ubiquitous R26Cag-FlpoERT2 inducible, codon-optimized Flpo recombinase upon tamoxifen treatment and removal of the Krt19-Cre stopper cassette, which is flanked by TATA-Frt sites. b, Representative panels showing the gross appearance of pancreata of KPΔ/Δ-R26mTmG/+ mice orthotopically injected with 108 viral particles, treated with caerulein 7 days after surgery and killed at the 3 weeks (left) or 3 months (right). Arrow indicates mosaic activation of the GFP reporter at 3 weeks. Arrowhead indicates GFP+ tumour nodules at 3 months. TdT, TdTomato. c, Kaplan–Meier analysis of tumour incidence in KPΔ/Δ-R26mTmG/+ mice orthotopically injected with 108 particles of the pLSM5-K19-Cre vector and assigned to caerulein and vehicle treatment. Caerulein treatment resulted in increased tumour incidence and decreased latency when compared to vehicle control (n = 18 per group). d, Representative luciferase images (left) and pathological characterization (right) of tumours generated with lentiviral-mosaic-somatic technology (R26Cag-FlpoERT2/Cag-LSL-Luc-KPΔ/Δ-pLSM5-shSmarcb1-1 or R26Cag-FlpoERT2/Cag-LSL-Luc-KPΔ/Δ-pLSM5-shSmarcb1-855). Orthotopic tumours harbouring latent Flpo/Frt-dependent, tamoxifen-inducible shRNAs against Smarcb1 were generated into a Kras-mutant, Tp53-deficient background (KPΔ/Δ). Mice were monitored weekly for tumour growth by bioluminescence imaging and lesions were characterized by immunophenotypic analysis for pancreatic lineage-differentiation markers before functional studies. e, Expression levels of SMARCB1 and nestin in short-term cultures established from tumours generated in R26Cag-FlpoERT2/Cag-LSL-Luc-KPΔ/Δ-pLSM5-shSmarcb1 mice assessed by western blot. Protein lysates were collected 96 h after 4-OHT (4-hydroxytamoxifen) treatment. Vinculin was used as loading control. f, Representative images of liver metastasis stained for haematoxylin and eosin from tamoxifen- and vehicle-treated R26Cag-FlpoERT2/Cag-LSL-Luc-KPΔ/Δ-pLSM5-shSmarcb1-855 mice. Tamoxifen-driven acute ablation of Smarcb1 in vivo results in poorly differentiated, invasive lesions. g, Spherogenic potential of low-passage spheroids obtained from R26Cag-FlpoERT2/Cag-LSL-Luc- KPΔ/Δ-pLSM5-shSmarcb1-1 and R26Cag-FlpoERT2/Cag-LSL-Luc-KPΔ/Δ-pLSM5-shSmarcb1-855 tumours upon treatment with 4-hydroxytamoxifen or vehicle control (n = 3 per group). Data are mean ± s.d. of technical replicates (one representative experiment out of three). The acute ablation of Smarcb1 results in a robust increase of the clonogenic potential in the KPΔ/Δ background. h, TIC frequency of KPΔ/Δ-R26Cag-FlpoERT2/Cag-LSL-Luc-pLSM5-shSmarcb1-1 and R26Cag-FlpoERT2/Cag-LSL-Luc-KPΔ/Δ-pLSM5-shSmarcb1-855 tumours upon treatment with vehicle or tamoxifen assessed by limiting-dilution experiments in immunocompromised (NCr Nude) mice (sh1 and vehicle, n = 25; sh1 and tamoxifen, n = 20; sh855 and vehicle, n = 19; sh855 and tamoxifen, n = 19) and calculated using the L-Calc software. Data are mean proportion of TIC ± s.e.m. i, j, Metastatic burden assesses by counting the number of superficial liver, peritoneal and lung metastases in NCr Nude mice transplanted orthotopically with R26Cag-FlpoERT2/Cag-LSL-Luc- KPΔ/Δ-pLSM5-shSmarcb1-1 or R26Cag-FlpoERT2/Cag-LSL-Luc-KPΔ/Δ-pLSM5-shSmarcb1-855 tumours assigned to vehicle or tamoxifen treatment. Acute ablation of Smarcb1 resulted in a higher metastatic burden (n = 7 per group). Data are mean ± s.d. of biological replicates. k, Kaplan–Meier survival analysis of NCr Nude mice orthotopically transplanted with R26Cag-FlpoERT2/Cag-LSL-Luc- KPΔ/Δ-pLSM5-shSmarcb1-1 or R26Cag-FlpoERT2/Cag-LSL-Luc-KPΔ/Δ-pLSM5-shSmarcb1-855 tumours (n = 7 per group). Tamoxifen treatment was started 5 days after surgery. Acute ablation of Smarcb1 resulted in more aggressive tumours and a significantly shorter overall survival. l, Representative ex-vivo bioluminescence images in NCr Nude mice orthotopically transplanted with R26Cag-FlpoERT2/Cag-LSL-Luc-KPΔ/Δ-pLSM5-shSmarcb1-855 tumours and assigned to vehicle or tamoxifen treatment. Arrows indicate metastatic liver disease. m, Schematic showing the lentiviral construct for Cre-mediated, tissue-specific, time-restricted restoration of a gene of interest in vivo (pLSM2). High-titre-purified lentiviral particles (2–5 × 10⁸ IU) are introduced surgically into the pancreas of KrasG12DFSF/+-Tp53Frt/Frt-R26CreERT2/+ mice to generate the R26CreERT2/+-KPFrt/Frt-pLSM2-shSmarcb1 model. 7 days after surgery, mice were treated with caerulein. The tissue specificity is provided by the human Krt19 promoter, which drives the expression of the Flpo recombinase, resulting in the activation of the latent mutant KrasG12DFSF/+ and the inactivation of the conditional Tp53Frt allele along with the constitutive expression of an shRNA under the U6 promoter. The time-restricted restoration of the gene of interest is mediated by the R26CreERT2 ubiquitous CreERT2 strain upon tamoxifen treatment and removal of the cassette containing the shRNA flanked by LoxP sites. n, Left, T2-weighted MRI scans of tumour-bearing mice 19 weeks after orthotopic injection with the pLSM2 lentiviral system carrying two shRNAs specific for murine Smarcb1. The tumours extensively invade the abdominal cavity. Right, immuno-phenotype of a tumour induced with pLSM2-shSmarcb1. Poorly cohesive, undifferentiated tumour cells express the pancreatic-specific markers Pdx1 and Sox9, suggestive of a pancreatic epithelial cell of origin. o, Kaplan–Meier analysis of tumour incidence in R26CreERT2/+-KPFrt/Frt mice challenged with orthotopic injections of the pLSM2-shSmarcb1 and pLSM2-shCtrl constructs. Knockdown of Smarcb1 in the mosaic model system results in higher penetrance and shorter latency (R26CreERT2/+-KPFrt/Frt-pLSM2-shSmarcb1, n = 53; R26CreERT2/+-KPFrt/Frt-pLSM2-shCtrl, n = 39). p, Quantification of the metastatic burden in R26CreERT2/+-KPFrt/Frt-pLSM2-shSmarcb1 mice versus R26CreERT2/+-KPFrt/Frt-pLSM2-shCtrl mice, assessed by counting the combined number of liver, lung and peritoneal metastases (R26CreERT2/+-KPFrt/Frt-pLSM2-shSmarcb1, n = 23; R26CreERT2/+-KPFrt/Frt-pLSM2-shCtrl, n = 5). Data are mean ± s.d. of biological replicates. q, PCR from recombined and un-recombined genomic DNA isolated from vehicle- and tamoxifen-treated tumour-bearing mice. Genomic DNA was extracted 5 and 10 days after treatment in vivo. r, Kaplan–Meier survival analysis of R26CreERT2/+-KPFrt/Frt-pLSM2-shSmarcb1 tumours transplanted orthotopically in syngeneic C57BL/6 recipient mice (n = 5 per vehicle and d18 groups, n = 7 per d1 group). Early tamoxifen treatment and Smarcb1 restoration resulted in a significant and durable improvement in survival. s, Metastatic burden was estimated by counting the number of liver, peritoneal and lung metastasis in the experimental cohorts described in r (n = 5 per vehicle and Txd18 groups, n = 7 per Txd1 group). The early restoration of Smarcb1 greatly reduced the number of metastatic foci, suggesting that its deficiency is a requirement in tumour dissemination. Data are mean ± s.d. of biological replicates. NS, not significant; *P < 0.05, **P < 0.01, ***P < 0.001, ****P < 0.0001, by Mantel–Cox log-rank test (c, k, o, r), two-tailed chi-squared test (h) or unpaired two-tailed t-test (i, j, p, s). Scale bars: 100 μm (b, d, f, n). For gel source data, see Supplementary Figures.
Extended Data Figure 5 |. Transcriptomic and proteomic profiles of mesenchymal tumours.
a, The robust-multi-array-average-normalized probe signal levels from microarray data for each gene previously identified as pancreatic cancer classifiers14. Smarcb1-ablated tumours and mesenchymal clones display enrichment for the QM-PDA gene signature. b, Acute restoration of Smarcb1 in pancreatic tumours generated in R26CreERT2/+-KPFrt/Frt-pLSM2-shSmarcb1-855 mice results in the dysregulation of Myc transcriptomic targets and genes involved in global protein metabolism and global response to stress. Heat maps show the enrichment for specific gene ontology pathways in vehicle-treated tumours when compared with tamoxifen-treated, Smarcb1-restored tumours. Lesions were collected 10 days after treatment. c, Myc transcriptomic targets and genes involved in global protein metabolism and response to stress are enriched in MS-L escaper clones. d, Quantification of protein biosynthesis by OPP-incorporation analysis using FACS. Representative plots from Smarcb1-ablated and restored cultures established from GEMM-derived tumours. Cycloheximide (Chx)-treated cultures were used as negative controls. e, Western blot analysis for SMARCB1, Myc and ER-stress-response pathway proteins from independent tumours upon tamoxifen-mediated Smarcb1 restoration compared to vehicle controls and tumours generated from EPI and MS-L escapers. Vinculin was used as loading control. Tumours generated with the somatic technology were harvested 10 days after tamoxifen or vehicle treatment. Robust activation of the IRE1-α/MKK4 and IRE1-α/XBP-1 pathways is readily apparent. f, GSEA scores for the Atf2 signature in Smarcb1-ablated/deficient models. Left, vehicle versus tamoxifen-treated R26CreERT2/+-KPFrt/Frt-pLSM2-shSmarcb1-855 tumour-bearing mice; right, Atf2 gene-signature enrichment in MS-L escapers as compared to EPI. g, Immunohistochemical analysis of protein expression for SMARCB1, phospho-ATF2, and JUN in surgically resected human PDAC samples with high and low levels of SMARCB1. Images are of representative sections; scale bars: 100 μm. h, Kaplan–Meier analysis of survival in surgically resected PDAC patients with available follow-up data segregated according to the expression levels of phospho-ATF2 (phospho-ATF2 score, 2–3+, n = 55; phospho-ATF2 score, 0–1, n = 79). Activation of the stress-response factor ATF2 results in reduced post-operative survival. P < 0.0001 by Mantel–Cox log-rank test. i, Bar plots for the relative abundance of phospho-ATF2 immuno-staining in SMARCB1-deficient and SMARCB1-proficient human pancreatic cancer. An inverse correlation in the expression levels of SMARCB1 and phospho-ATF2 in human PDAC is apparent (SMARCB1+ n = 138, SMARCB1− n = 16). P < 0.0001 by two-tailed Fisher’s exact test. For gel source data, see Supplementary Figures.
Extended Data Figure 6 |. The proto oncogene Myc is a master regulator in the Smarcb1 transcriptomic network.
a, Schematic model of Myc-rescue experiments. Short-term cultures from R26CreERT2/+-KPFrt/Frt-pLSM2-shSmarcb1-855 tumours were transduced with a Myc-expressing lentiviral vector and briefly selected. A LacZ expression vector was used as negative control. Cells were injected orthotopically into syngeneic mice assigned to either tamoxifen or vehicle treatment. b, Kaplan–Meier analysis of survival in mice transplanted with R26CreERT2/+-KPFrt/Frt-pLSM2-shSmarcb1-855 tumours rescued with Myc or LacZ and assigned to vehicle or tamoxifen treatment (n = 5 per group). c, Quantification of nestin+ areas in LacZ-control and Myc-reprogrammed R26CreERT2/+-KPFrt/Frt-pLSM2-shSmarcb1-855 tumours (n = 12 per group). Enforced expression of Myc resulted in a marked increase in the number of nestin+ cells per section and in the maintenance of a mesenchymal state. Data are mean ± s.d. of biological replicates. d, Representative haematoxylin and eosin (left) and nestin staining (right) of R26CreERT2/+-KPFrt/Frt-pLSM2-shSmarcb1-855 tumours rescued with Myc or LacZ. Myc overexpression keeps the cells in a mesenchymal state upon tamoxifen treatment. e, Myc overexpression rescues the steady-state levels of protein biosynthesis in Smarcb1-restored cells assessed by OPP incorporation and FACS analysis from freshly isolated tumour cells. f, Representative haematoxylin and eosin (left) and nestin staining (right) from EPI cells transduced with Myc or LacZ. Myc overexpression fully reprograms EPI clones, generating anaplastic, mesenchymal tumours. g, Kaplan–Meier analysis of survival in mice transplanted with EPI cells transduced with Myc or LacZ. MS-L cells were used as positive controls (n = 5 per group). Myc transduced EPI transplants faithfully recapitulate the aggressive behaviour of MS-L tumours. h, Functional rescues studies using a Myc- or LacZ-expressing vector. Western blot analysis showing that the sustained overexpression of Myc in Smarcb1 restored cells and in EPI clones engages the Jnk/Atf2 stress response pathway. Vinculin was used as loading control. i, Representative TEM sections from Smarcb1-proficient and Smarcb1-deficient tumours generated with the somatic conditional model and the stochastic model and rescued with Myc and LacZ, respectively. The sustained overexpression of Myc fully rescues the ultra-structural findings observed in the Smarcb1-deficient settings. Arrow indicates cytoplasmic fibres. NS, not significant; **P < 0.01, ****P < 0.001, by Mantel–Cox log-rank test (b, g) or unpaired two-tailed t-test (c). Scale bars: 100 μm (d, f); 4 μm (i, ×5,000); 500 nm (i, ×25,000). For gel source data, see Supplementary Figures.
Extended Data Figure 7 |. Genetic extinction of the ER-stress response pathway is lethal in Smarcb1-deficient PDAC.
a, Orthotopic primary tumours harbouring latent Flpo/Frt-dependent, tamoxifen-inducible shRNAs against Ern1 (shown as Ire1-α) were generated into the KPSΔ/Δ background (R26Cag-FlpoERT2/+-KPSΔ/Δp-LSM5-shIre1α or R26Cag-FlpoERT2/+-KPSΔ/Δ-pLSM5-shCtrl). Mice with palpable masses were assigned to tamoxifen or vehicle treatment. b, Western blot analysis of short-term cultures established from the model described above. 4-Hydroxytamoxifen treatment results in the robust knockdown of Ern1. Lysates were harvested 96 h after 4-hydroxytamoxifen treatment. Vinculin was used as loading control. c, Spherogenic assay after acute RNAi-mediated depletion of Ern1 achieved by 4-hydroxytamoxifen treatment (n = 3 per group). Impairment of clonal growth is observed in 4-hydroxytamoxifen-treated, Ern1-depleted spheroids as compared to vehicle-treated cells and shCtrl. Data are mean ± s.d. of technical replicates (one representative experiment out of three). d, Kaplan–Meier survival analysis of R26Cag-FlpoERT2/+-KPSΔ/Δ-pLSM5-shIre1α and R26Cag-FlpoERT2/+-KPSΔ/Δ-pLSM5-shCtrl GEMMs after tamoxifen treatment. Continuous line, tamoxifen-treated mice; interrupted line, vehicle-treated mice (shErn1 and vehicle, n = 7; shErn1 and tamoxifen, n = 12; shCtrl and vehicle, n = 8; shCtrl and tamoxifen, n = 8). Ern1 extinction results in a robust improvement in overall survival. e, Western blot analysis showing that the RNAi-mediated ablation of Ern1 in a Smarcb1-deficient background and in Myc-reprogrammed EPI cells results in a marked decrease in the activity of Mkk4 kinase and its downstream effectors. Vinculin was used as loading control. Ern1 has an essential role in the engagement of the stress response pathway. Tunicamycin-treated EPI cells were used as positive control. f, Spherogenic assay for EPI, MS-L escapers and EPI-Myc escapers upon RNAi-mediated genetic depletion of Ern1 (n = 3 per group). Data are mean ± s.d. of technical replicates (one representative experiment out of three). g, Kaplan–Meier analysis of survival of NCr Nude mice orthotopically injected with EPI, MS-L and Myc-reprogrammed EPI cells expressing a lentiviral-based shErn1. Knockdown of Ern1 is lethal in MS-L- and Myc-EPI-derived tumours but shows no effect in EPI tumours transduced with LacZ (n = 5 per group). h, Histological analysis of primary pancreatic tumours from the R26Cag-FlpoERT2/+-KPSΔ/Δ-pLSM5-shIre1α GEMM treated with tamoxifen or vehicle. Depletion of Ern1 in Smarcb1-deficient tumours results in a profound apoptotic response (assessed by staining for cleaved caspase-3 (CC3)) and in residual epithelial remnants. Engagement of the JNK/p38 pathway in vivo was assessed by phospho-Atf2 staining. i, Histological analysis of pancreatic tumours resulting from orthotopic transplants of MS-L or EPI-Myc cells transduced with shIre1α or shCtrl vectors. Depletion of Ern1 in MS-L and Myc-EPI tumours results in a profound apoptotic response (assessed by staining for CC3) and in residual epithelial remnants. NS, not significant; **P < 0.01, ****P < 0.0001, by Mantel–Cox log-rank test (d, g). Scale bars: 100 μm (h, i). For gel source data, see Supplementary figures.
Extended Data Figure 8 |. Genetic extinction of the JNK/p38 stress response pathway is lethal in a Smarcb1-deficient context.
a, Orthotopic tumours harbouring latent Flpo/Frt-dependent, tamoxifen-inducible shRNAs against Mkk4, Atf2 and Jun were generated in the KPSΔ/Δ mouse background (R26Cag-FlpoERT2/+-KPSΔ/Δ-pLSM5-shMkk4, R26Cag-FlpoERT2/+-KPSΔ/Δ-pLSM5-shAtf2, R26Cag-FlpoERT2/+-KPSΔ/Δ-pLSM5-shJun, andR26Cag-FlpoERT2/+-KPSΔ/Δ-pLSM5-shCtrl). Tumour-bearing mice were assigned to tamoxifen or vehicle treatment. b, Western blot analysis for MKK4 levels in ex vivo cultures generated from R26Cag-FlpoERT2/+-KPSΔ/Δ-pLSM5-shMkk4 tumours. Protein lysates were isolated 96 h after vehicle or 4-hydroxytamoxifen treatment. Vinculin was used as loading control. c, Histological analysis of primary tumours from the R26Cag-FlpoERT2/+-KPSΔ/Δ-pLSM5-shMkk4 backgrounds treated with vehicle or tamoxifen and collected after 10 or 15 days of treatment. Engagement of the Jnk/p38/Atf2 pathway and apoptosis were assessed by phospho-Atf2 and cleaved caspase 3 (CC3) staining, respectively. d, Spherogenic assays for short-term spheroid cultures generated from the R26Cag-FlpoERT2/+-KPSΔ/Δ-pLSM5-shMkk4, R26Cag-FlpoERT2/+-KPSΔ/Δ-pLSM5-shAtf2, R26Cag-FlpoERT2/+-KPSΔ/Δ-pLSM5-shJun, and R26Cag-FlpoERT2/+-KPSΔ/Δ-pLSM5-shCtrl tumours (n = 3 per group). Treatment with 4-hydroxytamoxifen results in the impairment of 3D growth. Data are mean ± s.d. of technical replicates (one representative experiment out of three). e, Knockdown efficiency of Atf2 and Jun in tumour lysates collected after 10 days from tamoxifen treatment, as assessed by western blot. Vinculin and actin B were used as loading controls for Atf2 and Jun, respectively. f, g, Kaplan–Meier survival analysis of primary tumours (f) and orthotopic transplants (g) from R26Cag-FlpoERT2/+-KPSΔ/Δ-pLSM5-shAtf2, R26Cag-FlpoERT2/+-KPSΔ/Δ-pLSM5-shJun, andR26Cag-FlpoERT2/+-KPSΔ/Δ-pLSM5-shCtrl GEMMs. Continuous line, tamoxifen-treated mice; interrupted line, vehicle-treated mice (n = 8 per group). h, Histological analysis of primary tumours from the R26Cag-FlpoERT2/+-KPSΔ/Δ-pLSM5-shAtf2, R26Cag-FlpoERT2/+-KPSΔ/Δ-pLSM5-shJun, and R26Cag-FlpoERT2/+-KPSΔ/Δ-pLSM5-shCtrl tumour-bearing mice treated with vehicle or tamoxifen and collected at the beginning of the treatment, or after 10 or 15 days of treatment. i, Immunohistochemical analysis for Atf2, Jun and CC3 in sections obtained from R26Cag-FlpoERT2/+-KPSΔ/Δ-pLSM5-shAtf2 and R26Cag-FlpoERT2/+-KPSΔ/Δ-pLSM5-shJun tumour-bearing mice assigned to vehicle or tamoxifen treatment. Apoptosis was assessed by CC3 staining. Tumours were collected 10 days after the beginning of the treatment. j, k, Spherogenic assays for MS-L and EPI spheroids transduced with lentiviral shRNA specific for Mkk4, Jun or Atf2 (n = 3 per group). Knock-down of Mkk4, Jun or Atf2 impairs the growth potential in vitro of MS-L cells with minimal effects on EPI cells. Data are mean ± s.d. of technical replicates (one representative experiment out of three for both groups). l, m, Kaplan–Meier survival analysis of NCr Nude mice orthotopically transplanted with EPI and MS-L cells transduced with lentiviral shRNA specific for murine Mkk4, Atf2 and Jun. shCtrl vector transduced cells were used as negative control (n = 5 per group). NS, not significant; * P < 0.05, **P < 0.01, ****P < 0.0001, by Mantel–Cox log-rank test (f, g, l, m). Scale bars: 100 μm (c, h, i). For gel source data, see Supplementary Figures.
Extended Data Figure 9 |. Genetic ablation of Mkk4 kinase delays tumour growth in the KPΔ/Δ background.
a, Orthotopic tumours harbouring latent Flpo/Frt-dependent, tamoxifen-inducible shRNAs against Mkk4 were generated in a Kras-mutant, Tp53-deficient, Smarcb1-intact background (KPΔ/Δ). Tumour-bearing mice were assigned to tamoxifen or vehicle treatment. b, Kaplan–Meier survival analysis of R26Cag-FlpoERT2/+-KPΔ/Δ-pLSM5-shMkk4 (n = 8 per group), and R26Cag-FlpoERT2/+-KPΔ/Δ-pLSM5-shCtrl (n = 5 per group) GEMMs. Continuous line, tamoxifen-treated mice; interrupted line, vehicle-treated mice. NS, not significant, ****P < 0.0001 by Mantel–Cox log-rank test. c, d, Histological analysis of primary tumours from the R26Cag-FlpoERT2/+-KPΔ/Δ-pLSM5-shMkk4 or control backgrounds treated with vehicle or tamoxifen and collected after 10 days of treatment. Apoptotic response was assessed by immunostaining for CC3. Scale bars: 100 μm.
Extended Data Figure 10 |. Pharmacological manipulation of proteostasis is lethal in a Smarcb1-deficient genetic context.
a, b, In vitro 3D growth assay for Smarcb1-proficient and Smarcb1-deficient murine PDAC lines (n = 3 per group). Pharmacological treatment with proteasome and HSP90 inhibitors results in the marked impairment of clonogenic growth in Smarcb1-deficient background with limited efficacy in Smarcb1-proficient models. Data are mean ± s.d. of technical replicates (one representative experiment out of three). c, Kaplan–Meier survival analysis of NCr Nude mice orthotopically transplanted with Smarcb1-deficient and Smarcb1-proficient cells and treated with the HSP90 inhibitor AUY922 or vehicle control (EPI, MS-L, KC, KPCΔ/Δ, KPSCΔ/Δ: n = 5 per group; KSCΔ/Δ: n = 7 per group). P values were calculated using the Mantel–Cox log-rank test. d, Representative panels of Smarcb1-proficient (EPI) and Smarcb1-deficient (MS-L, KSCΔ/Δ, KPSCΔ/Δ) tumour-bearing mice treated with AUY922 or vehicle control; tumours were collected after 10 days of treatment. Top, haematoxylin and eosin staining. Bottom, CC3 staining, showing that impairment of the unfolded-protein response results in the induction of apoptotic cell death. Arrows indicate protein aggregates. e, Kaplan–Meier survival analysis of tumour-bearing mice transplanted orthotopically with Smarcb1-deficient KPSCΔ/Δ cells and assigned to one of four treatment arms: vehicle (n = 5); AUY922 (n = 5); BIRB796 and SP600125 (n = 5); or AUY922, BIRB796 and SP600125 (n = 10). **P < 0.01, ****P < 0.0001 by Mantel–Cox log-rank test. f, The apoptotic response associated with the treatments was assessed by CC3 staining. Stress-response engagement was assessed by phospho-Atf2 staining. g, Representative sections from orthotopic PDX transplants treated with gemcitabine, AUY922 or a combination of gemcitabine and AUY922. Apoptotic response was assessed by CC3 staining. Scale bars: 100 μm (d, f, g).
Supplementary Material
Acknowledgements
We thank D. Spring, A. Futreal, P. Jones, J. Marszalek, I. Watson, Y. Lissanu Deribe, K. Rai and J. Horner for discussions and suggestions. We thank A. Petrocchi, E. Di Francesco, E. Paul and T. Tieu for providing reagents. We wish to thank the members of the Chin, DePinho and Draetta labs for discussions and reagents; K. Dunner, Jr. and the High Resolution Electron Microscopy Facility at MDACC for TEM (Cancer Center Core Grant CA16672); M. Keith, C. Kingsley, the MDACC Small Animals Imaging Facility, the UTMDACC Microarray Core Facility, the MDACC Department of Veterinary Medicine and the UTMDACC Flow Facility. L.C. was supported by the CPRIT R1204 and NIH 5 U01 CA141508. G.F.D. was supported by the AACR 14-90-25 and by the Sheikh Ahmed Bin Zayed Al Nahyan Center for Pancreatic Cancer Grant. A.C. was supported by the FIRC (Fondazione Italiana per la Ricerca sul Cancro) Fellowship. G.G. was supported by the FIRC fellowship.
Footnotes
Supplementary Information is available in the online version of the paper.
The authors declare no competing financial interests.
Readers are welcome to comment on the online version of the paper.
Reviewer Information Nature thanks Z. Ronai and the other anonymous reviewer(s) for their contribution to the peer review of this work.
References
- 1.Hanahan D & Weinberg RA Hallmarks of cancer: the next generation. Cell 144, 646–674 (2011). [DOI] [PubMed] [Google Scholar]
- 2.Nieto MA, Huang RY, Jackson RA & Thiery JP Emt: 2016. Cell 166, 21–45 (2016). [DOI] [PubMed] [Google Scholar]
- 3.Pisco AO & Huang S Non-genetic cancer cell plasticity and therapy-induced stemness in tumour relapse: ‘What does not kill me strengthens me’. Br. J. Cancer 112, 1725–1732 (2015). [DOI] [PMC free article] [PubMed] [Google Scholar]
- 4.Rhim AD et al. EMT and dissemination precede pancreatic tumor formation. Cell 148, 349–361 (2012). [DOI] [PMC free article] [PubMed] [Google Scholar]
- 5.Kopp JL et al. Identification of Sox9-dependent acinar-to-ductal reprogramming as the principal mechanism for initiation of pancreatic ductal adenocarcinoma. Cancer Cell 22, 737–750 (2012). [DOI] [PMC free article] [PubMed] [Google Scholar]
- 6.Morris JP IV, Cano DA, Sekine S, Wang SC & Hebrok M β-catenin blocks Kras-dependent reprogramming of acini into pancreatic cancer precursor lesions in mice. J. Clin. Invest 120, 508–520 (2010). [DOI] [PMC free article] [PubMed] [Google Scholar]
- 7.Lee KE & Bar-Sagi D Oncogenic KRas suppresses inflammation-associated senescence of pancreatic ductal cells. Cancer Cell 18, 448–458 (2010). [DOI] [PMC free article] [PubMed] [Google Scholar]
- 8.Reichert M et al. Isolation, culture and genetic manipulation of mouse pancreatic ductal cells. Nat. Protocols 8, 1354–1365 (2013). [DOI] [PMC free article] [PubMed] [Google Scholar]
- 9.Isakoff MS et al. Inactivation of the Snf5 tumor suppressor stimulates cell cycle progression and cooperates with p53 loss in oncogenic transformation. Proc. Natl Acad. Sci. USA 102, 17745–17750 (2005). [DOI] [PMC free article] [PubMed] [Google Scholar]
- 10.Barbie DA et al. Systematic RNA interference reveals that oncogenic KRAS-driven cancers require TBK1. Nature 462, 108–112 (2009). [DOI] [PMC free article] [PubMed] [Google Scholar]
- 11.Creighton CJ et al. Activation of mitogen-activated protein kinase in estrogen receptor α-positive breast cancer cells in vitro induces an in vivo molecular phenotype of estrogen receptor α-negative human breast tumors. Cancer Res 66, 3903–3911 (2006). [DOI] [PubMed] [Google Scholar]
- 12.Ma Y, Croxton R, Moorer RL Jr & Cress WD Identification of novel E2F1-regulated genes by microarray. Arch. Biochem. Biophys 399, 212–224 (2002). [DOI] [PubMed] [Google Scholar]
- 13.Chiou SH et al. Pancreatic cancer modeling using retrograde viral vector delivery and in vivo CRISPR/Cas9-mediated somatic genome editing. Genes Dev 29, 1576–1585 (2015). [DOI] [PMC free article] [PubMed] [Google Scholar]
- 14.Collisson EA et al. Subtypes of pancreatic ductal adenocarcinoma and their differing responses to therapy. Nat. Med 17, 500–503 (2011). [DOI] [PMC free article] [PubMed] [Google Scholar]
- 15.Noll EM et al. CYP3A5 mediates basal and acquired therapy resistance in different subtypes of pancreatic ductal adenocarcinoma. Nat. Med 22, 278–287 (2016). [DOI] [PMC free article] [PubMed] [Google Scholar]
- 16.Signer RA, Magee JA, Salic A & Morrison SJ Haematopoietic stem cells require a highly regulated protein synthesis rate. Nature 509, 49–54 (2014). [DOI] [PMC free article] [PubMed] [Google Scholar]
- 17.Hart LS et al. ER stress-mediated autophagy promotes Myc-dependent transformation and tumor growth. J. Clin. Invest 122, 4621–4634 (2012). [DOI] [PMC free article] [PubMed] [Google Scholar]
- 18.Lin JH et al. IRE1 signaling affects cell fate during the unfolded protein response. Science 318, 944–949 (2007). [DOI] [PMC free article] [PubMed] [Google Scholar]
- 19.Urano F et al. Coupling of stress in the ER to activation of JNK protein kinases by transmembrane protein kinase IRE1. Science 287, 664–666 (2000). [DOI] [PubMed] [Google Scholar]
- 20.Chen Y & Brandizzi F IRE1: ER stress sensor and cell fate executor. Trends Cell Biol 23, 547–555 (2013). [DOI] [PMC free article] [PubMed] [Google Scholar]
- 21.Chien W et al. Selective inhibition of unfolded protein response induces apoptosis in pancreatic cancer cells. Oncotarget 5, 4881–4894 (2014). [DOI] [PMC free article] [PubMed] [Google Scholar]
- 22.Gao H et al. High-throughput screening using patient-derived tumor xenografts to predict clinical trial drug response. Nat. Med 21, 1318–1325 (2015). [DOI] [PubMed] [Google Scholar]
- 23.Siolas D & Hannon GJ Patient-derived tumor xenografts: transforming clinical samples into mouse models. Cancer Res 73, 5315–5319 (2013). [DOI] [PMC free article] [PubMed] [Google Scholar]
- 24.Aparicio S, Hidalgo M & Kung AL Examining the utility of patient-derived xenograft mouse models. Nat. Rev. Cancer 15, 311–316 (2015). [DOI] [PubMed] [Google Scholar]
- 25.Carugo A et al. In vivo functional platform targeting patient-derived xenografts identifies WDR5-Myc association as a critical determinant of pancreatic cancer. Cell Reports 16, 133–147 (2016). [DOI] [PubMed] [Google Scholar]
- 26.Singh A et al. A gene expression signature associated with “K-Ras addiction” reveals regulators of EMT and tumor cell survival. Cancer Cell 15, 489–500 (2009). [DOI] [PMC free article] [PubMed] [Google Scholar]
- 27.Agaimy A The expanding family of SMARCB1(INI1)-deficient neoplasia: implications of phenotypic, biological, and molecular heterogeneity. Adv. Anat. Pathol 21, 394–410 (2014). [DOI] [PubMed] [Google Scholar]
- 28.Agaimy A, Rau TT, Hartmann A & Stoehr R SMARCB1 (INI1)-negative rhabdoid carcinomas of the gastrointestinal tract: clinicopathologic and molecular study of a highly aggressive variant with literature review. Am. J. Surg. Pathol 38, 910–920 (2014). [DOI] [PubMed] [Google Scholar]
- 29.Agaimy A et al. Pancreatic undifferentiated rhabdoid carcinoma: KRAS alterations and SMARCB1 expression status define two subtypes. Mod. Pathol 28, 248–260 (2015). [DOI] [PubMed] [Google Scholar]
- 30.Ventura A et al. Restoration of p53 function leads to tumour regression in vivo. Nature 445, 661–665 (2007). [DOI] [PubMed] [Google Scholar]
- 31.Young NP & Jacks T Tissue-specific p19Arf regulation dictates the response to oncogenic K-ras. Proc. Natl Acad. Sci. USA 107, 10184–10189 (2010). [DOI] [PMC free article] [PubMed] [Google Scholar]
- 32.Jackson EL et al. Analysis of lung tumor initiation and progression using conditional expression of oncogenic K-ras. Genes Dev 15, 3243–3248 (2001). [DOI] [PMC free article] [PubMed] [Google Scholar]
- 33.Cheung AF, Dupage MJ, Dong HK, Chen J & Jacks T Regulated expression of a tumor-associated antigen reveals multiple levels of T-cell tolerance in a mouse model of lung cancer. Cancer Res 68, 9459–9468 (2008). [DOI] [PMC free article] [PubMed] [Google Scholar]
- 34.Lee CL et al. Generation of primary tumors with Flp recombinase in FRT-flanked p53 mice. Dis. Model. Mech 5, 397–402 (2012). [DOI] [PMC free article] [PubMed] [Google Scholar]
- 35.Muzumdar MD, Tasic B, Miyamichi K, Li L & Luo L A global double-fluorescent Cre reporter mouse. Genesis 45, 593–605 (2007). [DOI] [PubMed] [Google Scholar]
- 36.Roberts CW, Leroux MM, Fleming MD & Orkin SH Highly penetrant, rapid tumorigenesis through conditional inversion of the tumor suppressor gene Snf5. Cancer Cell 2, 415–425 (2002). [DOI] [PubMed] [Google Scholar]
- 37.Hingorani SR et al. Preinvasive and invasive ductal pancreatic cancer and its early detection in the mouse. Cancer Cell 4, 437–450 (2003). [DOI] [PubMed] [Google Scholar]
- 38.Marino S, Vooijs M, van Der Gulden H, Jonkers J & Berns A Induction of medulloblastomas in p53-null mutant mice by somatic inactivation of Rb in the external granular layer cells of the cerebellum. Genes Dev 14, 994–1004 (2000). [PMC free article] [PubMed] [Google Scholar]
- 39.Kawaguchi Y et al. The role of the transcriptional regulator Ptf1a in converting intestinal to pancreatic progenitors. Nat. Genet 32, 128–134 (2002). [DOI] [PubMed] [Google Scholar]
- 40.Lao Z, Raju GP, Bai CB & Joyner AL MASTR: a technique for mosaic mutant analysis with spatial and temporal control of recombination using conditional floxed alleles in mice. Cell Rep 2, 386–396 (2012). [DOI] [PMC free article] [PubMed] [Google Scholar]
- 41.Snippert HJ et al. Intestinal crypt homeostasis results from neutral competition between symmetrically dividing Lgr5 stem cells. Cell 143, 134–144 (2010). [DOI] [PubMed] [Google Scholar]
- 42.Kissler S et al. In vivo RNA interference demonstrates a role for Nramp1 in modifying susceptibility to type 1 diabetes. Nat. Genet 38, 479–483 (2006). [DOI] [PubMed] [Google Scholar]
- 43.Ventura A et al. Cre-lox-regulated conditional RNA interference from transgenes. Proc. Natl Acad. Sci. USA 101, 10380–10385 (2004). [DOI] [PMC free article] [PubMed] [Google Scholar]
- 44.Koo BK et al. Controlled gene expression in primary Lgr5 organoid cultures. Nat. Methods 9, 81–83 (2011). [DOI] [PubMed] [Google Scholar]
- 45.Campeau E et al. A versatile viral system for expression and depletion of proteins in mammalian cells. PLoS One 4, e6529 (2009). [DOI] [PMC free article] [PubMed] [Google Scholar]
- 46.Young NP, Crowley D & Jacks T Uncoupling cancer mutations reveals critical timing of p53 loss in sarcomagenesis. Cancer Res 71, 4040–4047 (2011). [DOI] [PMC free article] [PubMed] [Google Scholar]
- 47.Genovese G et al. microRNA regulatory network inference identifies miR-34a as a novel regulator of TGF-β signaling in glioblastoma. Cancer Discov 2, 736–749 (2012). [DOI] [PMC free article] [PubMed] [Google Scholar]
- 48.Winslow MM et al. Suppression of lung adenocarcinoma progression by Nkx2–1. Nature 473, 101–104 (2011). [DOI] [PMC free article] [PubMed] [Google Scholar]
- 49.Beerling E et al. Plasticity between epithelial and mesenchymal states unlinks emt from metastasis-enhancing stem cell capacity. Cell Reports 14, 2281–2288 (2016). [DOI] [PMC free article] [PubMed] [Google Scholar]
- 50.Kim MP et al. Molecular profiling of direct xenograft tumors established from human pancreatic adenocarcinoma after neoadjuvant therapy. Ann. Surg. Oncol 19 (Suppl. 3), S395–S403 (2012). [DOI] [PMC free article] [PubMed] [Google Scholar]
- 51.Kim MP et al. Generation of orthotopic and heterotopic human pancreatic cancer xenografts in immunodeficient mice. Nat. Protocols 4, 1670–1680 (2009). [DOI] [PMC free article] [PubMed] [Google Scholar]
- 52.Viale A et al. Oncogene ablation-resistant pancreatic cancer cells depend on mitochondrial function. Nature 514, 628–632 (2014). [DOI] [PMC free article] [PubMed] [Google Scholar]
- 53.Agbunag C, Lee KE, Buontempo S & Bar-Sagi D Pancreatic duct epithelial cell isolation and cultivation in two-dimensional and three-dimensional culture systems. Methods Enzymol 407, 703–710 (2006). [DOI] [PubMed] [Google Scholar]
- 54.Rudalska R et al. In vivo RNAi screening identifies a mechanism of sorafenib resistance in liver cancer. Nat. Med 20, 1138–1146 (2014). [DOI] [PMC free article] [PubMed] [Google Scholar]
- 55.Quintana E et al. Efficient tumour formation by single human melanoma cells. Nature 456, 593–598 (2008). [DOI] [PMC free article] [PubMed] [Google Scholar]
- 56.Bonnefoix T, Bonnefoix P, Verdiel P & Sotto JJ Fitting limiting dilution experiments with generalized linear models results in a test of the single-hit Poisson assumption. J. Immunol. Methods 194, 113–119 (1996). [DOI] [PubMed] [Google Scholar]
- 57.Subramanian A et al. Gene set enrichment analysis: a knowledge-based approach for interpreting genome-wide expression profiles. Proc. Natl Acad. Sci. USA 102, 15545–15550 (2005). [DOI] [PMC free article] [PubMed] [Google Scholar]
- 58.Ashburner M et al. ; The Gene Ontology Consortium. Gene ontology: tool for the unification of biology. Nat. Genet 25, 25–29 (2000). [DOI] [PMC free article] [PubMed] [Google Scholar]
Associated Data
This section collects any data citations, data availability statements, or supplementary materials included in this article.
Supplementary Materials
Data Availability Statement
Clinical and pathological data for patient samples are provided in Supplementary Table 1. Microarray data supporting the findings of this study have been deposited in the Gene Expression Omnibus (GEO; https://www.ncbi.nlm.nih.gov/geo/) under accession number GSE83754. All other data are available from the corresponding author (G.G.) upon reasonable request.


