. 2020 Nov 3;9:e61245. doi: 10.7554/eLife.61245

Figure 5. The MIM complex facilitates mitophagy through the loading of Atg43 to the MOM.

(A, B) Crude cell lysates (input) were prepared from cells co-expressing GFP-fused Mim2 or Mim1 with (+) or without (–) FLAG-tagged Atg43. Anti-FLAG immunoprecipitants (IP: FLAG) were analyzed by immunoblotting. (C, E) The indicated strains co-expressing GFP-Atg43 and Tuf1-mRFP were grown in EMM for microscopy. (D) The indicated strains expressing Tuf1-mRFP were collected at the indicated time points after shifting to nitrogen starvation medium and were used for immunoblotting. (F) The indicated strains co-expressing a GFP-fused C-terminal truncated form of Atg43 (Atg43ΔC60-GFP) and Tuf1-mRFP were grown in EMM for microscopy. (G) Wild-type, mim1Δ, mim2Δ, and tom70Δ cells co-expressing GBP-fused Fis1 and GFP-fused Atg43 lacking the 60 C-terminal aa (Atg43ΔC60-GFP) were collected at the indicated time points after shifting to nitrogen starvation medium. Cells were then used for immunoblotting. Histone H3 was used as a loading control (LC) for immunoblotting. Scale bars represent 5 µm. BF, bright-field image.

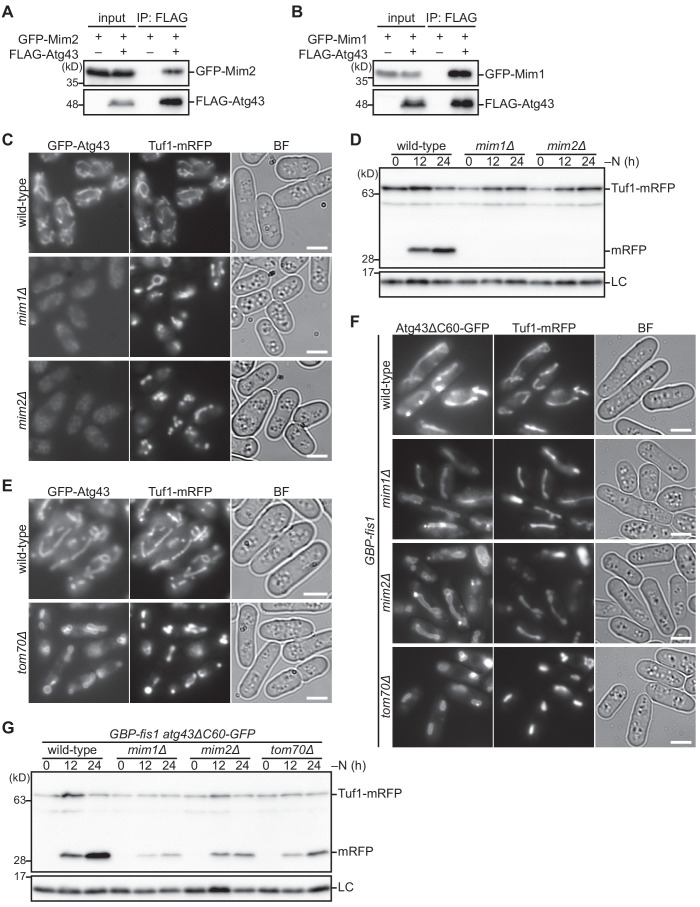
Figure 5.

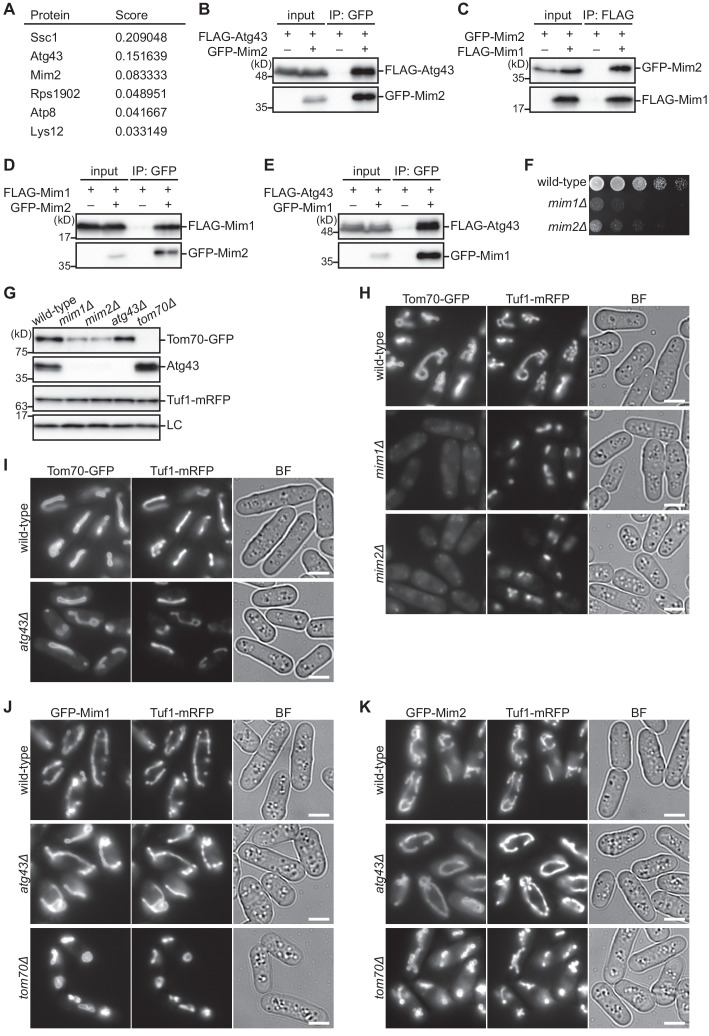
Figure 5—figure supplement 1. The MIM complex facilitates the mitochondrial localization of Atg43 and Tom70.

Figure 5—figure supplement 1.

(A) Identification of Mim2 as an Atg43-binding protein. Mass spectrometric analysis of proteins co-purified with the 80 C-terminal aa of Atg43 with a FLAG tag was conducted. Wild-type cells expressing untagged Atg43 were used as a negative control. The value (score) represents the relative protein abundance as expressed by spectral abundance factor (SAF). Mim2 was identified along with 37 peptide-spectrum matches, at a targeted false discovery rate (FDR) of 1.0% at the peptide level. (B–E) Atg43 interacts with the MIM complex. Immunoprecipitation experiments were conducted using crude cell lysates (input) prepared from cells with (+) or without (–) expression of the indicated proteins. Anti-FLAG (IP: FLAG) and anti-GFP (IP: GFP) immunoprecipitants were analyzed by immunoblotting. (F) The indicated strains were grown in EMM, and their serial dilutions were spotted onto solid YES medium for the growth assay. (G) Atg43 is unstable in the absence of the MIM complex. The indicated strains co-expressing Tom70-GFP and Tuf1-mRFP were grown in EMM for immunoblotting. Histone H3 was used as a loading control (LC). (H, I) Mitochondrial localization of Tom70 requires the MIM complex but does not require Atg43. The indicated strains co-expressing GFP-tagged Tom70 with Tuf1-mRFP were grown in EMM for microscopy. (J, K) Mitochondrial localization of the MIM complex is independent of Atg43 and Tom70. The indicated strains co-expressing Tuf1-mRFP with GFP-tagged Mim1 (J) or Mim2 (K) were grown in EMM for microscopy. Scale bars denote 5 µm. BF, bright-field image.