

Summary
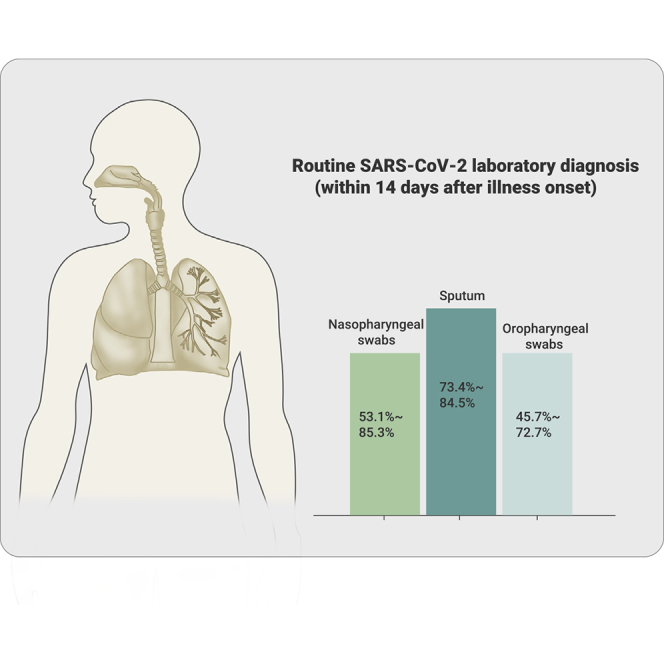
The worldwide epidemic of coronavirus disease 2019 (COVID-19) is ongoing. Rapid and accurate detection of the causative virus SARS-CoV-2 is vital for the treatment and control of COVID-19. In this study, the comparative sensitivity of different respiratory specimen types were retrospectively analyzed using 3,552 clinical samples from 410 COVID-19 patients confirmed by Guangdong CDC (Center for Disease Control and Prevention). Except for bronchoalveolar lavage fluid (BALF), the sputum possessed the highest positive rate (73.4%–87.5%), followed by nasal swabs (53.1%–85.3%) for both severe and mild cases during the first 14 days after illness onset (d.a.o.). Viral RNA could be detected in all BALF samples collected from the severe group within 14 d.a.o. and lasted up to 46 d.a.o. Moreover, although viral RNA was negative in the upper respiratory samples, it was also positive in BALF samples in most cases from the severe group during treatment. Notably, no viral RNA was detected in BALF samples from the mild group. Despite typical ground-glass opacity observed via computed tomographic scans, no viral RNA was detected in the first three or all upper respiratory tract specimens from some COVID-19 patients. In conclusion, sputum is most sensitive for routine laboratory diagnosis of COVID-19, followed by nasal swabs. Detection of viral RNA in BALF improves diagnostic accuracy in severe COVID-19 patients.
Keywords: SARS-CoV-2, COVID-19, molecular diagnosis, respiratory specimens, viral shedding
Graphical Abstract
Public Summary
-
•
Detecting SARS-CoV-2 RNA in sputum was most sensitive for routine laboratory diagnosis of COVID-19, followed by nasopharyngeal swabs
-
•
Viral shedding profiles of the upper and lower respiratory tract were significantly different between severe and mild cases
-
•
Detection of viral RNA in BALF (bronchoalveolar lavage fluid) improves diagnostic accuracy in severe cases
-
•
Computed tomography (CT) scan may serve as a complementary tool for the molecular diagnosis
Introduction
The outbreak of coronavirus disease 2019 (COVID-19) caused by the novel coronavirus, designated as SARS-CoV-2, was first reported at the end of 2019.1,2 Globally, as of May 27, 2020, a total of 8,366,417 confirmed cases of COVID-19, including 450,087 deaths, had been reported to WHO (WHO COVID-19 Dashboard), and the numbers are still increasing rapidly. Clinical features varied in different individuals, and some patients showed asymptomatic infection.3, 4, 5, 6, 7 Recent studies have confirmed the efficient human to human transmission of SARS-CoV-2.7, 8, 9, 10 More importantly, asymptomatic cases could also transmit the virus to close contacts, which makes it more difficult to control the spread of the virus.9 Therefore, rapid and accurate detection of the causative virus SARS-CoV-2 is vital for the control and treatment of COVID-19.
In the early stage of the disease outbreak, diagnosis of the cases was mostly from lower respiratory tract specimens (usually bronchoalveolar lavage fluid [BALF]).5 However, collection of the lower respiratory samples requires both a suction device and a skilled operator, which is also a painful process for the patients. Therefore, BALF samples are not feasible for routine laboratory diagnosis and monitoring of SARS-CoV-2. Instead, collection of nasopharyngeal swabs, oropharyngeal swabs, and sputum is rapid, simple, and safe. Accordingly, elucidating the diagnostic sensitivity of different sample types is crucial for the laboratory diagnosis and monitoring of the viral shedding of SARS-CoV-2. Moreover, no data on the difference of viral shedding between the upper and lower respiratory tract specimens are currently available. In this study, we investigated the diagnostic sensitivity of respiratory samples, and compared the viral shedding patterns in the upper and lower respiratory tracts in severe and mild cases. We believe our results are of great importance for the laboratory diagnosis and treatment of patients with SARS-CoV-2.
Results
Profile of Patients and Samples in This Study
Altogether, a total of 3,552 respiratory specimens from 410 patients were serially collected during hospitalization, including 559 oropharyngeal swabs, 2,231 nasopharyngeal swabs, 696 sputum samples, and 66 BALF samples. Of these patients, 90 were severe or critically ill cases (severe group), and 320 were mild and moderate cases (mild group) (Table 1). The severe group aged from 31 to 86 years with a median age of 60.5, and most patients were in the 45–64 (58.9%) and ≥65 (27.8%) age groups (Table 1). In the mild group, the median age was 41.5 years with a range of 2–81. Unlike the cases in the severe group, most of the cases in the mild group were within the 15–44 (45%) and 45–64 (36.2%) age groups. The number of male patients (65.6%) was significantly higher in severe group. The median days after illness onset (d.a.o.) of the collection of the first specimen was 6 and 5 for the severe and mild groups, respectively (Table 1). The median number of specimens collected from each patient was 10 and 7 for the severe and mild groups, respectively (Table 1).
Table 1.
Baseline Characteristics and Specimens of COVID-19 Cases in This Study
| Characteristic | COVID-19 Cases |
|||
|---|---|---|---|---|
| Total (N = 410) | Severe (N = 90) | Mild (N = 320) | p Value | |
| Median age (range) | 47.5 (2–86) | 60.5 (31–86) | 41.5 (2–81) | <0.0001 |
| Age subgroup (N, %) | 410 | 90 | 320 | |
| <15 years | 29 (7.1) | 0 (0) | 29 (9.1) | 0.0008 |
| 15–44 years | 156 (38.0) | 12 (13.3) | 144 (45) | 0.0004 |
| 45–64 years | 169 (41.1) | 53 (58.9) | 116 (36.2) | 0.0002 |
| ≥65 years | 56 (13.7) | 25 (27.8) | 31 (9.7) | <0.0001 |
| Male (n, %) | 193 (47.1) | 59 (65.6) | 134 (41.9) | <0.0001 |
| Co-existing chronic medical conditions (n, %) | 120 (29.3) | 75 (83.3) | 45 (14.1) | <0.0001 |
| Onset to admission, median days (IQR) | 3 (1.5–6) | 4 (2.25–7) | 3 (1–5) | 0.0077 |
| Onset to antiviral treatment, median days (IQR) | 3 (2–6) | 4 (3–7) | 3 (2–6) | 0.0034 |
| Sample types (N, %) | 3,552 | 1,132 | 2,420 | |
| Oropharyngeal swabs | 559 (15.7) | 231 (20.4) | 328 (13.6) | <0.0001 |
| Nasopharyngeal swabs | 2,231 (62.8) | 617 (54.5) | 1,614 (66.7) | <0.0001 |
| Sputum | 696 (19.6) | 222 (19.6) | 474 (19.6) | >0.9999 |
| BALF | 66 (1.9) | 62 (5.5) | 4 (0.2) | <0.0001 |
| Median d.a.o. of first specimen collection (IQR) | 5 (3–8) | 6 (4–8.75) | 5 (2–8) | 0.4888 |
| Median number of specimens for each patient (IQR) | 8 (5–12) | 10 (8–17) | 7 (5–11) | <0.0001 |
| 0–7 d.a.o. | 1 (0–3) | 1 (0–2.75) | 1 (0–3) | 0.9397 |
| 8–14 d.a.o. | 2 (1–4) | 3 (2–5) | 2 (1–3) | <0.0001 |
| ≥15 d.a.o. | 4 (2–7) | 7 (2–11.75) | 3 (2–6) | <0.0001 |
d.a.o., days after illness onset; COVID-19, coronavirus disease 2019; IQR, interquartile range.
Detection of SARS-CoV-2 in Different Respiratory Samples from COVID-19 Cases
The different types of specimens from laboratory-confirmed COVID-19 cases were stratified into three groups based on the collection times: 0–7, 8–14, and ≥15 d.a.o. Quantitative reverse transcription polymerase chain reaction (qRT-PCR) assays were performed for each specimen and the results are shown in Figure 1 and Table 2. In the 0–7 d.a.o. group, the sputum samples showed the highest positive rate in both the severe and mild groups (87.5% and 82.6%), followed by nasopharyngeal swabs (85.3% and 62.1%), and then the oropharyngeal swabs (72.7% and 53.2%) (Figure 1; Table 2). The sputum samples collected during 8–14 d.a.o. also showed the highest positive rate in both severe (74.4%) and mild (73.4%) groups. Of note, the positive rate of oropharyngeal swabs was only 48.1% in the severe group and 45.7% in the mild group (Table 2). BALF samples collected within the first 2 weeks (0–7 and 8–14 d.a.o. groups) in the severe group were 100% positive, while negative in the mild group. Sputum, nasopharyngeal swabs, and oropharyngeal swabs collected from both groups ≥15 d.a.o. showed similar positive rate within each group, while BALF maintained a high positive rate of 63.8% in the severe group. Furthermore, the viral loads (indicated as Ct values) and positive rates in COVID-19 patients gradually decreased during disease progression. Moreover, the viral loads were significantly higher in nasopharyngeal swabs collected 8–14 and ≥15 d.a.o. from cases in the severe group compared with those in the mild group (Table 2).
Figure 1.

Detection of SARS-CoV-2 RNA in Respiratory Specimens of COVID-19 Cases
Respiratory specimens, including BALF, sputum, nasopharyngeal swabs, and oropharyngeal swabs were collected from 410 COVID-19 patients at different time points after onset of illness. The positive rates of different sample types and the Ct values are shown in (A) and (B). Mean and minimum to maximum Ct values are shown. p values between 0.01–0.05, 0.001–0.01, and 0.0001–0.001 were considered statistically significant (∗), very significant (∗∗), and extremely significant (∗∗∗), respectively.
Table 2.
Detection of SARS-CoV-2 RNA in Respiratory Specimens from COVID-19 Cases
| Collection Date | Sample Types | COVID-19 Cases |
||
|---|---|---|---|---|
| Severe | Mild | p Values | ||
| 0–7 d.a.o. | ||||
| Positive rate (n/N, %) | oropharyngeal | 40/55 (72.7) | 84/158 (53.2) | 0.0116 |
| nasopharyngeal | 58/68 (85.3) | 195/314 (62.1) | 0.0002 | |
| sputum | 14/16 (87.5) | 38/46 (82.6) | >0.9999 | |
| BALF | 2/2 (100.0) | 0/0 (0) | >0.9999 | |
| Ct values (median; range) | oropharyngeal | 29.5 (18.86–36.32) | 29.50 (15.46–37.38) | 0.8957 |
| nasopharyngeal | 29.3 (19.19–37.66) | 29 (14.57–38) | 0.1974 | |
| Sputum | 26 (19–32.2) | 28 (17.94–38) | 0.2707 | |
| BALF | 22.5 (21–24) | – | N/A | |
| 8–14 d.a.o. | ||||
| Positive rate (n/N, %) | oropharyngeal | 39/81 (48.1) | 48/105 (45.7) | 0.7685 |
| nasopharyngeal | 117/170 (68.8) | 241/454 (53.1) | 0.0004 | |
| Sputum | 29/39 (74.4) | 80/109 (73.4) | >0.9999 | |
| BALF | 13/13 (100) | 0/2 (0) | 0.0095 | |
| Ct values (median; range) | oropharyngeal | 30.22 (20.73–36.25) | 31.1 (20.81–37.06) | 0.5956 |
| nasopharyngeal | 30.92 (19.7–38) | 32.74 (18.44–38) | <0.0001 | |
| Sputum | 30 (15.42–38) | 31.23 (19.66–38) | 0.221 | |
| BALF | 27 (19–35) | – | N/A | |
| ≥15 d.a.o. | ||||
| Positive rate (n/N, %) | oropharyngeal | 30/95 (31.6) | 14/65 (21.5) | 0.4621 |
| nasopharyngeal | 129/379 (34.0) | 192/846 (22.7) | <0.0001 | |
| Sputum | 64/167 (38.3) | 94/319 (29.5) | 0.053 | |
| BALF | 30/47 (63.8) | 0/2 (0) | 0.375 | |
| Ct values (median; range) | oropharyngeal | 34.6 (24.27–38) | 34.8 (27.84–38) | 0.5651 |
| nasopharyngeal | 33.36 (21.8–38) | 35 (23.71–38) | 0.0257 | |
| Sputum | 33.32 (23–38) | 35.2 (19–38) | 0.0967 | |
| BALF | 31 (20–37) | – | N/A | |
N/A, not applicable; BALF, bronchoalveolar lavage fluid; d.a.o., days after illness onset.
Different Viral Shedding Profiles in the Upper and Lower Respiratory Tracts in COVID-19 Cases
Serial samples from both upper (marked in green) and lower (BALF, marked in black) respiratory tracts from 21 COVID-19 patients were collected and analyzed (Figure 2). The patients were also grouped into severe (N = 18, marked in red) and mild (N = 3, marked in black) groups, and the detection results of viral RNA are shown in Figure 2. For the cases in the severe group, viral RNA could be detected in the upper respiratory tract samples from 15 cases, while not in cases 02, 06, and 07. Viral RNA in BALF could be detected as early as 4 d.a.o., with low Ct values in severe cases, and the duration varied from 20 (case 10) to 46 (case 12) d.a.o. Of note, although viral RNA was negative in the upper respiratory tract of some cases (cases 01, 03, 07, 11, 12, 13, and 16), it was also positive in BALF during disease progression. With regard to the three cases in the mild group, viral RNA was only detected in the upper respiratory samples, but not in the BALF samples.
Figure 2.

Serial Detection of Viral RNA in Different Sites of the Respiratory Tract from 21 COVID-19 Cases
Numbers of cases from severe and mild groups are marked in red and black, respectively. The detection results of samples from the upper respiratory tract are in green, and from the lower respiratory tract (BALF) in black. Lower cycle threshold (Ct) values indicate higher viral loads. The black and red arrows indicate hospital admission and the start of antiviral treatment, respectively.
Computed Tomography Scan May Serve as an Important Complementary Tool for the Diagnosis of COVID-19
The epidemiological and clinical features of 12 cases from whom viral RNA was not detected in the first three or all of the upper respiratory samples were analyzed in detail (Figure S1). The patients were aged from 10 to 73; 6 were in the severe group and the others were in the mild group. Nine cases had a history of traveling to or living in Wuhan, and two had close contact with confirmed cases. Viral RNA was tested negative in the first three or all of the upper respiratory samples. However, viral RNA was detected either by the further detection of upper respiratory samples (cases 21–28) or BALF samples (cases 02, 04, 06, and 07) (Figures 2 and S1). A computed tomography (CT) scan of 11 cases (case 24 not available) showed typical ground-glass opacity in the lung, suggesting a viral pneumonia (Figure 3). Consistent with the CT scan, the PiO2/FiO2 values and Murray scores of the cases (case 26 not available) also indicated the lung injury.
Figure 3.

CT Scan of 11 Cases from Whom SARS-CoV-2 RNA Was Not Detected in the Upper Respiratory Specimens for at Least the First 3 Tests
Discussion
Laboratory detection of viral RNA using qRT-PCR in the respiratory samples of suspected individuals is now considered one of the essential criteria for the diagnosis of COVID-19. According to our results, apart from the BALF samples collected from severe cases, sputum samples showed the highest positive rate for COVID-19 patients with different degrees of disease severity, followed by nasopharyngeal swabs, and oropharyngeal swab specimens showed the fewest positive results. As recent studies showed that only a small portion (28%–33.7%) of COVID-19 cases showed sputum production,5,6 nasopharyngeal swabs may serve as the most widely applicable samples for laboratory diagnosis of COVID-19. Notably, viral RNA could not be detected in the upper respiratory samples from some severe cases (cases 02, 06, and 07), while the results were positive in the BALF samples; and in some patients, such as case 04 and cases 21–28 of our study, the viruses were not detected in the first three samples, while they were finally laboratory confirmed either by further detection of upper respiratory samples (cases 21–28) or BALF samples. These results suggest that suspected cases, especially those with exposure history and clinical symptoms should not be excluded from a diagnosis of COVID-19 despite viral RNA was not detected in the upper respiratory tract samples. Under such circumstances, a CT scan might provide important evidence for the diagnosis of COVID-19. As shown in our study, although no viral RNA was detected in the first 3 or all of the upper respiratory samples from 12 cases in either severe or mild groups, the CT scans identified typical viral pneumonia linked to COVID-19,5,6,12 and finally SARS-CoV-2 infection was laboratory confirmed. Because human to human transmission of SARS-CoV-2 is efficient,3,7,10,13 more attention should be paid to such cases to prevent further spread of the virus. Furthermore, similar to SARS-CoV,14,15 recent studies have found that SARS-CoV-2 RNA can also be detected in rectal swabs or stools, with positive rates varying from 29% to 83.3%,16, 17, 18, 19, 20, 21, 22, 23 indicating that rectal swabs or stool could also be considered as a possible complement to the respiratory specimens.
Interestingly, BALF samples collected within 14 d.a.o. from the severe group showed a 100% positive rate for viral RNA in each patient, while, in contrast, no viral RNA was detected in the six BALF samples from the mild group. Although the sample size was small, it also indicated that the viral distribution was associated with disease severity; however, why the virus was retained in the upper respiratory tract in some individuals merits further investigation. What should be also noted is that, during the antiviral treatment, even though viral RNA in the upper respiratory tract was not detected, it was still positive in the BALF samples of some severe cases (cases 01, 03, 07, 11, 12, 13, and 16). This is consistent with the findings of a recent study that viral RNA and virus particles were also found in the lung, even though negative results were found in three consecutive nasopharyngeal swab samples.24 Therefore, detection of viral RNA in BALF samples, which has been proved to contribute to the diagnosis of SARS-CoV and MERS-CoV infections,14,15,25,26 may improve the accuracy of diagnosis and monitoring of viral shedding in severe and critically ill COVID-19 patients. Furthermore, we found that viral shedding in the lower respiratory tract could last up to 46 d.a.o., which was far longer than the previous findings based on upper respiratory samples.27,28 The unusual viral shedding profile of SARS-CoV-2 should be treated with discretion when formulating strategies for treatment and combating of viral transmission.
There are some limitations within our study. Firstly, it is assumed that the qRT-PCR assay is 100% accurate, which cannot be guaranteed and may contribute to false-positive or -negative results. Secondly, most of the samples were collected after the patients had received antiviral treatment, which might influence the viral shedding. Thirdly, the number of BALF samples was limited, especially from the mild group. Therefore, it will be necessary to increase the number of BALF samples to obtain a more accurate conclusion on the differences in viral shedding between cases with severe and mild COVID-19. To our knowledge, this is the first study that systematically analyzed the comparative sensitivity of different respiratory specimen types for molecular diagnosis and monitoring of SARS-CoV-2 shedding in COVID-19 patients, and the differences in viral shedding profiles between the upper and lower respiratory tracts from COVID-19 patients, in combination with disease severity and progression. Although some other residual confounders, such as age, gender, sample collection, and processing might also influence the positive rate, our study still provides important information about sample selection to improve the accuracy of laboratory diagnosis of COVID-19.
Materials and Methods
Patients and Samples
Four hundred and ten patients with confirmed COVID-19 from the Guangdong CDC (Center for Disease Control and Prevention), who were hospitalized in Shenzhen Third People's Hospital, were included. A total of 3,552 samples collected from the respiratory tract of patients, including nasopharyngeal swabs, oropharyngeal swabs, sputum, and BALF, were serially collected upon admission and at various time points thereafter. Sample collection dates were divided into 0–7, 8–14, and ≥15 d.a.o. groups, and patients were divided into severe (including severe and critically ill cases) and mild (including moderate and mild cases) groups according to the guidelines on SARS-CoV-2 infection from the National Health Commission of the People's Republic of China. The study was performed in accordance with guidelines approved by the Ethics Committees from Shenzhen Third People’s Hospital.
qRT-PCR
Viral RNA was extracted from the samples using a QIAamp Viral RNA Kit (QIAGEN, Heiden, Germany), and qRT-PCR was performed using a China Food and Drug Administration-approved commercial kit specifically designed for SARS-CoV-2 detection (BioGerm, Shanghai, China) targeting the ORF1ab and N genes as recommended by the Chinese CDC (China CDC). The specimens were considered positive if the Ct value was ≤38, and negative if the results were undetermined. Specimens with a Ct value higher than 38 were repeatedly tested. The specimen was considered positive if the repeated results were the same as the initial result and between 38 and 40. If the repeated Ct value was undetectable, the specimen was considered negative. All the experiments and interpretation of the qRT-PCR results were carried out by professional technicians in the diagnostic laboratory.
Classification of Disease Severity
In terms of disease severity, COVID-19 was graded into critically ill, severe, moderate, and mild groups according to China National Health Commission Guidelines for Diagnosis and Treatment of SARS-CoV-2 infection as reported previously.29
Quantification of Hypoxia and Murray Score
Quantification of hypoxia was carried out as reported previously.30,31 In brief, the partial pressure of oxygen (PaO2) in arterial blood taken from patients at various time points after hospitalization was measured using an ABL90 blood gas analyzer (Radiometer). The fraction of inspired oxygen (FiO2) was calculated using the following formula: FiO2 = (21 + oxygen flow (in units of L/min) × 4)/100. The PaO2/FiO2 ratio (in units of mmHg) was calculated by dividing the PaO2 value with the FiO2 value. A PaO2/FiO2 ratio less than or equal to 100 mmHg is considered one of the criteria for severe acute respiratory distress syndrome. Murray scores were calculated as reported.32
Statistical Analyses
The unpaired, two-tailed t test was used to determine whether differences in the Ct values were statistically significant. Fisher’s exact test analysis was used to analyze positive rates. A p value lower than 0.05 was considered statistically significant. Statistical analyses were performed using GraphPad Prism.
Acknowledgments
This work was supported by the Ministry of Science and Technology (2020YFC0846300), National Science and Technology Major Project (2017ZX10103011, 2018ZX10711001), Shenzhen Science and Technology Research and Development Project (202002073000001), and China Postdoctoral Science Foundation (2019T120147, 2019M660836). The funding institutions had no roles in study design, data collection, data analysis, interpretation, or writing of the report in this study.
Declaration of Interests
The authors have declared that no conflict of interest exists.
Published: November 25, 2020
Footnotes
Supplemental Information can be found online at https://doi.org/10.1016/j.xinn.2020.100061.
Contributor Information
Lei Liu, Email: liulei3322@aliyun.com.
Yingxia Liu, Email: yingxialiu@hotmail.com.
Lead Contact Website
Supplemental Information
References
- 1.Zhu N., Zhang D., Wang W., et al. A novel coronavirus from patients with pneumonia in China, 2019. N. Engl. J. Med. 2020;382:727–733. doi: 10.1056/NEJMoa2001017. [DOI] [PMC free article] [PubMed] [Google Scholar]
- 2.Tan W., Zhao X., Ma X., et al. A novel coronavirus genome identified in a cluster of pneumonia cases—Wuhan, China 2019–2020. China CDC Weekly. 2020;2:61–62. [PMC free article] [PubMed] [Google Scholar]
- 3.Xu X.W., Wu X.X., Jiang X.G., et al. Clinical findings in a group of patients infected with the 2019 novel coronavirus (SARS-Cov-2) outside of Wuhan, China: retrospective case series. BMJ. 2020;368:m606. doi: 10.1136/bmj.m606. [DOI] [PMC free article] [PubMed] [Google Scholar]
- 4.Wang D., Hu B., Hu C., et al. Clinical characteristics of 138 hospitalized patients with 2019 novel coronavirus-infected pneumonia in Wuhan, China. JAMA. 2020;323:1061–1069. doi: 10.1001/jama.2020.1585. [DOI] [PMC free article] [PubMed] [Google Scholar]
- 5.Huang C., Wang Y., Li X., et al. Clinical features of patients infected with 2019 novel coronavirus in Wuhan, China. Lancet. 2020;395:497–506. doi: 10.1016/S0140-6736(20)30183-5. [DOI] [PMC free article] [PubMed] [Google Scholar]
- 6.Guan W.J., Ni Z.Y., Hu Y., et al. Clinical characteristics of coronavirus disease 2019 in China. N. Engl. J. Med. 2020;382:1708–1720. doi: 10.1056/NEJMoa2002032. [DOI] [PMC free article] [PubMed] [Google Scholar]
- 7.Chan J.F., Yuan S., Kok K.H., et al. A familial cluster of pneumonia associated with the 2019 novel coronavirus indicating person-to-person transmission: a study of a family cluster. Lancet. 2020;395:514–523. doi: 10.1016/S0140-6736(20)30154-9. [DOI] [PMC free article] [PubMed] [Google Scholar]
- 8.Xu Z., Shi L., Wang Y., et al. Pathological findings of COVID-19 associated with acute respiratory distress syndrome. Lancet Respir. Med. 2020;8:420–422. doi: 10.1016/S2213-2600(20)30076-X. [DOI] [PMC free article] [PubMed] [Google Scholar]
- 9.Rothe C., Schunk M., Sothmann P., et al. Transmission of 2019-nCoV infection from an asymptomatic contact in Germany. N. Engl. J. Med. 2020;382:970–971. doi: 10.1056/NEJMc2001468. [DOI] [PMC free article] [PubMed] [Google Scholar]
- 10.Phan L.T., Nguyen T.V., Luong Q.C., et al. Importation and human-to-human transmission of a novel coronavirus in Vietnam. N. Engl. J. Med. 2020;382:872–874. doi: 10.1056/NEJMc2001272. [DOI] [PMC free article] [PubMed] [Google Scholar]
- 12.Lei J., Li J., Li X., et al. CT imaging of the 2019 novel coronavirus (2019-nCoV) pneumonia. Radiology. 2020;295:18. doi: 10.1148/radiol.2020200236. [DOI] [PMC free article] [PubMed] [Google Scholar]
- 13.Li Q., Guan X., Wu P., et al. Early transmission dynamics in Wuhan, China, of novel coronavirus-infected pneumonia. N. Engl. J. Med. 2020;382:1199–1207. doi: 10.1056/NEJMoa2001316. [DOI] [PMC free article] [PubMed] [Google Scholar]
- 14.Mackay I.M., Arden K.E. MERS coronavirus: diagnostics, epidemiology and transmission. Virol. J. 2015;12:222. doi: 10.1186/s12985-015-0439-5. [DOI] [PMC free article] [PubMed] [Google Scholar]
- 15.Chan P.K.S., To W.K., Ng K.C., et al. Laboratory diagnosis of SARS. Emerg. Infect. Dis. 2004;10:825–831. doi: 10.3201/eid1005.030682. [DOI] [PMC free article] [PubMed] [Google Scholar]
- 16.Zhang W., Du R.-H., Li B., et al. Molecular and serological investigation of 2019-nCoV infected patients: implication of multiple shedding routes. Emerg. Microbes Infect. 2020;9:386–389. doi: 10.1080/22221751.2020.1729071. [DOI] [PMC free article] [PubMed] [Google Scholar]
- 17.Zhang J., Wang S., Xue Y. Fecal specimen diagnosis 2019 novel coronavirus-infected pneumonia. J. Med. Virol. 2020;92:680–682. doi: 10.1002/jmv.25742. [DOI] [PMC free article] [PubMed] [Google Scholar]
- 18.Xiao F., Tang M., Zheng X., et al. Evidence for gastrointestinal infection of SARS-CoV-2. Gastroenterology. 2020;158:1831–1833.e3. doi: 10.1053/j.gastro.2020.02.055. [DOI] [PMC free article] [PubMed] [Google Scholar]
- 19.Wang W., Xu Y., Gao R., et al. Detection of SARS-CoV-2 in different types of clinical specimens. JAMA. 2020;323:1843–1844. doi: 10.1001/jama.2020.3786. [DOI] [PMC free article] [PubMed] [Google Scholar]
- 20.Ling Y., Xu S., Lin Y., et al. Persistence and clearance of viral RNA in 2019 novel coronavirus disease rehabilitation patients. Chin Med. J. (Engl). 2020;133:1039–1043. doi: 10.1097/CM9.0000000000000774. [DOI] [PMC free article] [PubMed] [Google Scholar]
- 21.Cai J., Xu J., Lin D., et al. A case series of children with 2019 novel coronavirus infection: clinical and epidemiological features. Clin. Infect. Dis. 2020;71:1547–1551. doi: 10.1093/cid/ciaa198. [DOI] [PMC free article] [PubMed] [Google Scholar]
- 22.Xu D., Zhang Z., Jin L., et al. Persistent shedding of viable SARS-CoV in urine and stool of SARS patients during the convalescent phase. Eur. J. Clin. Microbiol. Infect. Dis. 2005;24:165–171. doi: 10.1007/s10096-005-1299-5. [DOI] [PMC free article] [PubMed] [Google Scholar]
- 23.Zhao F., Yang Y., Wang Z., et al. The time sequences of oral and fecal viral shedding of coronavirus disease 2019 (COVID-19) patients. Gastroenterology. 2020;159:1158–1160. doi: 10.1053/j.gastro.2020.05.035. [DOI] [PMC free article] [PubMed] [Google Scholar]
- 24.Yao X., He Z., Li T., et al. Pathological evidence for residual SARS-CoV-2 in pulmonary tissues of a ready-for-discharge patient. Cell Res. 2020;30:541–543. doi: 10.1038/s41422-020-0318-5. [DOI] [PMC free article] [PubMed] [Google Scholar]
- 25.Chan J.F.W., Lau S.K.P., To K.K.W., et al. Middle East respiratory syndrome coronavirus: another zoonotic betacoronavirus causing SARS-like disease. Clin. Microbiol. Rev. 2015;28:465–522. doi: 10.1128/CMR.00102-14. [DOI] [PMC free article] [PubMed] [Google Scholar]
- 26.Cheng V.C.C., Lau S.K.P., Woo P.C.Y., et al. Severe acute respiratory syndrome coronavirus as an agent of emerging and reemerging infection. Clin. Microbiol. Rev. 2007;20:660–694. doi: 10.1128/CMR.00023-07. [DOI] [PMC free article] [PubMed] [Google Scholar]
- 27.He X., Lau E.H.Y., Wu P., et al. Temporal dynamics in viral shedding and transmissibility of COVID-19. Nat. Med. 2020;26:672–675. doi: 10.1038/s41591-020-0869-5. [DOI] [PubMed] [Google Scholar]
- 28.Zhou F., Yu T., Du R., et al. Clinical course and risk factors for mortality of adult inpatients with COVID-19 in Wuhan, China: a retrospective cohort study. Lancet. 2020;395:1054–1062. doi: 10.1016/S0140-6736(20)30566-3. [DOI] [PMC free article] [PubMed] [Google Scholar]
- 29.Yang Y., Shen C., Li J., et al. Plasma IP-10 and MCP-3 levels are highly associated with disease severity and predict the progression of COVID-19. J. Allergy Clin. Immunol. 2020;146:119–127.e4. doi: 10.1016/j.jaci.2020.04.027. [DOI] [PMC free article] [PubMed] [Google Scholar]
- 30.Yang Y., Wong G., Yang L., et al. Comparison between human infections caused by highly and low pathogenic H7N9 avian influenza viruses in Wave Five: clinical and virological findings. J. Infect. 2019;78:241–248. doi: 10.1016/j.jinf.2019.01.005. [DOI] [PubMed] [Google Scholar]
- 31.Bi Y., Tan S., Yang Y., et al. Clinical and immunological characteristics of human infections with H5N6 avian influenza virus. Clin. Infect. Dis. 2019;68:1100–1109. doi: 10.1093/cid/ciy681. [DOI] [PubMed] [Google Scholar]
- 32.Liu Y., Zhang C., Huang F., et al. Elevated plasma level of selective cytokines in COVID-19 patients reflect viral load and lung injury. Natl. Sci. Rev. 2020;7:1003–1011. doi: 10.1093/nsr/nwaa037. [DOI] [PMC free article] [PubMed] [Google Scholar]
Associated Data
This section collects any data citations, data availability statements, or supplementary materials included in this article.