Abstract
Meteorological parameters were crucial and effective factors in past infectious diseases, like influenza and severe acute respiratory syndrome (SARS), etc. The present study targets to explore the association between the coronavirus disease 2019 (COVID-19) transmission rates and meteorological parameters. For this purpose, the meteorological parameters and COVID-19 infection data from 28th March 2020 to 22nd April 2020 of different states of India have been compiled and used in the analysis. The gradient boosting model (GBM) has been implemented to explore the effect of the minimum temperature, maximum temperature, minimum humidity, and maximum humidity on the infection count of COVID-19. The optimal performance of the GBM model has been achieved after tuning its parameters. The GBM results in the best accuracy of R2 = 0.95 for prediction of active cases in Maharashtra, and R2 = 0.98 for prediction of recovered cases of COVID-19 in Kerala and Rajasthan, India.
Keywords: COVID-19, Atmospheric factors, Artificial intelligence, Gradient boosting model, Predictive modeling
Introduction
The transmission rate of the coronavirus disease 2019 (COVID-19) has been very fast since its first reported case in December 2019 in Wuhan, China. It has infected over 3, 181, 642 people in 215 countries worldwide and resulted in 224, 301 deaths by 1st May 2020 according to the world health organization [1]. Till now some common symptoms of severe acute respiratory syndrome coronavirus 2 (SARS-CoV-2) have been identified based on the recognized cases, including fever, tiredness, dry cough, sore throat, and diarrhea, etc. [2, 3]. Though, presently the increasing number of asymptotic patients in some countries is a dangerous situation of the society and a challenge for the doctors and health care system [4]. In some studies, the local seafood market of Wuhan, China is identified to be a source of COVID-19 which results in its transmission from bat to human [1, 3, 5, 6]. Still, many researches are going on to explore the transmission route of COVID-19. In most of the infected cases of humans to human transmission through the respiratory tract, it spread due to the human contacts in gathering, meeting with relatives and friends, and between patients and healthcare workers, etc. [7]. Besides surface, the presence of coronavirus in blood and fecal swabs [8], and in the air [9] around the hospital area indicates its transmission through multiple routes; this is another challenge for the healthcare system. Several approaches are in use for the detection of COVID-19 but the exact treatment approach is still lacking. Many drugs are being tested and several vaccines are still in the development process for the treatment [10], therefore, social distancing, isolation, following instructions of the respective government organizations and doctors, and personal hygiene are some of the precautions to reduce the spread of the COVID-19. In India, 26,167 active cases with 9950 recovered, 1218 deaths, and 1 migrated were reported up to 1st May 2020 [11].
It is a common observation that the health of most of the people is affected by climate change, like seasonal cold and flu at the beginning of winter and summer. It is due to the reason that climate change affects the transmission of most of the virus. Similarly, the climate condition also affects the transmission rate of the epidemic virus. This fact is already established in some studies of the previous epidemic. Severe acute respiratory syndrome (SARS) started in January 2002 and ended mostly in July of the same year, has quit similar genetic sequence to COVID-19, and was affected by the warm weather condition [12]. The transmission rate of influenza has a strong correlation with atmospheric conditions that significantly increases at low daily temperature and humidity [13]. Some recent studies [14–21] established the effect of climate conditions on the transmission rate of COVID-19. Though, it is hard to find any study based on the impact of the atmospheric factors, including temperature and humidity on the transmission rate of the COVID-19 in different states of India during the lockdown period.
The machine learning-based approaches have been widely implemented in the health care system for disease diagnosis, monitoring, and prediction to reduce the workload of doctors and hospital workers [22–24]. In some recent research reports, machine learning approaches have been implemented successfully in the identification of the COVID-19 pandemic [25–29]. Though, the implementation of the machine learning approach using the atmospheric factors in the prediction of the COVID-19 is not noticed. With this motivation gradient boosting machine (GBM) approach has been implemented to establish the relationship among atmospheric factors (temperature and humidity) and daily spread rate of COVID-19 in different states of India. The present study has the following contributions: (a) explores the correlation between atmospheric parameters and transmission rate of COVID-19 in different states of India, (b) predicts the active and recovered cases of COVID-19, and (c) establish an efficient tree-based machine learning approach to explore the effect of temperature and humidity on the transmission rate of COVID-19.
COVID-19 and atmospheric data collection and compilation
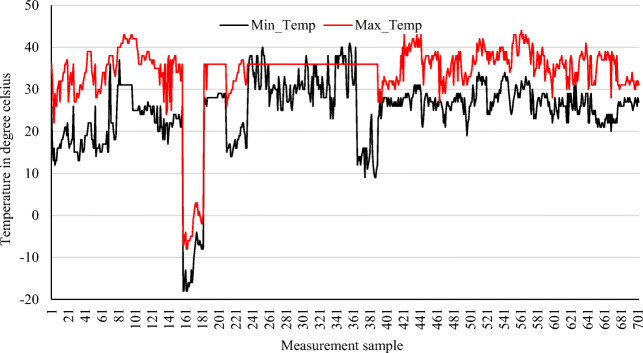
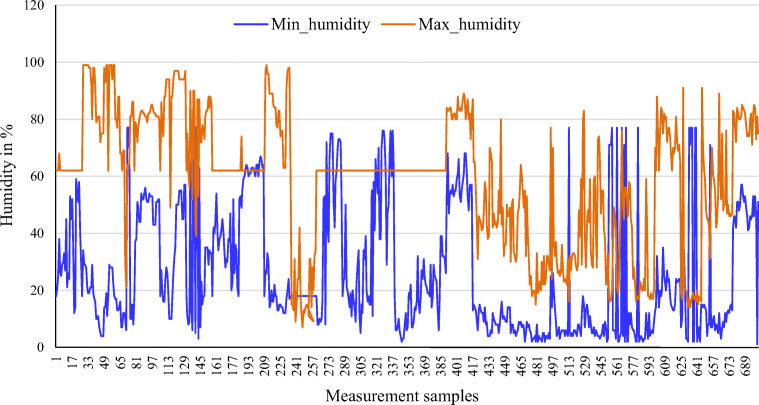
The meteorological data of all states of India were collected from the Indian Central Pollution Control Board (CPCB) [30] and Indian Meteorological Department (IMD) [31] on a daily basis from 28th March 2020 to 22nd April 2020. The COVID-19 data were collected from the Ministry of Health and Family Welfare, Government of India [11], and an open-access source [32]. The meteorological parameter includes minimum temperature, maximum temperature, minimum humidity, and maximum humidity of all states of India. Besides, minimum pressure, maximum pressure, minimum wind speed, maximum wind speed, pm-10, and pm-2.5 were collected but not used in the analysis due to less correlated with the COVID-19 information. The COVID-19 related information, includes daily new infection cases, active cases (accumulated total cases up to previous days-recovered cases-deceased cases), recovered cased till the date, and mortality till the date. Finally, the meteorological parameters and COVID-19 information were combined for further analysis. The missing values of meteorological parameters were imputed by replacing the median values. The variations of imputed values of minimum and maximum temperature, and minimum and maximum humidity are shown in Figs. 1 and 2, respectively. The measurement sample represents the total number of measurements of temperature and humidity in different states of India for 26 days. Four meteorological parameters as input and active and recovered cases of COVID-19 were used as the output of the GBM approach, independently.
Fig. 1.
The variation in the minimum and the maximum temperature
Fig. 2.
The variation in the minimum and the maximum humidity
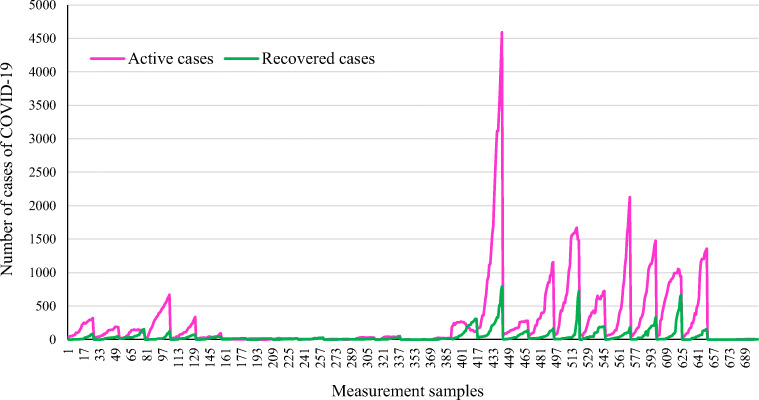
The collected data of 26 days have a total of 702 instances in which 467 instances (2/3rd of total instances of all states) were used in training and 235 (about 1/3rd of total instances of all states) instances were used in the combined testing. Moreover, the final tests were performed for individual states to check the model performance. Table 1 presents the basic statistics of the combined dataset. Figure 3 exhibits the variation in the number of recovered and active cases of COVID-19 in different states of India. The samples in Fig. 3 signify the total number of COVID-19 cases collected in different states of India from 28th March to 22nd April 2020.
Table 1.
Basic statistics of the dataset
| Measures | Minimum temperature | Maximum temperature | Minimum humidity | Maximum humidity | Active cases of COVID-19 | Recovered cases of COVID-19 |
|---|---|---|---|---|---|---|
| Minimum | −18.00 | −8.00 | 1.00 | 7.00 | 0.0 | 0.00 |
| Maximum | 41.00 | 44.00 | 77.00 | 99.00 | 4591.0 | 789.00 |
| Range | −18-41 | −8-44 | 1–77 | 7–99 | 0–4591 | 0–789 |
| First quartile | 22.00 | 33.00 | 8.00 | 45.00 | 10.0 | 2.00 |
| Third quartile | 29.00 | 37.00 | 43.00 | 76.00 | 260.8 | 37.00 |
| Median | 26.00 | 36.00 | 18.00 | 62.00 | 52.5 | 11.00 |
| Mean | 24.55 | 34.16 | 26.17 | 59.21 | 258.7 | 42.05 |
| Standard deviation | 9.12 | 7.92 | 21.59 | 22.60 | 507.59 | 90.43 |
| Skewness | −2.24 | −3.61 | 0.84 | −0.39 | 4.02 | 4.51 |
Fig. 3.
The variation in the active and recovered cases of COVID-19
Gradient boosting machine (GBM) learning approach
GBM is an ensemble forward learning model that is used to solve the regression as well as classification problems. It discards all weaker predictors and picks the stronger one. It is an improved version of the decision tree where every successor comparatively analyzed to build a set of the optimally satisfying structure of the tree by using the structure score, gain calculation, and increasingly refined approximations.
The prediction performance of GBM can be boosted by the use of invoking an additional classifier. This modification optimizes the accuracy of the tree without affecting its speed. It also provides an easily distributable and parallelizable feature with an effortless environment for model tuning and selection. This version of GBM is capable to handle the bigdata with optimal accuracy. It is rarely used in COVID-19 prediction modeling. The H2O package in R [33] is used in the present study in the implementation of the GBM approach. The GBM model was optimized for the number of trees (k) = 1, 2, 3,…50. The maximum number of trees K = 50 is selected arbitrarily. The algorithm table of GBM is as follows [34].
Algorithm Table of Gradient Boosting Machine (GBM)
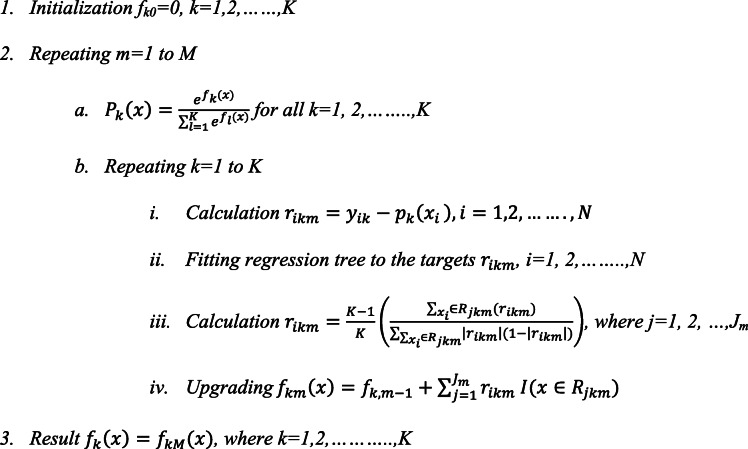
Four atmospheric parameters, including minimum temperature, maximum temperature, minimum humidity, and maximum humidity were used in analysis. Specifically, to reduce the computational complexity, the average of the maximum and minimum temperature and the average of the maximum and minimum humidity were used as input in the GBM model to predict the number of recovered and active cases in all states and also for some individual states of India.
Analysis of outcomes
Statistical analysis of the COVID-19 dataset
The ANOVA analysis of the atmospheric parameters and the active case and recovered cases of the COVID-19 is shown in Table 2. The results of the ANOVA analysis signify that the atmospheric data and COVID-19 data sets included in the present study are significant and can be used for further processing.
Table 2.
ANOVA analysis results of atmospheric factors and COVID-19 data
| Atmospheric factors/ COVID-19 data | ANOVA performance parameter | ||
|---|---|---|---|
| DF | F value | P value | |
| Recovery cases of COVID-19 | 26 | 67.02 | P = 5.98 × 10⁻¹⁶ (less than 0.05) |
| Active cases of COVID-19 | 26 | 163.1 | P = < 2 × 10⁻¹⁶ (less than 0.05) |
| Minimum temperature | 26 | 542.5 | P = < 2 × 10⁻¹⁶ (less than 0.05) |
| Maximum temperature | 26 | 2312 | P = < 2 × 10⁻¹⁶ (less than 0.05) |
| Minimum humidity | 26 | 197.4 | P = < 2 × 10⁻¹⁶ (less than 0.05) |
| Maximum humidity | 26 | 2511 | P = < 2 × 10⁻¹⁶ (less than 0.05) |
Results of gradient boosting machine analysis
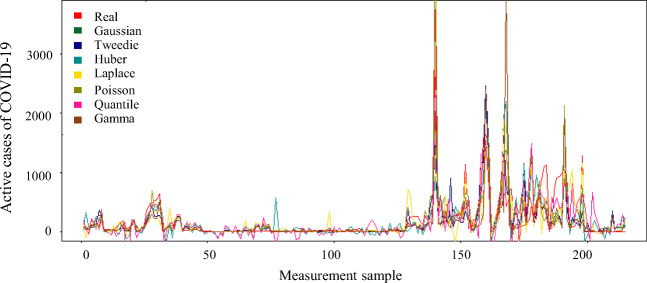
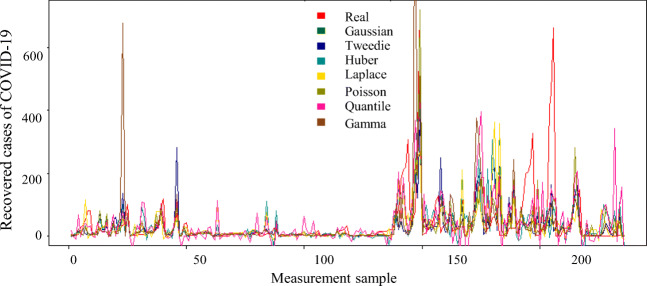
The GBM model was tuned with the number of trees, learning rate, number of folds, and distribution functions (Gaussian, Tweedie, Huber, Laplace, Poisson, Quantile, and Gamma). The training prediction performance of the GBM model for the active and recovered cases of COVID-19 is summarized in Table 3. The performance of GBM is evaluated based on mean square error (MSE), root mean square error (RMSE), mean average error (MAE), mean residual deviance (MRD), and coefficient of determination (R2). It is obvious that the optimal prediction performance of the GBM was achieved for the Poisson distribution (R2 = 0.99) and the number of trees = 50, learning rate = 0.8, and the number of folds = 10 in the prediction of both active and recovered cases of COVID-19 in all states of India in the selected duration. The visual representations of the predictive performance of the GBM method in the prediction of active and recovered cases of COVID-19 for the combined test dataset of all states are shown in Figs. 4 and 5, respectively.
Table 3.
Overall performance of GBM in training using the combined dataset of all states of India
| S. No | Distribution | Performance measures of GBM | |||||||||
|---|---|---|---|---|---|---|---|---|---|---|---|
| Active cases modeling | Recovered cases modeling | ||||||||||
| R2 | MSE | RMSE | MAE | MRD | R2 | MSE | RMSE | MAE | MRD | ||
| 1 | Gaussian | 0.97 | 2.13 | 86.07 | 61.29 | 0.97 | 0.94 | 535.41 | 23.14 | 15.92 | 535.41 |
| 2 | Tweedie | 0.98 | 4805.18 | 69.32 | 38.73 | 2.13 | 0.97 | 232.60 | 15.25 | 8.61 | 1.87 |
| 3 | Huber | 0.85 | 20,673.86 | 143.78 | 60.49 | 0.91 | 0.68 | 26.53 | 57.99 | 19.37 | 642.39 |
| 4 | Laplace | 0.72 | 74,248.96 | 272.49 | 104.08 | 0.67 | 0.48 | 6228.91 | 78.92 | 26.53 | 26.53 |
| 5 | Poisson | 0.99 | 3075.37 | 55.46 | 35.89 | −2846.53 | 0.99 | 94.35 | 9.71 | 6.63 | −357.78 |
| 6 | Quantile | 0.70 | 69,855.46 | 264.30 | 113.82 | 56.91 | 0.50 | 6614.20 | 81.33 | 26.37 | 13.18 |
| 7 | Gamma | 0.85 | 27,019.53 | 164.38 | 70.78 | 10.21 | 0.83 | 1682.18 | 41.01 | 16.92 | 6.05 |
Note: R2 (coefficient of determination), MSE (mean square error), RMSE (root mean square error), MAE (mean average error), and MRD (mean residual deviance)
Fig. 4.
Performance of GBM in the prediction of active cases of COVID-19 using the combined dataset of all states of India
Fig. 5.
Performance of GBM in the prediction of recovered cases of COVID-19 using the combined dataset of all states of India
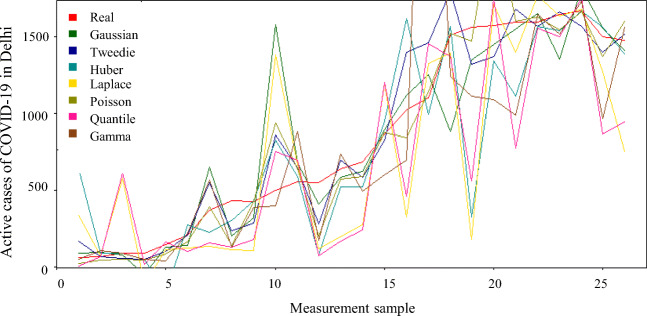
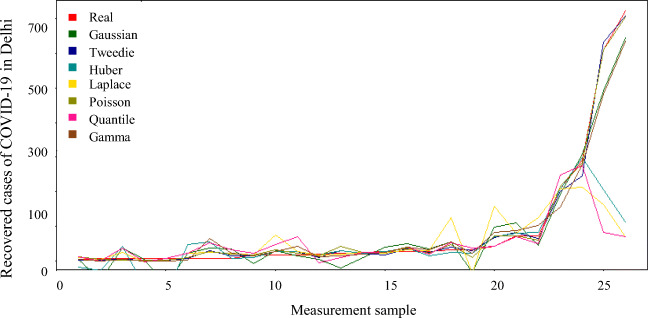
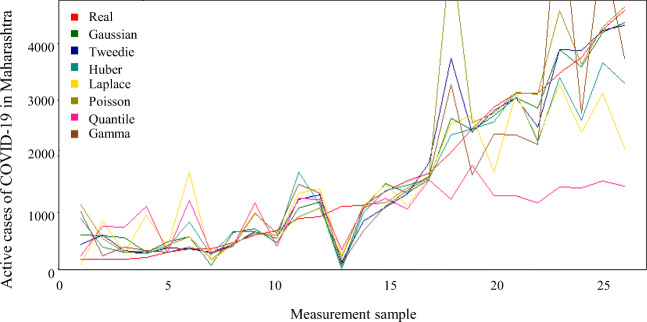
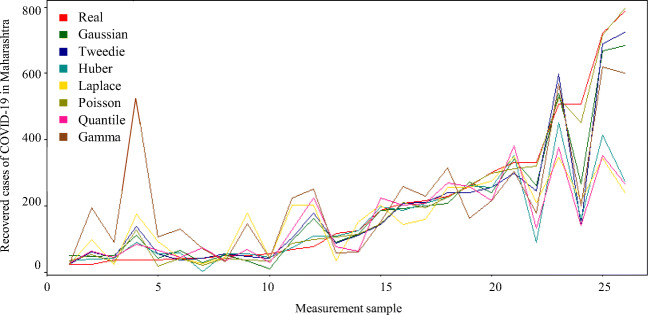
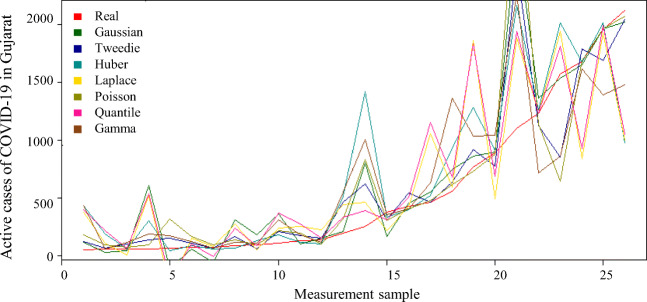
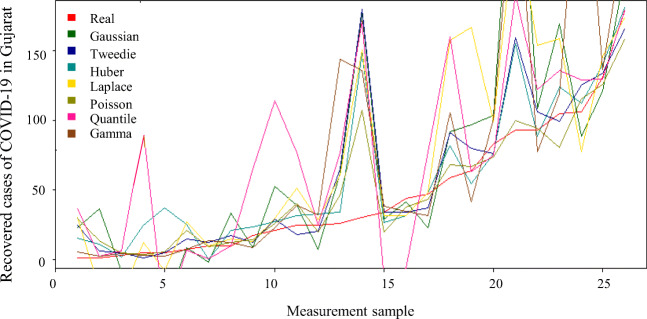
Figures 4 and 5 also, demonstrate a comprehensive comparison of the different distribution functions of GBM in the prediction of cases of COVID-19. The Poisson distribution function performs better than other functions in the prediction of COVID-19 cases for the combined test dataset of all states. The test performances of the Poisson distribution function in the prediction of COVID-19 cases, for ten states are summarized in Table 4. The detailed statewise prediction results of the GBM using different distribution functions for Delhi, Maharashtra, and Gujarat are summarized in Tables 5, 6 and 7, respectively. Figures 6 and 7 demonstrate the predicted results of GBM for the active and recovered cases of COVID-19 in Delhi. Figures 8 and 9 represent the qualitative performance of GBM in the prediction of active and recovered cases of COVID-19 cases in Maharashtra. The visual representations of the performance of GBM in the prediction of active and recovered cases of COVID-19 cases in Gujarat are presented in Figs. 10 and 11, respectively.
Table 4.
Performance of GBM using Poisson distribution in the prediction of recovered and active cases of COVID-19 in different states of India
| Performance parameter | State | |||||||||
|---|---|---|---|---|---|---|---|---|---|---|
| Maharashtra | Gujarat | Kerala | AP | Haryana | WB | Telangana | Rajasthan | UP | MP | |
| Recovered cases | ||||||||||
| MSE | 2084.27 | 481.27 | 533.36 | 1248.65 | 280.65 | 64.68 | 470.60 | 533.36 | 870.35 | 2046.96 |
| RMSE | 45.65 | 21.94 | 23.09 | 35.34 | 16.75 | 8.04 | 21.69 | 23.09 | 29.50 | 45.24 |
| MAE | 21.45 | 14.14 | 13.45 | 22.38 | 13.20 | 6.27 | 14.11 | 13.45 | 14.51 | 22.42 |
| MRD | −1970.83 | −302.02 | −821.56 | 1248.65 | −324.46 | −129.59 | −606.42 | −821.58 | −274.23 | −276.50 |
| R2 | 0.95 | 0.77 | 0.98 | 0.75 | 0.84 | 0.89 | 0.91 | 0.98 | 0.43 | 0.21 |
| Active cases | ||||||||||
| MSE | 85,646.60 | 67,422.76 | 55,572.56 | 9931.23 | 904.03 | 6042.37 | 61,793.21 | 88,292.87 | 29,361.50 | 40,995.38 |
| RMSE | 292.65 | 259.66 | 235.74 | 99.66 | 30.07 | 77.73 | 248.58 | 297.14 | 171.35 | 202.47 |
| MAE | 126.34 | 154.05 | 117.85 | 73.29 | 25.95 | 50.03 | 139.48 | 181.86 | 96.00 | 96.04 |
| MRD | −21,684.12 | −6515.20 | −10,037.81 | 9931.23 | −677.64 | −902.82 | −3738.07 | −6597.99 | −4589.25 | −5944.38 |
| R2 | 0.95 | 0.83 | 0.84 | 0.75 | 0.64 | 0.29 | 0.19 | 0.61 | 0.73 | 0.82 |
Note: R2 (coefficient of determination), MSE (mean square error), RMSE (root mean square error), MAE (mean average error), MRD (mean residual deviance), AP (Andhra Pradesh), WB (West Bengal), UP (Uttar Pradesh), and MP (Madhya Pradesh)
Table 5.
Performance of GBM in the prediction of recovered and active cases in Delhi, India
| Performance parameter | Distribution | ||||||
|---|---|---|---|---|---|---|---|
| Gamma | Quintile | Poisson | Laplace | Huber | Tweedie | Gaussian | |
| Recovered cases | |||||||
| MSE | 9500.73 | 25,376.32 | 533.36 | 23,019.17 | 16,594.05 | 1129.63 | 2476.93 |
| RMSE | 97.47 | 159.30 | 23.09 | 151.72 | 128.82 | 33.61 | 49.77 |
| MAE | 48.19 | 66.21 | 13.45 | 58.38 | 49.86 | 18.69 | 32.87 |
| MRD | 9.14 | 33.11 | −821.58 | 58.38 | 3717.56 | 1.39 | 2476.93 |
| R2 | 0.70 | 0.21 | 0.98 | 0.28 | 0.48 | 0.96 | 0.92 |
| Active cases | |||||||
| MSE | 132,171.40 | 124,920.40 | 55,572.56 | 139,083.10 | 58,240.21 | 57,000.78 | 73,851.49 |
| RMSE | 363.55 | 353.44 | 235.74 | 372.94 | 241.33 | 238.75 | 271.76 |
| MAE | 243.64 | 230.35 | 117.85 | 201.10 | 151.60 | 139.85 | 160.40 |
| MRD | 15.39 | 115.18 | −10,037.81 | 201.10 | 31,323.97 | 2.65 | 73,851.49 |
| R2 | 0.62 | 0.64 | 0.84 | 0.60 | 0.83 | 0.84 | 0.79 |
Note: R2 (coefficient of determination), MSE (mean square error), RMSE (root mean square error), MAE (mean average error), and MRD (mean residual deviance)
Table 6.
Performance of GBM in the prediction of recovered and active cases in Maharashtra, India
| Performance parameter | Distribution | ||||||
|---|---|---|---|---|---|---|---|
| Gamma | Quintile | Poisson | Laplace | Huber | Tweedie | Gaussian | |
| Recovered cases | |||||||
| MSE | 21,005.42 | 24,869.43 | 691.80 | 25,379.27 | 21,081.05 | 7094.25 | 3889.94 |
| RMSE | 144.93 | 157.70 | 26.30 | 159.30 | 145.19 | 84.22 | 62.36 |
| MAE | 102.83 | 89.67 | 18.27 | 96.70 | 68.90 | 44.64 | 39.55 |
| MRD | 12.17 | 44.83 | −1975.29 | 96.70 | 9993.07 | 2.58 | 3889.94 |
| R2 | 0.52 | 0.43 | 0.98 | 0.42 | 0.52 | 0.84 | 0.91 |
| Active cases | |||||||
| MSE | 816,125.8 | 1,572,996 | 643,718.7 | 613,581.1 | 271,677.3 | 201,587.4 | 109,033.4 |
| RMSE | 903.39 | 1254.19 | 802.32 | 783.31 | 521.22 | 448.98 | 330.2021 |
| MAE | 599.62 | 891.48 | 344.46 | 545.42 | 355.50 | 280.64 | 252.3535 |
| MRD | 16.74 | 445.74 | −21,429.08 | 545.42 | 154,812.5 | 9.82 | 109,033.4 |
| R2 | 0.56 | 0.16 | 0.65 | 0.67 | 0.85 | 0.89 | 0.94 |
Note: R2 (coefficient of determination), MSE (mean square error), RMSE (root mean square error), MAE (mean average error), and MRD (mean residual deviance)
Table 7.
Performance of GBM in the prediction of recovered and active cases in Gujarat
| Performance parameter | Distribution | ||||||
|---|---|---|---|---|---|---|---|
| Gamma | Quintile | Poisson | Laplace | Huber | Tweedie | Gaussian | |
| Recovered cases | |||||||
| MSE | 4492.46 | 2906.73 | 364.52 | 2758.21 | 836.94 | 1218.73 | 3874.26 |
| RMSE | 67.02 | 53.91 | 19.09 | 52.51 | 28.93 | 34.91 | 62.24 |
| MAE | 34.36 | 38.15 | 11.60 | 33.69 | 16.72 | 17.74 | 35.81 |
| MRD | 8.72 | 19.07 | −303.48 | 33.69 | 385.63 | 2.19 | 3874.26 |
| R2 | −1.13 | −0.37 | 0.82 | −0.30 | 0.602 | 0.42 | −0.83 |
| Active cases | |||||||
| MSE | 350,054.7 | 185,960.5 | 185,286.2 | 265,920.3 | 194,547.6 | 243,259.2 | 120,580.7 |
| RMSE | 591.65 | 431.23 | 430.44 | 515.67 | 441.07 | 493.21 | 347.24 |
| MAE | 308.15 | 334.91 | 214.50 | 362.27 | 230.42 | 234.16 | 229.92 |
| MRD | 14.10 | 167.45 | −6412.76 | 362.27 | 97,570.7 | 11.61 | 120,580.7 |
| R2 | 0.13 | 0.54 | 0.54 | 0.34 | 0.52 | 0.40 | 0.70 |
Note: R2 (coefficient of determination), MSE (mean square error), RMSE (root mean square error), MAE (mean average error), and MRD (mean residual deviance)
Fig. 6.
Performance of GBM in the prediction of active cases of COVID-19 of Delhi, India
Fig. 7.
Performance of GBM in the prediction of recovered cases of COVID-19 of Delhi, India
Fig. 8.
Performance of GBM in the prediction of active cases of COVID-19 of Maharashtra, India
Fig. 9.
Performance of GBM in the prediction of recovered cases of COVID-19 of Maharashtra, India
Fig. 10.
Performance of GBM in the prediction of active cases of COVID-19 of Gujarat, India
Fig. 11.
Performance of GBM in the prediction of recovered cases of COVID-19 of Gujarat, India
Discussion
Tree-based machine learning approaches are quite useful in the modeling of small as well as big datasets in past studies [35, 36]. The GBM can be used for pandemic prediction and has high efficiently [36]. For this reason, the GBM approach was selected for the modeling of the transmission rate of COVID-19 in India using the atmospheric factors. India has a large geographical region, due to which there is a huge variation in the weather parameters (Table 1, Figs. 1 and 2). It is obvious from the statistical description of weather parameters, like, fluctuation of minimum temperature between −18 °C to 41 °C, maximum temperature between −8 °C to 44 °C, minimum humidity between 1% to 77%, and maximum humidity between 7%–99%. Besides, a huge variation in the number of cases (both active and recovered) of COVID-19 has been noticed in different parts of India. Specifically, it is in between 0 to 4591 for active cases and 0 to 789 for the recovered cases (Fig. 3). Considering the earlier mentioned variations in the weather parameters and the number of COVID-19 cases, a total of 702 instances was used from 27 different states of India for 26 days and used in GBM analysis. The statistical analysis of the parameters of the dataset suggests their unequal distribution.
ANOVA test results (Table 2) reject the null hypothesis and suggest that all parameters of datasets are significant. The GBM was trained by using the combined dataset of all states and optimized for the distribution functions and their parameters. The overall performance results of GBM in terms of R2, MSE, RMSE, MAE, and MRD (Table 4, Figs. 4 and 5) suggests the better performance of Poisson distribution in the prediction of both active and recovered cases of COVID-19. The performance of the different distribution function in the training of the GBM has subsequent trends (on the basis the performance measures): Poisson ˃ Gaussian ˃ Tweedie ˃ Gamma ˃ Huber ˃ Quantile. It may because the numbers of recovered and active cases of COVID-19 follow the Poisson distribution. Further research is required to establish this fact. Moreover, due to the highest accuracy of the Poisson distribution, it was used in the prediction of COVID-19 cases in different states of India, individually (Table 4). The best performance of GBM has been achieved in the prediction of recovered cases of Kerala (R2 = 0.98). GBM has R2 values between 0.95–0.61 for other states (Maharashtra, Gujarat, Andhra Pradesh, Haryana, and Rajasthan). It was also noticed that in some states the GBM has better prediction performance for the recovered cases than the active cases, like Kerala, Haryana, West Bengal, Telangana, and Rajasthan. Moreover, for some other states, like Gujarat, Uttar Pradesh, and Madhya Pradesh, GBM has better prediction accuracy for the active cases than the recovered cases. The recovery rate of COVID-19 was very low in Uttar Pradesh and Madhya Pradesh in the last week of March and in the first week of April 2020. This is also a reason for the average performance (R2 of 0.43 and 0.21, respectively) of the GBM model in the prediction of recovered cases of COVID-19 in the earlier two states. Similarly, the low number of reported active cases of COVID-19 in West Bengal and Telangana up to the first week of April 2020, results in the average prediction performance of the GBM (R2 of 0.29, and 0.19, respectively).
Those states for which GBM has high accuracy in the prediction of active and recovered cases of COVID-19 using the average temperature and humidity indicates the minor effect of atmospheric factors in the transmission rate of COVID-19. Though for the rest of the states in which the GBM has less accuracy of prediction of active and recovered cases, the atmospheric factors might have a major effect on the transmission rate of COVID-19. The role of atmospheric factors, like temperature and humidity in the transmission rate of COVID-19, is still uncertain and may vary according to location. Though, a negative correlation between the transmission rate of COVID-19 and the temperature and humidity was discussed in some recent studies. Ahmadi et al. [20] have concluded the high transmission rate of COVID-19 cases in Iran at low humidity and temperature; Wang et al. [16] have also reported the low transmission rate of COVID-19 cases in China at high temperature and humidity; Qi et al. [19] have described a negative correlation between the transmission rate of COVID-19 and the average temperature and average humidity, and Tosepu et al. [21] have established a positive Spearman-rank correlation (r = 0.392) between average temperature and cases of COVID-19 in Indonesia. Besides, the analysis outcomes of the ARIMA model and polynomial function [37] suggested the future scope of humidity and other atmospheric factors in the prediction of COVID-19 cases in the different geographic regions. Based on the collected atmospheric parameters and number of cases of COVID-19 in different states of India during the mentioned period, the states with low average temperature and humidity like, Himachal Pradesh, Uttrakhand, Jammu and Kashmir, Arunachal Pradesh, Mizoram, and Sikkim, etc. have a low number of active cases of COVID-19 while the other states with high average temperature and humidity like, Delhi, Gujarat, Maharashtra, Kerala, and Rajasthan have a high number of active cases of COVID-19. It means the average temperature and humidity have mostly positive correlation with the increasing cases COVID-19 in most of the states of India during the selected period of time. The higher population density may be also a reason for the earlier fact. Though, the increase in temperature and humidity increased the rate of recovery in most of the states. More data sets need to be combined and analyzed to make a concrete conclusion about the impact of the weather parameters on the transmission rate of COVID-19.
It was noticed that GBM has high prediction accuracy in the prediction of both active as well as the recovered cases of some states of India. Specifically, the three states Delhi, Maharashtra, and Gujarat which are worst hit by the pandemic having the maximum number of active cases compared with the rest of the states of India. Tables 5, 6 and 7 and Figs. 7, 8, 9 and 10 demonstrate the detailed performance of GBM in using different distribution functions. The test results of Delhi are significant with Poisson and Gaussian distribution that reflects the actual recovery rate. The active cases captured by Poisson and Huber distribution also reflect the real data, but some peaks show the spreading tendency. The prediction results of Maharashtra and Gujarat have high variability and reflect the sudden peaks with some irregular and short intervals that also match with the real condition of these two states. The performance of the implemented GBM approach in the present study is comparable or better than some of the previously implemented approaches in the prediction of transmission rates of COVID-19 by including the weather parameters. The weather dataset was not available (NA) for some states at the time of collection. The NA data were replaced by the median value of instances during the analysis that may be also a cause for the poor performance of the GBM model in the prediction of COVID-19 cases for these states. The transmission speed of COVID-19 was very low in some states of the country before 15th April 2020; which results in the non-availability of the dataset of COVID-19. It also affects the prediction performance of the GBM model. The performance of Gaussian distribution based GBM is compared with the deep neural network and random forest (RF) models using a similar dataset. The comparative experimental results (Table 8) suggest that GBM performs better than other models. It is obvious that deep neural network has poor performance in the prediction of active and recovered cases (R2 equal to 0.22 and 0.02, respectively). The RF approach has an average performance in the prediction of active and recovered cases (R2 equal to 0.59 and 0.33, respectively). The comparative performance of three models in terms of R2 is as follows: GBM > RF > deep neural network. Besides, the GBM has better performance than rest two approaches in terms of other evaluation measures, like MSE, RMSE, MAE, and MRD.
Table 8.
Comparative performance of GBM, random forest, and deep neural network in the analysis of combined training dataset of all states of India
| Approach | Performance measures of random forest and deep neural network and GBM models | |||||||||
|---|---|---|---|---|---|---|---|---|---|---|
| Active cases modeling | Recovered cases modeling | |||||||||
| R2 | MSE | RMSE | MAE | MRD | R2 | MSE | RMSE | MAE | MRD | |
| Random forest | 0.59 | 136,919.20 | 370.02 | 187.02 | 136,919.20 | 0.33 | 6607.79 | 81.28 | 39.39 | 6607.79 |
| Deep neural network | 0.22 | 264,411.60 | 514.20 | 275.35 | 116,327.90 | 0.02 | 9628.01 | 98.12 | 42.31 | 3395.10 |
| Gradient boosting machine | 0.99 | 3075.37 | 55.46 | 35.89 | −2846.53 | 0.99 | 94.35 | 9.71 | 6.63 | −357.78 |
Note: R2 (coefficient of determination), MSE (mean square error), RMSE (root mean square error), MAE (mean average error), and MRD (mean residual deviance)
The deep neural network is one of the most useful techniques in image processing and achieved better performance in several past studies, like in emotion recognition using the combination of deep convolutional neural network and kernel learning classifier [38]. Moreover, the strategies to improve the performance of the deep neural network in the analysis of data of different experimental domains have been discussed in some past studies, like using a training approach [39], generalized maxout networks [40], and transfer learning [41], etc. Deep learning has better performance in the analysis of categorical feature datasets whereas tree-based learning is better in the dense numerical feature dataset [42]. Moreover, the performance of the deep learning approaches varies according to the nature and the dimensionality of the dataset [43]. In the case of a relational dataset, its performance is inferior to the tree-based learning algorithms [44]. It may be due to the fact that a tree-based algorithm is prone to overfitting and gives better results in the case of high dimensionality. The COVID-19 dataset used in the present analysis has high dimensionality and relational in nature, this may be the reason for the deprived performance of a deep neural network method. The deprived performance of deep neural network in the present analysis, even after optimization of its parameters may be also due to the small size, randomness, noise, and missing values, etc. in the dataset.
Conclusions and future research scope
The present study established an association between the number of cases of COVID-19 and meteorological parameters in different states of India. The study implemented an efficient method of predictive modeling using the GBM based machine learning approach. The experimental results suggest that the GBM model is capable to capture the correlation between the cases of COVID-19 and atmospheric parameters. The maximum achieved values of the R2 and minimum values of the errors of the GBM suggest a certain association between the atmospheric factors and transmission rates of COVID-19 in some states of India, specifically in Delhi, Maharashtra, and Gujarat. Future research will include the additional meteorological parameters for a better understanding of the dependence of the transmission rate of COVID-19 on atmospheric conditions by using an efficient and robust machine learning approach. Also, the performance of the deep neural network needs to be improved in handling pandemic data.
Acknowledgments
The authors acknowledge the editor and eminent reviewers for their valuable comments and suggestions.
Availability of data and material
Not applicable.
Biographies
Lokesh Kumar Shrivastav
received his B. Sc. in Physics, MCA, and M. Tech from B.S.B.A.B. University, IGNOU, and Amity University, India respectively. He is pursuing his Ph. D from Guru Gobind Singh Indraprastha University, India. His research interest includes mathematical modeling of infectious disease dynamics and prediction, machine Learning, data analytics.
Sunil Kumar Jha
received the B.Sc. and M.Sc. degrees in Physics from VBS Purvanchal University, India, in 2003 and 2005, and Ph.D. in Physics from Banaras Hindu University, India, in 2012. From 2012 to 2014, he was a postdoctoral researcher at Kyushu University, Japan, and Hanyang University, South Korea. From 2015 to 2016, he worked as assistant professor at the University of Information Science and Technology, Macedonia, and the University of Information Technology and Management, Poland. His research interests include data mining and pattern recognition applications, chemoinformatics, health informatics, renewable energy, and image processing, etc.
Compliance with ethical standards
Conflicts of interest/competing interests
Authors declares no conflict of interest.
Code availability
Not applicable.
Footnotes
Publisher’s note
Springer Nature remains neutral with regard to jurisdictional claims in published maps and institutional affiliations.
References
- 1.World Health Organization (2020) Coronavirus disease (COVID-19) Pandemic. https://www.who.int/emergencies/diseases/novel-coronavirus-2019. Accessed 2 May, 2020
- 2.Zheng YY, Ma YT, Zhang JY, Xie X. COVID-19 and the cardiovascular system. Nat Rev Cardiol. 2020;17:259–260. doi: 10.1038/s41569-020-0360-5. [DOI] [PMC free article] [PubMed] [Google Scholar]
- 3.Singhal T. A review of coronavirus disease-2019 (COVID-19) Indian J Pediatr. 2020;87:281–286. doi: 10.1007/s12098-020-03263-6. [DOI] [PMC free article] [PubMed] [Google Scholar]
- 4.Hu Z, Song C, Xu C, Jin G, Chen Y, Xu X, Ma H, Chen W, Lin Y, Zheng Y, Wang J. Clinical characteristics of 24 asymptomatic infections with COVID-19 screened among close contacts in Nanjing. Sci China Life Sci. 2020;63:706–711. doi: 10.1007/s11427-020-1661-4. [DOI] [PMC free article] [PubMed] [Google Scholar]
- 5.Adhikari SP, Meng S, Wu YJ, Mao YP, Ye RX, Wang QZ, Sun C, Sylvia S, Rozelle S, Raat H, Zhou H. Epidemiology, causes, clinical manifestation and diagnosis, prevention and control of coronavirus disease (COVID-19) during the early outbreak period: a scoping review. Infect Dis Poverty. 2020;9(29):1–12. doi: 10.1186/s40249-020-00646-x. [DOI] [PMC free article] [PubMed] [Google Scholar]
- 6.Xu X, Chen P, Wang J, Feng J, Zhou H, Li X, Zhong W, Hao P. Evolution of the novel coronavirus from the ongoing Wuhan outbreak and modeling of its spike protein for risk of human transmission. Sci China Life Sci. 2020;63(3):457–460. doi: 10.1007/s11427-020-1637-5. [DOI] [PMC free article] [PubMed] [Google Scholar]
- 7.Guo YR, Cao QD, Hong ZS, Tan YY, Chen SD, Jin HJ, Tan KS, Wang DY, Yan Y. The origin, transmission and clinical therapies on coronavirus disease 2019 (COVID-19) outbreak–an update on the status. Mil Med Res. 2020;7(11):1–10. doi: 10.1186/s40779-020-00240-0. [DOI] [PMC free article] [PubMed] [Google Scholar]
- 8.Zhang W, Du RH, Li B, Zheng XS, Yang XL, Hu B, Wang YY, Xiao GF, Yan B, Shi ZL, Zhou P. Molecular and serological investigation of 2019-nCoV infected patients: implication of multiple shedding routes. Emerg Microbes Infect. 2020;9(1):386–389. doi: 10.1080/22221751.2020.1729071. [DOI] [PMC free article] [PubMed] [Google Scholar]
- 9.Ong SWX, Tan YK, Chia PY, Lee TH, Ng OT, Wong MSY, Marimuthu K. Air, surface environmental, and personal protective equipment contamination by severe acute respiratory syndrome coronavirus 2 (SARS-CoV-2) from a symptomatic patient. JAMA. 2020;323(16):1610–1612. doi: 10.1001/jama.2020.3227. [DOI] [PMC free article] [PubMed] [Google Scholar]
- 10.Liu C, Zhou Q, Li Y, Garner LV, Watkins SP, Carter LJ, Smoot J, Gregg AC, Daniels AD, Jervey S, Albaiu D. Research and development on therapeutic agents and vaccines for COVID-19 and related human coronavirus diseases. ACS Cent Sci. 2020;6(3):315–331. doi: 10.1021/acscentsci.0c00272. [DOI] [PMC free article] [PubMed] [Google Scholar]
- 11.Ministry of Health and Family Welfare Government of India (2020) COVI-19 India. https://www.mohfw.gov.in. Accessed 2 May, 2020
- 12.Lin K, Fong DYT, Zhu B, Karlberg J. Environmental factors on the SARS epidemic: air temperature, passage of time and multiplicative effect of hospital infection. Epidemiol Infect. 2006;134(2):223–230. doi: 10.1017/S0950268805005054. [DOI] [PMC free article] [PubMed] [Google Scholar]
- 13.Lowen AC, Mubareka S, Steel J, Palese P. Influenza virus transmission is dependent on relative humidity and temperature. PLoS Pathog. 2007;3(10):e151. doi: 10.1371/journal.ppat.0030151. [DOI] [PMC free article] [PubMed] [Google Scholar]
- 14.Ma Y, Zhao Y, Liu J, He X, Wang B, Fu S, Yan J, Niu J, Zhou J, Luo B. Effects of temperature variation and humidity on the death of COVID-19 in Wuhan. China. Sci Total Environ. 2020;724:138226. doi: 10.1016/j.scitotenv.2020.138226. [DOI] [PMC free article] [PubMed] [Google Scholar]
- 15.Oliveiros B, Caramelo L, Ferreira NC, Caramelo F (2020) Role of temperature and humidity in the modulation of the doubling time of COVID-19 cases. MedRxiv. 10.1101/2020.03.05.20031872
- 16.Wang M, Jiang A, Gong L, Luo L, Guo W, Li C, Zheng J, Li C, Yang B, Zeng J, Chen Y (2020) Temperature significant change COVID-19 transmission in 429 cities. MedRxiv. 10.1101/2020.02.22.20025791
- 17.Zhu Y, Xie J. Association between ambient temperature and COVID-19 infection in 122 cities from China. Sci Total Environ. 2020;724:138201. doi: 10.1016/j.scitotenv.2020.138201. [DOI] [PMC free article] [PubMed] [Google Scholar]
- 18.Mecenas P, Bastos R, Vallinoto A, Normando D (2020) Effects of temperature and humidity on the spread of COVID-19: a systematic review. MedRxiv. 10.1101/2020.04.14.20064923 [DOI] [PMC free article] [PubMed]
- 19.Qi H, Xiao S, Shi R, Ward MP, Chen Y, Tu W, Su Q, Wang W, Wang X, Zhang Z. COVID-19 transmission in mainland China is associated with temperature and humidity: a time-series analysis. Sci Total Environ. 2020;728:138778. doi: 10.1016/j.scitotenv.2020.138778. [DOI] [PMC free article] [PubMed] [Google Scholar]
- 20.Ahmadi M, Sharifi A, Dorosti S, Ghoushchi SJ, Ghanbari N. Investigation of effective climatology parameters on COVID-19 outbreak in Iran. Sci Total Environ. 2020;729:138705. doi: 10.1016/j.scitotenv.2020.138705. [DOI] [PMC free article] [PubMed] [Google Scholar]
- 21.Tosepu R, Gunawan J, Effendy DS, Lestari H, Bahar H, Asfian P. Correlation between weather and Covid-19 pandemic in Jakarta, Indonesia. Sci Total Environ. 2020;725:138436. doi: 10.1016/j.scitotenv.2020.138436. [DOI] [PMC free article] [PubMed] [Google Scholar]
- 22.Ramesh AN, Kambhampati C, Monson JR, Drew PJ. Artificial intelligence in medicine. Ann R Coll Surg Engl. 2004;86(5):334–338. doi: 10.1308/147870804290. [DOI] [PMC free article] [PubMed] [Google Scholar]
- 23.Jiang F, Jiang Y, Zhi H, Dong Y, Li H, Ma S, Wang Y, Dong Q, Shen H, Wang Y. Artificial intelligence in healthcare: past, present and future. SVN. 2017;2(4):230–243. doi: 10.1136/svn-2017-000101. [DOI] [PMC free article] [PubMed] [Google Scholar]
- 24.Jha SK, Pan Z, Elahi E, Patel N. A comprehensive search for expert classification methods in disease diagnosis and prediction. Expert Syst. 2019;36(1):e12343. doi: 10.1111/exsy.12343. [DOI] [Google Scholar]
- 25.Pham QV, Nguyen DC, Hwang WJ, Pathirana PN (2020) Artificial intelligence (AI) and big data for coronavirus (COVID-19) pandemic: a survey on the state-of-the-arts. Preprints. 10.20944/preprints202004.0383.v1 [DOI] [PMC free article] [PubMed]
- 26.Li L, Qin L, Xu Z, Yin Y, Wang X, Kong B, Bai J, Lu Y, Fang Z, Song Q, Cao K (2020) Artificial intelligence distinguishes covid-19 from community acquired pneumonia on chest ct. Radiology 200905. 10.1148/radiol.2020200905 [DOI] [PMC free article] [PubMed]
- 27.Rao ASS, Vazquez JA. Identification of COVID-19 can be quicker through artificial intelligence framework using a mobile phone-based survey in the populations when cities/towns are under quarantine. Infect Control Hosp Epidemiol. 2020;41(7):826–830. doi: 10.1017/ice.2020.61. [DOI] [PMC free article] [PubMed] [Google Scholar]
- 28.McCall B. COVID-19 and artificial intelligence: protecting health-care workers and curbing the spread. Lancet Digit Health. 2020;2(4):e166–e167. doi: 10.1016/S2589-7500(20)30054-6. [DOI] [PMC free article] [PubMed] [Google Scholar]
- 29.Allam Z, Jones DS (2020) On the coronavirus (COVID-19) outbreak and the smart city network: universal data sharing standards coupled with artificial intelligence (AI) to benefit urban health monitoring and management. In healthcare: 8 (1): 46. Multidisciplinary Digital Publishing Institute. 10.3390/healthcare8010046 [DOI] [PMC free article] [PubMed]
- 30.Central Pollution Control Board, Ministry of Environment, Forest and Climate Change, Government of India (2020) Air pollution. https://www.cpcb.nic.in. Accessed 2 May, 2020
- 31.India Meteorological Department, Ministry of Earth Science, Government of India (2020) Meteorological Data. https://mausam.imd.gov.in. Accessed 2 May, 2020
- 32.Covid19 India (2020). https://www.covid19india.org. Accessed 2 May, 2020
- 33.The H2O.ai Team (2015) h2o: R Interface for H2O, R package version 3.1.0.99999. http://www.h2o.ai. Accessed 2 May, 2020
- 34.Hastie T, Tibshirani R, Friedman J. The elements of statistical learning: data mining, inference, and prediction. New York: Springer; 2009. [Google Scholar]
- 35.Geurts P, Irrthum A, Wehenkel L. Supervised learning with decision tree-based methods in computational and systems biology. Mol BioSyst. 2009;5(12):1593–1605. doi: 10.1039/B907946G. [DOI] [PubMed] [Google Scholar]
- 36.Chen X, Huang L, Xie D, Zhao Q. EGBMMDA: extreme gradient boosting machine for MiRNA-disease association prediction. Cell Death Dis. 2018;9(1):1–16. doi: 10.1038/s41419-017-0003-x. [DOI] [PMC free article] [PubMed] [Google Scholar]
- 37.Hernandez-Matamoros A, Fujita H, Hayashi T, Perez-Meana H. Forecasting of COVID19 per regions using ARIMA models and polynomial functions. Appl Soft Comput. 2020;96:106610. doi: 10.1016/j.asoc.2020.106610. [DOI] [PMC free article] [PubMed] [Google Scholar]
- 38.Poria S, Chaturvedi I, Cambria E, Hussain A (2016) Convolutional MKL based multimodal emotion recognition and sentiment analysis. In: 2016 IEEE 16th international conference on data mining (ICDM), pp 439–448. 10.1109/ICDM.2016.0055
- 39.Caliskan A, Yuksel ME, Badem H, Basturk A. Performance improvement of deep neural network classifiers by a simple training strategy. Eng Appl Artif Intell. 2018;67:14–23. doi: 10.1016/j.engappai.2017.09.002. [DOI] [Google Scholar]
- 40.Zhang X, Trmal J, Povey D, Khudanpur S (2014) Improving deep neural network acoustic models using generalized maxout networks. In 2014 IEEE international conference on acoustics, speech and signal processing (ICASSP), pp 215–219. 10.1109/ICASSP.2014.6853589
- 41.Amaral T, Silva LM, Alexandre LA, Kandaswamy C, de Sá JM, Santos JM (2014) Transfer learning using rotated image data to improve deep neural network performance. In international conference image analysis and recognition, pp 290–300. 10.1007/978-3-319-11758-4_32
- 42.Ke G, Xu Z, Zhang J, Bian J, Liu TY (2019) DeepGBM: a deep learning framework distilled by GBDT for online prediction tasks. In proceedings of the 25th ACM SIGKDD international conference on Knowledge Discovery & Data Mining, pp 384–394. 10.1145/3292500.3330858
- 43.Caruana R, Niculescu-Mizil A (2006) An empirical comparison of supervised learning algorithms. In proceedings of the 23rd international conference on machine learning, pp 161–168. 10.1145/1143844.1143865
- 44.Chen T, Guestrin C (2016, August) Xgboost: a scalable tree boosting system. In proceedings of the 22nd ACM SIGKDD international conference on knowledge discovery and data mining, pp 785–794. 10.1145/2939672.2939785
Associated Data
This section collects any data citations, data availability statements, or supplementary materials included in this article.
Data Availability Statement
Not applicable.


