

SUMMARY
Background & aims:
Obesity is a major cause of non-alcoholic fatty liver disease (NAFLD). NAFLD is an epidemic affecting nearly 34% of the adult population in the US. As a chronic inflammatory disease, NAFLD influences the immune system by dysregulating T-cell activity. Remedies for the adverse effects on the immune system are urgently needed. We studied Theaphenon E (TE), a standardized formulation of green tea extract, on the adverse effects of NAFLD in C57BL/6J mice fed a high fat diet (HFD).
Methods:
Mice received HFD, low fat diet (LFD) or HFD+2% TE for 35 weeks. Hepatic lipid accumulation, cell proliferation, apoptosis and CD4+T lymphocytes were measured throughout the bioassay. The hepatic composition of fatty acids was determined. The effects of epigallocatechin gallate (EGCG) metabolites on lipid accumulation in mouse and primary human liver cells were studied.
Results:
Unlike mice receiving HFD, mice on HFD+2% TE maintained normal liver to body weight ratios with low levels of alanine and aspartate aminotransferase (ALT and AST). Hepatic lipid accumulation was observed in HFD mice, accompanied by increased proliferation, reduced apoptosis and loss of CD4+ T lymphocytes. TE significantly inhibited lipid accumulation, decreased proliferation, induced apoptosis and increased CD4+ T cell survival in HFD mice. It was found that the EGCG metabolite EGC-M3 reduced lipid accumulation in mouse and human hepatocytes. Linoleic acid showed the largest increase (2.5-fold) in livers of mice on a HFD and this increase was significantly suppressed by TE.
Conclusions:
Livers of HFD-fed mice showed lipid accumulation, increased proliferation, reduced apoptosis, elevated linoleic acid and loss of CD4+ T cells. TE effectively ameliorated all of these adverse effects.
Keywords: Non-alcoholic fatty liver disease, Prevention by green tea, Linoleic acid, CD4+T cells
1. Introduction
Obesity and the related diseases of metabolic syndrome and type 2 diabetes are becoming an epidemic that has reached global proportions. Nearly 34% of the adult population in the US suffers from fatty liver disease or steatosis, a condition in which at least 5% of the liver volume consists of lipid [1,2]. Obesity is now the leading risk factor for the development of hepatocellular carcinoma (HCC) in the United States [3]. Consumption of a western diet rich in fat, cholesterol, sugar and salt, leads to not only obesity, but also metabolic syndromes and other related health complications [4]. As a chronic inflammatory disease, obesity-induced steatosis in non-alcoholic fatty liver disease (NAFLD) increases the generation of reactive oxygen species (ROS) which elevates the risk of HCC [5]. Obesity can influence the immune system response leading to dysregulation of T-cell mediated activity, including CD4+T cells [6]. Remedies to ameliorate the adverse effects of obesity and NALFD on the immune system are urgently needed.
Catechins in green tea, such as epigallocatechin gallate (EGCG), are antioxidants known to prevent weight gain and tumorigenesis [7]. We recently reported that a standardized formulation of green tea extract called Theaphenon E (TE) effectively prevents hepatocellular carcinoma (HCC) development in XPA knockout mice and in mice exposed to diethylnitrosamine, presumably through its antioxidant activity to nullify the DNA damaging effects resulting from increased lipid peroxidation in livers of these mice [8]. We also demonstrated in a more relevant model the remarkable effect of TE to completely block HCC development in C57BL/6J mice on a high fat diet (HFD) alone [9]. Ma et al. previously showed that NAFLD in mice receiving the methionine-choline-deficient diet causes ROS production as a result of linoleic acid accumulation, leading to the selective killing of CD4+ T lymphocytes in mice [10]. CD4+T cells constituting the adaptive immune response that protects against pathogens and cellular damage in the liver have been reported to inhibit HCC initiation and progression through remodeling of tumor microenvironment required for tumor regression and senescence surveillance of pre-malignant hepatocytes [11-13]. Consequently, the loss of CD4+ T cells promotes liver cancer. Little is known about the effects of feeding HFD on hepatic CD4+T lymphocytes and whether green tea extract (TE) can modulate the survival of these cells. In an obesity model of C57BL/6J mice fed HFD, we examined how HFD-induced NAFLD affects CD4+T cells and whether TE mitigates its adverse effects. We demonstrated for the first time that TE ameliorates the effects of HFD-induced CD4+ T cell loss, possibly by alleviating the accumulation of linoleic acid in fatty livers. These results shed light onto a possible mechanism for the protective effects of TE against NAFLD-related hepatocarcinogenesis in HFD-fed mice.
2. Materials and methods
2.1. Mouse bioassay
Male C57BL/6J mice were purchased from The Jackson Laboratory (Bar Harbor, ME. Stock No. 000664) at three weeks of age. A total of 105 mice overall and 35 per group. They were fed either a HFD, LFD or HFD+2% TE starting at 4 weeks of age. Tissue and blood from five mice were collected per group after 0, 5, 10, 25 and 35 weeks on the diet. Livers were harvested, weighed and imaged for gross morphology and sections were formalin fixed for IHC. Food consumption and body weight were recorded weekly. The mouse bioassay was conducted in conformity with PHS policy and the studies were approved by the AAALAC accredited Georgetown University Institutional Review Board and Institutional Animal Care and Use Committee (Protocol #2016-1179).
2.2. Diet
The diet was obtained from Dyets Inc. (Bethleham, PA) and provided to the mice ad libitum. The HFD (Cat # 402400) had 61.3% kcal fat, 18.4% kcal protein, and 20.3% kcal carbohydrates. The LFD (#404360) was 10.5% kcal fat, 18.9% kcal protein, and 70.6% kcal carbohydrates. The HFD + TE was the same HFD above, supplemented with 2% TE by weight (Tea Solution, Inc., Tokyo, Japan). The diet composition of HFD and LFD is shown in Table S1. Table S2 shows the specifications of TE composition (provided by Dr. Hara of Tea Solution, Inc.). Based on data provided by Dyets, Inc., the fat contents in kcal/kg of each diet are detailed in Fig. S1. Statistical significance was calculated using a T-test on the average food consumed between each group in each time point in Fig. S2.
2.3. MRI imaging
In vivo magnetic resonance imaging (MRI) of mouse fat depots was performed in the Preclinical Imaging Research Laboratory at the Georgetown University Medical Center in a 7-Tesla horizontal Bruker spectrometer run by Paravision 5.1. Mice were anesthetized with isoflurane in a gas mixture of 30% oxygen and 70% nitrous oxide (3–5% of anesthetic for induction and 1–3% for maintenance) and placed on a custom-manufactured (ASI Instruments, Warren, MI) stereotaxic device with built-in temperature and cardiorespiratory monitoring engineered to fit a Bruker mouse volume coil, as previously described [14]. The sequence used to non-invasively identify adipose tissue was a three-dimensional T1-weighted rapid acquisition with rapid enhancement (RARE) sequences with the following parameters: TR: 250 ms, TE: 34.3 ms, FA: 74.1, Matrix: 156 x 128 x 156. Quantification of visceral fat depots in the imaging datasets was performed by thresholding and voxel-counting with ImageJ software (NIH) as described previously [15]. Briefly, we used a maximum intensity projection algorithm of the 3D-reconstructed image with an intensity threshold intended to segment either fat only or all mouse tissues. This was specifically measured in a region of interest that included only the abdomen. The percentage of visceral adipose depots was calculated by counting the voxels corresponding to visceral fat versus the voxels corresponding to all mouse tissues in the abdominal region of interest.
2.4. Immunohistochemistry (IHC)
2.4.1. Ki67
Five micron sections from formalin fixed paraffin embedded tissues were de-paraffinized with xylenes and rehydrated through a graded alcohol series. Heat induced epitope retrieval (HIER) was performed by immersing the tissue sections at 98 °C for 20 min in Diva Decloaker (Biocare). Immunohistochemical staining was performed using a horseradish peroxidase labeled polymer from Dako/Agilent (K4003) according to manufacturer's instructions. Briefly, slides were treated with 3% hydrogen peroxide and 10% normal goat serum for 10 min each, and exposed to primary antibodies for Ki67 (Biocare, cat. CRM325, 1:50 dilution in VanGough diluent) overnight at 4 °C. Slides were exposed to anti-rabbit HRP labeled polymer for 30 min and DAB chromagen (Dako/Agilent) for 5 min. Slides were counterstained with Hematoxylin (Fisher, Harris Modified Hematoxylin), blued in 1% ammonium hydroxide, dehydrated, and mounted with Acrymount. All washes were performed with Tris Buffered Saline with 0.5% Tween. Consecutive sections with the primary antibody omitted were used as negative controls.
2.4.2. CD4
Same as above. HIER was performed by immersing the tissue sections at 98 °C for 20 min in Envision FLEX High pH retrieval solution from Dako/Agilent (K8004). Briefly, slides were treated as described above, and exposed to primary antibodies for CD4+T cells (1:600, Abcam ab183685) for 1 h at room temperature. Slides were exposed to an anti-rabbit HRP labeled polymer for 30 min and DAB chromagen (Dako/Agilent) for 5 min. Slides were counterstained with Hematoxylin (Fisher, Harris Modified Hematoxylin), blued in 1% ammonium hydroxide, dehydrated, and mounted with Acrymount. Consecutive sections with the primary antibody omitted were used as negative controls.
2.4.3. TUNEL assay
Terminal Transferase dUTP Nick End Labeling (TUNEL) Assay was performed using the Apotag kit from Millipore with minor modifications. Briefly, five micron sections from formalin fixed paraffin embedded tissues were de-paraffinized with xylenes and rehydrated through a graded alcohol series. HIER was performed by immersing the tissue sections at 98 °C for 20 min in 10 mM citrate buffer (pH 6.0) with 0.05% Tween. Slides were pretreated with 3% hydrogen peroxide at room temperature, 10 mM Sodium Citrate at 65 °C, and Equilibration Buffer at RT. Slides were exposed to terminal transferase and digoxigenin labeled dUTP in Reaction Buffer for 1 h at 37 °C, stopped in Wash Buffer and blocked with 10% normal goat serum at RT. Slides were exposed to 1:2100 dilution of HRP-conjugated anti-digoxigenin antibody (Roche) for 1 h and DAB chromagen (Dako) for 5 min. Slides were counterstained with Hematoxylin (Fisher, Harris Modified Hematoxylin) at a 1:9 dilution for 2 min, blued in 1% ammonium hydroxide for 1 min, dehydrated, and mounted with Acrymount. For negative controls, consecutive sections were treated identically except that the terminal transferase enzyme was omitted and replaced by tris buffered saline in the reaction mixture. Images were captured using an Olympus DP70 camera on an Olympus BX61 microscope.
2.5. Cell count analysis
A minimum of five fields of view were analyzed for each liver collected at every time point following IHC of Ki67, CD4 and TUNEL. Positive stained nuclei as a percentage of total cells per image were calculated both manually using ImageJ and using the program TMarker (ETH Zurich, Switzerland) [16]. A T-test between the average of each group in every time point was used to determine the p-value.
2.6. Liver function and injury
The levels of alanine aminotransferase (ALT) and aspartate aminotransferase (AST) were assessed using Activity Assay Kits (Sigma-Aldrich #MAK052 and MAK055 respectively) according to manufacturer's protocol. ALT and AST were detected in the serum of the HFD, LFD and HFD + TE mice collected from each time point. A T-test between the average of each group in every time point was used to determine the p-value.
2.7. Immunocytochemistry of primary human hepatocytes (HH) and mouse AML12 liver cells after treating with fatty acid (FA) and FA + TE
HH (#HUFS1M, Lot#HUM4132, Triangle Research Labs, Durham, NC) were cultured in hepatocyte media (#5201, ScienCell Research Laboratories, Carlsbad, CA). AML12 cells (ATCC, CRL-2254) were cultured in complete DMEMα (Corning, 10-022-CV). The cells were treated with either control media, FA media, control media with 10 mg/mL TE or FA media with TE. FA media consisted of oleic and palmitic acid, (Sigma, St. Louis) in a 2:1 ratio, respectively and dissolved in 1% bovine serum albumin in PBS for a final concentration of 1 mM. Following treatment, cells were fixed with 3.7% formaldehyde for 15 min at room temperature and washed three times with 1X Phosphate buffered saline (PBS). To stain with Nile Red (Sigma, St. Louis, MO), 1 μl of a 1 mg/mL stock solution was added to 10 mL of 150 mM NaCl in PBS to make a Nile Red solution. The Nile Red solution was added to the cells and incubated for 10 min in the dark. Following incubation, the cells were washed three times with 1X PBS and stained with DAPI (Thermofisher, Waltham, MA) for 4 min according to manufacturer recommendations. Slides were mounted using EMS Fluoro-Gel (17985-10) and imaged on an Olympus IX-71 Inverted Epifluorescence Scope.
2.8. Treatment of HH and AML12 cells with EGCG metabolites
EGCG metabolite: EGC-M3: 1-(3′,5′-dihydroxyphenyl)-3-(2″,4″,6″-trihydroxyphenyl) propan-2-ol, EGC-M4: 4-hydroxy-5-(3′,5′-dihydroxyphenyl) valeric acid and EGC-M5: 5-(3′,5′-dihydroxy-phenyl)-γ-valerolactone were generously provided by Dr. Masayuki Suzuki (Mitsui Norin Co, Tokyo, Japan). HH and AML12 cells were treated up to three days with either control media, FA media or control media with 10 μg/mL EGC-M3, EGC-M4 or EGC-M5 and FA media with each of the three metabolites. The cells were fixed and stained with Nile Red as described above.
2.9. Proliferation assay
HH and AML12 cells were grown in a 96 well plate and treated with FA and the metabolites as described above. WST-1 (Sigma, 05015944001) was added at the indicated timepoints and the absorbance was measured according to manufacturer recommendations. T-tests performed on the results of triplicate readings provided the p-value.
2.10. Analysis of FA in mouse liver by gas chromatography mass spectrometry
Liver samples (~50 mg) were homogenized in 0.5 ml methanol:water (1:1) with an internal standard (17:0-d3) and protein quantification was performed with a Pierce™ BCA Protein Assay Kit according to manufacturer instructions. Samples were saponified with 0.5 ml 1M KOH in methanol for 2 h at room temperature with stirring. Samples were centrifuged and the supernatant transferred and acidified to a pH of 4.5 with 1N HCL solution. Lipids were extracted with isooctane (3 × 0.5 ml) and ethyl acetate (3 × 0.5 ml). The organic layers were combined, evaporated, and the residue was derivatized with 100 μl 2M trimethylsilyl diazomethane in hexane:methanol:acetone (1:2:2) for 20 min at room temperature before injection (1.5 μl) [17]. Samples were analyzed with a Leco Pegasus HT gas chromatography (GC) time-of-flight (TOF) mass spectrometry (MS) (St. Joseph, MI) with a Rtx®−5 (G27) column (5% diphenyl/95% dimethyl polysiloxane, 30 m × 0.25 mm x 0.25 μm). The inlet and transfer line temperatures were 150 °C and 320 °C, respectively. The oven temperature program was 150 °C for 0.2 min, then 150 °C–240 °C at 8 °C/min (held 7 min), then 240 °C–320 °C at 40 °C/min (held 2 min). Injection conditions were 1:10 split, carrier gas helium, 0.8 ml/min constant gas flow rate, 200 s solvent delay. Electron ionization mass spectra were collected (m/z 40 to 600) with the ion source 220 °C and 20 spectra/sec acquisition rate. Data acquisition and analysis were performed with ChromaTOF® software with the statistical compare function (Leco Corp., v. 4.51.6.0) as previously described [18].
2.11. Statistical analysis
A nonparametric one-way ANOVA with Tukey's multiple comparisons test was used to determine significant changes between LFD, HFD and HFD + TE groups (n = 5) when comparing liver to body weight ratio values within each timpoint in Fig. 2 and the significant differences in AST and ALT values in Fig (Graphpad Prism 7.02). To determine the significance between LFD, HFD, and HFD + TE % positive staining in Fig. 6, for each group (n = 5) five fields of view per section and per IHC stain were counted using the histological quantification program TMARKER [16] and verified through manual quantification using ImageJ. A nonparametric one-way ANOVA with Tukey’s multiple comparisons was used to compare the groups within each time point. The significance between the control and their corresponding metabolite sample absorbance values in Fig. S3 was determined using a Student t test. Bars in all figures represent standard deviation of experimental replicates.
Fig. 2.

Liver size and weight. (A) The percent of the liver weight to body weight ratio of the mice collected at each time point and (B) Gross morphology of mice livers collected after 35 weeks on the diet. * indicates p < 0.05.
Fig. 6.

Immunohistochemistry of HFD, LFD and HF + TE mouse liver tissues at 0 and 35 weeks and the percentages of positive cells across all time points (20X, scale bar indicates 200 μm, * indicates p < 0.05). (A) Ki67, (B) TUNEL and (C) CD4+.
All authors had access to the study data and had reviewed and approved the final manuscript.
3. Results
Food consumption and body weights were measured weekly during the 35-week bioassay (Fig. 1 and Fig. S2). The mice on HFD + TE diet maintained lean body weights (Fig. 1) compared to HFD and LFD groups, despite consuming greater or similar amounts of food as the other groups. The liver to body weight ratios in mice received HFD + TE diet were significantly lower than HFD and LFD groups for all time points. Unlike HFD + TE fed mice, mice in other groups, especially HFD group, showed overt changes in the liver size and morphology (Fig. 2A, B). H & E staining of the livers showed increased fat accumulation in LFD and HFD mice compared to HFD + TE mice, which remarkably had negligible changes in pathology from 0 to 35 weeks (Fig. 3). Increasing amounts of both macro- and microvesicular steatosis was evident in HFD and LFD mice by week 25, but not in HFD + TE mice (Fig. 3). MRI image analysis confirmed an average of higher percentage of fat content in HFD mice (70.55%) compared to LFD mice (61.92%) and TE substantially reduced the fat accumulation in the livers of HFD mice (35.13%) (Fig. 4). AST and ALT, enzymes that are elevated in steatosis with liver damage, were significantly higher in LFD and HFD mice than HFD + TE mice by week 35 (Fig. 5 A and B). To evaluate the cellular changes in livers of mice fed different diets, we determined the expression of Ki67, an indicator of cellular proliferation. Ki67 expression was significantly increased in livers of HFD mice compared to HFD + TE mice at weeks 25 and 35 (Fig. 6A). In contrast, TUNEL, a marker of DNA fragmentation in apoptosis, was significantly elevated in HFD + TE mice compared to HFD and LFD groups after 10, 25 and 35 weeks on the diet (Fig. 6B).
Fig. 1.

Body weight curves of C57BL/6J mice over a period of 35 weeks of the experiment.
Fig. 3.

H&E staining of mouse liver tissue sections showing lipid accumulation in the liver from 0 to 35 weeks on each diet. Scale bar indicates 100 μm.
Fig. 4.

MRI images of fat content.
Fig. 5.

Serum levels of (A) ALT and (B) AST in the C57BL/6J mice on HFD, LFD and HFD + TE diets (*indicates p < 0.05).
A recent study showed that hepatic lipid accumulation in NAFLD promotes hepatocarcinogenesis in MYC-ON transgenic mice by causing selective CD4+ cell death upon feeding a choline-deficient diet [10], supporting that CD4+ T lymphocytes play an important role in liver cancer. We examined whether CD4+T cell loss occurs in the livers of mice fed HFD, a more relevant model for obesity and NAFLD. We also investigated whether TE prevents CD4+ T cell loss in the livers of HFD-fed mice. The results showed that the number of CD4+ lymphocytes is reduced after receiving HFD during the 35-week bioassay (Fig. 6C) and TE not only prevents CD4+ cell loss, but also increased their survival in HFD mice. Remarkably, this effect was evident at as early as week five.
To examine the effects of TE on FA accumulation and compare them between mouse and human liver cells, we treated AML12 cells and HH with FA and FA + TE over a period of three days. Both cell lines treated with the FA media consisting of oleic and palmitic acids showed lipid accumulation as measured by Nile Red staining, and the lipid increase was mitigated by supplementation with 10 μg/mL of TE (Fig. 7). Because EGCG is a major component of TE (~70%) and its metabolites have been shown to protect against obesity and exhibit effects of CD4+T and natural killer cell activity [19,20], we studied the effects of EGCG metabolites on lipid accumulation in AML12 and HH cells treated with the FA media containing oleic and palmitic acid. Of the three metabolites examined, EGC-M3, -M4 and -M5 (Fig. 8C), only EGC-M3 showed effects in suppressing fatty liver cells in both AML12 and HH cells (Fig. 8A and B, respectively). Interestingly, EGC-M3 also reduced cell proliferation, due to toxicity after FA treatment compared to the control in HH cells; however, this trend was not observed in AML12 (Figs. S3A and B).
Fig. 7.
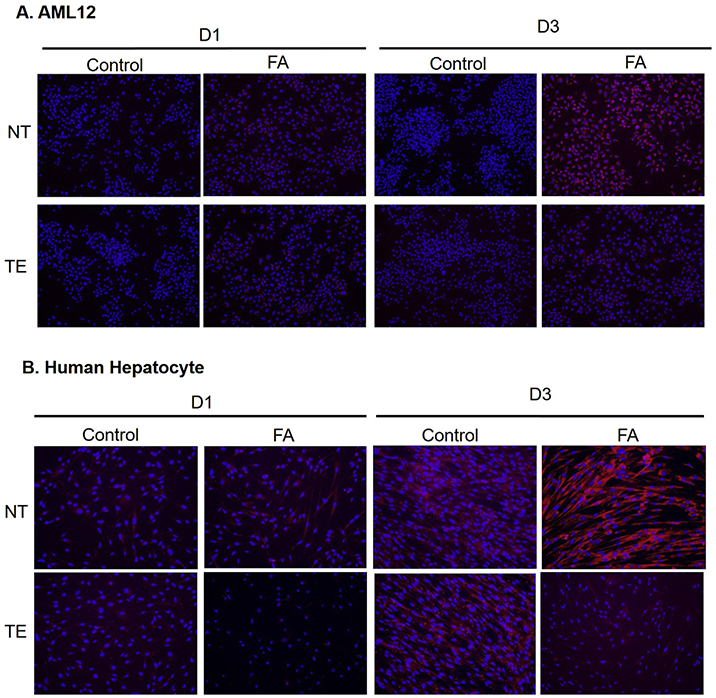
(A) Nile Red staining of AML12 and (B) Primary human hepatocytes treated with fatty acids (FA) and Theaphenon E (TE) or no treatment (NT) after 1 and 3 days (D1 and D3). (20X).
Fig. 8.

(A) Nile Red staining of AML12 (20X) and (B) Primary human hepatocytes treated with fatty acids (FA) and EGCG metabolites EGC-M3, -M4 and -M5 after one and three days. (C) Structures of EGC-M3, EGC-M4 and EGC-M5.
We studied whether the changes in lipid composition, in particular linoleic acid, occur in the livers of C57BL/6 mice fed HFD and whether TE ameliorates these effects. A total of 13 common FAs were analyzed in the mouse liver tissues obtained from five mice at week 35 in all three treatment groups (Table S2). These included, among others, the ω-3 fatty polyunsaturated FAs; docosahexaenoic (22:6) and α-linolenic (18:3) acid, the ω-6 polyunsaturated FAs; linoleic (18:2), dihomo-γ-linolenic (20:3), eicosadienoic (20:2) and arachidonic (20:4) acid, the ω-7 monounsaturated FA; palmitoleic acid (16:1) and the ω-9 monounsaturated FAs; eicosenoic (20:1) and oleic (18:1) acid. The analysis also included myristic (14:0), stearic (18:0), palmitic (16:0) and arachidic (20:0) acid, which are saturated FAs found in oils and animal and vegetables fats in the diet. The total amount of the 13 FAs in the livers of HFD fed mice showed a 1.5-fold increase compared to the LFD group. Supplementation of TE in HFD reduced the total amount of FAs compared to that in the LFD group as shown in Fig. 9. Most of the FAs in HFD mice were increased compared to LFD mice, with the exceptions of palmitoleic, eicosenoic and eicosadienoic acids (Table S3). Figure 9 shows the fold changes from the LFD group of four major FAs, including palmitic acid, linoleic and arachidonic acids and docosohexaenoic acid, in HFD and HFD + TE groups. The most notable is a 2.5-fold increase of linoleic acid in HFD-fed mice, an observation supported by a previous study [21], and its suppression by TE.
Fig. 9.

Hepatic fatty acid changes in fold in HFD and HFD + TE fed mice compared to LFD at 35 weeks on diet. * indicates the total amount of 13 fatty acids that were measured.
4. Discussion
Obesity is a risk factor of NAFLD and has been linked to an increased risk of many types of cancer, particularly liver cancer [22]. A recent study showed in the methionine-choline deficient mouse model without obesity that dysregulation of lipid metabolism in NAFLD can cause a selective loss of CD4+ lymphocytes which promotes the onset of hepatocarcinogenesis [10]. This study revealed a mechanism involving the accumulation of linoleic acid in fatty livers followed by its subsequent uptake by CD4+T cells, leading to an increased level of oxidative stress in the mitochondria with the production of ROS. These results corroborated previous observations that CD4+ T cells play a role in inhibiting HCC development through immune surveillance of hepatocytes [23]. Therefore, increase of linoleic acid in NAFLD appears to be important for HCC progression [24,25]. The loss of hepatic CD4+ T cells in HFD mice, accompanied by an increase of linoleic acid in the livers of HFD mice, demonstrated in the current study provide support for the first time in an animal model relevant to HFD-induced obesity that linoleic acid accumulation may contribute to the loss of hepatic CD4+ T cells and, eventually, HCC. This notion is further strengthened by the observation that TE suppresses the accumulation of linoleic acid with a reversion of CD4+T cell loss in HFD mice. Interestingly, unlike the previously reported choline-deficient model in which no weight gain was evident and linoleic acid was the only abundant FA accumulated in the liver [10], the HFD model showed that almost all of the 13 FAs are increased with linoleic acid showing the most profound increase (Fig. 9 and Table S2). The pronounced effects of TE on LA and PA are intriguing. Knowing that catechins in green tea can exert thermogenesis effect, a separate study on how TE alters the metabolism of fatty acids, particularly LA and PA, is warranted.
Our studies showed that TE reduces weight gains in HFD mice, maintains a normal liver to body weight ratio, prevents liver lipid accumulation and keeps ALT and AST enzyme activity low. These results indicate that TE has general beneficial effects toward the prevention of fatty liver diseases caused by HFD. Other pharmacological agents have been shown to ameliorate NAFLD. For example, 2,4-dinitrophenol derivative and metformin, both drugs for insulin resistance, have been shown to alleviate fatty livers in the methionine-choline-deficient and genetic leptin-deficient ob/ob models [26-28]. As liver hyperplasia and aberrant lipid metabolism in the early stages of NAFLD can lead to HCC through increased cell proliferation and inhibition of apoptosis, these agents are expected to exhibit cancer preventive activity against HCC associated with NAFLD [29]. Our observations that TE can mitigate the adverse effects of NAFLD, including CD4+T cells depletion, in a HFD mouse model that is devoid of any genetic or chemically-induced risk factors, have led to the assumption that TE may inhibit liver carcinogenesis in this model. Indeed, our recent study showed that TE effectively blocks the HFD-induced hepatocarcinogenesis [9].
Aside from the mechanism involving CD+4 T cells, our recent studies in a mouse model of HFD-induced HCC demonstrated that γ-OHPdG, an endogenous DNA adduct derived from lipid peroxidation, is increased during NAFLD progression and this increase is inhibited by TE [8,9,30]. These results suggest the formation of this mutagenic adduct during NAFLD may be an upstream event in hepatocarcinogenesis. Importantly, we found that γ-OHPdG appears to be a reliable prognostic biomarker for HCC recurrence in HCC patients after surgery [8]. Because linoleic acid is a known source γ-OHPdG [31], the HFD model described here provides a useful model for mechanism studies to delineate whether loss of hepatic CD4+T cells and γ-OHPdG formation are two independent or interrelated pathways in the carcinogenic process of NAFLD.
The in vitro data obtained from HH and AML12 cells treated with oleic and palmitic acid are consistent with the assumption that lipid accumulation in livers can be prevented by TE, not only in mouse, but also in human (Fig. 8A, B). Although the mechanisms are not fully understood, the reduction of hepatic lipids by TE, particularly linoleic acid, offers an explanation for the increased CD4+ T cell survival in HFD + TE mice. Furthermore, the increased proliferation, shown by Ki67 expression, in the livers of HFD fed mice is in agreement with a compensatory proliferation due to liver damage as confirmed by a previous study [32]. An increased proliferation with a decreased immune response promotes tumorigenesis, as supported by the increased risk of HCC in HFD-induced obesity in normal and genetically disposed mice [9,33]. Collectively, these results support the notion that obesity-related HCC may be ameliorated by TE. Indeed, we recently reported that dietary TE supplementation can completely block HCC development in mice fed a HFD [9].
Green tea consumption has been associated with weight loss. Several mechanisms have been proposed for its negative effects on weight gains, including appetite suppression, increased metabolic rate and downregulation of obesity related genes through PPARγ and anti-inflammatory antioxidant activity [34-36]. EGCG, a major polyphenol in green tea, has been shown to contribute to most of the beneficial effects of green tea [37]. We showed here that a green tea extract administered in the diet can up-regulate the immune response by restoring CD+4 T cells in fatty livers of mice fed a HFD. Mice received HFD supplemented with EGCG showed a reduced incidence of obesity, steatosis and insulin resistance [38]. EGCG and other tea polyphenols can induce apoptosis in liver cancer cells and in xenograft tumor models [39-41]. It inhibited absorption of lipids in the intestines, depending on the structure and composition of its metabolites [42,43]. Interestingly, among the three major metabolites of EGCG, only EGC-M3, a precursor to both EGC-M4 and -M5, inhibits fatty acid accumulation in AML12 and HH cells, suggesting that EGC-M3 is at least partially responsible for the antagonistic effects of TE on lipid accumulation.
It is plausible that more than one mechanism is responsible for the carcinogenic effects caused by chronic inflammation in NAFLD. In this context, the diverse role of linoleic acid in NAFLD warrants an in-depth investigation as it may shed light onto the molecular basis of the NAFLD-related HCC and its prevention by TE. The increased survival of CD4+ T cells and induced apoptosis in HFD mice by TE demonstrated in this study confirm that the immune surveillance response and cellular functions in livers may be modulated by dietary TE. These results underscore the potential of nutritional intervention for obesity-related fatty liver disease progression. While more studies are needed to elucidate the detailed mechanisms, the current data seems to justify the consideration of future clinical trials to evaluate TE as a preventive agent against NAFLD and its associated HCC.
Supplementary Material
Acknowledgments
We thank Dr. Yukihiko Hara (Tea Solution Inc., Tokyo, Japan) and Masayuki Suzuki (Mitsui Norin Co, Tokyo, Japan) for providing the TE and green tea metabolites, respectively. We also thank Carlos Benitez for assistance with animal handling. The authors also like to acknowledge the Metabolomics, the Histopathology, the Preclinical Imaging Research Laboratory, Tissue and the Microscopy and Imaging Shared Resources in Georgetown University Medical Center. This work was supported by NIH 5R01CA190678 and by NIH/NCI/CCSG grant P30-CA051008.
Funding sources
This work was supported by the NIH/NCI grant 5R01CA190678 and by NIH/NCI/CCSG grant P30-CA051008.
Abbreviations
- ALT
alanine aminotransferase
- AST
aspartate aminotransferase
- EGCG
epigallocatechin gallate
- EGC-M3
1-(30′,50′-dihydroxyphenyl)-3-(2″,4″,6″-trihydroxyphenyl) propan-2-ol
- EGC-M4
4-hydroxy-5-(3′,5′-dihydroxyphenyl) valeric acid
- EGC-M5
5-(3′,5′-dihydroxy-phenyl)-γ-valerolactone
- FA
fatty acid
- GC
gas chromatography
- HCC
hepatocellular carcinoma
- HFD
high fat diet
- HFD + TE
high fat plus 2% Theaphenon E
- HH
human hepatocytes
- HIER
heat induced epitope retrieval
- IHC
immunohistochemistry
- LFD
low fat diet
- MS
mass spectrometry
- NAFLD
non-alcoholic fatty liver disease
- PBS
phosphate buffered saline
- RARE
rapid acquisition with rapid enhancement
- RO
reactive oxygen species
- TE
Theaphenon E
- TOF
time-of-flight
- TUNEL
terminal transferase dUTP nick end labeling
Footnotes
Statement of ethics
All animal experiments performed in this study were reviewed and approved by Georgetown University's Institutional Animal Care and Use Committee.
Conflict of Interest
The authors listed have no affiliations with or involvement in any organization or entity with any financial interest or non-financial interest in the subject matter or materials discussed in this manuscript.
Appendix A. Supplementary data
Supplementary data to this article can be found online at https://doi.org/10.1016/j.clnu.2020.04.033.
References
- [1].Kim D, et al. Association between noninvasive fibrosis markers and mortality among adults with nonalcoholic fatty liver disease in the United States. Hepatology 2013;57(4):1357–65. [DOI] [PMC free article] [PubMed] [Google Scholar]
- [2].Michelotti GA, Machado MV, Diehl AM. NAFLD, NASH and liver cancer. Nat Rev Gastroenterol Hepatol 2013;10:656–65. [DOI] [PubMed] [Google Scholar]
- [3].El-Serag HB, Kanwal F. Epidemiology of hepatocellular carcinoma in the United States: where are we? Where do we go? Hepatology 2014;60: 1767–75. [DOI] [PMC free article] [PubMed] [Google Scholar]
- [4].Manzel A, Muller DN, Hafler DA, Erdman SE, Linker RL, Kleinewietfeld M. Role of “western diet” in inflammatory autoimmune diseases. Curr Allergy Asthma Rep 2014. January;14:404. [DOI] [PMC free article] [PubMed] [Google Scholar]
- [5].Henning JR1, Graffeo CS, Rehman A, Fallon NC, Zambirinis CP, Ochi A, et al. Dendritic cells limit fibroinflammatory injury in nonalcoholic steatohepatitis in mice. Hepatology 2013. August;58(2):589–602. 10.1002/hep.26267. Epub 2013 Jun 24. [DOI] [PMC free article] [PubMed] [Google Scholar]
- [6].Marrero JA, Fontana RJ, Su GL, Conjeevaram HS, Emick DM, Lok AS. NAFLD may be a common underlying liver disease in patients with hepatocellular Carcinoma in the United States. Hepatology 2002;36:1349–54. [DOI] [PubMed] [Google Scholar]
- [7].Yang CS, Maliakal P, Meng X. Inhibition of carcinogenesis by tea. Annu Rev Pharmacol Toxicol 2002;42:25–54. [DOI] [PubMed] [Google Scholar]
- [8].Fu Y, Silverstein S, McCutcheon JN, Dyba M, Nath RG, Aggarwal M, et al. An endogenous DNA adduct as a prognostic biomarker for hepatocarcinogenesis and its prevention by Theaphenon E in mice. Hepatology 2018;67:159–70. [DOI] [PMC free article] [PubMed] [Google Scholar]
- [9].Coia H, Ma N, Hou Y, Dyba M, Fu Y, Cruz MI, et al. Prevention of lipid peroxidation-derived cyclic DNA adduct and mutation in high-fat diet-induced hepatocarcinogenesis by Theaphenon E. Canc Prev Res 2018;10:665–76. [DOI] [PMC free article] [PubMed] [Google Scholar]
- [10].Ma C, Kesarwala AH, Eggert T, Medina-Echeverz J, Kleiner DE, Jin P, et al. NAFLD causes selective CD4(+) T lymphocyte loss and promotes hepatocarcinogenesis. Nature 2016;531:253–7. [DOI] [PMC free article] [PubMed] [Google Scholar]
- [11].Katz SC, Pillarisetty VG, Bleier JI, Kingham TP, Chaudhry UI, Shah AB, et al. Conventional liver CD4 T cells are functionally distinct and suppressed by environmental factors. Hepatology 2005;42:293–300. [DOI] [PubMed] [Google Scholar]
- [12].Rakhra K, Bachireddy P, Zabuawala T, Zeiser R, Xu L, Kopelman A, et al. CD4(+) T cells contribute to the remodeling of the microenvironment required for sustained tumor regression upon oncogene inactivation. Cancer Cell 2010. November 16;18(5):485–98. 10.1016/j.ccr.2010.10.002. Epub 2010 Oct 28. [DOI] [PMC free article] [PubMed] [Google Scholar]
- [13].Kang TW, Yevsa T, Woller N, Hoenicke L, Wuestefeld T, Dauch D, et al. Senescence surveillance of pre-malignant hepatocytes limits liver cancer development. Nature 2011. November 9;479(7374):547–51. 10.1038/nature10599. [DOI] [PubMed] [Google Scholar]
- [14].Hong SH, Ju Tilan, Galli S, Izycka-Swieszewska E, Polk T, Horton M, et al. High neuropeptide Y release associates with Ewing sarcoma bone dissemination - in vivo model of site-specific metastases. Oncotarget 2015;6(9):7151–65. 2012;11(20):3801-9. [DOI] [PMC free article] [PubMed] [Google Scholar]
- [15].Kuo LE, Kitlinska JB, Ju Tilan, Li L, Baker SB, Johnson MD, et al. Neuropeptide Y acts directly in the periphery on fat tissue and mediates stress-induced obesity and metabolic syndrome. Nat Med 2007. July;13(7):803–11. Epub 2007 Jul 1. Erratum in: Nat Med. 2007 Sep;13(9):1120. [DOI] [PubMed] [Google Scholar]
- [16].Schuffler PJ, Fuchs TJ, Ong CS, Wild PJ, Rupp NJ, Buhmann JM. TMARKER: a free software toolkit for histopathological cell counting and staining estimation. J Pathol Inf 2013;4:S2. [DOI] [PMC free article] [PubMed] [Google Scholar]
- [17].Hashimoto N, Aoyama T, Shioiri T. Chem. New methods and reagents in organic synthesis. A simple efficient preparation of methyl esters with trimethylsilyldiazomethane (TMSCHN2) and its application to gas chromatographic analysis of fatty acids. Pharm. Bull 1981;29(5):1475–8. [Google Scholar]
- [18].annkuk E, Laiakis EC, Authier S, Wong K, Fornace AJ Jr. Gas chromatography/mass spectrometry metabolomics of urine and serum from nonhuman primates exposed to ionizing radiation: impacts on the tricarboxylic acid cycle and protein metabolism. J Proteome Res 2017;16(5):2091–100. [DOI] [PMC free article] [PubMed] [Google Scholar]
- [19].Wolfram S, Raederstorff D, Preller M, Wang Y, Teixeira SR, Riegger C, et al. Epigallocatechin gallate supplementation alleviates diabetes in rodents. J Nutr 2006;136:2512–8. [DOI] [PubMed] [Google Scholar]
- [20].Kim YH, Won YS, Yang X, Kumazoe M, Yamashita S, Hara A, et al. Green tea catechin metabolites exert immunoregulatory effects on CD4(+) T cell and natural killer cell activities. J Agric Food Chem 2016. May 11;64(18):3591–7. [DOI] [PubMed] [Google Scholar]
- [21].Giesbertz P, Padberg I, Rein D, Ecker J, Hofle AS, Spanier B, et al. Metabolite profiling in plasma and tissues of ob/ob and db/db mice identifies novel markers of obesity and type 2 diabetes. Diabetologia 2015;58:2133–43. [DOI] [PubMed] [Google Scholar]
- [22].Sun B, Karin M. Obesity, inflammation, and liver cancer. J Hepatol 2012;56: 704–13. [DOI] [PMC free article] [PubMed] [Google Scholar]
- [23].Kang TW, Yevsa T, Woller N, Hoenicke L, Wuestefeld T, Zender L, et al. Senescence surveillance of pre-malignant hepatocytes limits liver cancer development. Nature 2011;479:547–51. [DOI] [PubMed] [Google Scholar]
- [24].Feldstein AE, Lopez R, Tamimi TA, Yeria L, Chung YM, Berk M. Mass spectrometric profiling of oxidized lipid products in human nonalcoholic fatty liver disease and nonalcoholic steatohepatitis. J Lipid Res 2010;51:3046–54. [DOI] [PMC free article] [PubMed] [Google Scholar]
- [25].Muir K, Hazim A, He Y, Peyressatre M, Kim DY, Song X, et al. Proteomic and lipidomic signatures of lipid metabolism in NASH-associated hepatocellular carcinoma. Cancer Res 2013;73:4722–31. [DOI] [PMC free article] [PubMed] [Google Scholar]
- [26].Yang S, Lin HZ, Hwang J, Chacko VP, Diehl AM. Hepatic hyperplasia in non-cirrhotic fatty livers: is obesity-related hepatic steatosis a premalignant condition? Cancer Res 2001;61:5016–23. [PubMed] [Google Scholar]
- [27].Perry RJ, Kim T, Zhang XM, Lee HY, Pesta D, Popov VB. Reversal of hypertriglyceridemia, fatty liver disease, and insulin resistance by a liver-targeted mitochondrial uncoupler. Cell Metabol 2013;18:740–8. [DOI] [PMC free article] [PubMed] [Google Scholar]
- [28].Lin HZ, Yang SQ, Chuckaree C, Kuhajda F, Ronnet G, Diehl AM. Metformin reverses fatty liver disease in obese, leptin-deficient mice. Nat Med 2000;6: 998–1003. [DOI] [PubMed] [Google Scholar]
- [29].Bhalla K, Hwang BJ, Dewi RE, Twaddel W, Goloubeva OG, Wong KK, et al. Metformin prevents liver tumorigenesis by inhibiting pathways driving hepatic lipogenesis. Canc Prev Res 2012;5(4):544 10.1158/1940-6207.CAPR-11-0228. [DOI] [PMC free article] [PubMed] [Google Scholar]
- [30].Coia H, Ma N, He AR, Kallakury B, Berry DL, Permaul E, et al. Detection of a lipid peroxidation-induced DNA adduct across liver disease stages. Hepatobiliary Surg Nutr 2017. 10.21037/hbsn.2017.06.01. [DOI] [PMC free article] [PubMed] [Google Scholar]
- [31].Pan KL, Huang WJ, Hsu MH, Lee HL, Liu HJ, Cheng CW, et al. Identification of trans,trans-2,4-decadienal metabolites in mouse and human cells using liquid chromatography-mass spectrometry. Chem Res Toxicol 2014;27:1707–19. [DOI] [PubMed] [Google Scholar]
- [32].Vansaun MN, Mendonsa AM, Lee Gorden D. Hepatocellular proliferation correlates with inflammatory cell and cytokine changes in a murine model of nonalchoholic fatty liver disease. PloS One 2013;8(9):e73054. [DOI] [PMC free article] [PubMed] [Google Scholar]
- [33].Hill-Baskin AE, Markiewski MM, Buchner DA, Shao H, DeSantis D, Hsiao G, et al. Diet-induced hepatocellular carcinoma in genetically predisposed mice. Hum Mol Genet 2009;18:2975–88. [DOI] [PMC free article] [PubMed] [Google Scholar]
- [34].Bruno RS, Dugan CE, Smyth JA, DiNatale DA, Koo SI. Green tea extract protects leptin-deficient, spontaneously obese mice from hepatic steatosis and injury. J Nutr 2008;138:323–31. [DOI] [PubMed] [Google Scholar]
- [35].Yan J, Zhao Y, Zhao B. Green tea catechins prevent obesity through modulation of peroxisome proliferator-activated receptors. Sci China Life Sci 2013;56: 804–10. [DOI] [PubMed] [Google Scholar]
- [36].Dulloo AG, Duret C, Rohrer D, Girardier L, Mensi N, Fathi M, et al. Efficacy of a green tea extract rich in catechin polyphenols and caffeine in increasing 24-h energy expenditure and fat oxidation in humans. Am J Clin Nutr 1999;70: 1040–5. [DOI] [PubMed] [Google Scholar]
- [37].Chung F-L, Schwartz J, Herzog CR, Yang YM. Tea and cancer prevention: studies in animals and humans. J Nutr 2003;133:3268S–74S. [DOI] [PubMed] [Google Scholar]
- [38].Bose M, Lambert JD, Ju J, Reuhl KR, Shapses SA, Yang CS, et al. The major green tea polyphenol, (−)-epigallocatechin-3-gallate, inhibits obesity, metabolic syndrome, and fatty liver disease in high-fat-fed mice 2008;138:1677–83. [DOI] [PMC free article] [PubMed] [Google Scholar]
- [39].Ahmad N, Feyes DK, Nieminen AL, Agarwal R, Mukhtar H. Green tea constituent epigallocatechin-3-gallate and induction of apoptosis and cell cycle arrest in human carcinoma cells. J Natl Cancer Inst 1997;89:1881–6. [DOI] [PubMed] [Google Scholar]
- [40].Gupta S, Ahmad N, Nieminen AL, Mukhtar H. Growth inhibition, cell-cycle dysregulation, and induction of apoptosis by green tea constituent (−)-epigallocatechin-3-gallate in androgen-sensitive and androgen-insensitive human prostate carcinoma cells. Toxicol Appl Pharmacol 2000;164:82–90. [DOI] [PubMed] [Google Scholar]
- [41].Nishikawa T, Nakajima T, Moriguchi M, Jo M, Sekoguchi S, et al. A green tea polyphenol, epigalocatechin-3-gallate, induces apoptosis of human hepatocellular carcinoma, possibly through inhibition of Bcl-2 family proteins. J Hepatol 2006;44:1074–82. [DOI] [PubMed] [Google Scholar]
- [42].Takagaki A, Nanjo F, Agric J. Metabolism of (−)-epigallocatechin gallate by rat intestinal flora. Food Chem 2010;58:1313–21. [DOI] [PubMed] [Google Scholar]
- [43].Koo SI, Noh SKJ. Green tea as inhibitor of the intestinal absorption of lipids: potential mechanism for its lipid-lowering effect. Nutr Biochem 2007;18: 179–83. [DOI] [PMC free article] [PubMed] [Google Scholar]
Associated Data
This section collects any data citations, data availability statements, or supplementary materials included in this article.