

Abstract
Background:
Rate of nicotine metabolism has been identified as a biochemical risk factor for nicotine use and dependence; however, its role in alcohol consumption and related outcomes is not well understood. The current research examined nicotine metabolism rate as a risk factor for alcohol use among current tobacco users. We also examined sex differences in these associations.
Method:
Data were taken from Waves 1 and 2 of the Population Assessment of Tobacco and Health (PATH) study, a national longitudinal study of tobacco use and associated health outcomes. The nicotine metabolite ratio (NMR) was calculated as the ratio of trans-3’ hydroxycotinine to cotinine in urine samples provided at wave 1. Alcohol use outcomes included past 30-day NIAAA-defined hazardous drinking status, total drinks, and alcohol-related consequences. All analyses controlled for alcohol use at Wave 1.
Results:
NMR at Wave 1 predicted increased odds of meeting hazardous drinking criteria, adjusted odds ratio (aOR) = 1.14, 95% CI = 1.06; 1.23, p = 0.001, greater total alcohol consumption amount, adjusted rate ratio (aRR) = 1.21, 95% CI = 1.12; 1.30, p < 0.001, and more alcohol consequences, aRR = 1.07, 95% CI = 1.01; 1.13, p = 0.018, at wave 2. No significant sex differences were identified. NMR remained a significant predictor of alcohol use in models controlling for severity of nicotine exposure in cigarette smokers.
Conclusions:
NMR may be a shared risk factor for harmful nicotine and alcohol use that contributes to their co-occurrence.
Keywords: Nicotine metabolite ratio, alcohol use, tobacco use, risk factors
1. Introduction
Cigarette smokers and other tobacco users engage in harmful alcohol use at higher rates than the general population. Analysis of epidemiological datasets find that tobacco cigarette users are significantly more likely to meet criteria for alcohol use disorders (AUD) and to meet hazardous drinking criteria (McKee et al., 2007). Similar studies found that people who use other nicotine delivery devices (e.g., electronic cigarettes; Roberts et al., 2018a) also showed elevated rates of AUD and hazardous alcohol use relative to the general population. Event-level data suggest that smokers consume more alcohol during occasions where they also smoke (Witkiewitz et al., 2012), and people being successfully treated for alcohol use also show a corresponding reduction in smoking (Roberts et al., 2018b). Theoretical accounts of the overlap between these substances have focused on pharmacological interactions (McKee and Weinberger, 2013) or associative learning processes (Sayette et al., 2005) as contributing factors. Another possibility is that common biological risk factors may place individuals at risk for harmful use of both substances.
One biochemical risk factor of poor tobacco use outcomes is a fast rate of nicotine metabolism. Faster nicotine elimination rates can influence smoking outcomes by altering a range of factors, including onset of withdrawal symptoms, nicotine reinforcement, and overall nicotine consumption amount (West et al., 2011). Nicotine metabolism rate is estimated by measuring the ratio of two nicotine metabolites: trans-3’ hydroxycotinine to cotinine, known as the nicotine metabolite ratio (NMR). Higher ratios indicate faster nicotine metabolism (Dempsey et al., 2004). Prior research finds that tobacco users with fast nicotine metabolism smoke more cigarettes per day (Benowitz et al., 2003; Mooney et al., 2008), have larger cigarette puff volume (Strasser et al., 2011), report more craving and withdrawal symptoms during abstinence (Lerman et al., 2006; Rubinstein et al., 2008), and are less successful during quit attempts (Ho et al., 2009; Schnoll et al., 2009) compared to slower metabolizers, though some of these associations are small (see West et al., 2011 for a review). Further, other recent research unexpectedly found that faster metabolizers had better outcomes during quit attempts compared to slower metabolizers (Fix et al., 2017) or no association between NMR and quit rates (Verplaetse et al., 2020). Despite some inconsistency in results, the weight of evidence supports that rate of nicotine metabolism is an individual difference factor contributing to the maintenance of tobacco use in at least some smokers. Other studies find that women show faster nicotine metabolism rates than do men (Benowitz et al., 2006; Chenoweth et al., 2014), raising the possibility of sex differences in the behavioral correlates of NMR.
More recent studies suggest a link between alcohol use and rate of nicotine metabolism. Preclinical studies have found that chronic alcohol exposure can induce activity of CYP2A6, a liver enzyme involved in the metabolic pathway of nicotine (Jin et al., 2011; Lu et al., 2011). There also is evidence documenting a link between NMR and alcohol use in humans. Chenowith et al. (2014) examined predictors of NMR in a group of smokers screened for a clinical trial, and found a small but significant association between alcohol beverages per week and NMR at a single time point. Subsequent studies examined changes in NMR that occurred in smokers receiving treatment for AUD. Gubner et al. (2016) directly tracked NMR in a group of men entering an alcohol dependence treatment program. At the end of the treatment program, participants who successfully abstained from alcohol showed a 50.0% reduction in NMR compared to baseline, despite little change in their daily nicotine intake. Similarly, Dermody et al. (2018) tracked NMR changes in a small group of men and women receiving treatment for AUD. Men (but not women) in this study showed a co-occurring reduction in alcohol and NMR, although there was no significant difference between individual reductions in alcohol use and NMR. This study also raised questions regarding potential sex-related differences in the association between NMR and alcohol use.
While there is evidence of an association between alcohol use and rate of nicotine metabolism from cross-sectional or small clinical samples, no study to date has examined the prospective association between NMR and alcohol use in a large nationally representative survey. The current study sought to address this gap in the literature. Data were taken from waves 1 and 2 of the adult cohorts of the Population Assessment of Tobacco and Health (PATH) survey, a nationally representative multi-wave cohort survey (wave 1: September 2013 to December 2014, wave 2: October 2014 to October 2015) of non-incarcerated adults in the United States. Our primary analyses examined the prospective association between wave 1 rate of nicotine metabolism, as indexed by urine NMR, and alcohol use outcomes at wave 2. Alcohol use outcomes included hazardous drinking status according to National Institute on Alcohol Abuse and Alcoholism (NIAAA) criteria (https://www.rethinkingdrinking.niaaa.nih.gov/), past month total drinks, and past month alcohol consequences. We hypothesized that higher rate of nicotine metabolism, as indexed by higher NMR, would predict higher likelihood of hazardous alcohol use and more total drinks and alcohol consequences.
Secondary analyses addressed two additional goals. We first tested for sex differences in the association between NMR and alcohol use. Based on prior research documenting sex differences in NMR, we hypothesized that the association between NMR and alcohol use outcomes would be less pronounced in women compared to men. Second, we examined whether any association between NMR and alcohol use outcomes could be explained by associated differences in severity of nicotine exposure, as measured by cigarettes per day. These analyses sought to examine nicotine exposure severity as a potential mechanism of the association between NMR and alcohol use. Restricting these analyses to cigarette users allowed us to quantify nicotine exposure severity as cigarettes per day, which provided a convenient method of estimating daily nicotine intake in this group of tobacco users. We hypothesized that controlling for cigarettes per day would reduce the association between alcohol use outcomes and NMR.
2. Method
2. 1. Data source
Data for this study were drawn from waves 1 and 2 of the PATH study adult survey restricted use files and biomarker restricted-use files (wave 1, 2013–2014; wave 2, 2014–2015). All participants were age 18 years or older at wave 1. The PATH study was developed and implemented as a collaboration between the National Institute on Drug Abuse (NIDA) and the Center for Tobacco Products (CTP) within the Food and Drug Administration (FDA). The PATH survey was conducted by Westat and approved by their institutional review board. Computer-assisted self-interviews were conducted in English or Spanish to gather information on tobacco use and associated behavioral, health, and substance use outcomes in a nationally representative, longitudinal cohort study of noninstitutionalized civilian adults in the United States who were 18 years or older. The PATH Study recruitment used a stratified, address-based, area-probability sampling design that oversampled tobacco users, African Americans, and young adults aged 18–24 years. The overall weighted response rate was 78.4%. Additional details about the PATH study methodology are reported elsewhere (Hyland et al., 2017).
2.2. Survey population
Samples weights were used so that statistics generated represented the noninstitutionalized population of adult tobacco users in the United States (Hu et al., 2016). A group of participants consented to providing urine samples (n = 19,237), and a probability-based subsample of these volunteers were selected for biochemical analysis (n = 11,522). The current study drew from the sample of participants for whom survey data were available from waves 1 and 2 and biomarker data were available from wave 1. We further restricted the analytic sample to include participants who endorsed tobacco use at wave 1. A tobacco user was defined as any individual who reported using at least one tobacco product or e-cigarettes “every day” or “some days”. Based on these criteria, there were 8,032 participants eligible for inclusion in the current analysis. Frequency counts for use of each tobacco product or device are reported in Table 1.
Table 1.
Percentage reporting use of each delivery device among Wave 1 tobacco users (unweighted n = 8,032)
| Percentage (%) endorsing current use (weighted) | |||
|---|---|---|---|
| Female | Male | Total | |
| Cigarette | 83.20 | 69.74 | 74.97 |
| Electronic Cigarette | 30.00 | 21.09 | 24.55 |
| Cigar | 4.88 | 25.06 | 17.23 |
| Cigarillo | 13.21 | 23.69 | 19.62 |
| Filtered Cigars | 6.43 | 10.65 | 9.01 |
| Pipe | 0.88 | 7.20 | 4.75 |
| Hookah | 16.78 | 16.46 | 16.58 |
| Snus | 0.65 | 5.15 | 3.40 |
| Smokeless Tobacco | 1.74 | 21.83 | 14.03 |
| Dissolvable Tobacco | 0.24 | 0.24 | 0.24 |
Note. Endorsing use indicates that participants reported using that device or method on “some days” or “every day”. “Female” and “Male” columns report percentage of each sex reporting use of each device. Total column reports percentages in combined sample. Percentages are based on the analytic sample of individuals reporting using one or more tobacco products currently.
2.3. Nicotine metabolism ratio
NMR was calculated as the ratio of trans-3’-hydroxycotinine to cotinine in urine (ng/mL). For the present analyses, NMR is log transformed is to maximize the correlation with metabolic clearance of nicotine and to increase consistency with previous literature (Levi et al., 2007). Cotinine and trans-3’-hydroxycotinine values that were below detection limits were imputed as a constant (see PATH Biomarker Restricted-Use Files data notes: https://www.icpsr.umich.edu/files/NAHDAP/documentation/ug36840-all_REST.pdf). NMR was calculated from at least 1 imputed analyte value in 11 participants (0.01%). The distribution of log-transformed NMR within the analytic subsample is displayed as a histogram in Figure 1.
Figure 1.
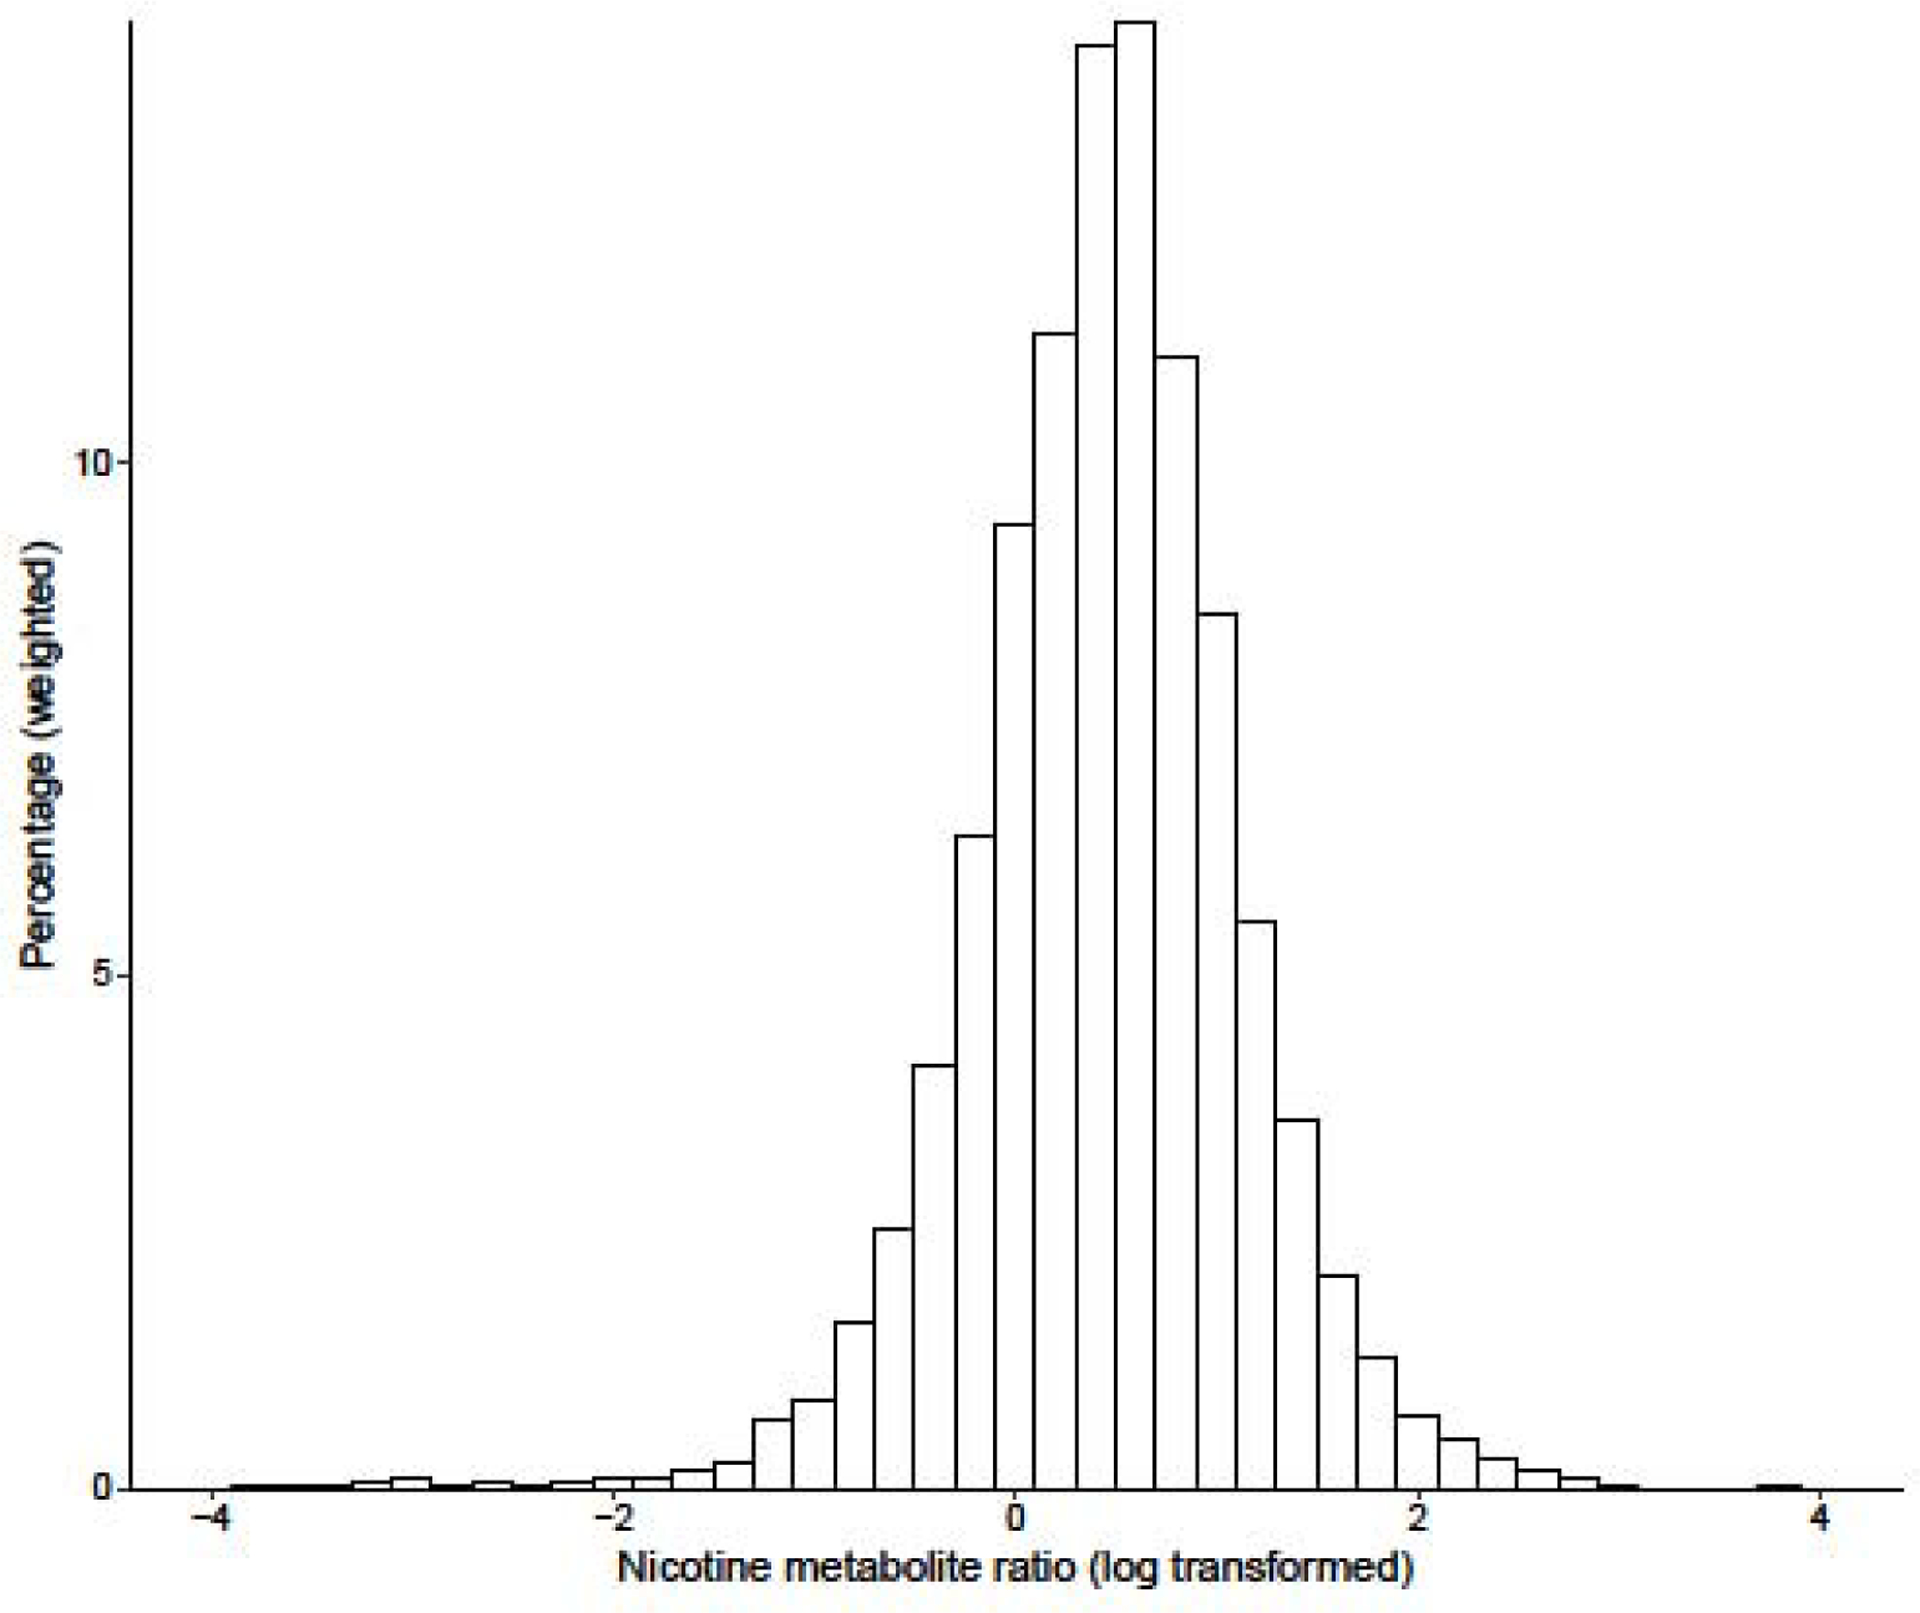
Weighted distribution of nicotine metabolite ratio (log transformed)
2.4. Alcohol use outcomes
All alcohol use outcomes were calculated based on past month use and consequences. All outcomes were calculated for each wave based on identical questions administered at each time point. Quantity/frequency based outcomes were calculated based on responses to the questions “In the past 30 days, how many days did you have one or more alcoholic drinks?” and “On average, on those days that you drank in the past 30 days, how many alcoholic drinks did you usually have each day?” Hazardous alcohol use status was a dichotomous outcome (yes/no) and calculated based on standardized NIAAA criteria (https://www.rethinkingdrinking.niaaa.nih.gov). Participants who reported consuming > 7/14 (women/men) drinks per week on average or reported an average quantity of > 3/4 (women/men) drinks per day were classified as hazardous drinkers. The past month total drinks variable was a continuous count outcome and was calculated as: average quantity * frequency.
Participants also reported on the social and physical consequences of their alcohol use over the past 30 days. Specifically, they stated whether alcohol caused them to experience any of the following consequences in the past month: physical withdrawal, problems with school or work, social problems, spending a lot of time getting alcohol, and/or spending a lot of time recovering from the effects of alcohol. Number of alcohol consequences was a continuous count outcome and possible scores ranged from 0 to 5.
2.5. Demographics and covariates
The following covariate set was included in all models unless otherwise noted: age, sex, education, race/ethnicity, poverty status, and urban residence. The PATH data included imputed values for some covariates (i.e., age, sex, race/ethnicity), and we used these imputed observations to reduce missing data rates (see page 71 of the Population Assessment of Tobacco and Health Restricted file User Guide for imputation details: https://www.icpsr.umich.edu/files/NAHDAP/documentation/ug36231-all_REST.pdf). For covariates without imputed values available (i.e., education level), we used modal replacement for missing observations, unless otherwise noted. Age was treated as a nominal categorical variable with the following 7 categories: 18–24 years, 25–34 years, 35–44 years, 45–54 years, 55–64 years, 65–74 years, and 75 + years. Education level was treated as a nominal categorical variable with the following 5 categories: less than high school or GED, high school graduate, some college (no degree) or associates degree, bachelor’s degree, or advanced degree. Race/ethnicity was treated as a nominal categorical variable with 4 categories: White, Black, Asian, Hispanic, or other race/ethnicity. Poverty status was treated as a nominal categorical variable. Participants were coded as being above or below the poverty threshold based on the Health and Human Services household income guidelines for the 2013–2014 year. Due to the rate of missing data for this variable (n = 496, 6.18%), a third category was created for nonresponse. Urban residence was treated as a nominal categorical variable and was determined based on the urbanicity of participants’ secondary sampling units per 2010 Census guidelines. To quantify the number of cigarettes used per day, participants were asked at Wave 2, “On average, on… days you smoked, how many cigarettes did you usually smoke each day?” (some day smokers), or “On average, about how many cigarettes do you now smoke each day?” (daily smokers).
2.6. Statistical analysis
Data were analyzed using the R “survey” package (Lumley, 2004). Participants missing primary outcome data (i.e., alcohol use outcomes) at either wave were dropped from that respective analysis. The rate of participants missing alcohol use data at either wave was low for hazardous drinking status and total drinks (n = 52, 0.6%) and alcohol-related consequences (n = 318, 4.0%).
Separate models were created for each alcohol use outcome. All analyses were weighted using wave 2 longitudinal weights to produce nationally representative estimates and to account for participant drop-out between waves. Wave 2 replicate weights were used to account for design variables, and variance terms were estimated using the balanced repeated replication method with Fay’s adjustment set to 0.3 as recommended in the PATH data notes. In all models, we controlled for the respective alcohol use outcome at wave 1. The threshold for statistical significance for all analyses was set to p < 0.05.
Sex differences in continuous and categorical variables were examined using survey weighted Wilcoxon ranked tests and Wald chi-square tests, respectively. Generalized linear models appropriate for the distributions of each outcome variable (i.e., logistic, quasi-poisson) were used to test all hypotheses. For count models (i.e., number of total drinks, number of alcohol consequences), adjusted rate ratios (aRR) are reported, which can be interpreted as the multiplicative increase in the DV rate associated with a one unit increase in the covariate. A set of first-order models that included all covariates were estimated to test the primary hypothesis that wave 1 NMR is prospectively associated with alcohol use outcomes. All first order models included the following variable set: baseline alcohol use, NMR (log transformed), education level, sex, age, race/ethnicity, SES, and urbanicity. NMR was standardized (M = 0, SD = 1) to facilitate interpretation of the coefficients.
Secondary hypotheses were tested using a model comparison approach, in which nested models were created that included additional terms appropriate to test each hypothesis. Wald tests were used to determine whether these additional terms significantly improved model fit. The first set of secondary hypotheses tested involved sex differences. NMR was compared between sexes using a Wilcoxon signed-rank test. A second-order model that included a sex by NMR interaction term was estimated for each alcohol use outcome. We then compared models with and without sex by NMR interaction terms for all alcohol use outcomes using likelihood ratio tests (Lumley & Scott, 2014). If model fit was significantly improved by the interaction term, then the interaction was probed by estimating separate models for each sex. To examine whether the number of cigarettes per day accounted for any association between NMR and alcohol use, we restricted the sample to include only participants who reported cigarette use at Wave 2 (n = 6,117). We first examined the bivariate correlation between NMR and wave 2 cigarettes per day to quantify the association between these variables. We then re-estimated the primary models with the restricted cigarette use sample. We compared models with and without a cigarette per day term. We specifically examined the improvement in model fit that occurred when the cigarette per day term was added, as well as the NMR term in the full model.
3. Results
3.1. Demographic and descriptive data
Demographic and covariate information for the analytic sample are presented in Table 2.
Table 2.
Weighted percentages for covariates and outcome measures at Wave 1 (unweighted n = 8,032)
| Women (38.81%) | Men (61.19%) | Total | |
|---|---|---|---|
| 18–29 | 31.84 | 34.42 | 33.42 |
| 30–44 | 27.50 | 30.22 | 29.16 |
| 44+ | 40.66 | 35.36 | 37.41 |
| Race/Ethnicity | |||
| White | 67.09 | 66.36 | 66.64 |
| Black | 14.31 | 13.91 | 14.07 |
| Hispanic/Latino | 12.82 | 2.91 | 12.94 |
| Asian/PI | 1.63 | 3.80 | 2.42 |
| Other | 4.14 | 13.02 | |
| Race/Ethnicity | 3–93 | ||
| Education | |||
| < HS or GED | 22.98 | 25.77 | 24.68 |
| HS graduate | 25.05 | 27.63 | 26.63 |
| Some college | 39.86 | 32.64 | 35.45 |
| Bachelor’s degree | 9.26 | 10.42 | 9.97 |
| Advanced degree | 2.85 | 3.54 | 3.27 |
| Household income | |||
| At or above poverty level | 53.01 | 62.75 | 58.97 |
| Below poverty level | 40.27 | 31.13 | 34.67 |
| Missing | 6.72 | 6.13 | 6.36 |
| Urbanicity | |||
| Not urban | 23.59 | 25.07 | 24.50 |
| Urban | 76.41 | 74.93 | 75.50 |
| NMR (log transformed) (M [SE]) | 0.49 [0.01] | 0.42 [0.01] | 0.45 [0.01] |
Note. Reported values are weighted % of analyzed sample unless otherwise specified. NMR is nicotine metabolite ratio. Percentages reported in the “Males” and “Females” column describes the weighted % of the respective sex in that category.
3.2. Examination of sex differences in alcohol use outcomes and NMR
Sex differences in alcohol use outcomes at each wave are listed in Table 3. A Wald chi-square test found no significant difference in rates of hazardous alcohol use, F (1, 99) = 3.53, p = 0.063. Wilcoxon ranked tests found that men reported significantly more total drinks, t (98) = 10.77, p < 0.001, and more alcohol-related consequences, t (98) = 5.19, p < 0.001, compared to women. A Wilcoxon rank test found that men (M = 0.42, SE = 0.01) had significantly lower NMR compared to women (M = 0.49, SE = 0.01), t (98) = −4.41, p < 0.001.
Table 3.
Alcohol use outcomes in males and females (weighted means and %) at Waves 1 and 2
| Female | ||
| Wave 1 | Wave 2 | |
| Hazardous use (weighted %yes) | 20.46 | 20.60 |
| Total drinks (M[SE]) | 15.69 [0.81] | 16.15 [1.03] |
| Alcohol consequences (M[SE]) | 0.37 [0.02] | 0.33 [0.02] |
| Male | ||
| Wave 1 | Wave 2 | |
| Hazardous use (weighted %yes) | 24.30 | 22.42 |
| Total drinks (M[SE]) | 33.56 [1.72] | 32.06 [1.67] |
| Alcohol consequences (M[SE]) | 0.54 [0.02] | 0.46 [0.02] |
| Total | ||
| Wave 1 | Wave 2 | |
| Hazardous use (weighted %yes) | 22.82 | 21.74 |
| Total drinks (M[SE]) | 26.63 [1.13] | 25.88 [1.17] |
| Alcohol consequences (M[SE]) | 0.47 [0.01] | 0.41 [0.01] |
Note. Hazardous drinking is based on NIAAA criteria. All alcohol use outcomes are based on usage patterns during the 30 days preceding the assessment.
3.3. Prospective association between NMR and alcohol use
Results of the primary models are displayed in Table 4. There were significant prospective associations between NMR and all wave 2 alcohol use outcomes, such that higher NMR predicted higher odds of hazardous alcohol use status, aOR = 1.15, 95% CI = 1.06; 1.23, p < 0.001, higher rate of drinks consumed, aRR = 1.21, 95% CI = 1.12; 1.30, p < 0.001, and more alcohol use consequences, aRR = 1.07, 95% CI = 1.01; 1.13, p = 0.018. Each standard deviation increase in NMR at wave 1 was associated with 15% increased likelihood at meeting hazardous drinking criteria, and 21% and 7% higher rates of total drinks consumed and alcohol consequences, respectively, at wave 2.
Table 4.
Prospective association between NMR and Wave 2 alcohol use outcomes in all tobacco users
| Hazardous drinking (unweighted n = 7,980) | |||||
|---|---|---|---|---|---|
| aOR | 95% CI | R2 | LRT-2log(LR) | p | |
| Model 1a | 0.18 | ||||
| NMR | 1.14 | 1.06; 1.23 | 0.001 | ||
| Sex | |||||
| Female (ref) | |||||
| Male | 1.01 | 0.89; 1.16 | 0.859 | ||
| W1 hazardous drinking | 9.44 | 8.29; 10.76 | < 0.001 | ||
| Model 1b | 0.18 | 0.16 | 0.680 | ||
| NMR X sex | 1.02 | 0.90; 1.16 | 0.691 | ||
| Total drinks (unweighted n = 7,980) | |||||
| aRR | 95% CI | R2 | LRT-2log(LR) | p | |
| Model 2a | 0.11 | ||||
| NMR | 1.21 | 1.12; 1.30 | < 0.001 | ||
| Sex | |||||
| Female (ref) | |||||
| Male | 1.88 | 1.60; 2.21 | < 0.001 | ||
| W1 total drinks | 1.00 | 1.00; 1.00 | < 0.001 | ||
| Model 2b | 0.11 | 0.42 | 0.518 | ||
| NMR X sex | 0.96 | 0.83; 1.10 | 0.520 | ||
| Alcohol consequences (unweighted n = 7,714) | |||||
| aRR | 95% CI | R2 | LRT-2log(LR) | p | |
| Model 3a | 0.19 | ||||
| NMR | 1.07 | 1.01; 1.13 | 0.018 | ||
| Sex | |||||
| Female (ref) | |||||
| Male | 1.23 | 1.10; 1.38 | 0.001 | ||
| W1 alcohol consequences | 1.57 | 1.54; 1.60 | < 0.001 | ||
| Model 3b | 0.19 | 0.01 | 0.911 | ||
| NMR X sex | 0.99 | 0.89; 1.11 | 0.916 | ||
Note. NMR is nicotine metabolite ratio. Models 1b, 2b, and 3b are nested within models 1a, 2a, and 3a respectively. aOR is adjusted odds ratio. aRR is adjust rate ratio. aRR describes the multiplicative increase in the dependent variable associated with a 1 unit increase in the covariate. For example, Model 2a shows that each 1 unit increase in NMR is associated with a 29% increase in wave 2 total drinks. LRT column reports the likelihood ratio test of the improvement in model fit achieved by adding the NMR x sex interaction term. p values in the model rows correspond to significance test of the likelihood ratio test.
3.4. Sex differences in the association between NMR and alcohol use
Second-order models that include NMR by sex interaction terms are also reported in Table 4 (Models 1b, 2b, 3b). The likelihood ratio tests found that the NMR by sex interaction did not significantly improve model fit for any alcohol use outcome, p’s ≥ 0.518.
3.5. Cigarettes per day model comparison
Models that control for cigarettes per day are reported in Table 5. Cigarette users reported a mean of 13.68 (SE = 0.39) cigarettes per day. There was no significant association between NMR and number of cigarettes per day at wave 2, r = −0.005, p = 0.624. Cigarettes per day was not a significant predictor of wave 2 drinking outcomes in any model, p’s ≥ 0.099. The likelihood ratio tests did not find evidence of significantly improved model fit in the fully specified models compared to those with the restricted cigarettes per day term, p’s ≥ 0.112.
Table 5.
Association between NMR and alcohol use outcomes in cigarette smokers
| Hazardous alcohol use (unweighted n = 5,655) | |||||
|---|---|---|---|---|---|
| aOR | 95% CI | R2 | LRT-2log(LR) | p | |
| Model 1a | 0.18 | ||||
| NMR | 1.17 | 1.09; 1.27 | < 0.001 | ||
| W1 Hazardous drinking | 8.74 | 7.59; 10.06 | < 0.001 | ||
| Model 1b | 0.18 | 0.06 | 0.795 | ||
| NMR | 1.17 | 1.09; 1.27 | < 0.001 | ||
| Cigarettes per day | 0.99 | 0.92; 1.06 | 0.824 | ||
| Total drinks (unweighted n = 5,655) | |||||
| aRR | 95% CI | R2 | LRT-2log(LR) | p | |
| Model 2a | 0.13 | ||||
| NMR | 1.29 | 1.18; 1.41 | < 0.001 | ||
| W1 total drinks | 1.00 | 1.00; 1.00 | < 0.001 | ||
| Model 2b | 0.14 | 2.61 | 0.112 | ||
| NMR | 1.29 | 1.18; 1.41 | < 0.001 | ||
| Cigarettes per day | 1.05 | 0.99; 1.10 | 0.099 | ||
| Alcohol consequences (unweighted n = 5,799) | |||||
| aRR | 95% CI | R2 | LRT-2log(LR) | p | |
| Model 3a | 0.19 | ||||
| NMR | 1.10 | 1.02; 1.18 | 0.020 | ||
| W1 alcohol consequences | 1.52 | 1.48; 1.55 | < 0.001 | ||
| Model 3b | 0.19 | 0.61 | 0.437 | ||
| NMR | 1.10 | 1.02; 1.18 | 0.011 | ||
| Cigarettes per day | 1.02 | 0.97; 1.07 | 0.436 | ||
Note. NMR is nicotine metabolite ratio. Models 1b, 2b, and 3b are nested within models 1a, 2a, and 3a respectively. aOR is adjusted odds ratio. aRR is adjust rate ratio. LRT column reports the likelihood ratio test of the improvement in model fit achieved by adding cigarettes per day term. p values in the model rows correspond to significance test of the likelihood ratio test.
4. Discussion
Results of this study support a prospective association between rate of nicotine metabolism and several alcohol use outcomes in tobacco users, such that tobacco users with faster nicotine metabolism were more likely to engage in hazardous alcohol use, drink more alcohol, and report more alcohol-related consequences 1 year later. These findings extend prior research linking nicotine metabolism rate with alcohol use cross-sectionally in community-clinical samples (Chenoweth et al., 2014), and over the course of treatment programs in tobacco users being treated for alcohol use disorders (Dermody et al., 2018; Gubner et al., 2016). The findings reported in the current study extend this literature by confirming a prospective association between NMR and alcohol use outcomes 1 year later in a nationally representative sample that included participants reporting a full spectrum of alcohol use behavior. Consistent with previous research, women showed higher NMR compared to men (Benowitz et al., 2006); however, we found no evidence for sex differences in the association between alcohol use and nicotine metabolism rate.
Secondary analyses that examined the role of daily rates of tobacco intake in these associations were mixed. Unexpectedly, we found no evidence that faster nicotine metabolism rates were associated with higher tobacco consumption rates. This was surprising given prior research documenting a modest positive correlation between cigarettes per day and nicotine metabolism rate (see West et al., 2011 for review). Cigarettes per day is a standard measure in the field but is not a perfect measure of daily tobacco intake owing to variability in puff volume and frequency (Krebs et al., 2016). It is possible that a more direct measure of tobacco intake may have revealed significant associations; however, given the large sample size, we had enough power to detect even small associations. Controlling for cigarettes per day had only a modest effect on the primary models, suggesting that the association between nicotine metabolism rate and alcohol use outcomes occurred independently of nicotine intake amounts.
If associated variability in tobacco consumption rates do not account for higher rates of alcohol use in people with faster nicotine metabolism, then what accounts for these effects? Because this was primarily a survey-based study, we were limited in our ability to examine potential mechanisms; however, we can offer speculation based on the literature. One possibility is that individual differences in nicotine pharmacokinetic parameters alters the chronic effects of nicotine exposure on the brain in a way that sensitizes reward pathways involved in alcohol reinforcement. A positron emission topography (PET) study found that smokers with slow nicotine metabolism rates showed reduced nAChR density compared to “normal” metabolizers following overnight abstinence (Dubroff et al., 2015). Given the documented role of nAChR in alcohol reinforcement (Blomqvist et al., 2002; Soderpalm et al., 2000), increased nAChR receptor density among faster nicotine metabolizers may result in increased alcohol abuse liability. Tobacco users with high rates of nicotine metabolism may therefore be primed to be more sensitive to alcohol reinforcement. This hypothesis should be tested in the laboratory using acute alcohol administration paradigms in tobacco users with high and low rates of nicotine metabolism.
Nicotine metabolism rate is largely genetically determined. It is therefore important to consider that overlap in genetic risk may account for our findings. Fast nicotine metabolic rate may signal the presence of shared genetic risk factors that also increase susceptibility to increased alcohol use via a yet unidentified phenotype (Cross et al., 2017; Howard et al., 2003; Liu et al., 2019). CYP2A6 genotype is the primary genetic determinant of nicotine metabolism rate; however, there are likely other genes that contribute to nicotine metabolic rate (Bloom et al., 2011). These genes also may influence alcohol pharmacokinetic or pharmacodynamic parameters in a way that promotes alcohol use.
This study highlights a potential shared biological risk factor for alcohol and tobacco use; however, there are some limitations that should be considered. First, we only included Wave 1 NMR in our analyses. It is not clear in the literature to what extent NMR fluctuates over time. We were interested in understanding whether NMR influences alcohol use outcomes; however, it also possible, based on prior research, that alcohol consumption levels can affect nicotine metabolism rate by stimulating CYP2A6 production. Additional time series data will be necessary to identify temporal patterns in the associations documented here. Both outcomes should be measured frequently, because it is unlikely that the metabolic changes associated with alcohol consumption rates would continue to influence CYP2A6 activity 1 year later. Clinical trials (either smoking cessation or alcohol use disorder treatment) represent an ideal research context during which these outcomes could be measured with regularity, an approach that other research groups have used track changes in nicotine metabolism rate that occur following alcohol use reduction or abstinence (Dermody et al., 2018; Gubner et al., 2016). A similar approach could be useful for understanding how NMR immediately affects alcohol use outcomes. Second, because the PATH survey was focused primarily on tobacco use, the alcohol use outcomes lacked detail compared to similar national surveys focused on alcohol use. Finally, the behavioral and biochemical phenotypes associated with CYP2A6 polymorphisms are not well characterized. It is possible that unmeasured traits (e.g., oral contraceptive use; Chenowith et al., 2014) may have confounded the association between NMR and alcohol use outcomes.
This study highlights rate of nicotine metabolism as a biological risk factor for alcohol use among tobacco users. To our knowledge, this is the first study demonstrating a prospective association between nicotine metabolism rate and alcohol use outcomes. This overlap may contribute to the high rate of comorbidity between tobacco and alcohol use disorders. Identification of shared biological risk factors may inform the development of targeted treatment approaches.
Supplementary Material
Highlights.
Rate of nicotine metabolism is a known risk factor for tobacco use disorder
Tobacco users show high rates of harmful alcohol use
Nicotine metabolism speed was associated with alcohol outcomes at 1 year follow up
Rate of nicotine metabolism is a shared risk factor for alcohol and tobacco use
Funding:
This work was supported by grants 026890 (WR), AA027473 (SAM), AA027989 (SAM) from the National Institute on Alcohol Abuse and Alcoholism and 019426 (PI: Tebes) from the National Institute on Drug Abuse. Our funding sources had no other role in this research or our decision to publish this manuscript.
Footnotes
Publisher's Disclaimer: This is a PDF file of an unedited manuscript that has been accepted for publication. As a service to our customers we are providing this early version of the manuscript. The manuscript will undergo copyediting, typesetting, and review of the resulting proof before it is published in its final form. Please note that during the production process errors may be discovered which could affect the content, and all legal disclaimers that apply to the journal pertain.
Declaration of Interests: Nothing declared.
References
- Benowitz NL, Lessov-Schlaggar CN, Swan GE, Jacob P 3rd, 2006. Female sex and oral contraceptive use accelerate nicotine metabolism. Clin Pharmacol Ther 79(5), 480–488. Doi: 10.1016/j.clpt.2006.01.008 [DOI] [PubMed] [Google Scholar]
- Benowitz NL, Pomerleau OF, Pomerleau CS, Jacob P 3rd, 2003. Nicotine metabolite ratio as a predictor of cigarette consumption. Nicotine Tob Res 5(5), 621–624. doi: 10.1080/1462220031000158717 [DOI] [PubMed] [Google Scholar]
- Blomqvist O, Hernandez-Avila CA, Van Kirk J, Rose JE, Kranzler HR, 2002. Mecamylamine modifies the pharmacokinetics and reinforcing effects of alcohol. Alcohol Clin Exp Res 26(3), 326–331. doi: 10.1111/j.1530-0277.2002.tb02541.x [DOI] [PubMed] [Google Scholar]
- Bloom J, Hinrichs AL, Wang JC, von Weymarn LB, Kharasch ED, Bierut LJ, Goate A, Murphy SE, 2011. The contribution of common CYP2A6 alleles to variation in nicotine metabolism among European-Americans. Pharmacogenet Genomics 21(7), 403–416. doi: 10.1097/FPC.0b013e328346e8c0 [DOI] [PMC free article] [PubMed] [Google Scholar]
- Chenoweth MJ, Novalen M, Hawk LW Jr., Schnoll RA, George TP, Cinciripini PM, Lerman C, Tyndale RF, 2014. Known and novel sources of variability in the nicotine metabolite ratio in a large sample of treatment-seeking smokers. Cancer Epidemiol Biomarkers Prev 23(9), 1773–1782. doi: 10.1158/1055-9965.EPI-14-0427 [DOI] [PMC free article] [PubMed] [Google Scholar]
- Cross SJ, Lotfipour S, Leslie FM, 2017. Mechanisms and genetic factors underlying co-use of nicotine and alcohol or other drugs of abuse. Am J Drug Alcohol Abuse 43(2), 171–185. doi: 10.1080/00952990.2016.1209512 [DOI] [PMC free article] [PubMed] [Google Scholar]
- Dempsey D, Tutka P, Jacob P 3rd, Allen F, Schoedel K, Tyndale RF, Benowitz NL, 2004. Nicotine metabolite ratio as an index of cytochrome P450 2A6 metabolic activity. Clin Pharmacol Ther 76(1), 64–72. doi: 10.1016/j.clpt.2004.02.011 [DOI] [PubMed] [Google Scholar]
- Dermody SS, Hendershot CS, Andrade AK, Novalen M, Tyndale RF, 2018. Changes in nicotine metabolite ratio among daily smokers receiving treatment for alcohol use disorder. Nicotine Tob Res, 22(2), 256–263. doi: 10.1093/ntr/nty265 [DOI] [PubMed] [Google Scholar]
- Dubroff JG, Doot RK, Falcone M, Schnoll RA, Ray R, Tyndale RF, Brody AL, Hou C, Schmitz A, Lerman C, 2015. Decreased nicotinic receptor availability in smokers with slow rates of nicotine metabolism. J Nucl Med 56(11), 1724–1729. doi: 10.2967/jnumed.115.155002 [DOI] [PMC free article] [PubMed] [Google Scholar]
- Fix BV, O’Connor RJ, Benowitz N, Heckman BW, Cummings KM, Fong GT, Thrasher JF, 2017. Nicotine metabolite ratio (NMR) prospectively predicts smoking relapse: Longitudinal findings from ITC surveys in five countries. Nicotine Tob Res 19(9), 1040–1047. doi: 10.1093/ntr/ntx083 [DOI] [PMC free article] [PubMed] [Google Scholar]
- Gubner NR, Kozar-Konieczna A, Szoltysek-Boldys I, Slodczyk-Mankowska E, Goniewicz J, Sobczak A, Jacob P 3rd, Benowitz NL, Goniewicz ML, 2016. Cessation of alcohol consumption decreases rate of nicotine metabolism in male alcohol-dependent smokers. Drug Alcohol Depend 163, 157–164. doi: 10.1016/j.drugalcdep.2016.04.006 [DOI] [PMC free article] [PubMed] [Google Scholar]
- Ho MK, Mwenifumbo JC, Al Koudsi N, Okuyemi KS, Ahluwalia JS, Benowitz NL, Tyndale RF, 2009. Association of nicotine metabolite ratio and CYP2A6 genotype with smoking cessation treatment in African-American light smokers. Clin Pharmacol Ther 85(6), 635–643. doi: 10.1038/clpt.2009.19 [DOI] [PMC free article] [PubMed] [Google Scholar]
- Howard LA, Ahluwalia JS, Lin SK, Sellers EM, Tyndale RF, 2003. CYP2E1*1D regulatory polymorphism: association with alcohol and nicotine dependence. Pharmacogenetics 13(6), 321–328. doi: 10.1097/01.fpc.0000054090.48725.a2 [DOI] [PubMed] [Google Scholar]
- Hu SS, Neff L, Agaku IT, Cox S, Day HR, Holder-Hayes E, & King BA (2016). Tobacco product use among adults—United States, 2013–2014. Morbidity and Mortality Weekly Report, 65(27), 685–691. [DOI] [PubMed] [Google Scholar]
- Hyland A, Ambrose BK, Conway KP, Borek N, Lambert E, Carusi C, Taylor K, Crosse S, Fong GT, Cummings KM, Abrams D, Pierce JP, Sargent J, Messer K, Bansal-Travers M, Niaura R, Vallone D, Hammond D, Hilmi N, Kwan J, Piesse A, Kalton G, Lohr S, Pharris-Ciurej N, Castleman V, Green VR, Tessman G, Kaufman A, Lawrence C, van Bemmel DM, Kimmel HL, Blount B, Yang L, O’Brien B, Tworek C, Alberding D, Hull LC, Cheng YC, Maklan D, Backinger CL, Compton WM, 2017. Design and methods of the Population Assessment of Tobacco and Health (PATH) Study. Tob Control 26(4), 371–378. doi: 10.1136/tobaccocontrol-2016-052934 [DOI] [PMC free article] [PubMed] [Google Scholar]
- Jin M, Arya P, Patel K, Singh B, Silverstein PS, Bhat HK, Kumar A, Kumar S, 2011. Effect of alcohol on drug efflux protein and drug metabolic enzymes in U937 macrophages. Alcohol Clin Exp Res 35(1), 132–139. doi: 10.1111/j.1530-0277.2010.01330.x [DOI] [PMC free article] [PubMed] [Google Scholar]
- Krebs NM, Chen A, Zhu J, Sun D, Liao J, Stennett AL, Muscat JE, 2016. Comparison of puff volume with cigarettes per day in predicting nicotine uptake among daily smokers. Am J Epidemiol 184(1), 48–57. doi: 10.1093/aje/kwv341 [DOI] [PMC free article] [PubMed] [Google Scholar]
- Lerman C, Tyndale R, Patterson F, Wileyto EP, Shields PG, Pinto A, Benowitz N, 2006. Nicotine metabolite ratio predicts efficacy of transdermal nicotine for smoking cessation. Clin Pharmacol Ther 79(6), 600–608. doi: 10.1016/j.clpt.2006.02.006 [DOI] [PubMed] [Google Scholar]
- Levi M, Dempsey DA, Benowitz NL, Sheiner LB, 2007. Prediction methods for nicotine clearance using cotinine and 3-hydroxy-cotinine spot saliva samples II. Model application. Journal of pharmacokinetics and pharmacodynamics 34(1), 23–34. doi: 10.1007/s10928-006-9026-0 [DOI] [PubMed] [Google Scholar]
- Liu M, Jiang Y, Wedow R, Li Y, Brazel DM, Chen F, Datta G, Davila-Velderrain J, McGuire D, Tian C, Zhan X, andMe Research T, Psychiatry HA-I, Choquet H, Docherty AR, Faul JD, Foerster JR, Fritsche LG, Gabrielsen ME, Gordon SD, Haessler J, Hottenga JJ, Huang H, Jang SK, Jansen PR, Ling Y, Magi R, Matoba N, McMahon G, Mulas A, Orru V, Palviainen T, Pandit A, Reginsson GW, Skogholt AH, Smith JA, Taylor AE, Turman C, Willemsen G, Young H, Young KA, Zajac GJM, Zhao W, Zhou W, Bjornsdottir G, Boardman JD, Boehnke M, Boomsma DI, Chen C, Cucca F, Davies GE, Eaton CB, Ehringer MA, Esko T, Fiorillo E, Gillespie NA, Gudbjartsson DF, Haller T, Harris KM, Heath AC, Hewitt JK, Hickie IB, Hokanson JE, Hopfer CJ, Hunter DJ, Iacono WG, Johnson EO, Kamatani Y, Kardia SLR, Keller MC, Kellis M, Kooperberg C, Kraft P, Krauter KS, Laakso M, Lind PA, Loukola A, Lutz SM, Madden PAF, Martin NG, McGue M, McQueen MB, Medland SE, Metspalu A, Mohlke KL, Nielsen JB, Okada Y, Peters U, Polderman TJC, Posthuma D, Reiner AP, Rice JP, Rimm E, Rose RJ, Runarsdottir V, Stallings MC, Stancakova A, Stefansson H, Thai KK, Tindle HA, Tyrfingsson T, Wall TL, Weir DR, Weisner C, Whitfield JB, Winsvold BS, Yin J, Zuccolo L, Bierut LJ, Hveem K, Lee JJ, Munafo MR, Saccone NL, Willer CJ, Cornelis MC, David SP, Hinds DA, Jorgenson E, Kaprio J, Stitzel JA, Stefansson K, Thorgeirsson TE, Abecasis G, Liu DJ, Vrieze S, 2019. Association studies of up to 1.2 million individuals yield new insights into the genetic etiology of tobacco and alcohol use. Nat Genet 51(2), 237–244. doi: 10.1038/s41588-018-0307-5 [DOI] [PMC free article] [PubMed] [Google Scholar]
- Lu Y, Zhuge J, Wu D, Cederbaum AI, 2011. Ethanol induction of CYP2A5: permissive role for CYP2E1. Drug Metab Dispos 39(2), 330–336. doi: 10.1124/dmd.110.035691 [DOI] [PMC free article] [PubMed] [Google Scholar]
- Lumley T, 2004. Analysis of complex survey samples. J Stat Softw 9(1), 1–19. doi: 10.18637/jss.v009.i08 [DOI] [Google Scholar]
- Lumley T, & Scott A (2014). Tests for regression models fitted to survey data. Aust NZ J Stat, 56(1), 1–14. [Google Scholar]
- McKee SA, Falba T, O’Malley SS, Sindelar J, O’Connor PG, 2007. Smoking status as a clinical indicator for alcohol misuse in US adults. Arch Intern Med 167(7), 716–721. doi: 10.1001/archinte.167.7.716 [DOI] [PMC free article] [PubMed] [Google Scholar]
- McKee SA, Weinberger AH, 2013. How can we use our knowledge of alcohol-tobacco interactions to reduce alcohol use? Annu Rev Clin Psychol 9, 649–674. doi: 10.1146/annurev-clinpsy-050212-185549 [DOI] [PMC free article] [PubMed] [Google Scholar]
- Mooney ME, Li ZZ, Murphy SE, Pentel PR, Le C, Hatsukami DK, 2008. Stability of the nicotine metabolite ratio in ad libitum and reducing smokers. Cancer Epidemiol Biomarkers Prev 17(6), 1396–1400. doi: 10.1158/1055-9965.EPI-08-0242 [DOI] [PMC free article] [PubMed] [Google Scholar]
- Roberts W, Moore KE, Peltier MR, Verplaetse TL, Oberleitner L, Hacker R, McKee SA, 2018a. Electronic cigarette use and risk of harmful alcohol consumption in the U.S. population. Alcohol Clin Exp Res 42(12), 2385–2393. doi: 10.1111/acer.13889 [DOI] [PMC free article] [PubMed] [Google Scholar]
- Roberts W, Ralevski E, Verplaetse TL, McKee SA, Petrakis IL, 2018b. Tobacco use during a clinical trial of mecamylamine for alcohol dependence: Medication effects on smoking and associations with reductions in drinking. J Subst Abuse Treat 94, 91–96. doi: 10.1016/j.jsat.2018.08.015 [DOI] [PMC free article] [PubMed] [Google Scholar]
- Rubinstein ML, Benowitz NL, Auerback GM, Moscicki AB, 2008. Rate of nicotine metabolism and withdrawal symptoms in adolescent light smokers. Pediatrics 122(3), e643–647. doi: 10.1542/peds.2007-3679 [DOI] [PMC free article] [PubMed] [Google Scholar]
- Sayette MA, Martin CS, Wertz JM, Perrott MA, Peters AR, 2005. The effects of alcohol on cigarette craving in heavy smokers and tobacco chippers. Psychol Addict Behav 19(3), 263–270. doi: 10.1037/0893-164X.19.3.263 [DOI] [PMC free article] [PubMed] [Google Scholar]
- Schnoll RA, Patterson F, Wileyto EP, Tyndale RF, Benowitz N, Lerman C, 2009. Nicotine metabolic rate predicts successful smoking cessation with transdermal nicotine: a validation study. Pharmacol Biochem Behav 92(1), 6–11. doi: 10.1016/j.pbb.2008.10.016 [DOI] [PMC free article] [PubMed] [Google Scholar]
- Soderpalm B, Ericson M, Olausson P, Blomqvist O, Engel JA, 2000. Nicotinic mechanisms involved in the dopamine activating and reinforcing properties of ethanol. Behav Brain Res 113(1–2), 85–96. doi: 10.1016/S0166-4328(00)00203-5 [DOI] [PubMed] [Google Scholar]
- Strasser AA, Benowitz NL, Pinto AG, Tang KZ, Hecht SS, Carmella SG, Tyndale RF, Lerman CE, 2011. Nicotine metabolite ratio predicts smoking topography and carcinogen biomarker level. Cancer Epidemiol Biomarkers Prev 20(2), 234–238. doi: 10.1158/1055-9965.EPI-10-0674 [DOI] [PMC free article] [PubMed] [Google Scholar]
- Verplaetse TL, Peltier MR, Roberts W, Moore KE, Pittman BP, McKee SA, 2020. Associations between nicotine metabolite ratio and gender with transitions in cigarette smoking status and e-cigarette use: findings across waves 1 and 2 of the Population Assessment of Tobacco and Health (PATH) Study. Nicotine Tob Res. doi: 10.1093/ntr/ntaa022 [DOI] [PMC free article] [PubMed] [Google Scholar]
- West O, Hajek P, McRobbie H, 2011. Systematic review of the relationship between the 3-hydroxycotinine/cotinine ratio and cigarette dependence. Psychopharmacology (Berl) 218(2), 313–322. doi: 10.1007/s00213-011-2341-1 [DOI] [PubMed] [Google Scholar]
- Witkiewitz K, Desai SA, Steckler G, Jackson KM, Bowen S, Leigh BC, Larimer ME, 2012. Concurrent drinking and smoking among college students: An event-level analysis. Psychol Addict Behav 26(3), 649–654. doi: 10.1037/a0025363 [DOI] [PMC free article] [PubMed] [Google Scholar]
Associated Data
This section collects any data citations, data availability statements, or supplementary materials included in this article.