

Abstract
Aims/Introduction
Non‐alcoholic fatty liver disease (NAFLD) is often observed in individuals with type 2 diabetes mellitus, and it is known that the presence of type 2 diabetes mellitus leads to the aggravation of NAFLD. The aim of this study was to compare the possible effects of three kinds of oral hypoglycemic agents on NAFLD in individuals with type 2 diabetes mellitus.
Materials and Methods
We carried out a prospective clinical trial (a randomized and open‐label study) in patients with type 2 diabetes mellitus and NAFLD. A total of 98 patients were randomly allocated either to the dapagliflozin (n = 32), pioglitazone (n = 33) or glimepiride (n = 33) group, and the patients took these drugs for 28 weeks. The primary end‐point was the change of the liver‐to‐spleen ratio on abdominal computed tomography.
Results
There was no difference in baseline clinical characteristics among the three groups. Dapagliflozin, pioglitazone and glimepiride ameliorated hyperglycemia similarly. Bodyweight and visceral fat area were significantly decreased only in the dapagliflozin group. Serum adiponectin levels were markedly increased in the pioglitazone group compared with the other two groups. Dapagliflozin and pioglitazone, but not glimepiride, significantly increased the liver‐to‐spleen ratio, and the effects of dapagliflozin and pioglitazone on the liver‐to‐spleen ratio were comparable.
Conclusions
The present study showed that the decrease of visceral fat area and the increase of adiponectin level contributed to the improvement of NAFLD in patients with type 2 diabetes mellitus. Furthermore, dapagliflozin and pioglitazone exerted equivalent beneficial effects on NAFLD in patients with type 2 diabetes mellitus, although it seemed that these two drugs had different mechanisms of action.
Keywords: Non‐alcoholic fatty liver disease, Sodium-glucose cotransporter 2 inhibitor, Type 2 diabetes mellitus
Dapagliflozin and pioglitazone exerted equivalent beneficial effects on non‐alcoholic fatty liver disease in subjects with type 2 diabetes mellitus, although it seemed that these two drugs had different mechanisms of action. Dapagliflozin reduced hepatic fat storage mainly through a decrease of fat quantity, but pioglitazone improved hepatic steatosis through upgrading fat quality. Lowered plasma glucose by glimepiride might inhibit worsening of hepatic steatosis.
Introduction
Non‐alcoholic fatty liver disease (NAFLD) is one of the common causes of liver disease, and the number of individuals with NAFLD has been increasing worldwide 1 , 2 , 3 . NAFLD is classified into a simple fatty liver and non‐alcoholic steatohepatitis (NASH) accompanied by inflammation and fibrosis 1 , 4 , 5 . Furthermore, NASH could progress to liver cirrhosis and hepatocellular carcinoma 1 , 4 , 5 . Therefore, it is very important to prevent NAFLD.
Individuals with type 2 diabetes mellitus have a higher risk of NAFLD compared with non‐diabetic individuals, and NAFLD in type 2 diabetes mellitus patients tends to easily progress to NASH and severe fibrosis 5 . It has been reported that the prevalence of NAFLD in type 2 diabetes mellitus patients is 62.0–70.0% 6 , 7 , and that 12.2% of type 2 diabetes mellitus patients are diagnosed as NASH 8 . Furthermore, it was previously reported that individuals with diabetes had a twofold risk for a composite outcome, including liver cirrhosis, hepatocellular carcinoma and liver‐related death 9 .
It is not well known, however, which kind of glucose‐lowering agent could exert the largest beneficial effects on NAFLD. Insulin sensitizers, thiazolidinediones, show strong evidence for NAFLD, and are regarded as being useful for NAFLD 10 , 11 , 12 . However, as bodyweight is often increased by thiazolidinediones, it is not practical to use this drug in patients with type 2 diabetes mellitus and NAFLD. Glucagon‐like peptide‐1 receptor agonist has a weight reduction action and has drawn much attention for NAFLD treatment 10 , 11 , 12 , but there is little evidence of this at present.
Sodium–glucose cotransporter 2 (SGLT2) inhibitor is a relatively new glucose‐lowering agent that promotes urine glucose excretion by inhibiting glucose reabsorption at the renal proximal tubule and decreases blood glucose levels independently from insulin action 13 . Furthermore, SGLT2 inhibitor has the potential to reduce various multiple risk factors for arteriosclerosis, such as obesity, dyslipidemia and hypertension, as well as diabetes 14 , 15 , 16 , and thereby recently this agent has attracted a great deal of attention in the field of NAFLD 17 .
The aim of this study was to compare the effects of three kinds of hypoglycemic drugs (insulin secretagogue sulfonylurea, insulin sensitizer thiazolidinediones and glucose excretion‐modulating agent SGLT2 inhibitor) on NAFLD in patients with type 2 diabetes mellitus.
Methods
Study design
This was a prospective clinical trial (a randomized and open‐label study) that had three arms, and this trial was carried out at seven sites in Japan (Kawasaki Medical School Hospital, Ako Central Hospital, Kobatake Hospital, Mizushima Kyodo Hospital, Kondo Hospital, Takahashi Central Hospital and Tsuyama Central Hospital). The study protocol was approved by the institutional review boards and ethics committees at each site (UMIN 000021291). We carried out this study in accordance with the Declaration of Helsinki and Good Clinical Practice guidelines. Written informed consent was obtained from all participants in this study.
Participants
We recruited individuals with type 2 diabetes mellitus and NAFLD who visited the outpatient department of the enrolled hospitals from October 2015 to December 2016. The study design consisted of a screening visit, 6 weeks before randomization, and a 28‐week observation period. Inclusion criteria were as follows: age ≥20 years, hemoglobin A1c (HbA1c) ≥6.5% (47 mmol/mol), body mass index (BMI) ≥22 kg/m2 and alanine aminotransferase (ALT) ≥25 units/L (men) or ≥17 units/L (women) at screening, and a stable dose of diabetes medicine for ≥1.5 months. The participants were examined to determine the degree of fatty liver by calculating the liver‐to‐spleen (L/S) ratio with computed tomography. When the L/S ratio was <1.0, we regarded the participant as having fatty liver. Patients with the following criteria were excluded: alcohol use (>30 g/day for men, >20 g/day for women), previous treatment during the past 3 months (with insulin, SGLT2 inhibitor, thiazolidinediones or sulfonylurea), diabetic coma, renal dysfunction (estimate glomerular filtration rate <45 mL/min), cardiac failure, liver diseases (viral hepatitis, alcoholic hepatitis, autoimmune liver disease or liver cirrhosis), use of steroid and/or immunosuppressor, pregnant, possible pregnancy and/or breast‐feeding, and when the researcher deemed an individual inappropriate as a study participant. We also excluded individuals who did not visit the hospital for ≥1 month and/or who had <70% medication compliance.
Randomization
According to a predefined computer‐generated block randomization table with a 1:1:1 allocation, each patient was assigned to the pioglitazone, glimepiride or dapagliflozin treatment group. A random allocation sequence was generated by a clinical epidemiologist who was not aware of this study protocol using a computer software program (Microsoft Office Excel 2010; Microsoft Corporation, Redmond, WA, USA). The enrollment of patients and their assignment into the three groups were carried out by an investigator who was not involved in the data collection and/or treatment.
Interventions
The participants in this study started taking either dapagliflozin (5 mg/day), pioglitazone (7.5–15 mg/day) or glimepiride (0.5–1 mg/day) at baseline. We did not change any other drugs containing antidiabetic drugs throughout the study period. The target value of HbA1c was <6.5% during the 28‐weekobservation period. To carry out sufficient blood glucose management, the participants were given daily guidance from the attending physician and dietitian at each visit, and dosing of each drug was judged by each attending physician.
Outcome measures
We measured clinical parameters, including height, BMI, blood pressure, glucose and lipid parameters, and liver and renal function.
The primary outcomes were a change of the L/S ratio on computed tomography during the study period. The secondary outcomes were changes of hepatobiliary enzymes, bodyweight, visceral fat area (VFA), fasting plasma glucose, insulin, HbA1c, triglyceride, non‐esterified fatty acid, high‐density lipoprotein cholesterol, low‐density lipoprotein cholesterol, serum total adiponectin, type IV collagen 7S, and the fibrosis score (NAFLD fibrosis score 18 , Fibrosis‐4 index 19 , NAFIC (NASH, ferritin, insulin, type IV collagen 7S) score 20 ). These were calculated as follows:
NAFLD fibrosis score = −1.675 + 0.037 × age (years) + 0.094 × BMI (kg/m2) + 0.99 × aspartate aminotransferase (U/L) / ALT (U/L) – 0.013 × platelet (109/L) – 0.66 × albumin (g/dL) + 1.13 × IFG / diabetes (yes = 1, no = 0).
The presence of advanced fibrosis was diagnosed with a cut‐off score >0.676.
Fibrosis‐4 index: age (year) × aspartate aminotransferase (U/L)/ platelet (109/L) × ALT (U/L)0.5
The presence of advanced fibrosis (fibrosis stage 3–4) was diagnosed with a cut‐off score >2.67.
NAFIC score: serum ferritin ≥200 ng/mL (female) or ≥300 ng/mL (male) = 1 point; fasting insulin ≥ 10 µU/mL = 1 point; type IV collagen 7S ≥ 5.0 ng/mL = 2 points.
We selected a cut‐off value of ≥2 points to define suspected NASH progression.
Sample size calculation
When we determined the sample size, there was not a previous study that evaluated the L/S ratio using an SGLT2 inhibitor or that was carried out as a three‐arm controlled study. Generally, in multigroup comparison (e.g. Kruskal–Wallis test, F‐test and anova), it is considered that ≥0.3 effect size is a medium effect size and ≥0.5 is a large effect size 21 , 22 , 23 . Therefore, we set the effect size to 0.4 in the present study. In addition, we set a significance level to 0.05 and set a power to 90%. In such a setting, the sample size for detecting the difference in L/S ratio was estimated to be 82. When we predicted that dropout rate would be approximately 10%, it was estimated that >90 patients would be necessary (>30 in each treatment group) in this randomized clinical trial.
Statistical analysis
All analyses were carried out using JMP version 11 (SAS Institute, Inc., Cary, NC, USA). The results were expressed as the mean ± standard error. Wilcoxon signed‐rank test and Bonferroni correction were used for the comparison among paired groups. Kruskal–Wallis and Steel–Dwass methods were used for the comparison among the three unpaired groups. The χ2‐test was used to identify difference among the three groups. In analysis of the association between the L/S ratio and various clinical parameters, univariate analyses and multiple regression analyses were carried out after logarithmic transformation of the non‐normal distributional variables. The Pearson product‐moment correlation coefficient was used for univariate analyses, and the least squares method was used for multiple regression analyses. P < 0.05 was considered statistically significant.
Results
Flow from enrollment to analysis
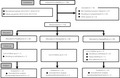
A total of 110 patients were randomly assigned to receive pioglitazone, glimepiride or dapagliflozin, and 101 patients completed this trial. We finally obtained and evaluated the data from 98 participants (pioglitazone n = 33, glimepiride n = 33, dapagliflozin n = 32; Figure 1).
Figure 1.
Flow of enrollment, allocation, follow up and analysis in this study. Data are the number of study participants. A total of 110 patients are randomly assigned to receive pioglitazone, glimepiride or dapagliflozin, and finally the data of 98 participants are evaluated in this study.
Baseline characteristics
The baseline characteristics were similar among the three groups, although there was a difference in high‐density lipoprotein cholesterol between the pioglitazone group and the other two groups (Tables 1,2; Table S1). There was no statistical difference in the rate of each drug use before intervention. The proportions of participants with suspected NASH and advanced fibrosis by clinical scoring systems in all participants were as follows: NAFIC score ≥2 points, 40.2%; Fibrosis‐4 index >2.67, 5.6%; NAFLD fibrosis score >0.675, 12.2%. There was no difference in the proportion of participants with suspected NASH and advanced fibrosis among each group.
Table 1.
Baseline characteristics of the study participants
|
All Subjects (n = 98) |
Pioglitazone (n = 33) |
Glimepiride (n = 33) |
Dapagliflozin (n = 32) |
P | |
|---|---|---|---|---|---|
| Age (years) | 59 ± 1 | 59.0 ± 1.9 | 58.0 ± 2.3 | 58.7 ± 1.6 | 0.90 |
| Male, n (%) | 45 (45.9) | 15 (45.5) | 15 (45.5) | 15 (46.9) | 0.99 |
| Bodyweight (kg) | 76.0 ± 1.7 | 75.0 ± 3.3 | 75.7 ± 2.7 | 77.1 ± 2.9 | 0.76 |
| BMI (kg/m2) | 28.8 ± 0.5 | 28.7 ± 0.9 | 28.4 ± 0.7 | 29.5 ± 0.8 | 0.40 |
| Visceral fat area (cm2) | 178.8 ± 6.5 | 174.2 ± 12.7 | 169.6 ± 10.1 | 193.4 ± 10.9 | 0.18 |
| Duration of diabetes (years) | 7.2 ± 0.5 | 7.9 ± 0.8 | 7.2 ± 1.0 | 6.6 ± 0.9 | 0.31 |
| HbA1c (%) | 7.5 ± 0.1 | 7.4 ± 0.2 | 7.6 ± 0.2 | 7.4 ± 0.2 | 0.44 |
| HbA1c (mmol/mol) | 57.9 ± 1.0 | 57.3 ± 1.9 | 59.2 ± 1.7 | 57.2 ± 1.7 | 0.44 |
| FPG (mg/dL) | 143 ± 3.3 | 137 ± 3.9 | 148 ± 6.1 | 145 ± 6.9 | 0.46 |
| L/S ratio | 0.74 ± 0.02 | 0.74 ± 0.04 | 0.73 ± 0.04 | 0.75 ± 0.04 | 0.88 |
| ALT (units/L) | 47.2 ± 3.0 | 46.1 ± 6.1 | 45.3 ± 4.6 | 50.3 ± 4.7 | 0.31 |
| AST (units/L) | 35.0 ± 2.1 | 34.1 ± 3.9 | 32.3 ± 2.5 | 38.8 ± 4.1 | 0.18 |
| γ‐GT (units/L) | 54.9 ± 4.5 | 52.6 ± 8.8 | 50.6 ± 5.3 | 61.7 ± 8.7 | 0.15 |
| Medications, n (%) | |||||
| Glinide | 1 (1.0) | 0 (0) | 0 (0) | 1 (3.1) | 0.35 |
| DPP‐4 inhibitor | 65 (66.3) | 21 (63.6) | 26 (78.8) | 18 (56.3) | 0.15 |
| Metformin | 70 (71.4) | 25 (75.8) | 23 (69.7) | 22 (68.8) | 0.79 |
| GLP‐1 receptor agonists | 1 (1.0) | 0 (0) | 0 (0) | 1 (3.1) | 0.35 |
| α‐GI (%) | 12 (12.2) | 4 (12.1) | 3 (9.1) | 5 (15.6) | 0.72 |
| Ursodeoxycholic acid | 4 (4.1) | 1 (3.0) | 2 (6.1) | 1 (3.1) | 0.78 |
| ARB or ACE inhibitor | 34 (34.7) | 14 (42.4) | 11 (33.3) | 9 (28.1) | 0.47 |
| Statin | 65 (66.3) | 22 (66.7) | 21 (63.6) | 22 (68.8) | 0.91 |
| Fibrate | 9 (9.2) | 2 (6.1) | 5 (15.2) | 2 (6.3) | 0.35 |
| EPA | 3 (3.1) | 1 (3.0) | 1 (3.0) | 1 (3.1) | 1.00 |
| Clinical scoring systems, n (%) | |||||
| NAFLD fibrosis score ≥0.675 | 11 (12.2) | 3 (10.0) | 4 (13.8) | 4 (12.9) | 0.89 |
| FIB‐4 index ≥2.67 | 5 (5.6) | 1 (3.2) | 2 (6.7) | 2 (6.9) | 0.78 |
| NAFIC score ≥2 points | 39 (40.2) | 14 (43.8) | 14 (42.4) | 11 (34.4) | 0.71 |
Data are mean ± standard error of the mean. P‐values were calculated by the Kruskal–Wallis test for quantitative variables or by the χ2‐test for qualitative variables. α‐GI, glucosidase inhibitor; γ‐GT, glutamyl transferase; ACE, angiotensin‐converting enzyme; ALT, alanine aminotransferase; ARB, angiotensin receptor blocker; AST, aspartate aminotransferase; BMI, body mass index; DPP‐4, dipeptidyl peptidase‐4; EPA, eicosapentaenoic acid; FIB‐4, Fibrosis‐4; FPG, fasting plasma glucose; GLP‐1, glucogon‐like peptide‐1; HbA1c, glycated hemoglobin; L/S ratio, liver‐to‐spleen ratio; NAFIC, NASH, ferritin, insulin, type IV collagen 7S; NAFLD, non‐alcoholic fatty liver disease.
Table 2.
Changes in non‐alcoholic fatty liver disease‐related parameters, glycemic and other metabolic parameters in each treatment group from baseline to 28 weeks
| Pioglitazone (n = 33) | Glimepiride (n = 33) | Dapagliflozin (n = 32) | P | |||
|---|---|---|---|---|---|---|
| Pio vs Gli | Dapa vs Gli | Pio vs Dapa | ||||
| L/S ratio | ||||||
| At baseline | 0.74 ± 0.04 | 0.73 ± 0.04 | 0.75 ± 0.04 | 0.93 | 0.91 | 0.97 |
| 28 weeks | 0.96 ± 0.06 | 0.76 ± 0.05 | 0.91 ± 0.05 | 0.037 | 0.049 | 0.81 |
| Change from baseline | 0.22 ± 0.04* | 0.03 ± 0.04 | 0.17 ± 0.04* | 0.002 | 0.014 | 0.48 |
| ALT (units/L) | ||||||
| At baseline | 46.1 ± 6.1 | 45.3 ± 4.6 | 50.3 ± 4.7 | 0.76 | 0.63 | 0.31 |
| 28 weeks | 31.0 ± 3.5 | 44.3 ± 4.7 | 37.4 ± 4.5 | 0.025 | 0.19 | 0.49 |
| Change from baseline | −15.1 ± 4.8 | −1.0 ± 3.9 | −12.8 ± 3.6* | 0.037 | 0.006 | 0.47 |
| AST (units/L) | ||||||
| At baseline | 34.1 ± 3.9 | 32.3 ± 2.5 | 38.8 ± 4.1 | 0.77 | 0.41 | 0.19 |
| 28 weeks | 26.9 ± 2.0 | 32.7 ± 2.6 | 30.2 ± 3.1 | 0.08 | 0.25 | 0.83 |
| Change from baseline | −7.1 ± 3.2* | 0.3 ± 2.1 | −8.7 ± 2.5* | 0.43 | 0.012 | 0.26 |
| γ‐GT (units/L) | ||||||
| at baseline | 52.6 ± 8.8 | 50.6 ± 5.3 | 61.7 ± 8.7 | 0.67 | 0.59 | 0.12 |
| 28 weeks | 37.5 ± 6.0 | 54.2 ± 6.0 | 46.5 ± 6.4 | 0.01 | 0.35 | 0.12 |
| Change from baseline | −15.1 ± 6.8* | 3.6 ± 4.6 | −15.2 ± 5.7* | 0.01 | 0.003 | 0.52 |
| Serum ferritin (ng/mL) | ||||||
| At baseline | 145.7 ± 29.0 | 171.5 ± 36.8 | 156.4 ± 18.5 | 1.00 | 0.42 | 0.47 |
| 28 weeks | 119.6 ± 15.8 | 140.3 ± 25.7 | 97.8 ± 12.4 | 0.97 | 0.88 | 0.81 |
| Change from baseline | −24.8 ± 24.2 | −31.2 ± 18.8* | −58.7 ± 13.4* | 0.59 | 0.007 | 0.0005 |
| Serum type IV collagen 7S (ng/mL) | ||||||
| At baseline | 4.97 ± 0.26 | 4.57 ± 0.16 | 4.68 ± 0.19 | 0.88 | 0.96 | 0.94 |
| 28 weeks | 4.72 ± 0.22 | 4.62 ± 0.17 | 4.45 ± 0.20 | 0.99 | 0.44 | 0.57 |
| Change from baseline | −0.25 ± 0.24 | 0.05 ± 0.14 | −0.23 ± 0.15 | 0.59 | 0.28 | 0.79 |
| Visceral fat area (cm2) | ||||||
| At baseline | 174.2 ± 12.7 | 169.6 ± 10.0 | 193.4 ± 10.9 | 0.99 | 0.26 | 0.22 |
| 28 weeks | 176.7 ± 11.7 | 176.4 ± 9.5 | 173.6 ± 9.1 | 0.99 | 0.99 | 1.00 |
| Change from baseline | 2.6 ± 5.0 | 6.8 ± 3.7 | −19.4 ± 4.1* | 0.69 | 0.0001 | 0.012 |
| Bodyweight (kg) | ||||||
| At baseline | 75.0 ± 3.3 | 75.7 ± 2.7 | 77.1 ± 2.9 | 0.90 | 0.97 | 0.74 |
| 28 weeks | 77.5 ± 3.5 | 77.1 ± 2.8 | 74.3 ± 3.0 | 0.97 | 0.65 | 0.88 |
| Change from baseline | 2.5 ± 0.4* | 1.4 ± 0.4* | −2.8 ± 0.3* | 0.06 | <0.0001 | <0.0001 |
| HbA1c (%) | ||||||
| At baseline | 7.39 ± 0.18 | 7.57 ± 0.15 | 7.38 ± 0.16 | 0.49 | 0.54 | 1.00 |
| 28 weeks | 6.91 ± 0.13 | 7.27 ± 0.20 | 6.87 ± 0.12 | 0.30 | 0.26 | 0.95 |
| Change from baseline | −0.48 ± 0.18* | −0.30 ± 0.18 | −0.52 ± 0.12* | 0.51 | 0.57 | 0.99 |
| FPG (mg/dL) | ||||||
| At baseline | 136.6 ± 3.9 | 148.4 ± 6.0 | 145.4 ± 6.9 | 0.43 | 0.70 | 0.95 |
| 28 weeks | 125.3 ± 4.1 | 143.8 ± 5.7 | 129.8 ± 3.6 | 0.046 | 0.35 | 0.61 |
| Change from baseline | −11.3 ± 4.4* | −4.5 ± 6.4 | −15.6 ± 5.8* | 0.16 | 0.27 | 0.94 |
| Serum insulin (mU/mL) | ||||||
| At baseline | 14.1 ± 2.3 | 11.6 ± 0.8 | 15.2 ± 1.7 | 0.85 | 0.49 | 0.20 |
| 28 weeks | 11.6 ± 1.9 | 12.0 ± 0.9 | 14.1 ± 2.0 | 0.11 | 0.99 | 0.10 |
| Change from baseline | −2.4 ± 1.0 | 0.3 ± 0.8 | −1.1 ± 1.4 | 0.27 | 0.60 | 0.90 |
| HOMA‐IR | ||||||
| At baseline | 4.60 ± 0.74 | 4.35 ± 0.35 | 5.40 ± 0.60 | 0.58 | 0.71 | 0.11 |
| 28 weeks | 3.75 ± 0.81 | 4.39 ± 0.41 | 4.56 ± 0.63 | 0.47 | 0.85 | 0.37 |
| Change from baseline | −0.86 ± 0.48 | 0.04 ± 0.38 | −0.86 ± 0.55 | 0.62 | 0.36 | 0.86 |
| Serum adiponectin (ng/mL) | ||||||
| At baseline | 2,993 ± 335 | 3,042 ± 315 | 2,477 ± 226 | 1.00 | 0.62 | 0.62 |
| 28 weeks | 9,404 ± 1,116 | 3,857 ± 444 | 3,394 ± 301 | 0.0005 | 0.99 | 0.0002 |
| Change from baseline | 6,411 ± 926* | 815 ± 250* | 917 ± 186* | <0.0001 | 0.81 | <0.0001 |
| LDL cholesterol (mg/dL) | ||||||
| At baseline | 99.8 ± 4.2 | 110.6 ± 4.1 | 105.2 ± 3.8 | 0.20 | 0.74 | 0.40 |
| 28 weeks | 101.5 ± 3.5 | 114.0 ± 4.2 | 104.9 ± 4.5 | 0.10 | 0.44 | 0.74 |
| Change from baseline | 1.6 ± 4.1 | 3.4 ± 3.5 | −0.3 ± 4.2 | 0.99 | 0.52 | 0.65 |
| HDL cholesterol (mg/dL) | ||||||
| At baseline | 54.4 ± 1.6 | 48.6 ± 1.6 | 46.4 ± 1.7 | 0.02 | 0.60 | 0.002 |
| 28 weeks | 58.3 ± 2.0 | 48.2 ± 1.7 | 50.7 ± 1.9 | 0.001 | 0.67 | 0.02 |
| Change from baseline | 3.9 ± 1.6* | −0.4 ± 0.8 | 4.3 ± 1.1* | 0.12 | 0.002 | 0.95 |
| Triglyceride (mg/dL) | ||||||
| At baseline | 124.9 ± 9.2 | 154.1 ± 17.0 | 173.2 ± 26.0 | 0.84 | 0.80 | 0.33 |
| 28 weeks | 128.6 ± 14.4 | 156.8 ± 16.2 | 140.9 ± 10.4 | 0.34 | 0.99 | 0.18 |
| Change from baseline | 3.7 ± 10.5 | 2.7 ± 9.6 | −32.3 ± 21.1 | 0.98 | 0.89 | 0.74 |
| NEFA (μEq/L) | ||||||
| At baseline | 587.2 ± 36.0 | 671.5 ± 35.1 | 656.9 ± 54.3 | 0.20 | 0.62 | 0.81 |
| 28 weeks | 428.1 ± 28.7 | 503.1 ± 31.3 | 498.1 ± 35.6 | 0.21 | 1.00 | 0.32 |
| Change from baseline | −159.1 ± 41.9* | −168.4 ± 42.7* | −158.8 ± 54.2* | 0.97 | 0.62 | 0.88 |
| Systolic BP (mmHg) | ||||||
| At baseline | 130.6 ± 3.2 | 136.3 ± 3.2 | 134.5 ± 3.2 | 0.50 | 0.90 | 0.73 |
| 28 weeks | 130.4 ± 2.4 | 136.9 ± 2.9 | 131.1 ± 3.0 | 0.35 | 0.32 | 1.00 |
| Change from baseline | 0.07 ± 3.0 | 0.71 ± 2.8 | −3.04 ± 2.9 | 1.00 | 0.71 | 0.65 |
| Diastolic BP (mmHg) | ||||||
| At baseline | 79.0 ± 1.9 | 806 ± 1.8 | 81.1 ± 2.5 | 0.65 | 0.99 | 0.79 |
| 28 weeks | 80.2 ± 1.6 | 80.4 ± 1.7 | 80.1 ± 2.1 | 0.95 | 0.98 | 0.99 |
| Change from baseline | 1.62 ± 1.6 | −0.32 ± 1.8 | −1.62 ± 1.9 | 0.58 | 0.94 | 0.44 |
Data are the mean ± standard error of the mean. P‐values were calculated by the Steel–Dwass test. *P < 0.05 compared with baseline. γ‐GT, glutamyl transferase; ALT, alanine aminotransferase; AST, aspartate aminotransferase; BP, blood pressure; Dapa, dapagliflozin; FPG, fasting plasma glucose; Gli, glimepiride; HbA1c, glycated hemoglobin; HDL, high‐density lipoprotein; HOMA‐IR, homeostasis model assessment of insulin resistance; LDL, low‐density lipoprotein; L/S ratio, liver‐to‐spleen ratio; NEFA, non‐esterified fatty acid; Pio, pioglitazone.
Dose of study drugs and adverse events during observation period
The mean final dose of pioglitazone and glimepiride were 17.3 mg/day and 0.9 mg/day, respectively. The dose of dapagliflozin was fixed to 5.0 mg. Table S2 shows the confirmed adverse events. There were no severe adverse events in the three groups.
Change of L/S ratio and hepatobiliary enzymes
The percentage of participants whose L/S ratio value was increased after the treatment was as follows: 81.8% for pioglitazone, 48.5% for glimepiride and 84.4% for dapagliflozin (Figure 2). There was a significant difference in the change of the L/S ratio value between the glimepiride group and the other groups, but the degree of the increase of the L/S ratio in the dapagliflozin group was comparable with that in the pioglitazone group (Figure 2; Table 2). The percentage of the participants whose L/S ratio value was increased up to >1.1 was 45.5% in the pioglitazone group, 9.1% in the glimepiride group and 34.4% in the dapagliflozin group, respectively.
Figure 2.
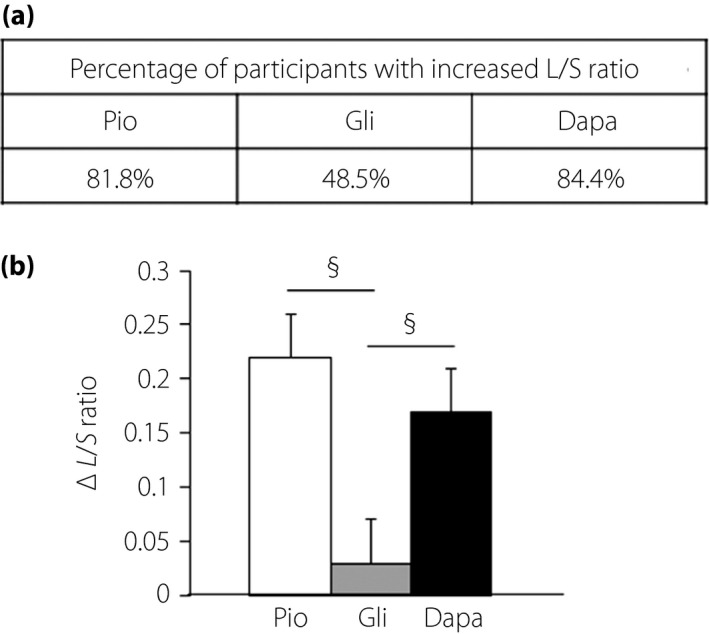
Changes of the liver‐to‐spleen (L/S) ratio on computed tomography from baseline to 28 weeks. (a) The percentage of participants whose L/S ratio was increased and (b) the degree of changes in the L/S ratio in each group. The L/S ratio was increased after the treatment with dapagliflozin (Dapa) and pioglitazone (Pio), but not with glimepiride (Gli). The Kruskal–Wallis and Steel–Dwass methods were used for the comparison among three unpaired groups. § P < 0.05 versus glimepiride.
The change in the L/S ratio value was significantly correlated with that in parameters of liver damage (Figure S1a). Pioglitazone and dapagliflozin significantly decreased serum ALT levels (−15.1 units/L and −12.8 units/L, respectively), whereas there was no significant change between before and after glimepiride treatment (−1.0 units/L; Table 2; Figure S1b,c). There was a significant difference in the change of ALT levels between the glimepiride group and the other groups, but the degree of decrease of ALT levels in the dapagliflozin group was comparable with that in the pioglitazone group (Figure S1b). The proportion of participants who had a value above the reference value of serum type IV collagen 7S (reference value ≤5.0 ng/mL) 20 , a marker for hepatic fibrosis, at baseline was just 8.1% of all participants. However, we examined the effects of study drugs on this fibrotic marker. Although pioglitazone and dapagliflozin tended to decrease the serum type IV collagen 7S level, the effects were not significant (Table 2). There was no significant difference in the degree of change in the serum type IV collagen 7S level among each group (Table 2).
Change of HbA1c, other parameters and body compositions
There were also similar decreases in glycemic parameters among the three groups. The change of HbA1c levels from baseline to 28 weeks were as follows: pioglitazone, −0.48%; glimepiride, −0.30%; dapagliflozin, −0.52%; and Kruskal–Wallis test, P = 0.46 (Table 2). In the time course of HbA1c levels, there was no significant difference among the three groups (Figure S2a).
Dapagliflozin significantly decreased bodyweight by −2.8 kg, whereas pioglitazone and glimepiride significantly increased by 2.5 kg and 1.4 kg, respectively (Table 2; Figure S2b). Similarly, VFA in the dapagliflozin group was significantly decreased by −19.4 cm2. In contrast, in the pioglitazone group, VFA was slightly increased by 2.6 cm2, but it did not reach a statistical significance. In the glimepiride group, VFA was also slightly increased by 6.8 cm2, but it also did not reach a statistical significance (Table 2). The degree of change in bodyweight and VFA was significant in the dapagliflozin group compared with the other two groups (Table 2; Figure S3a). We then examined the change in serum adiponectin levels. Adiponectin levels at 28 weeks in all groups were significantly increased compared with that at baseline (Table 2). In particular, the degree of elevation of adiponectin levels in the pioglitazone group was marked compared with the other two groups (Table 2; Figure S3b). Fasting serum insulin levels and homeostasis model assessment of insulin resistance tended to decrease in the pioglitazone and dapagliflozin groups (Table 2). Serum non‐esterified fatty acid was decreased, but there was no difference among the three groups (Table 2).
Contributing factors to the improvement of NAFLD with type 2 diabetes mellitus
We examined the data in all participants to clarify what kinds of pathophysiological change contributed to the improvement of NAFLD in patients with type 2 diabetes mellitus. The change of the L/S ratio was significantly correlated with the change of BMI, VFA, adiponectin, HbA1c and insulin (Table S3A). Furthermore, multiple regression analysis showed that the reduction of VFA and the elevation of adiponectin level were independent contributing factors to the amelioration of NAFLD in patients with type 2 diabetes mellitus (Table S3b).
Difference of action on NAFLD among each glucose‐lowering drug
We then evaluated the association between an increase of the L/S ratio and changes of various parameters in participants with each glucose‐lowering drug. The change of L/S ratio was negatively correlated with the change of VFA in all groups (Table 3). In contrast, there was some difference among the three groups regarding which factors were correlated with a change of the L/S ratio. A change of the L/S ratio was positively correlated with the alteration of adiponectin level in the pioglitazone group, was negatively correlated with the alteration of HbA1c level in the glimepiride group and was negatively correlated with the alteration of plasma insulin level in the dapagliflozin group (Table 3).
Table 3.
Correlation between change of the liver‐to‐spleen ratio and alteration of various clinical parameters in each treatment group
| Variable | Variables | Pioglitazone (n = 33) | Glimepiride (n = 33) | Dapagliflozin (n = 32) | |||
|---|---|---|---|---|---|---|---|
| r | P | r | P | r | P | ||
| ΔL/S ratio | ΔVFA | −0.529 | 0.002 | −0.401 | 0.021 | −0.511 | 0.006 |
| ΔAdiponectin | 0.533 | 0.001 | 0.234 | 0.190 | 0.334 | 0.067 | |
| ΔNEFA | −0.249 | 0.163 | −0.234 | 0.190 | 0.059 | 0.748 | |
| ΔHbA1c | −0.015 | 0.934 | −0.346 | 0.048 | −0.314 | 0.086 | |
| ΔInsulin | −0.274 | 0.123 | −0.076 | 0.673 | −0.412 | 0.024 | |
Univariate analyses were carried out with the Pearson correlation coefficient after logarithmic transformation of non‐normal distributional variables. HbA1c, glycated hemoglobin; L/S ratio, liver‐to‐spleen ratio; NEFA, non‐esterified fatty acid; VFA, visceral fat area.
Discussion
The present study showed that it is important to decrease VFA and/or increase serum adiponectin levels for the treatment of NAFLD in patients with type 2 diabetes mellitus, even after adjustment by various clinical confounding factors. Furthermore, our study showed that dapagliflozin and pioglitazone exerted equivalent beneficial effects on NAFLD in patients with type 2 diabetes mellitus, although it seemed that each drug had different mechanisms to act on hepatic steatosis.
In the present study, pioglitazone significantly increased the adiponectin level compared with glimepiride or dapagliflozin, although glimepiride and dapagliflozin also increased the adiponectin level. The L/S ratio was significantly elevated in the pioglitazone group, together with a marked increase of the adiponectin level (Figure 1a). Furthermore, as it was reported that pioglitazone decreased VFA 24 , we predicted that pioglitazone would be effective for not only hepatic steatosis, but also for the amount of visceral fat. In the present study, however, pioglitazone did not alter VFA during the study period. The L/S ratio in the pioglitazone group was increased together with the elevation of the adiponectin level even in a subgroup that showed an increase of VFA after treatment with pioglitazone (data not shown). These results indicated that the primary mechanism for improvement of hepatic steatosis by pioglitazone was the increment of the adiponectin level. Thiazolidinediones increase the serum adiponectin level under the control of peroxisome proliferator‐activated receptor gamma. Increased adiponectin, through AdipoR1 and AdipoR2, activates the adenosine monophosphate‐activated protein kinase pathway, thereby inhibiting lipogenesis and accelerating fatty acid oxidation in the liver 25 . Taking the present data and previous study together 26 , we concluded that the beneficial effects by thiazolidinedione on NAFLD were mainly through the increased adiponectin level; that is, the improvement of adipose tissue quality. Furthermore, peroxisome proliferator‐activated receptor gamma activation by thiazolidinediones in adipose tissue promotes lipid uptake and triglyceride storage in adipose tissue. Free fatty acids are taken up by white adipose tissue, and sequestered away from the liver and skeletal muscle (lipid steal hypothesis) 27 . This mechanism might be involved in the reduction of fat accumulation in the liver. In addition, the L/S ratio was decreased in certain cases in the pioglitazone group. Therefore, although we believe that increased adiponectin contributed to the improvement of liver fat accumulation to some extent in the pioglitazone group when we evaluated the patients as a whole, increased adiponectin did not necessarily lead to such improvement in all patients in the same way. It is possible that there is a different mechanism underlying the improved liver fat accumulation by pioglitazone in addition to increased adiponectin. In the present study, we failed to evaluate this point because of the limited number of participants whose L/S ratio was decreased by pioglitazone. Further study with a larger number of participants would be necessary to elucidate this point.
Dapagliflozin had an equivalent impact on hepatic steatosis compared with pioglitazone, in accordance with the previous study result 26 . In the present study, although reduced VFA was a very important factor to improve hepatic steatosis in patients with type 2 diabetes mellitus, decreased VFA was achieved only by dapagliflozin among the present study agents. In addition, the increase of the L/S ratio with dapagliflozin was significantly correlated with not only the reduction of VFA, but also the correction of hyperinsulinemia (Table 3), which was one of the exacerbating factors in regard to hepatic steatosis. However, the L/S ratio level in the dapagliflozin group did not show a clear additive gain when we examined the relationship between the degree of reduction of VFA or decrease of serum insulin level and the increase of the L/S ratio (data not shown). These results suggest that the beneficial effects of dapagliflozin on hepatic steatosis through the correction of hyperinsulinemia might be associated with the reduction of VFA. From these results, we assume that SGLT2 inhibitor improves NAFLD mainly by reducing the quantity of visceral fat.
In contrast, glimepiride did not improve the L/S ratio level and ALT level, but did not exacerbate those indexes, although we predicted that excess insulin secretion by glimepiride might worsen hepatic steatosis slightly. As shown in Table 3, the increased L/S ratio with glimepiride was significantly correlated with a reduction of HbA1c. Furthermore, the L/S ratio in the glimepiride group tended to decrease in only one subgroup, which showed an increase of both VFA and HbA1c after treatment with glimepiride, and the ratio tended to increase in other subgroups, which resulted in decreased HbA1c (data not shown). Previous studies also showed that intrahepatic fat was reduced by alleviation of glucose toxicity 5 , 9 , 16 . As sulfonylurea has a strong hypoglycemic effect, we assume that the correction of glucose toxicity by glimepiride leads to minimalizing the worsening of hepatic steatosis with a slight increase of VFA. Interestingly, gliclazide decreased the aminotransferase levels in patients with both type 2 diabetes and NAFLD through not only improvement of hyperglycemia, but also reduced bodyweight 28 . Even with sulfonylurea, it might be effective for hepatic lipid accumulation if reduced bodyweight can be maintained for the long term. The present study clearly showed that the reduction of VFA was a common and important point to improve hepatic steatosis in any treatment groups (Table 3). Feng et al. 28 also reported that reductions in weight, fat mass and waist circumference favorably affect hepatic injury through a clinical trial comparing liraglutide, metformin and gliclazide. The reduction of VFA decreased free fatty acid translocation from adipose tissue to the liver, corrected hyperinsulinemia and increased adiponectin level. A previous systematic review and meta‐analysis reported that weight loss ≥7% improved the histological disease activity of NAFLD 29 . From the present results, even when any glucose‐lowering agent is prescribed for the treatment of diabetes, a reduction of VFA leads to the amelioration of NAFLD.
Finally, serum type IV collagen 7S level, a hepatic fibrosis marker 30 , tended to decrease after treatment with pioglitazone or dapagliflozin. Although it was already known that pioglitazone has a well‐established beneficial effect on hepatic fibrosis in NASH 31 , it has attracted a great deal of attention recently as to whether SGLT2 inhibitor can improve the progression of NASH. It was previously reported that ipragliflozin decreased hepatic lipid content and fibrosis in NASH model mice 32 . Inoue et al. 33 reported that canagliflozin significantly decreased serum type IV collagen 7S levels in accordance with reduced body mass, fat mass and hepatic fat content in type 2 diabetes patients with NAFLD. Seko et al 34 also showed that canagliflozin significantly reduced serum type IV collagen 7S levels in type 2 diabetes mellitus patients with biopsy‐proven NASH. Several previous studies reported that canagliflozin 33 , 34 , dapagliflozin 35 and empagliflozin 36 , irrespective of SGLT2 selectivity, have an inhibitory effect on hepatic fibrosis in type 2 diabetes patients with NAFLD. Therefore, although it has not been uncovered completely, there might be no difference between each SGLT2 inhibitor. Unfortunately, however, the decrease in serum type IV collagen 7S level with dapagliflozin in the present study was not significant. The baseline characteristics, including aminotransferase, serum ferritin and serum type IV collagen 7S, were less severe in the present study than in the previous studies 33 , 34 . Shimizu et al. 35 showed that dapagliflozin attenuated liver fibrosis only in patients with significant hepatic fibrosis. The reason why the change in serum type IV collagen 7S levels in the present study were different from several previous studies might be due to relatively mild liver damage at baseline in the present study participants. To clarify the efficacy of SGLT2 inhibitor on hepatic fibrosis, it would be necessary to carry out further research that has more patients with progression of hepatic fibrosis and by which consecutive liver biopsies are planned.
The present study had some major strengths. To the best of our knowledge, the present study is the first randomized, three‐arm, active control study including SGLT2 inhibitor. Furthermore, we selected sulfonylurea as one of the active comparators to evaluate the possible effects of sulfonylurea on hepatic steatosis, because there is little evidence regarding the effect of sulfonylurea on NAFLD. As a consequence, we could evaluate the effect of glimepiride on hepatic steatosis in addition to showing the equivalent effect of dapagliflozin and pioglitazone on hepatic steatosis. We believe that the findings of the present study would be useful in clinical practice, as well as the NAFLD research area.
In contrast, there were several limitations to the present study. First, the present study was carried out without placebo‐control and was not a double‐blinded study. Second, it is possible that the intervention period was not long enough and the sample size was not large enough. Third, multiple regression analysis to uncover independent contributing factors in each group could not be carried out, because the number of cases in each group was small. Fourth, there were few cases in which the development of hepatic fibrosis was suspected. Fifth, we could not carry out the liver biopsy to evaluate the degree of progression of NAFLD. Finally, as the present study was carried out in Japanese individuals with type 2 diabetes mellitus, the data in this study might not be necessarily true in white individuals who are generally more obese.
In conclusion, the decrease of VFA and increase of adiponectin contributed to the improvement of NAFLD in patients with type 2 diabetes mellitus. Dapagliflozin and pioglitazone showed equivalent beneficial effects on NAFLD, although it seemed that the two drugs exerted such effects through different mechanisms.
Disclosure
HK has received honoraria for lectures, and received scholarship grants from Astellas, Astra Zeneca, Eli Lill, MSD, Ono Pharma, Kissei Pharma, Kowa Pharmaceutical, Success Point, Sanofi, Japan Diabetes Foundation, Japan Foundation for Applied Enzymology, Study group for diabetes mellitus and vascular lesion, Sumitomo Dainippon Pharma, Takeda, Takeda Pharmaceutical, Daiichi Sankyo, Nippon Boehringer Ingelheim, Novo Nordisk, Mitsubishi Tanabe Pharma, and Mochida Pharmaceutical. KK has been an advisor to, received honoraria for lectures from, and received scholarship grants from Astellas, Astra Zeneca, MSD, Ono Pharma, Kissei Pharma, Kowa Pharmaceutical, Sanofi, Sanwa Kagaku Kenkyusho, Sumitomo Dainippon Pharma, Taisho Toyama Pharma, Takeda Pharmaceutical, Daiichi Sankyo, Nippon Boehringer Ingelheim, Novo Nordisk, Fujifilm Pharma and Mitsubishi Tanabe Pharma. MS and SN have received honoraria for lectures from AstraZeneca and Sanofi, respectively. The other authors have not received honoraria for lectures and received scholarship grants.
Supporting information
Figure S1 | Changes of alanine aminotransferase levels from baseline to 28 weeks.
Figure S2 | Changes in bodyweight and glycated hemoglobin levels from baseline to 28 weeks.
Figure S3 | Changes in the (a) visceral fat area and (b) serum adiponectin levels in each group.
Table S1 | Prevalence of diabetes‐related complications, proportion of hypertension, dyslipidemia, hyperuricemia, smoking habit and familial history of diabetes mellitus.
Table S2 | Proportion of participants with adverse events during the study.
Table S3 | Association between change of the liver‐to‐spleen ratio and various clinical parameters in (a) univariate and (b) multivariate analyses.
Acknowledgments
We express our sincere gratitude to the participants of this study. This study was supported in part by a Research Project Grant 29G‐002 from Kawasaki Medical School.
J Diabetes Investig. 2020
Clinical Trial Registry
University Hospital Medical Information Network
UMIN 000021291
References
- 1. Italian Association for the Study of the Liver (AISF) . AISF position paper on nonalcoholic fatty liver disease (NAFLD): updates and future directions. Dig Liver Dis 2017; 49: 471–483. [DOI] [PubMed] [Google Scholar]
- 2. Ballestri S, Zona S, Targher G, et al Nonalcoholic fatty liver disease is associated with an almost twofold increased risk of incident type 2 diabetes and metabolic syndrome. Evidence from a systematic review and meta‐analysis. J Gastroenterol Hepatol 2016; 31: 936–944. [DOI] [PubMed] [Google Scholar]
- 3. Lonardo A, Nascimbeni F, Maurantonio M, et al Nonalcoholic fatty liver disease: evolving paradigms. World J Gastroenterol 2017; 23: 6571–6592. [DOI] [PMC free article] [PubMed] [Google Scholar]
- 4. Ballestri S, Nascimbeni F, Romagnoli D, et al The role of nuclear receptors in the pathophysiology, natural course, and drug treatment of NAFLD in humans. Adv Ther 2016; 33: 291–319. [DOI] [PubMed] [Google Scholar]
- 5. Rinella ME. Nonalcoholic fatty liver disease: a systematic review. JAMA 2015; 313: 2263–2273. [DOI] [PubMed] [Google Scholar]
- 6. Bril F, Cusi K. Management of nonalcoholic fatty liver disease in patients with type 2 diabetes: a call to action. Diabetes Care 2017; 40: 419–430. [DOI] [PubMed] [Google Scholar]
- 7. Jimba S, Nakagami T, Takahashi M, et al Prevalence of non‐alcoholic fatty liver disease and its association with impaired glucose metabolism in Japanese adults. Diabet Med 2005; 22: 1141–1145. [DOI] [PubMed] [Google Scholar]
- 8. Wanless IR, Lentz JS. Fatty liver hepatitis (steatohepatitis) and obesity: an autopsy study with analysis of risk factors. Hepatology 1990; 12: 1106–1110. [DOI] [PubMed] [Google Scholar]
- 9. El‐Serag HB, Tran T, Everhart JE. Diabetes increases the risk of chronic liver disease and hepatocellular carcinoma. Gastroenterology 2004; 126: 460–468. [DOI] [PubMed] [Google Scholar]
- 10. Cusi K. Treatment of patients with type 2 diabetes and non‐alcoholic fatty liver disease: current approaches and future directions. Diabetologia 2016; 59: 1112–1120. [DOI] [PMC free article] [PubMed] [Google Scholar]
- 11. Portillo‐Sanchez P, Cusi K. Treatment of nonalcoholic fatty liver disease (NAFLD) in patients with type 2 diabetes mellitus. Clin Diabetes Endocrinol 2016; 2: 9. [DOI] [PMC free article] [PubMed] [Google Scholar]
- 12. Sumida Y, Seko Y, Yoneda M. Novel antidiabetic medications for non‐alcoholic fatty liver disease with type 2 diabetes mellitus. Hepatol Res 2017; 47: 266–280. [DOI] [PubMed] [Google Scholar]
- 13. Kanai Y, Lee WS, You G, et al The human kidney low affinity Na+/glucose cotransporter SGLT2. Delineation of the major renal reabsorptive mechanism for D‐glucose. J Clin Invest 1994; 93: 397–404. [DOI] [PMC free article] [PubMed] [Google Scholar]
- 14. Zinman B, Wanner C, Lachin JM, et al Empagliflozin, cardiovascular outcomes, and mortality in type 2 diabetes. N Engl J Med 2015; 373: 2117–2128. [DOI] [PubMed] [Google Scholar]
- 15. Neal B, Perkovic V, Mahaffey KW, et al Canagliflozin and cardiovascular and renal events in type 2 diabetes. N Engl J Med 2017; 377: 644–657. [DOI] [PubMed] [Google Scholar]
- 16. Pinto LC, Rados DV, Remonti LR, et al Efficacy of SGLT2 inhibitors in glycemic control, weight loss and blood pressure reduction: a systematic review and meta‐analysis. Diabetol Metab Syndr 2015; 7(Suppl 1): A58. [Google Scholar]
- 17. Hayashizaki‐Someya Y, Kurosaki E, Takasu T, et al Ipragliflozin, an SGLT2 inhibitor, exhibits a prophylactic effect on hepatic steatosis and fibrosis induced by choline‐deficient l‐amino acid‐defined diet in rats. Eur J Pharmacol 2015; 754: 19–24. [DOI] [PubMed] [Google Scholar]
- 18. Angulo P, Hui JM, Marchesini G, et al The NAFLD fibrosis score: a noninvasive system that identifies liver fibrosis in patients with NAFLD. Hepatology 2007; 45: 846–854. [DOI] [PubMed] [Google Scholar]
- 19. Sumida Y, Yoneda M, Hyogo H, et al Validation of the FIB4 index in a Japanese nonalcoholic fatty liver disease population. BMC Gastroenterol 2012; 12: 2. [DOI] [PMC free article] [PubMed] [Google Scholar]
- 20. Sumida Y, Yoneda M, Hyogo H, et al A simple clinical scoring system using ferritin, fasting insulin, and type IV collagen 7S for predicting steatohepatitis in nonalcoholic fatty liver disease. J Gastroenterol 2011; 46: 257–268. [DOI] [PubMed] [Google Scholar]
- 21. Cohen J. Statistical Power Analysis for the Behavioral Sciences (2nd ed). Hillsdale, NJ: Lawrence Erlbaum, 1988: 274–288. [Google Scholar]
- 22. Cohen J. A power primer. Psychol Bull. 1992; 112: 155–159. [DOI] [PubMed] [Google Scholar]
- 23. Mizumoto A, Takeuchi O. Basics and considerations for reporting effect sizes in research papers. Eng Educ Res 2008; 31: 57–66. [Google Scholar]
- 24. Kodama N, Tahara N, Tahara A, et al Effects of pioglitazone on visceral fat metabolic activity in impaired glucose tolerance or type 2 diabetes mellitus. J Clin Endocrinol Metab 2013; 98: 4438–4445. [DOI] [PubMed] [Google Scholar]
- 25. Ishtiaq SM, Rashid H, Hussain Z, et al Adiponectin and PPAR: a setup for intricate crosstalk between obesity and non‐alcoholic fatty liver disease. Rev Endocr Metab Disord 2019; 20: 253‐261. [DOI] [PubMed] [Google Scholar]
- 26. Ito D, Shimizu S, Inoue K, et al Comparison of Ipragliflozin and pioglitazone effects on nonalcoholic fatty liver disease in patients with type 2 diabetes: a randomized, 24‐week, open‐label. Active‐controlled trial. Diabetes Care 2017; 40: 1364–1372. [DOI] [PubMed] [Google Scholar]
- 27. Cariou B, Charbonnel B, Staels B. Thiazolidinediones and PPARγ agonists: time for a reassessment. Trends Endocrinol Metab 2012; 23: 205–215. [DOI] [PubMed] [Google Scholar]
- 28. Feng WH, Bi Y, Li P, et al Effects of liraglutide, metformin and gliclazide on body composition in patients with both type 2 diabetes and non‐alcoholic fatty liver disease: A randomized trial. J Diabetes Investig 2019; 10: 399–407. [DOI] [PMC free article] [PubMed] [Google Scholar]
- 29. Musso G, Cassader M, Rosina F, et al Impact of current treatments on liver disease, glucose metabolism and cardiovascular risk in non‐alcoholic fatty liver disease (NAFLD): a systematic review and meta‐analysis of randomised trials. Diabetologia 2012; 55: 885–904. [DOI] [PubMed] [Google Scholar]
- 30. Yoneda M, Mawatari H, Fujita K, et al Type IV collagen 7s domain is an independent clinical marker of the severity of fibrosis in patients with nonalcoholic steatohepatitis before the cirrhotic stage. J Gastroenterol 2007; 42: 375–381. [DOI] [PubMed] [Google Scholar]
- 31. Mahady SE, Webster AC, Walker S, et al The role of thiazolidinediones in non‐alcoholic steatohepatitis – a systematic review and meta analysis. J Hepatol 2011; 55: 1383–1390. [DOI] [PubMed] [Google Scholar]
- 32. Honda Y, Imajo K, Kato T, et al The selective SGLT2 inhibitor ipragliflozin has a therapeutic effect on nonalcoholic steatohepatitis in mice. PLoS ONE 2016; 11: e0146337. [DOI] [PMC free article] [PubMed] [Google Scholar]
- 33. Inoue M, Hayashi A, Taguchi T, et al Effects of canagliflozin on body composition and hepatic fat content in type 2 diabetes patients with non‐alcoholic fatty liver disease. J Diabetes Investig 2019; 10: 1004–1011. [DOI] [PMC free article] [PubMed] [Google Scholar]
- 34. Seko Y, Nishikawa T, Umemura A, et al Efficacy and safety of canagliflozin in type 2 diabetes mellitus patients with biopsy‐proven nonalcoholic steatohepatitis classified as stage 1–3 fibrosis. Diabetes Metab Syndr Obes 2017; 11: 835–843. [DOI] [PMC free article] [PubMed] [Google Scholar]
- 35. Shimizu M, Suzuki K, Kato K, et al Evaluation of the effects of dapagliflozin, a sodium‐glucose co‐transporter‐2 inhibitor, on hepatic steatosis and fibrosis using transient elastography in patients with type 2 diabetes and non‐alcoholic fatty liver disease. Diabetes Obes Metab 2019; 21: 285–292. [DOI] [PubMed] [Google Scholar]
- 36. Lai LL, Vethakkan SR, Nik Mustapha NR, et al Empagliflozin for the treatment of nonalcoholic steatohepatitis in patients with type 2 diabetes mellitus. Dig Dis Sci 2020; 65: 623–631. [DOI] [PubMed] [Google Scholar]
Associated Data
This section collects any data citations, data availability statements, or supplementary materials included in this article.
Supplementary Materials
Figure S1 | Changes of alanine aminotransferase levels from baseline to 28 weeks.
Figure S2 | Changes in bodyweight and glycated hemoglobin levels from baseline to 28 weeks.
Figure S3 | Changes in the (a) visceral fat area and (b) serum adiponectin levels in each group.
Table S1 | Prevalence of diabetes‐related complications, proportion of hypertension, dyslipidemia, hyperuricemia, smoking habit and familial history of diabetes mellitus.
Table S2 | Proportion of participants with adverse events during the study.
Table S3 | Association between change of the liver‐to‐spleen ratio and various clinical parameters in (a) univariate and (b) multivariate analyses.