

Abstract
Aims/Introduction
To establish novel therapies to combat diabetic kidney disease, a human disease‐relevant animal model is essential. However, a type 2 diabetic mouse model presenting progressive kidney fibrosis has not yet been established. Kidneys of streptozotocin‐induced diabetic CD‐1 mice showed severe fibrosis compared with other backgrounds of mice associated with the suppression of antifibrotic peptide N‐acetyl‐seryl‐aspartyl‐lysyl‐proline. The BKS background (BKSdb / db) is often utilized for diabetic kidney disease research; the kidney fibrosis in the BKSdb / db phenotype is minimal.
Materials and Methods
We generated CD‐1db / db mice by backcrossing the db gene into the CD‐1 background, and analyzed phenotypic differences compared with BKSdb / db and CD‐1db / m mice.
Results
Male CD‐1db / db mice appeared to have elevated blood glucose levels compared with those of BKSdb / db mice. Fasting insulin levels declined in CD‐1db / db mice. Plasma cystatin C levels tended to be elevated in CD‐1db / db mice from 16 to 24 weeks‐of‐age. Male CD‐1db / db mice showed significantly progressive kidney and heart fibrosis from 16 to 24 weeks‐of‐age when compared with that of age‐matched BKSdb / db mice. The gene expression profile showed fibrogenic program‐associated genes in male CD‐1db / db mice. Male CD‐1db / db mice displayed significantly lower urine antifibrotic peptide N‐acetyl‐seryl‐aspartyl‐lysyl‐proline when compared to that of BKSdb / db at 24 weeks‐of‐age. The gene expression of prolyl oligopeptidase, the enzyme essential for antifibrotic peptide N‐acetyl‐seryl‐aspartyl‐lysyl‐proline production from thymosin β4, was significantly lower in the CD‐1 mice. Thymosin β4 levels were also lower in CD‐1 mice.
Conclusions
These results suggest that CD‐1db / db mice are a novel type 2 diabetic mouse model with progressive kidney and heart fibrosis.
Keywords: Diabetic kidney disease, Fibrosis, N‐acetyl‐seryl‐aspartyl‐lysyl‐proline
To establish therapies for diabetic kidney disease, a human disease‐relevant animal model is essential. A type 2 diabetic mouse model presenting progressive kidney fibrosis has not yet been established. In this study, we generated CD‐1db / db mice, which are a novel type 2 diabetic mouse model with a progressive phenotype of diabetic kidney disease including kidney fibrosis.
Introduction
Diabetic kidney disease (DKD) is the leading cause of kidney disease that develops into end‐stage kidney disease worldwide 1 . The critical problems in DKD are not limited to kidney health; indeed, it is well known that the cardiovascular event risk appears to be higher in patients with DKD in a linear fashion 2 . Especially with the rapid increase in type 2 diabetes, DKD in patients with type 2 diabetes has become a serious public health threat around the world 3 .
To understand the pathogenesis and to establish novel therapy to combat DKD, a human disease‐relevant animal model is essential 4 . There are many reports that some drugs or molecules ameliorate renal injury in mouse diabetic models, but few have been applied to human DKD so far. A possible reason might be that the mouse model used for a long time is not a phenocopy to human DKD, and in particular does not cause progressive fibrosis and renal dysfunction. In general, the type 2 diabetic mouse model showed minor kidney phenotypes as compared with the kidney phenotype in human progressive DKD 4 . Kidney fibrosis is the final common pathway of any kind of progressive kidney disease, including DKD; a type 2 diabetic mouse model presenting progressive kidney fibrosis has not yet been established. Therefore, to establish a new model of DKD that causes renal dysfunction with fibrosis and searching for a molecule that can suppress it should contribute to developing a novel treatment that can be applied to human DKD more than ever. Sugimoto et al. 5 elegantly showed that on the induction of diabetes with streptozotocin (STZ), the CD‐1 strain of mice showed much stronger kidney fibrosis compared with that of either 129SV or C57BL6 mice. However, whether such a fibrotic phenotype in CD‐1 mice was also relevant to type 2 diabetic mice has not yet been established. With regard to this, spontaneous mutation in the leptin receptor gene in the CD‐1 mouse strain has been reported to be associated with early death compared with other strains with high susceptibility to insulin defects 6 ; however, no organ damage or dysfunction, including kidney phenotypes, was elucidated.
N‐acetyl‐seryl‐aspartyl‐lysyl‐proline (AcSDKP), an endogenous antifibrotic tetrapeptide, is enzymatically cleaved by prolyl oligopeptidase from the N‐terminal sequence of thymosin β4 (Tβ4) and eliminated by angiotensin‐converting enzyme 7 , 8 , 9 , 10 . The present authors and others have reported that AcSDKP suppresses renal fibrosis by inhibiting the transforming growth factor‐β/Smad signaling pathway 11 . Compared with non‐diabetic mice, STZ‐induced CD‐1 diabetic mice showed suppressed levels of AcSDKP; non‐fibrotic diabetic SV129 mice did not 12 . Diabetic db/db mice with a BKS background (BKSdb / db) showed suppressed levels of AcSDKP compared with that of BKSdb / m 13 . Furthermore, we recently reported that in patients with normoalbuminuria and type 2 diabetes with estimated glomerular filtration rate ≥30 mL/min/1.73 m2, urine and plasma AcSDKP levels predict future preservation of estimated glomerular filtration rate alterations 14 . These data showed that AcSDKP suppression in the CD‐1 strain could be relevant to fibrosis in a type 2 diabetic mouse model.
In this study, we aimed to establish a mouse model of DKD with strong fibrosis. We found that db/db mice in the CD‐1 strain of mice (CD‐1db / db) had progressively stronger fibrosis compared with BKSdb/db mice when evaluating their AcSDKP metabolism.
Methods
Animal experiments
The animal experiments were approved by the institutional animal care and use committee of Kanazawa Medical University (protocol number: 2017‐75 and 2017‐78). BKSdb / m mice (obtained from the Jackson Laboratory, Bar Harbor, ME, USA) were backcrossed into CD‐1 mice (obtained from Charles River Laboratories Japan Inc., Yokomama, Japan) for 12 generations, and we analyzed 8–11th backcrossed mice for evaluation. For the strain comparison analysis, we evaluated BKSdb / db (BKS. Cg‐Dock7m +/+Leprdb/J obtained from the Jackson Laboratory), CD‐1db / m and CD‐1db / db. Mice were killed at 16 and 24 weeks‐of‐age. Before killing the mice, food and water intake, bodyweight, blood glucose level, fasting plasma insulin concentration, plasma cystatin C level, urine albumin‐to‐creatinine ratio, and blood pressure were analyzed. Blood pressure was measured using the tail‐cuff method with a BP‐98A instrument (Softron Co., Beijing, China) within 1 week before death.
Mouse genotyping
Deoxyribonucleic acid (DNA) from mice was extracted from the tail through hydrochloric acid. The db gene could be positively identified in genomic DNA by amplification with a pair of primers: forward: 5′‐AGA ACG GAC ACT CTT TGA AGT CTC‐3′ and reverse: 5′‐CAT TCA AAC CAT AGT TTA GGT TTG TGT‐3′. Amplification was carried out with a hot‐start polymerase chain reaction (PCR; 1 × AB PCR Buffer Ⅱ, in mmol/L: 2 MgCl2, 0.2 dNTPs, 1 μL genomic DNA and 1 μmol/L of each primer) with 0.6 U Taq DNA polymerase and 35 cycles (95, 58 and 72°C sequentially at 15 s for each plateau). After amplification, the PCR product was digested with Afa I. The digested PCR product was size fractionated on an agarose gel (3% agarose with 50–800 bp agarose) and visualized by ultraviolet illumination after staining with ethidium bromide. The wild type (CD‐1) produced a 135‐bp fragment that was not cut by restriction enzymes. The homozygote (CD‐1db / db) produced two fragments of 108 and 27 bp, whereas the heterozygote (CD‐1db / m) yielded three fragments of 27, 108 and 135 bp. Male mice had an unknown artifact band of 170 bp in small yield (Figure S1).
Measurement of fasting plasma insulin concentrations
Mice were fasted for 16 h, and blood samples were collected for fasting plasma insulin measurement. Insulin concentrations were measured using an ultrasensitive mouse insulin enzyme‐linked immunosorbent assay (ELISA) kit (Morinaga Institute of Biological Science, Inc., Yokohama city, Japan).
Measurement of plasma cystatin C levels
Plasma cystatin C levels were estimated using an ELISA kit (Mouse/Rat Cystatin C Quantikine ELISA Kit; R&D Systems, Minneapolis, MN, USA).
Measurement of the urine albumin‐to‐creatinine ratio
The murine‐specific urinary albumin level was measured using a murine microalbuminuria ELISA kit (Albuwell M Test kit; Exocell, Inc., Philadelphia, PA, USA; Cosmo Bio Co., Ltd, Tokyo, Japan). The urinary creatinine levels were measured using a QuantiChromTM Creatinine Assay Kit (BioAssay System, Hayward, CA, USA). We used SoftMax pro 6.4 (Molecular Devices, LLC., San Jose, CA, USA) to analyze the urinary albumin and creatinine levels.
Histopathological evaluation
The organs were fixed in 10% formaldehyde and embedded in paraffin. For Masson’s trichrome staining and picrosirius red (SR) staining, all tissues were cut into 5‐μm thick sections. SR staining was carried out using a Picrosirius Red Stain Kit (Cosmo Bio Co., Ltd; Philadelphia, PA, USA). SR‐stained ×200 visual areas (eight areas for kidney and heart, and five areas for liver) from each mouse were analyzed to calculate the fibrotic area using ImageJ software (NIH, Bethesda, MD, USA).
AcSDKP measurements
Blood samples were obtained in heparinized tubes containing captopril (final concentration 10 μmol/L) and centrifuged at 3,000 g for 15 min at 4°C. The plasma was kept in a −80°C freezer until the following assays were carried out. Plasma and urine AcSDKP concentrations were estimated using a competitive enzyme immunoassay kit (SPI‐BIO, Massy, France) according to the manufacturer’s instructions.
Microarray analysis
For microarray analysis, complementary ribonucleic acids were prepared and applied to a Mouse Gene ST 2.0 microarray (Affymetrix, High Wycombe, UK) according to the manufacturer’s instructions. Genes that were upregulated or downregulated were extracted using the GeneSpring GX software package version 14.9.1 (Agilent Technologies, Santa Clara, CA, USA). Ingenuity Pathway Analysis (Ingenuity Systems Inc., Redwood City, CA, USA) was used to evaluate the gene network.
Western blot analysis
Protein lysates were denatured in a sodium dodecyl sulfate sample buffer at 100°C for 5 min. After centrifugation (15,000 g for 10 min at 4°C), the proteins in the supernatants were separated on sodium dodecyl sulfate‐polyacrylamide gels and blotted onto polyvinylidene difluoride membranes (Pall Corporation, Pensacola, FL, USA) using the semidry method. The immunoreactive bands were developed using an enhanced chemiluminescence detection system (Pierce Biotechnology, Rockford, IL, USA) and detected using an ImageQuant LAS 400 digital biomolecular imaging system (GE Healthcare Life Sciences, Uppsala, Sweden).
Statistical analysis
The data are expressed as the mean ± standard deviation values. A one‐way anova followed by Tukey’s test was used to determine the significance of the differences. Statistical significance was defined as P < 0.05. GraphPad Prism 8 (GraphPad, La Jolla, CA, USA) was used for statistical analyses.
Results
Characteristics of mice
First, we evaluated the characteristics of experimental animals. As compared with control male CD‐1db / m mice, male CD‐1db / db mice showed higher blood glucose levels, ate nearly double the amount of food and drank fourfold more water until 24 weeks‐of‐age (Figure 1a,b,d). Male CD‐1db / db mice were heavier compared with control male CD‐1db / m mice at 12 weeks‐of‐age; after then, the bodyweight of CD‐1db / db mice fluctuated and tended to be reduced, and at 16 weeks‐of‐age, we could not find any difference between CD‐1db / db and CD‐1db / m mice (Figure 1c). As compared with the strain difference between CD‐1 and BKS, similarly, male CD‐1db / db mice showed higher blood glucose levels, drank more water and ate more food (Figure 1a,b,d). The bodyweight of CD1db / db mice was heavier than that of BKSdb / db until 16 weeks‐of‐age; at 24 weeks‐of‐age, bodyweight did not differ between these two strains (Figure 1c). Kidney weight per bodyweight was heavier in CD‐1db / db when compared with that of either CD‐1db / m or BKSdb / db mice (Figure 1e). Heart weight per bodyweight showed no differences between male CD1db / db and BKSdb / db mice, but it tended to be heavier when compared with that of BKSdb / db mice (Figure 1f). We also evaluated the fasting plasma insulin levels. CD‐1db / db mice showed a significant decline, whereas BKSdb / db showed a significant increase from 16 to 24 weeks‐of‐age (Figure 1g). Both systolic and diastolic blood pressure were similar in CD‐1db / m and CD‐1db / db mice (Figure 1h,i). When analyzing the female mice, the characteristics were similar to the differences found in the males, even though the bodyweight of female CD‐1db / db mice was consistently heavier than that of either CD‐1db / m or BKSdb / db mice (Figure S2).
Figure 1.
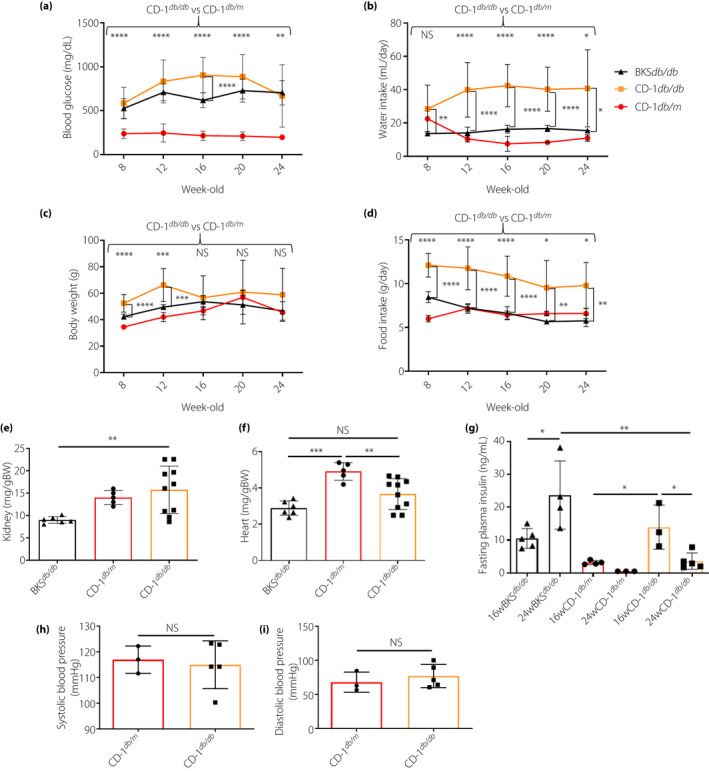
Characteristics of experimental animals. (a) Casual blood glucose levels were measured every 4 weeks from 8 weeks‐of‐age, n = 5–12. (b) Water intake was measured every 4 weeks from 8 weeks‐of‐age as the average of 2 days’ intake, n = 5–15. (c) Bodyweight through 24 weeks‐of‐age, n = 5–19. (d) Food intake was measured the same way as water intake, n = 5–14. (e–f) Kidney and heart weights relative to bodyweight (BW) at 24 weeks‐of‐age. BKSdb / db, n = 6; CD‐1db / m, n = 5; and CD‐1db / db, n = 10. (g) Fasting plasma insulin levels were measured after 16‐h overnight fasting, n = 3–5 in each group at each week‐of‐age. (h–i) Blood pressure was measured within 1 week before euthanasia. CD‐1db/m, n = 3; and CD‐1db/db, n = 5. *P < 0.05, **P < 0.01, ***P < 0.001, ****P < 0.0001. NS, not significant.
Renal function
Unexpectedly, at 16 weeks, CD‐1db / db mice showed suppressed plasma cystatin C levels compared with those of CD‐1db / m mice, and no difference was observed with BKSdb / db mice (Figure 2a). In CD‐1db / db mice, plasma cystatin C levels were elevated from 16 to 24 weeks; such trends were not found in other mice (Figure 2a). The urine albumin‐to‐creatinine ratio was remarkably higher in the CD‐1db / db mice than that in the CD‐1db / m or BKSdb / db mice at both 16 and 24 weeks‐of‐age (Figure 2b).
Figure 2.
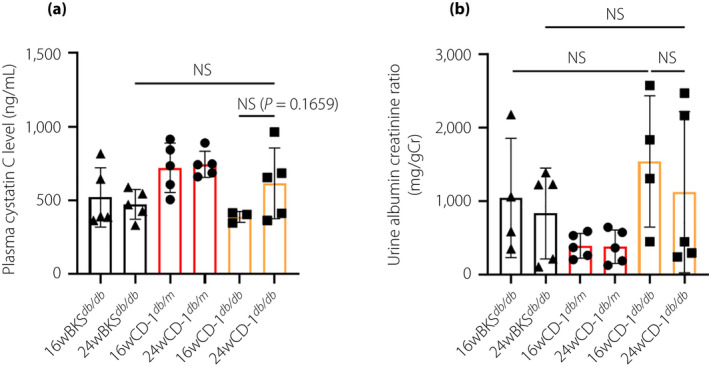
Renal function of experimental animals. (a) Plasma cystatin C levels. BKSdb / db, n = 5; CD‐1db / m, n = 5; and CD‐1db / db, n = 3 at 16 weeks‐of‐age; and BKSdb/db, n = 5; CD‐1db / m, n = 5; and CD‐1db / db, n = 5 at 24 weeks‐of‐age. (b) Urine albumin creatinine ratio. BKSdb / db, n = 4. CD‐1db / m, n = 5; and CD‐1db / db, n = 4 at 16 weeks‐of‐age; and BKSdb / db, n = 5; CD‐1db / m, n = 5; and CD‐1db / db, n = 5 at 24 weeks‐of‐age. NS, not significant.
Prominent fibrosis in kidney and heart of CD‐1db / db mice
Masson trichrome staining and SR staining revealed that CD‐1db / db mice showed prominent accumulation of extracellular matrix in tubulointerstitial spaces and also in the glomerulus compared with that of CD‐1db / m or BKSdb / db (Figure 3a–c,e–g). Additionally, glomerular hypertrophy was prominent in CD‐1db / db mice compared with that of CD‐1db / m or BKSdb / db mice (Figure 3d,h). CD‐1db / db mice showed significant fibrosis in the heart, as well as prominent perivascular fibrosis; such fibrotic areas were not found in other groups (Figure 4a–d). Supporting this, western blot analysis in the kidney demonstrated that male CD‐1db / db mice showed increased levels of α‐smooth muscle actin compared with levels in either male CD‐1db / m or BKSdb / db mice (Figure S3). Female CD‐1db / db mice showed a similar, but weaker, phenotype of organ fibrosis (Figure S4).
Figure 3.
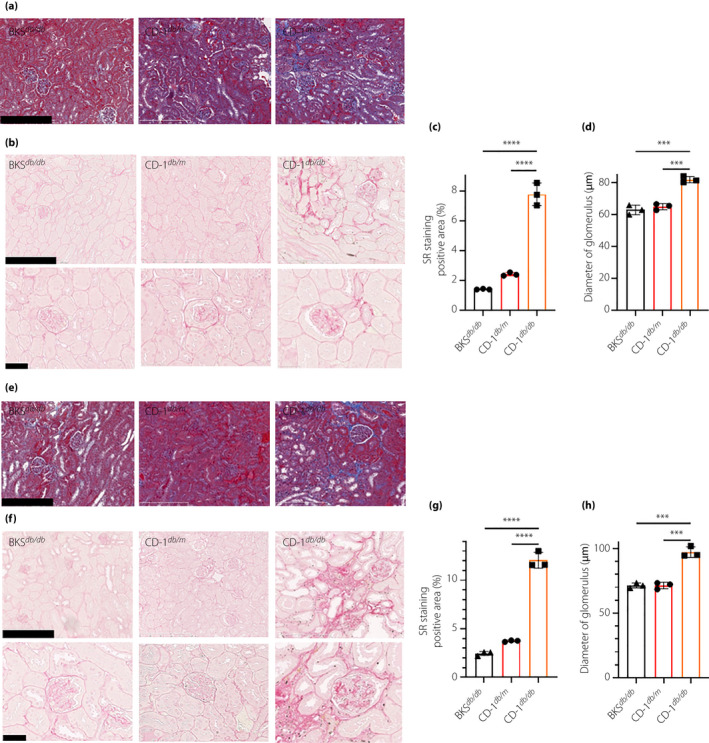
CD‐1db / db showed prominent progressive kidney fibrosis when compared with BKSdb / db. Experimental mice at (a–d) 16 and (e–h) 24 weeks‐of‐age. (a,e) Masson trichrome staining for kidney. Scale bar, 250 µm. (b,f) Sirius red (SR) staining for kidney. Scale bar, upper panel was 250 µm and lower panel was 50 µm. Quantification of SR positive area at (c) 16 weeks‐of‐age and (g) 24 weeks‐of‐age. Diameter of glomerulus at (d) 16 weeks‐of‐age and (h) 24 weeks‐of‐age. ***P < 0.001, ****P < 0.0001.
Figure 4.
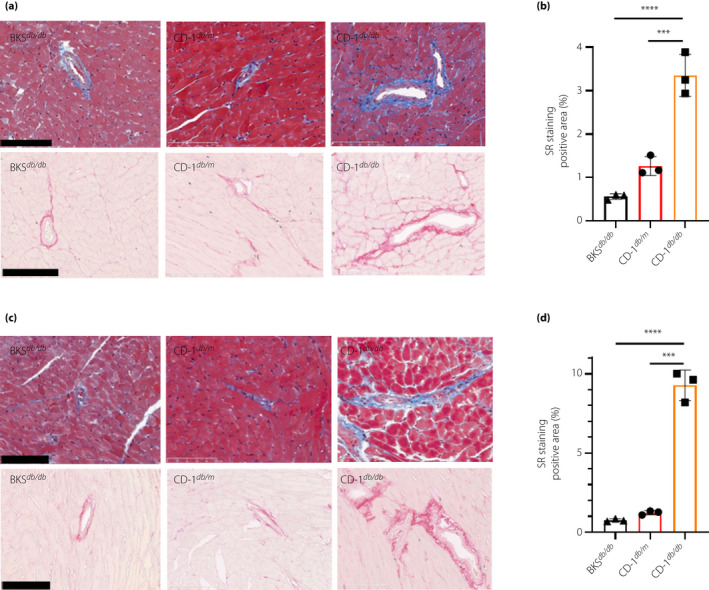
CD‐1db / db showed prominent progressive heart fibrosis when compared with BKSdb / db. (a,c) Masson trichrome staining (upper panels) and sirius red (SR) staining (lower panels) for myocardial tissue of experimental mice at (a) 16 weeks‐of‐age and (b) 24 weeks‐of‐age. Scale bar, 100 µm. SR staining positive area at (b) 16 weeks‐of‐age and (d) 24 weeks‐of‐age. ***P < 0.001, ****P < 0.0001.
Gene expression profile showed fibrogenic program‐associated genes in CD‐1db / db mice
We carried out pathway analysis for altered genes in CD‐1db / db mice compared with those of BKSdb / db by messenger ribonucleic acid array analysis using the kidneys of 16‐week‐old mice. As a result, we found that the fibrosis and epithelial–mesenchymal transition program pathways were induced in CD‐1db / db mice, which suggested a potential role for fibronectin by network analysis (Figure 5a,b). Subsequently, by evaluating fibrogenic gene expression, we found that CD‐1db / db mice showed significantly increased levels of fibronectin 1, angiopoietin‐like 4 and connective tissue growth factor compared with levels in BKSdb / db (Figure 5c). The heatmaps of associated genes in fibrosis and epithelial–mesenchymal transition pathways showed enhanced gene expression of fibronectin 1 and so on in CD‐1db / db compared with BKSdb / db (Figure S5). We have reported that the induction of integrin β1 and dipeptidyl peptidase (DPP)‐4 was associated with fibrotic programming and transforming growth factor‐β signaling in STZ‐induced diabetic mice 15 , 16 . However, the gene expression levels of both integrin β1 and transforming growth factor‐β1 were insignificantly elevated in CD‐1db / db mice compared with BKSdb / db mice (Figure 5c). Additionally, for DPP‐4 gene expression, BKSdb / db mice showed a significantly higher level of DPP‐4 compared with that of CD‐1db / db (Figure 5c). Therefore, the DPP‐4 gene level did not correlate with the fibrotic phenotypic difference between CD‐1db / db and BKSdb / db mice.
Figure 5.
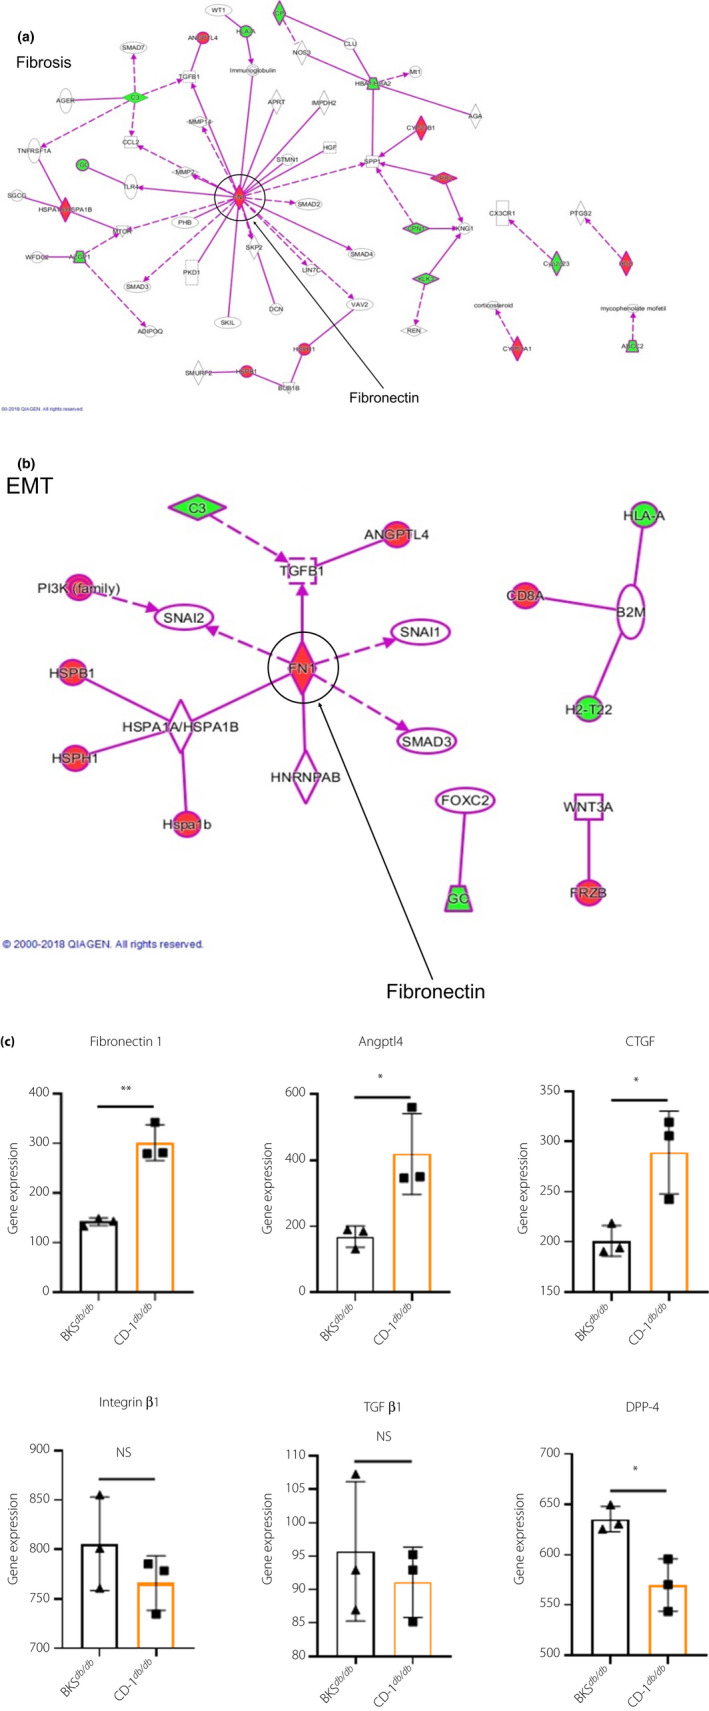
Messenger ribonucleic acid array analysis for 16‐week‐old male kidney revealed gene expression profile showing fibrogenic program‐associated genes in CD‐1db / db. (a,b) The fibrosis and epithelial–mesenchymal transition (EMT) pathways induced in CD‐1db / db, which suggested the potential role of fibronectin. (c) Each fibrogenic gene expression of BKSdb / db and CD‐1db / db; n = 3 in each group. *P < 0.05, **P < 0.01. Angptl4, angiopoietin‐like 4; CTGF, connective tissue growth factor; DPP‐4, dipeptidyl peptidase‐4; NS, not significant; TGF‐β1, transforming growth factor‐β1.
AcSDKP level was lower in the urine of CD‐1db / db mice when compared with BKSdb / db mice
The present authors have reported that lower plasma and/or urine levels of AcSDKP were associated with glomerulosclerosis and/or tubulointerstitial fibrosis in mice, and progressive kidney function decline in patients with diabetes 14 , 17 . Plasma levels of AcSDKP in male CD‐1db / db mice trended to be lower compared with male BKSdb / db mice (Figure 6a). The urine level of AcSDKP is similar to plasma and was significantly depleted in male CD‐1db / db mice (Figure 6b). Microarray analysis showed that compared with BKSdb / db, thymosin β4 levels were also lower in CD‐1db / db mice; expression of prolyl oligopeptidase, the enzyme essential for AcSDKP production from thymosin β4, was significantly lower in the CD‐1db / db mice (Figure 6c–e). Gene expression of angiotensin‐converting enzyme, an AcSDKP‐degrading enzyme, tended to be higher in CD‐1db / db mice, with an insignificant difference compared with expression in BKSdb/db mice (Figure 6f).
Figure 6.
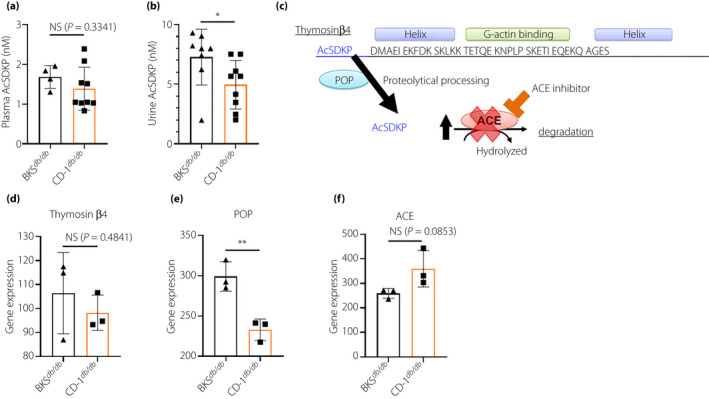
Lower urine N‐acetyl‐seryl‐aspartyl‐lysyl‐proline (AcSDKP) level and some possibility in lower production of AcSDKP compared with BKSdb / db in male CD‐1db / db mice. (a) Plasma AcSDKP levels at 24 weeks‐of‐age. (b) Urine AcSDKP levels at 24 weeks‐of‐age. (a–b) BKSdb / db, n = 4; and CD‐1db / db, n = 9. (c) Scheme of the synthesis and metabolism of AcSKDP: thymosin β4, a G‐actin binding peptide, is cleaved by prolyl oligopeptidase (POP), and subsequently, AcSDKP is synthesized. AcSDKP is hydrolyzed and degraded by angiotensin‐converting enzyme (ACE). (d) Gene expression of AcSDKP precursor polypeptide thymosin β4. (e) Gene expression of AcSDKP generating enzyme POP. (f) Gene expression of ACE. (d–f) Messenger ribonucleic acid array analysis for 16‐week‐old male kidneys, n = 3 in each group. *P < 0.05, **P < 0.01. NS, not significant.
Discussion
In the present study, we showed that db/db mice of the CD‐1 strain displayed prominent fibrosis compared with BKSdb / db mice, a type 2 diabetic mouse model often utilized in diabetic complication research. Essentially, we found that CD‐1db / db mice showed: (i) higher blood glucose, heavier bodyweight, and more food and water consumption; (ii) a progressive decline in insulin levels; (iii) prominent fibrosis in the kidney and a progressive declining trend in kidney function; (iv) higher expression of kidney fibrotic genes; and (v) low levels of AcSDKP with suppression of genes important for AcSDKP production. The progressive decline in insulin levels was consistent with the previous report that spontaneous mutation in the db gene into CD‐1 background resulted in decreased insulin production 6 . The authors considered that this phenotype could be due to islet degeneration 6 , and is also relevant to human type 2 diabetes patients. CD‐1 mouse strain is often used in research of fibrosis and aging; for example, CD‐1 mice showed severer age‐related changes compared with other strains, such as C57BL/6J or CBA/CaJ 18 . The present results showed that CD‐1db / m mice were also heavy, as well as CD‐1db / db mice from 16 weeks‐of‐age, and insulin levels were decreased in both db/m and db/db CD‐1 mice. These findings suggested that CD‐1 mice were susceptible to insulin secretory defect. Furthermore, low levels of the antifibrotic peptide, AcSDKP, had been shown to be associated with kidney fibrosis in mice 17 and a progressive decline in estimated glomerular filtration rate in patients with diabetes 14 . Therefore, CD‐1db / db mice could be a human disease‐relevant type 2 diabetic mouse model with organ fibrosis.
Appropriate animal models are essential for understanding the pathological molecular mechanisms or carrying out experimental therapy. For the diabetic kidney disease model, the presence of progressive fibrosis, the common final pathological feature, is essential. However, BKSdb / db mice often show some glomerular phenotypes relevant to human DKD, but interstitial fibrosis is minimal. Other rodent models that show progressive kidney diseases, such as the Zucker diabetic fatty rat 19 , Wistar fatty rat 19 or Spontaneously Diabetic Torii fatty rat 20 , are indeed expensive; therefore, these models could be inappropriate for experimental therapy or drug screening. Therefore, we focused on the fibrogenic phenotypic difference between strains of mice, especially extensive fibrosis, in CD‐1 mice compared with other strains of mice exposed to diabetes with STZ 5 , 12 . These reports showed that CD‐1 mice are prone to fibrosis in diabetic conditions; utilizing STZ for the induction of diabetes is often criticized for the toxicity of STZ on the kidney phenotype. Our current report clearly demonstrated that the CD‐1 mouse strain showed progressive kidney damage under the condition of diabetes, and suggested that CD‐1 mice displayed some genetic or epigenetic factors that could be relevant for the induction of progressive kidney damage and fibrosis. Meanwhile, because CD‐1db / db mice developed few characteristic lesions in diabetic nephropathy, such as nodular lesions and mesangiolysis, we need to modify this mouse model to show glomerular lesions without genetic modification. It is necessary to analyze this model in regard to the metabolisms of advanced glycation end‐products or nitric oxide synthase, which are associated with glomerular lesions. Although in the majority of our analyses we utilized male animals, female CD‐1db / db mice showed a similar, but lighter, fibrotic phenotype. Future studies to identify genetic loci by genome‐wide association study or epigenetic analysis could show the responsible molecular mechanisms of the fibrotic phenotype in CD‐1db / db mice.
Although the present analysis showed that plasma AcSDKP levels were insignificantly suppressed in the CD‐1db / db mice compared with the levels of other groups of mice, urine levels of AcSDKP were significantly suppressed in the CD‐1db / db mice compared with levels in the BKSdb / db mice. AcSDKP has been confirmed to have antifibrotic peptide and organ protective potential in various fibrotic models in preclinical studies 21 , 22 , 23 , 24 , 25 , 26 , 27 . Additionally, a human study showed that such organ protective bioactivity might be relevant for human diseases, including type 2 diabetes 14 , 28 , 29 . Interestingly, prolyl oligopeptidase gene levels are significantly suppressed in CD‐1db / db mice compared with those of BKSdb / db mice, and thymosin β4 gene expression showed a similar trend. Whether urine AcSDKP is functionally relevant to protecting against kidney tubular fibrosis and damage is not yet clear, but our current data strongly support past reports regarding the antifibrotic potential of AcSDKP in both humans and rodents. It would be reasonable in future studies to examine several interventions or knockdown target genes utilizing CD‐1db / db mice.
Even though the present study showed a novel type 2 diabetic mouse model with progressive kidney damage, our research also showed several limitations. First, we induced type 2 diabetes by backcrossing the db gene into CD‐1 mice. Indeed, db/db mice or other leptin‐deficient rodents are often utilized for diabetic research, especially for DKD or other complication studies. However, leptin deficiency is a rare disorder in human type 2 diabetes 30 , 31 , and any leptin‐deficient rodent model, including the present model, might not be representative of type 2 diabetes pathobiology. Second, even though our CD‐1db / db mice showed advanced fibrosis similar to STZ‐induced type 1 diabetic CD‐1 mice, the CD‐1 mouse is an outbred strain and therefore could show genetic diversity; such genetic diversity could produce an unstable phenotype in the kidney as compared with inbred strains, such as the BKS strain. Third, it is necessary to compare the degree of renal impairment between CD‐1db / db and BKSdb / db while controlling blood glucose level to the same value using insulin treatment. However, the purpose of the present study was to establish a novel type 2 diabetic mouse model, and we need to carry out intervention experiments including insulin in future studies. Despite the limitations of the present study, CD‐1db / db mice could be a novel type 2 diabetic mouse model that shows progressive kidney injury and is useful for drug screening or experimental therapy.
In conclusion, the present study clearly showed that leptin receptor‐deficient CD‐1db / db mice could provide us with an opportunity to demonstrate the progressive phenotype of DKD and even more experimental therapies.
Disclosure
The authors declare no conflict of interest.
Supporting information
Figure S1 | Gel picture of mouse genotyping; the wild type (CD‐1) produced a 135‐bp fragment.
Figure S2 | Characteristics of female experimental animals.
Figure S3 | Western blot analysis of α‐smooth muscle actin expression in male kidney at 24 weeks‐of‐age.
Figure S4 | Female CD‐1db / db showed milder fibrotic phenotype than males.
Figure S5 | Heatmaps of differentially expressed genes in (a) fibrosis and (b) epithelial–mesenchymal transition pathways.
Acknowledgments
This study was partially supported by grants from the Japan Society for the Promotion of Science awarded to KK (19K08738, 26460403) and DK (25282028, 25670414). This study was partially supported by a Grant for Promoted Research awarded to KK (S2016‐3, S2017‐1) and a Grant for Assist KAKEN to YT (K2017‐16) from Kanazawa Medical University. SL is supported by foreign scholar grants from Kanazawa Medical University. KK and DK received lecture fees from Daiichi Sankyo Pharma and Tanabe‐Mitsubishi Pharma. Boehringer Ingelheim (Japan), Mitsubishi Tanabe Pharma and Ono Pharmaceutical contributed to establishing the Division of Anticipatory Molecular Food Science and Technology. KK is under a consultancy agreement with Boehringer Ingelheim.
J Diabetes Investig. 2020
References
- 1. Radcliffe NJ, Seah JM, Clarke M, et al Clinical predictive factors in diabetic kidney disease progression. J Diabetes Investig 2017; 8: 6–18. [DOI] [PMC free article] [PubMed] [Google Scholar]
- 2. De Cosmo S, Rossi MC, Pellegrini F, et al Kidney dysfunction and related cardiovascular risk factors among patients with type 2 diabetes. Nephrol Dial Transplant 2014; 29: 657–662. [DOI] [PubMed] [Google Scholar]
- 3. Tuttle KR, Bakris GL, Bilous RW, et al Diabetic kidney disease: a report from an ADA consensus conference. Diabetes Care 2014; 37: 2864–2883. [DOI] [PMC free article] [PubMed] [Google Scholar]
- 4. Soler MJ, Riera M, Batlle D. New experimental models of diabetic nephropathy in mice models of type 2 diabetes: efforts to replicate human nephropathy. Exp Diabetes Res 2012; 2012: 616313. [DOI] [PMC free article] [PubMed] [Google Scholar]
- 5. Sugimoto H, Grahovac G, Zeisberg M, et al Renal fibrosis and glomerulosclerosis in a new mouse model of diabetic nephropathy and its regression by bone morphogenic protein‐7 and advanced glycation end product inhibitors. Diabetes 2007; 56: 1825–1833. [DOI] [PubMed] [Google Scholar]
- 6. Brown JA, Chua SC, Liu SM, et al Spontaneous mutation in the db gene results in obesity and diabetes in CD‐1 outbred mice. Am J Physiol Regulatory Integrative Comp Physiol 2000; 278: R320–R330. [DOI] [PubMed] [Google Scholar]
- 7. Grillon C, Rieger K, Bakala J, et al Involvement of thymosin beta 4 and endoproteinase Asp‐N in the biosynthesis of the tetrapeptide AcSerAspLysPro a regulator of the hematopoietic system. FEBS Lett 1990; 274: 30–34. [DOI] [PubMed] [Google Scholar]
- 8. Liu JM, Garcia‐Alvarez MC, Bignon J, et al Overexpression of the natural tetrapeptide acetyl‐N‐ser‐asp‐lys‐pro derived from thymosin beta4 in neoplastic diseases. Ann N Y Acad Sci 2010; 1194: 53–59. [DOI] [PubMed] [Google Scholar]
- 9. Cavasin MA, Rhaleb NE, Yang XP, et al Prolyl oligopeptidase is involved in release of the antifibrotic peptide Ac‐SDKP. Hypertension 2004; 43: 1140–1145. [DOI] [PMC free article] [PubMed] [Google Scholar]
- 10. Kanasaki K, Nagai T, Nitta K, et al N‐acetyl‐seryl‐aspartyl‐lysyl‐proline: a valuable endogenous anti‐fibrotic peptide for combating kidney fibrosis in diabetes. Front Pharmacol 2014; 5: 70. [DOI] [PMC free article] [PubMed] [Google Scholar]
- 11. Kanasaki K, Koya D, Sugimoto T, et al N‐acetyl‐seryl‐aspartyl‐lysyl‐proline inhibits TGF‐beta‐mediated plasminogen activator inhibitor‐1 expression via inhibition of Smad pathway in human mesangial cells. J Am Soc Nephrol 2003; 14: 863–872. [DOI] [PubMed] [Google Scholar]
- 12. Srivastava SP, Shi S, Kanasaki M, et al Effect of antifibrotic microRNAs crosstalk on the action of N‐acetyl‐seryl‐aspartyl‐lysyl‐proline in diabetes‐related kidney fibrosis. Sci Rep 2016; 6: 29884. [DOI] [PMC free article] [PubMed] [Google Scholar]
- 13. Nitta K, Shi S, Nagai T, et al Oral administration of N‐Acetyl‐seryl‐aspartyl‐lysyl‐proline ameliorates kidney disease in both type 1 and type 2 diabetic mice via a therapeutic regimen. Biomed Res Int 2016; 2016: 9172157. [DOI] [PMC free article] [PubMed] [Google Scholar]
- 14. Nitta K, Nagai T, Mizunuma Y, et al N‐Acetyl‐seryl‐aspartyl‐lysyl‐proline is a potential biomarker of renal function in normoalbuminuric diabetic patients with eGFR ≥ 30 ml/min/1.73m2 . Clin Exp Nephrol 2019; 23: 1004–1012. [DOI] [PubMed] [Google Scholar]
- 15. Kanasaki K, Shi S, Kanasaki M, et al Linagliptin‐mediated DPP‐4 inhibition ameliorates kidney fibrosis in streptozotocin‐induced diabetic mice by inhibiting endothelial‐to‐ mesenchymal transition in a therapeutic regimen. Diabetes 2014; 63: 2120–2131. [DOI] [PubMed] [Google Scholar]
- 16. Shi S, Srivastava SP, Kanasaki M, et al Interactions of DPP‐4 and integrin beta 1 influences endothelial‐to‐ mesenchymal transition. Kidney Int 2015; 88: 479–489. [DOI] [PubMed] [Google Scholar]
- 17. Nagai T, Kanasaki M, Srivastava SP, et al N‐acetyl‐seryl‐aspartyl‐lysyl‐proline inhibits diabetes‐associated kidney fibrosis and endothelial‐mesenchymal transition. Biomed Res Int 2014; 2014: 696475. [DOI] [PMC free article] [PubMed] [Google Scholar]
- 18. Tao Wu, Daniel C Marcus. Age‐related changes in cochlear endolymphatic potassium and potential in CD‐1 and CBA/CAj mice. JARO 2003; 04: 353–362. [DOI] [PMC free article] [PubMed] [Google Scholar]
- 19. Kitada M, Ogura Y, Koya D. Rodent models of diabetic nephropathy: their utility and limitations. Int J Nephrol Renovasc Dis 2016; 9: 279–290. [DOI] [PMC free article] [PubMed] [Google Scholar]
- 20. Katsuda Y, Ohta T, Miyajima K, et al Diabetic complications in obese type 2 diabetic rat models. Exp Anim 2014; 63: 121–132. [DOI] [PMC free article] [PubMed] [Google Scholar]
- 21. Zuo Y, Chun B, Potthoff SA, et al Thymosin beta4 and its degradation product, Ac‐SDKP, are novel reparative factors in renal fibrosis. Kidney Int 2013; 84: 1166–1175. [DOI] [PMC free article] [PubMed] [Google Scholar]
- 22. Rhaleb NE, Peng H, Harding P, et al Effect of N‐acetyl‐seryl‐aspartyl‐lysyl‐proline on DNA and collagen synthesis in rat cardiac fibroblasts. Hypertension 2001; 37: 827–832. [DOI] [PMC free article] [PubMed] [Google Scholar]
- 23. Fromes Y, Liu JM, Kovacevic M, et al The tetrapeptide acetyl‐serine‐aspartyl‐lysine‐proline improves skin flap survival and accelerates wound healing. Wound Repair Regen 2006; 14: 306–312. [DOI] [PubMed] [Google Scholar]
- 24. Shibuya K, Kanasaki K, Isono M, et al N‐acetyl‐seryl‐aspartyl‐lysyl‐proline prevents renal insufficiency and mesangial matrix expansion in diabetic db/db mice. Diabetes 2005; 54: 838–845. [DOI] [PubMed] [Google Scholar]
- 25. Omata M, Taniguchi H, Koya D, et al N‐acetyl‐seryl‐aspartyl‐lysyl‐proline ameliorates the progression of renal dysfunction and fibrosis in WKY rats with established anti‐glomerular basement membrane nephritis. J Am Soc Nephrol 2006; 17: 674–685. [DOI] [PubMed] [Google Scholar]
- 26. Castoldi G, di Gioia CR, Bombardi C, et al Renal antifibrotic effect of N‐acetyl‐seryl‐aspartyl‐lysyl‐proline in diabetic rats. Am J Nephrol 2013; 37: 65–73. [DOI] [PubMed] [Google Scholar]
- 27. Castoldi G, di Gioia CR, Bombardi C, et al Prevention of myocardial fibrosis by N‐acetyl‐seryl‐aspartyl‐lysyl‐proline in diabetic rats. Clin Sci (Lond) 2010; 118: 211–220. [DOI] [PubMed] [Google Scholar]
- 28. Vegter S, Perna A, Postma MJ, et al Sodium intake, ACE inhibition, and progression to ESRD. J Am Soc Nephrol 2012; 23: 165–173. [DOI] [PMC free article] [PubMed] [Google Scholar]
- 29. Kwakernaak AJ, Waanders F, Slagman MC, et al Sodium restriction on top of renin‐angiotensin‐aldosterone system blockade increases circulating levels of N‐acetyl‐seryl‐aspartyl‐lysyl‐proline in chronic kidney disease patients. J Hypertens 2013; 31: 2425–2432. [DOI] [PubMed] [Google Scholar]
- 30. Montague CT, Farooqi IS, Whitehead JP, et al Congenital leptin deficiency is associated with severe early‐onset obesity in humans. Nature 1997; 387: 903–908. [DOI] [PubMed] [Google Scholar]
- 31. Clement K, Vaisse C, Lahlou N, et al A mutation in the human leptin receptor gene causes obesity and pituitary dysfunction. Nature 1998; 392: 398–401. [DOI] [PubMed] [Google Scholar]
Associated Data
This section collects any data citations, data availability statements, or supplementary materials included in this article.
Supplementary Materials
Figure S1 | Gel picture of mouse genotyping; the wild type (CD‐1) produced a 135‐bp fragment.
Figure S2 | Characteristics of female experimental animals.
Figure S3 | Western blot analysis of α‐smooth muscle actin expression in male kidney at 24 weeks‐of‐age.
Figure S4 | Female CD‐1db / db showed milder fibrotic phenotype than males.
Figure S5 | Heatmaps of differentially expressed genes in (a) fibrosis and (b) epithelial–mesenchymal transition pathways.