Abstract
Aims/Introduction
Glucagon‐like peptide‐1 receptor agonists (GLP‐1RA) are used for treatment of type 2 diabetes mellitus worldwide. However, some patients do not respond well to the therapy, and caution must be taken for certain patients, including those with reduced insulin secretory capacity. Thus, it is clinically important to predict the efficacy of GLP‐1RA therapy. GLP‐1R‐targeted imaging has recently emerged to visualize and quantify β‐cells. We investigated whether GLP‐1R‐targeted imaging can predict the efficacy of GLP‐1RA treatment.
Materials and Methods
We developed 111Indium‐labeled exendin‐4 derivative (111In‐Ex4) as a GLP‐1R‐targeting probe. Diabetic mice were selected from NONcNZO10/LtJ male mice that were fed for different durations with 11% fat chow. After 3‐week administration of dulaglutide as GLP‐1RA therapy, mice with non‐fasting blood glucose levels <300 mg/dL and >300 mg/dL were defined as responders and non‐responders, respectively. In addition, ex vivo 111In‐Ex4 pancreatic accumulations (111In‐Ex4 pancreatic values) were examined.
Results
The non‐fasting blood glucose levels after treatment were 172.5 ± 42.4 mg/dL in responders (n = 4) and 330.8 ± 20.7 mg/dL in non‐responders (n = 5), respectively. Ex vivo 111In‐Ex4 pancreatic values showed significant correlations with post‐treatment glycohemoglobin and glucose area under curve during an oral glucose tolerance test (R 2 = 0.76 and 0.80; P < 0.01 and <0.01, respectively). The receiver operating characteristic area under curve for identifying responders by ex vivo 111In‐Ex4 pancreatic values was 1.00 (P < 0.01).
Conclusion
Ex vivo 111In‐Ex4 pancreatic values reflected dulaglutide efficacy, suggesting clinical possibilities for expanding GLP‐1R‐targeted imaging applications.
Keywords: β‐Cell mass, Glucagon‐like peptide‐1 receptor, Glucagon‐like peptide‐1 receptor agonist
111Indium‐labeled exendin‐4 derivative pancreatic uptake, which is significantly correlated with glucagon‐like peptide‐1 receptor messenger ribonucleic acid expression and β‐cell mass, reflected in vivo glucose‐lowering effects of dulaglutide in diabetic mice. Glucagon‐like peptide‐1 receptor‐targeted imaging can be utilized for better selection of antidiabetic medications in patients with type 2 diabetes.
Introduction
Glucagon‐like peptide‐1 receptor agonists (GLP‐1RAs) are now widely used for treatment of type 2 diabetes mellitus. GLP‐1RAs enhance insulin secretion glucose‐dependently, as well as suppress glucagon secretion and food intake, thereby improving glycemic control and reducing bodyweight in patients with type 2 diabetes 1 . However, in clinical trials, as well as actual clinical settings, some patients do not respond well to the therapy, and caution should be taken for certain patients, including those with reduced insulin secretory capacity 2 . As clinical predictors of the GLP‐1RA response, some previous reports have suggested shorter diabetes duration, lower total insulin dose and preserved β‐cell function, as determined by the increment of serum C‐peptide during glucagon stimulation test, post‐meal serum C‐peptide index and the increment of serum C‐peptide 120 min after 75‐g oral glucose load 2 , 3 , 4 , 5 , 6 . However, the cut‐off values vary, and the reliability of β‐cell function calculations as a predictor for efficacy of GLP‐1RA has not been fully established 7 . Furthermore, it remains challenging to exclude non‐responders to GLP‐1RA, as reduced β‐cell function is often difficult to establish in clinical settings because of apparently reduced insulin secretory capacity in chronic hyperglycemia and glucose toxicity 2 , 3 . Therefore, it is clinically important to develop a rigorous method for predicting GLP‐1RA efficacy.
GLP‐1R has been a promising target for a β‐cell‐specific probe. For the purpose of visualization and quantification of β‐cells, GLP‐1R‐targeted imaging methods, such as single‐photon emission computed tomography (SPECT) and positron emission tomography have recently emerged 8 , 9 , 10 , 11 . These methods were developed for the detection of insulinoma and transplanted islets, and the evaluation of β‐cell mass 12 , 13 , 14 , and they have not been used for clinical prediction of drug efficacy in diabetes treatment. Using these methods in the present study, we investigated factors that might be related to the determination of in vivo GLP‐1RA efficacy.
Methods
Animals
Male NONcNZO10/LtJ mice (RCS‐10) were purchased from the Jackson Laboratory (Bar Harbor, ME, USA). This strain is known as a model of type 2 diabetes mellitus, in which diabetes is induced by an 11% fat (weight/weight)‐containing chow diet 15 . In the current study, 11% fat‐containing chow diet (3.6 kcal/g) prepared by adding soybean oil to standard rodent chow (MF; Oriental Yeast, Tokyo, Japan) was purchased and used to induce diabetes in RCS‐10 mice. As we have to predict GLP‐1RA efficacy in patients with varying backgrounds, including age, diabetes duration and severities of diabetes, in clinical settings, different durations of 11% fat‐containing chow diet‐feeding and intraperitoneal injection of streptozotocin were used in combination. To prepare RCS‐10 mice with varying severities of diabetes, the mice were fed with the 11% fat‐containing chow diet for different durations in the presence or absence of intraperitoneal infusion of streptozotocin: Two mice received 11% fat chow from 4 weeks‐of‐age to 30 weeks‐of‐age, five mice received the diet from 14 weeks‐of‐age to 30 weeks‐of‐age, two mice received intraperitoneal injection of streptozotocin (150 μg/bodyweight g) at 14 weeks‐of‐age and the diet from 14 weeks‐of‐age to 24 weeks‐of‐age, and three non‐diabetic control mice received normal chow from weaning to 30 weeks‐of‐age. Only mice showing >300 mg/dL non‐fasting glucose level more than twice consecutively were used as diabetic mice. All mice were housed in a temperature‐maintained environment under conditions of a 14:10 light–dark cycle with free access to water and food unless otherwise noted. This animal study was approved by the animal care and use committee, Kyoto University Graduate School of Medicine (Med kyo 18246, 19246).
GLP‐1RA administration and study design
The GLP‐1RA dulaglutide (0.6 mg/bodyweight kg twice weekly) was subcutaneously administered to diabetic and non‐diabetic mice for 3 weeks similarly to the previous report 16 . To exclude the massive β‐cell proliferation that might be induced by GLP‐1RA administration, relatively aged mice were used in the study. GLP‐1RA administration was started at the age of 24 weeks in the two mice with streptozotocin, and at 30 weeks‐of‐age in the other 10 mice. Three days after the 3‐week dulaglutide administration (day 24), the mice were subjected to blood testing; those with non‐fasting blood glucose levels <300 mg/dL and >300 mg/dL were defined as responders and non‐responders, respectively. Non‐fasting blood glucose levels were determined using the glucose oxidase method (GT‐1670; Arkray, Kyoto, Japan).
Oral glucose tolerance test and mice glycohemoglobin measurements
Oral glucose tolerance tests after a 16‐h fast were performed before the first dulaglutide administration and after the last dulaglutide administration (days 0 and 17, respectively), together with glycohemoglobin measurements using an automated glycohemoglobin analyzer (HLC‐723G8; Tosoh, Tokyo, Japan). During oral glucose tolerance tests, blood sample collection was carried out through the tail vein at 0, 15, 30, 60 and 120 min after oral glucose administration (2 g glucose/kg bodyweight) by oral gavage. Thereafter, the blood glucose levels were measured using the glucose oxidase method (Arkray). Serum insulin levels of 0‐ and 30‐min samples were measured using an insulin enzyme‐linked immunoassay kit (Ultra Sensitive Mouse Insulin ELISA Kit; Morinaga Institute of Biological Sciences, Inc., Kanagawa, Japan).
Ex vivo pancreas analysis using the 111In‐exendin‐4 probe
The 111In‐exendin‐4 probe, (Lys12[In‐BnDTPA‐Ahx])exendin‐4 (111In‐Ex4) was synthesized, as previously reported 9 . Although the utility of 111In‐Ex4 for in vivo SPECT/computed tomography (CT) imaging was established in the previous report 14 , 17 , 18 , the pancreatic visualization of 10‐week‐old male RCS‐10 mice was reconfirmed before the investigation in dulaglutide‐treated mice. The SPECT/CT imaging was carried out using a Triumph LabPET12/SPECT4/CT (TriFoil Imaging Inc., Chatsworth, CA, USA), as previously reported 14 . Two weeks after the last administration of dulaglutide (day 35), mice were injected through the tail vein with 111In‐Ex4 (3.0 MBq/mouse). Mice were killed by cervical dislocation 30 min after injection, followed by immediate resection of the pancreas and measurement of the radioactivity in the resected pancreas (ex vivo 111In‐Ex4 pancreatic values) using a Curiemeter (IGC‐7; Hitachi Aloka Medical, Ltd., Tokyo, Japan).
Ribonucleic acid isolation and real‐time polymerase chain reaction
After weight measurement of the pancreas, snap‐frozen sections of mice pancreatic tails in liquid nitrogen were obtained for the extraction of total ribonucleic acid (RNA) using an RNA isolation kit (Qiagen, Valencia, CA, USA). For complementary deoxyribonucleic acid synthesis, 1 mg total RNA was reverse transcribed using a High Capacity RNA‐to‐cDNA Kit (Applied Biosystems, Alameda, CA, USA). SYBR Green polymerase chain reaction (PCR) Master Mix (Applied Biosystems) was applied for quantitative real‐time PCR using an ABI StepOnePlus Real‐Time PCR System (Applied Biosystems). The signals of the products were standardized against glyceraldehyde 3‐phosphate dehydrogenase signals in each sample. Primer pairs for PCR are shown in Table S1.
Histological analysis of β‐cell mass
Pancreatic tissues were fixed in 10% formalin at 4°C. For β‐cell mass (BCM) analysis, 10 sets of serial formalin‐fixed paraffin‐embedded sections (4 μm per section; 100 μm between each set) were stained with an anti‐insulin antibody. The primary antibody was a rabbit polyclonal antibody (1:100, sc‐9168; Santa Cruz Biotechnology, Santa Cruz, CA, USA). The secondary antibody was Alexa Fluor 488 goat anti‐rabbit antibody (1:200, A‐11008; Thermo Fisher Scientific, Waltham, MA, USA). The tissue sections were then stained with hematoxylin–eosin. The prepared slides were analyzed using a fluorescence microscope (BZ‐X710; Keyence, Osaka, Japan). BCM was calculated from histological sections according to the following formula: (insulin‐positive area/whole pancreas area) × pancreas weight (mg), as previously reported 17 , 18 .
Statistical analysis
All data are expressed as the mean ± standard deviation. Statistical analyses were carried out using one‐way analysis of variance with the Tukey–Kramer post‐hoc test, Student’s or Welch’s t‐test, and Pearson’s correlation coefficient. Receiver operating characteristic curve (ROC) analysis was carried out to investigate the factors determining responders and non‐responders to dulaglutide treatment. P‐values <0.05 were considered statistically significant. Simple linear regression analysis of ex vivo radioisotope counts of pancreas was also carried out. JMP version 13.0.0 (SAS Institute, Cary, NC, USA) was used to carry out all statistical analyses.
Results
In vivo 111In‐Ex4 SPECT/CT in RCS‐10 mice
The pancreata of RCS‐10 mice were visualized by 111In‐Ex4 SPECT/CT, as described in the previous reports 14 , 17 , 18 . Representative images of in vivo 111In‐Ex4 SPECT/CT are shown in Figure 1.
Figure 1.
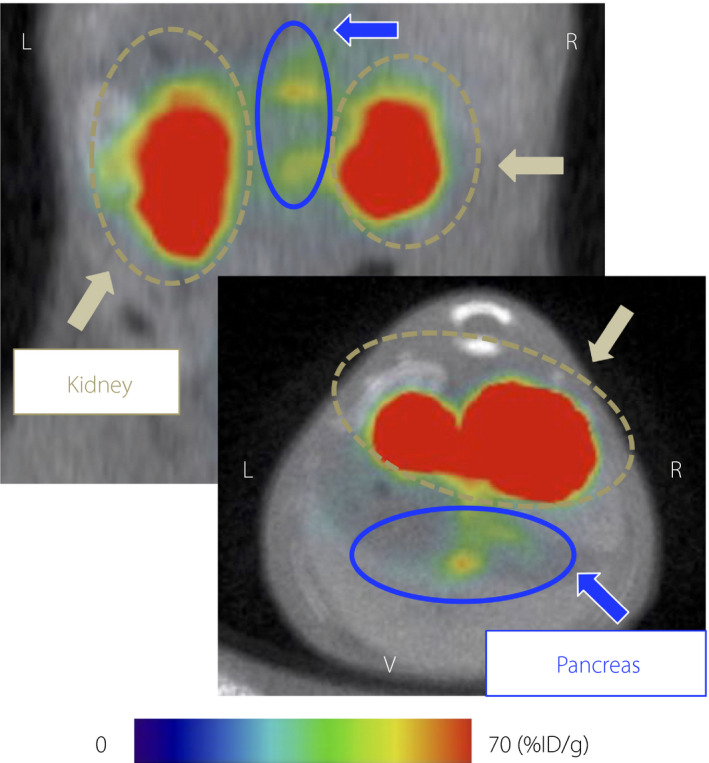
Representative 111Indium‐labeled exendin‐4 derivative single‐photon emission computed tomography/computed tomography images of a 10‐week‐old RCS‐10 male mouse. Coronal and axial images are shown in the upper and lower panels, respectively. Maximum to minimum intensity: red > orange > yellow > green > blue > black. Signals from the pancreas, blue arrows and circles; signals from the kidney, yellow brown arrows and circles. %ID/g; pancreatic uptake values per injected dose of the probe; L, left; R, right; V, ventral.
Glycemic controls during observation
After 3‐week administration of GLP‐1RA dulaglutide, the diabetic mice were categorized into four responders and five non‐responders. The non‐responders included the two mice receiving 11% fat chow from 4 weeks‐of‐age to 30 weeks‐of‐age; the two mice receiving the diet from 14 weeks‐of‐age to 30 weeks‐of‐age, and the single mouse receiving intraperitoneal injection of streptozotocin at 14 weeks‐of‐age and the diet from 14 weeks‐of‐age to 24 weeks‐of‐age. The other mouse receiving intraperitoneal injection of streptozotocin was categorized as a responder. The changes in non‐fasting blood glucose levels are shown in Figure 2a. At baseline, the non‐fasting blood glucose levels of responders tended to be lower than those of non‐responders, but there were no significant differences between them (346.3 ± 26.4 vs 432.6 ± 94.9 mg/dL, P = 0.12). Bodyweight, fasting blood glucose levels, glycohemoglobin levels and non‐fasting blood glucose per serum insulin levels also showed no significant differences between the two groups (Figure 2b–e), although the responders showed significantly lower area under curve of glucose during 2 h (AUCglucose) and increment of serum insulin per blood glucose during 30 min (Δinsulin/Δglucose [0–30 min]) of oral glucose tolerance test (Figure 3a–d). In contrast, on day 24, the responders showed significantly lower non‐fasting blood glucose levels than the non‐responders (172.5 ± 41.3 vs 330.8 ± 22.2 mg/dL, P < 0.01). However, non‐fasting blood glucose levels became similar in the two groups after the dulaglutide washout period (day 35; Figure 2a).
Figure 2.
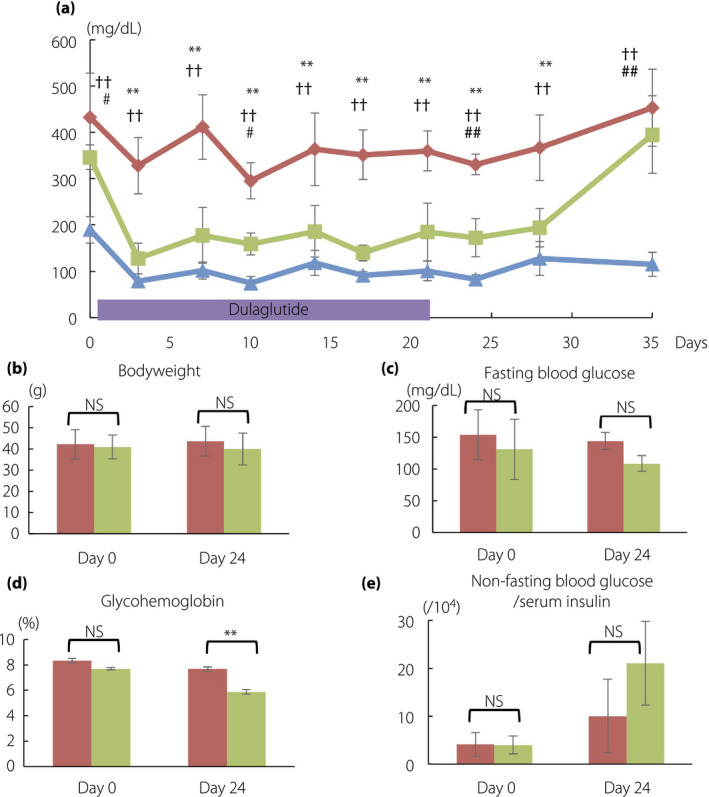
Glycemic changes and characteristics during observation in mice. (a) Changes of non‐fasting blood glucose levels. On day 24, five mice showing >300 mg/dL of glucose level were grouped as non‐responders, whereas four mice showing <300 mg/dL were grouped as responders. (b) Bodyweight, (c) fasting blood glucose, (d) mice hemoglobin and (e) non‐fasting blood glucose per serum insulin levels are shown. Non‐responders, red rhombi and bars (n = 5); responders, green squares and bars (n = 4); non‐diabetic control mice, blue triangles and bars (n = 3). The data are expressed as the mean ± standard deviation. Responders versus non‐responders, *P < 0.05, **P < 0.01; non‐responders versus control, † P < 0.05, †† P < 0.01; responders versus control, # P < 0.05, ## P < 0.01. NS, not significant.
Figure 3.
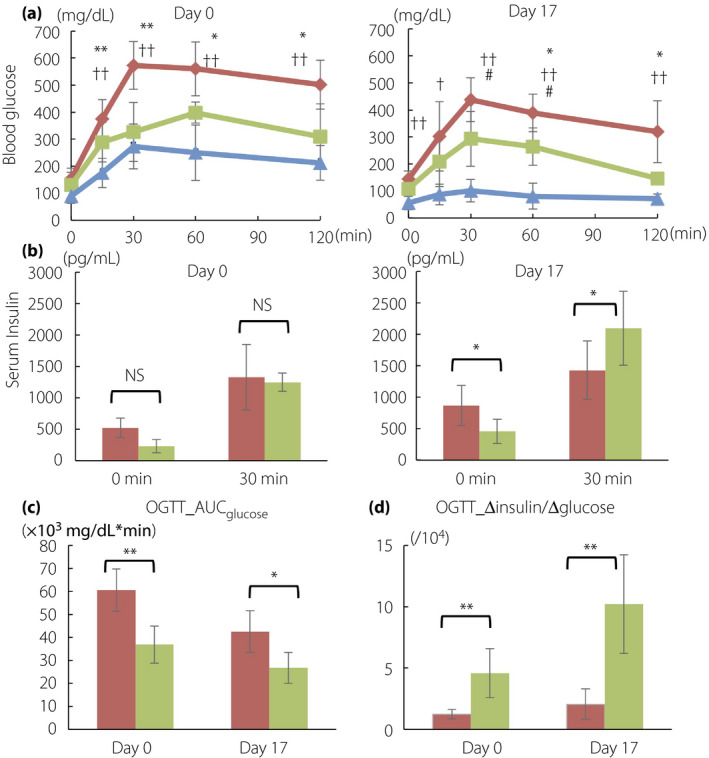
(a) Blood glucose and (b) insulin levels during oral glucose tolerance test (OGTT) on day 0 and 17. The comparisons between day 0 and 17 are shown in (c) area under the curve of glucose during 2 h (AUCglucose) of OGTT and (d) the increment of serum insulin per blood glucose during 30 min (Δinsulin/Δglucose [0–30 min]) of OGTT. Non‐responders, red rhombi and bars (n = 5); responders, green squares and bars (n = 4); non‐diabetic control mice, blue triangles and bars (n = 3). The data are expressed as the mean ± standard deviation. Responders versus non‐responders, *P < 0.05, **P < 0.01; non‐responders versus control, † P < 0.05, †† P < 0.01; responders versus control, # P < 0.05, ## P < 0.01. NS, not significant.
Ex vivo 111In‐Ex4 pancreatic values in responders and non‐responders
Ex vivo 111In‐Ex4 pancreatic values were significantly higher in the responders than in the non‐responders (0.046 ± 0.003 vs 0.035 ± 0.004 MBq, P < 0.01), whereas non‐diabetic control mice showed significantly higher values than the two diabetic groups (0.062 ± 0.002 MBq; vs responders, P < 0.01; vs non‐responders, P < 0.01; Figure 4a). There were no overlaps between the two diabetic groups, suggesting a cut‐off for 111In‐Ex4 pancreatic values for a better response to dulaglutide. In the analysis excluding the mice with streptozotocin infusion, ex vivo 111In‐Ex4 pancreatic values were also significantly higher in the responders than in the non‐responders (0.046 ± 0.003 vs 0.036 ± 0.004 MBq, P = 0.03), and showed no overlaps between the two diabetic groups.
Figure 4.
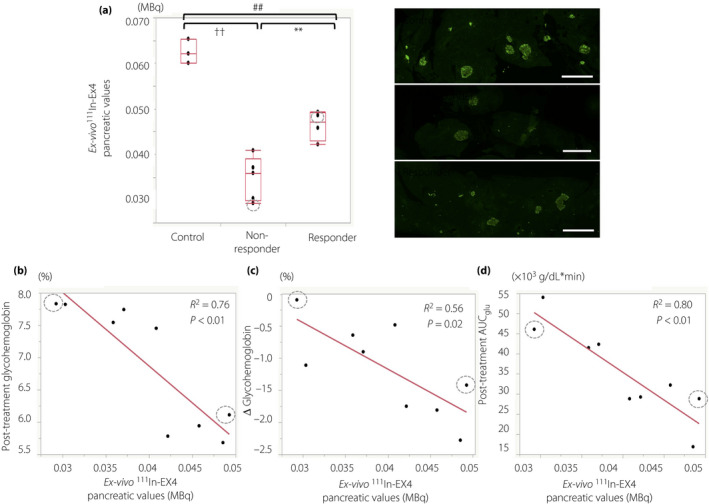
Ex vivo 111Indium‐exendin‐4 (111In‐Ex4) pancreatic values and dulaglutide’s glucose‐lowering effects. Box‐and‐whisker plot for ex vivo 111In‐Ex4 pancreatic values in non‐diabetic control, responders and non‐responders. The box contains the 25th to 75th percentiles of the dataset. The whiskers mark the highest or lowest value of each group. Representative images of the insulin‐positive area of the pancreas in each group (right column). Simple linear regression analysis for (b) ex vivo 111In‐Ex4 pancreatic values with post‐treatment glycohemoglobin levels, (c) changes of glycohemoglobin levels between baseline and post‐treatment, and (d) post‐treatment glucose area under the curve during 2 h of oral glucose tolerance test (OGTT_AUCglu) are shown. Mice receiving intraperitoneal streptozotocin infusions are shown with gray dotted circles. Scale bar indicates 300 μm. Responders versus non‐responders, **P < 0.01; non‐responders versus control, †† P < 0.01; responders versus control, ## P < 0.01.
Association of ex vivo 111In‐Ex4 pancreatic values with baseline characteristics and dulaglutide efficacies
To further investigate factors that might disclose potential responders and non‐responders to dulaglutide treatment, ROC analysis was carried out using ex vivo 111In‐Ex4 pancreatic values and baseline characteristics. ROC analysis suggested that ex vivo 111In‐Ex4 pancreatic values, together with the AUCglucose, Δinsulin/Δglucose (0–30 min), glycohemoglobin levels and non‐fasting blood glucose levels, can predict responders and non‐responders to dulaglutide treatment (Table 1). Simple linear regression analysis for ex vivo 11In‐Ex4 pancreatic values showed significant correlations between ex vivo 11In‐Ex4 pancreatic values and post‐dulaglutide treatment glycohemoglobin levels (R 2 = 0.76, P < 0.01), change of glycohemoglobin level before and after dulaglutide treatment (R 2 = 0.56, P < 0.02), and post‐treatment AUCglucose (R 2 = 0.80, P < 0.01; Figure 4b–d). In the analysis excluding the mice with streptozotocin infusion, significant correlations were observed between ex vivo 11In‐Ex4 pancreatic values, post‐dulaglutide treatment glycohemoglobin levels (R 2 = 0.75, P = 0.01) and post‐treatment AUCglucose (R 2 = 0.86, P < 0.01), but the correlation between ex vivo 11In‐Ex4 pancreatic values and change of glycohemoglobin level before and after dulaglutide treatment lost statistical significance (R 2 = 0.48, P = 0.08).
Table 1.
Results of receiver operating curve analysis on responders and non‐responders to dulaglutide treatment
| AUC | Sensitivity | Specificity | Cut‐off | P | |
|---|---|---|---|---|---|
| 111In‐Ex4 pancreatic value (MBq) | 1.00 | 1.00 | 1.00 | 0.04 | <0.01 |
| Bodyweight (g) | 0.66 | 0.71 | 0.80 | 40.40 | 0.25 |
| Age (weeks) | 0.53 | 0.86 | 0.20 | 29.00 | 0.79 |
| Mice glycohemoglobin (%) | 0.94 | 0.86 | 1.00 | 7.75 | 0.01 |
| Fasting glucose (mg/dL) | 0.77 | 0.71 | 0.80 | 118.00 | 0.09 |
| Non‐fasting glucose (mg/dL) | 0.86 | 0.86 | 0.80 | 357.000 | 0.01 |
| Fasting insulin/glucose (/104) | 0.66 | 0.57 | 0.80 | 4.99 | 0.26 |
| Non‐fasting insulin/glucose (/104) | 0.69 | 0.86 | 0.60 | 4.38 | 0.17 |
|
OGTT AUCglu (mg/dL × min) |
1.00 | 1.00 | 1.00 | 46102.50 | <0.01 |
| OGTT Δinsulin/Δglucose (0–30 min) (/104) | 1.00 | 1.00 | 1.00 | 2.62 | <0.01 |
AUCglu, area under curve of glucose during 2 h; AUROC, area under the receiver operating characteristic curve; GLP‐1RA, glucagon‐like peptide‐1 receptor agonists; Δinsulin/Δglucose (0–30 min), increment of serum insulin per blood glucose during 30 min; OGTT, oral glucose tolerance test.
Association of dulaglutide efficacies with GLP‐1R mRNA expressions and BCM
Figure 5a shows relative GLP‐1R mRNA expression in mice pancreata. Diabetic mice showed significantly lower GLP‐1R mRNA expression in the pancreas than non‐diabetes controls. Furthermore, the GLP‐1R mRNA expressions were significantly higher in responders than in non‐responders. In addition, responders showed significantly greater BCM than non‐responders (Figure 5b). The difference in the relative GLP‐1R mRNA expression per BCM was insignificant between responders and non‐responders (4.6 ± 0.9 vs 2.6 ± 1.6, P = 0.08), whereas non‐diabetic control mice showed significantly higher GLP‐1R mRNA expression per BCM levels (9.0 ± 2.8) than responders (P = 0.03) and non‐responders (P = 0.04), respectively. Ex vivo 111In‐Ex4 pancreatic values in all mice examined; that is, diabetic mice and non‐diabetic controls, were significantly correlated with relative GLP‐1R mRNA expression (R 2 = 0.88, P < 0.01) and BCM (R 2 = 0.75, P < 0.01), respectively (Figure 5c,d). In the analysis excluding the mice with streptozotocin infusion, the GLP‐1R mRNA expressions were still significantly higher in responders than in non‐responders (7.5 ± 0.2 vs 3.0 ± 1.6, P < 0.01). Ex vivo 111In‐Ex4 pancreatic values in all of the mice without streptozotocin infusion were significantly correlated with relative GLP‐1R mRNA expression (R 2 = 0.88, P < 0.01) and BCM (R 2 = 0.81, P < 0.01), respectively.
Figure 5.
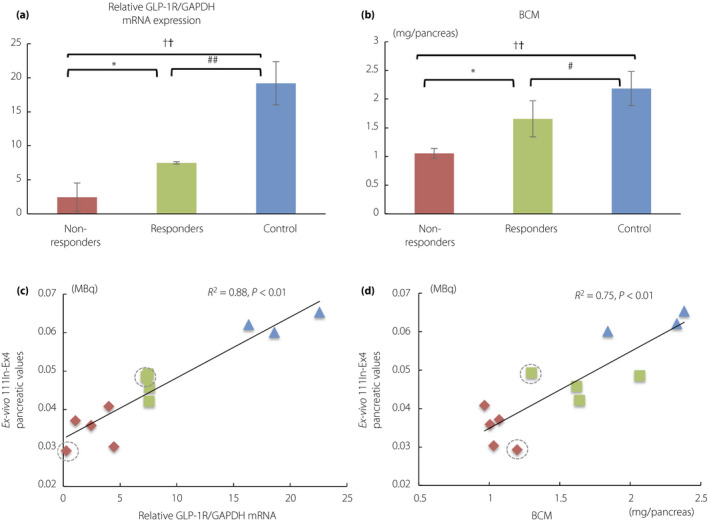
(a) Glucagon‐like peptide‐1 receptor (GLP‐1R) messenger ribonucleic acid (mRNA) expression levels and (b) β‐cell mass (BCM) in each group. Scatterplots show significant correlation between ex vivo 111Indium‐exendin‐4 (111In‐Ex4) pancreatic values and (c) GLP‐1R mRNA expression levels as well as (d) β‐cell mass (BCM). Non‐responders, red rhombi and bars (n = 5); responders, green squares and bars (n = 4); non‐diabetic control mice, blue triangles and bars (n = 3). Mice receiving intraperitoneal streptozotocin infusions are shown with gray dotted circles. The data are expressed as the mean ± standard deviation. Responders versus non‐responders, *P < 0.05, **P < 0.01; non‐responders versus control, † P < 0.05, †† P < 0.01; responders versus control, # P < 0.05, ## P < 0.01. GAPDH, glyceraldehyde 3‐phosphate dehydrogenase; NS, not significant.
Discussion
The present study showed that 111In‐Ex4 pancreatic values can account for the glucose‐lowering efficacy of dulaglutide treatment among mice with varying severities of diabetes.
Accumulating clinical data has suggested that reduced glucose‐lowering effects of some GLP‐1RAs could be partly due to reduced insulin secretory capacity 2 , 3 , 4 , 5 , 6 , 7 . Several indices related to insulin secretory capacity have been described as valuable parameters to avoid termination of GLP‐1RAs in the case of hyperglycemia 2 , 3 , 4 . Consistent with these clinical observations, the present study showed that the insulin secretory capacity‐related index, Δinsulin/Δglucose (0–30 min), exhibits significant predictability of dulaglutide’s glucose‐lowering effects (Table 1). As both pancreatic β‐cell mass and the insulin secretory capacity of individual β‐cells accounts for general insulin secretory capacity in humans and mice, we hypothesized that 111In‐Ex4 pancreatic values, an index of pancreatic BCM, might predict the glucose‐lowering effects of GLP‐1RAs. Indeed, the current study showed that 111In‐Ex4 pancreatic values predict dulaglutide’s glucose‐lowering effects similarly to Δinsulin/Δglucose (0–30 min; Table 1).
BCM has central importance in diabetes progression and responsiveness to antidiabetes treatments 19 , 20 . However, the influence of BCM has been little discussed, because non‐invasive methods to quantify BCM were not available until the recent development of GLP1R‐targeted imaging, such as the 111In‐Ex4 probe 17 , 18 . In the present study, we showed that ex vivo 111In‐Ex4 pancreatic values were significantly related to the BCM of RCS‐10 mice (Figure 5d), which accords with the results in other mice strains in previous reports 14 , 17 , 18 .
Although previous reports found that GLP‐1RAs could enhance β‐cell proliferation and increase BCM in young rodents 16 , 21 , 22 , in the present study, we used mice aged >24–30 weeks‐old and our administration duration of dulaglutide was relatively limited. The present findings thus establish that BCM can be a useful clinical predictor for dulaglutide’s glucose‐lowering effects. In addition, GLP‐1R expression levels might affect dulaglutide efficacy. It is known that the effects of GLP‐1RAs are attenuated with diabetes progression, partly due to a decline in GLP‐1R expression 21 , 23 . A previous report showed that the GLP‐1R expression level was not reduced in non‐diabetic or diabetic mice, despite long‐term exposure to dulaglutide 16 . As the GLP‐1R expression level of β‐cells can be affected by glycemic control 24 , we analyzed GLP‐1R expressions after the wash‐out period of dulaglutide; glycemic control was recovered to similar glycemic status as baseline (Figure 2a).
Although the present results suggest that both BCM and GLP‐1R expression level contributed to dulaglutide’s glucose‐lowering effects, the GLP‐1R expression level could itself be affected by BCM changes, as the difference of relative GLP‐1R mRNA expression levels between responders and non‐responders became statistically insignificant after correction for BCM. Thus, BCM might well be the primary contributor to the glucose‐lowering effects of dulaglutide. Interestingly, the clinical predictors for GLP‐1RA responders that were suggested in the previous clinical studies were shown to have a close relationship with BCM in pathological analyses of human pancreas 25 , 26 .
Considering the significant correlation between ex vivo 111In‐Ex4 pancreatic values and GLP‐1R mRNA expression levels, as well as BCM (Figure 5c.d), it is reasonable that ex vivo 111In‐Ex4 pancreatic values should have predictive power for dulaglutide efficacy. According to the previous study, ex vivo 111In‐Ex4 pancreatic values showed a significant correlation with SPECT values, which can be obtained non‐invasively 14 , 17 , 18 . Thus, non‐invasive GLP‐1R‐targeted imaging, such as SPECT, might be expected to be a promising tool for individual, clinical prediction of the efficacy of GLP‐1Ras, including dulaglutide.
In addition, considering the influence of apparently reduced insulin secretory capacity in chronic hyperglycemia and glucose toxicity on conventional evaluation methods 2 , 3 , GLP‐1R‐targeted imaging might well be an option to provide more accurate prediction regardless of glycemic control status, as the significant correlations between BCM and 111In‐Ex4 SPECT values were shown even in diabetic and non‐diabetic, as well as treated and non‐treated subjects 17 , 18 . Further studies are required to elucidate the different roles in the prediction of GLP‐1RA responses, and 111In‐Ex4 SPECT values and conventional evaluation methods; the former can evaluate BCM itself, whereas the latter reflects an individual’s total insulin secretion capacity 17 , 18 .
Finally, the present study had several limitations. First, as only dulaglutide was used in this study, the possibility of differences in efficacy between dulaglutide and other GLP‐1RAs cannot be excluded. Second, the possible differences between mice and humans must be examined in further investigations, including clinical studies. Third, the dosage of dulaglutide might affect the classification of responders and non‐responders in the present study, although the dosage in this study was set according to the previous study, and adjusted based on individual bodyweight 16 . Furthermore, the analysis of GLP‐1R mRNA expression, BCM and ex vivo radioisotope count could not be evaluated before dulaglutide administration, because these analyses require fatal procedures. However, our limited analyses would be expected to be sufficient, as we used aged mice, a short intervention period and a generous wash‐out period. Further investigation of the predictability of GLP‐1R‐targeted imaging and in vivo or clinical SPECT values are warranted, even though previous studies have repeatedly shown that ex vivo 111In‐Ex4 pancreatic values reasonably reflect in vivo SPECT results 14 , 17 , 18 .
In conclusion, 111In‐Ex4 pancreatic uptake, which is significantly correlated with GLP‐1R mRNA expression and BCM, reflects the in vivo glucose‐lowering effects of dulaglutide in diabetic mice. ROC analysis also shows that 111In‐Ex4 pancreatic uptake can predict responders and non‐responders to dulaglutide treatment. These results suggest that GLP‐1R‐targeted imaging can be utilized for better selection of antidiabetic medications for patients with type 2 diabetes.
ACKNOWLEDGMENT
This work was supported by JSPS KAKENHI (grant number JP 18K08475) and ASTEM RI/Kyoto.
Disclosure
DY received clinical commissioned/joint research grants from Nippon Boehringer Ingelheim, Eli Lilly Japan, Taisho‐Toyama. MSD, Takeda, Ono and Novo Nordisk Pharma. NI received clinical commissioned/joint research grants from Daiichi Sankyo, Terumo and Drawbridge Inc.; speaker honoraria from Kowa, MSD, Astellas Pharma, Novo Nordisk Pharma, Ono Pharmaceutical, Nippon Boehringer Ingelheim, Takeda, Eli Lilly Japan, Sumitomo Dainippon Pharma and Mitsubishi Tanabe Pharma; and scholarship grants from Kissei Pharmaceutical, Sanofi, Daiichi Sankyo, Mitsubishi Tanabe Pharma, Takeda, Japan Tobacco, Kyowa Kirin, Sumitomo Dainippon Pharma, Astellas Pharma, MSD, Eli Lilly Japan, Ono Pharmaceutical, Sanwa Kagaku Kenkyusho, Nippon Boehringer Ingelheim, Novo Nordisk Pharma, Novartis Pharma, Teijin Pharma and Life Scan Japan. The other authors declare no conflict of interest.
Supporting information
Table S1 List of primer sequences for target gene.
J Diabetes Investig. 2020
References
- 1. Nauck MA. Incretin‐based therapies for type 2 diabetes mellitus: properties, functions, and clinical implications. Am J Med 2011; 124: S3–S18. [DOI] [PubMed] [Google Scholar]
- 2. Usui R, Yabe D, Kuwata H, et al Retrospective analysis of safety and efficacy of insulin‐to‐liraglutide switch in Japanese type 2 diabetes: a caution against inappropriate use in patients with reduced β‐cell function. J Diabetes Investig 2013; 4: 585–594. [DOI] [PMC free article] [PubMed] [Google Scholar]
- 3. Nambu T, Matsuda Y, Matsuo K, et al Liraglutide administration in type 2 diabetic patients who either received no previous treatment or were treated with an oral hypoglycemic agent showed greater efficacy than that in patients switching from insulin. J Diabetes Investig 2013; 4: 69–77. [DOI] [PMC free article] [PubMed] [Google Scholar]
- 4. Araki H, Tanaka Y, Yoshida S, et al Oral glucose‐stimulated serum C‐peptide predicts successful switching from insulin therapy to liraglutide monotherapy in Japanese patients with type 2 diabetes and renal impairment. J Diabetes Investig 2014; 5: 435–441. [DOI] [PMC free article] [PubMed] [Google Scholar]
- 5. Usui R, Yabe D, Kuwata H, et al Retrospective analysis of safety and efficacy of liraglutide monotherapy and sulfonylurea‐combination therapy in Japanese type 2 diabetes: association of remaining β‐cell function and achievement of HbA1c target one year after initiation. J Diabetes Complications 2015; 29: 1203–1210. [DOI] [PubMed] [Google Scholar]
- 6. Usui R, Sakuramachi Y, Seino Y, et al Retrospective analysis of liraglutide and basal insulin combination therapy in Japanese type 2 diabetes patients: the association between remaining β‐cell function and the achievement of the glycated hemoglobin target 1 year after initiation. J Diabetes Investig 2018; 9: 822–830. [DOI] [PMC free article] [PubMed] [Google Scholar]
- 7. Mathieu C, Del Prato S, Botros FT, et al Effect of once weekly dulaglutide by baseline beta‐cell function in people with type 2 diabetes in the AWARD programme. Diabetes Obes Metab 2018; 20: 2023–2028. [DOI] [PMC free article] [PubMed] [Google Scholar]
- 8. Kimura H, Matsuda H, Fujimoto H, et al Synthesis and evaluation of 18F‐labeled mitiglinide derivatives as positron emission tomography tracers for β‐cell imaging. Bioorg Med Chem 2014; 22: 3270–3278. [DOI] [PubMed] [Google Scholar]
- 9. Kimura H, Fujita N, Kanbe K, et al Synthesis and biological evaluation of an 111In‐labeled exendin‐4 derivative as a single photon emission computed tomography probe for imaging pancreatic β‐cells. Bioorg Med Chem 2017; 25: 5772–5778. [DOI] [PubMed] [Google Scholar]
- 10. Brom M, Woliner‐van der Weg W, Joosten L, et al Non‐invasive quantification of the beta cell mass by SPECT with 111In‐labelled exendin. Diabetologia 2014; 57: 950–959. [DOI] [PubMed] [Google Scholar]
- 11. Mukai E, Toyoda K, Kimura H, et al GLP‐1 receptor antagonist as a potential probe for pancreatic beta‐cell imaging. Biochem Biophys Res Commun 2009; 389: 523–526. [DOI] [PubMed] [Google Scholar]
- 12. Christ E, Wild D, Forrer F, et al Glucagon‐like peptide‐1 receptor imaging for localization of insulinomas. J Clin Endocrinol Metab 2009; 94: 4398–4405. [DOI] [PubMed] [Google Scholar]
- 13. van der Kroon I, Andralojc K, Willekens SM, et al Noninvasive imaging of islet transplants with 111In‐Exendin‐3 SPECT/CT. J Nucl Med 2016; 57: 799–804. [DOI] [PubMed] [Google Scholar]
- 14. Hamamatsu K, Fujimoto H, Fujita N, et al Establishment of a method for in‐vivo SPECT/CT imaging analysis of 111In‐labeled exendin‐4 pancreatic uptake in mice without the need for nephrectomy or a secondary probe. Nucl Med Biol 2018; 64–65: 22–27. [DOI] [PubMed] [Google Scholar]
- 15. Cho YR, Kim HJ, Park SY, et al Hyperglycemia, maturity‐onset obesity, and insulin resistance in NONcNZO10/LtJ males, a new mouse model of type 2 diabetes. Am J Physiol Endocrinol Metab 2007; 293: E327–336. [DOI] [PubMed] [Google Scholar]
- 16. Kimura T, Obata A, Shimoda M, et al Durability of protective effect of dulaglutide on pancreatic β‐cells in diabetic mice: GLP‐1 receptor expression is not reduced despite long‐term dulaglutide exposure. Diabetes Metab 2018; 44: 250–260. [DOI] [PubMed] [Google Scholar]
- 17. Fujita N, Fujimoto H, Hamamatsu K, et al Noninvasive longitudinal quantification of β‐cell mass with [111In]‐labeled exendin‐4. FASEB J 2019; 33: 11836–11844. [DOI] [PMC free article] [PubMed] [Google Scholar]
- 18. Murakami T, Fujimoto H, Fujita N, et al Noninvasive evaluation of GPR119 agonist effects on β‐cell mass in diabetic male mice using 111In‐exendin‐4 SPECT/CT. Endocrinology 2019; 160: 2959–2968. [DOI] [PubMed] [Google Scholar]
- 19. Rhodes CJ. Type 2 diabetes‐a matter of beta‐cell life and death? Science 2005; 307: 380–384. [DOI] [PubMed] [Google Scholar]
- 20. U.K. Prospective Diabetes Study Group . U.K. prospective diabetes study 16. Overview of 6 years' therapy of type II diabetes: a progressive disease. Diabetes 1995; 44: 1249–1258. [PubMed] [Google Scholar]
- 21. Kimura T, Kaneto H, Shimoda M, et al Protective effects of pioglitazone and/or liraglutide on pancreatic beta‐cells in db/db mice: comparison of their effects between in an early and advanced stage of diabetes. Mol Cell Endocrinol 2015; 400: 78–89. [DOI] [PubMed] [Google Scholar]
- 22. Xu G, Stoffers DA, Habener JF, et al Exendin‐4 stimulates both beta‐cell replication and neogenesis, resulting in increased beta‐cell mass and improved glucose tolerance in diabetic rats. Diabetes 1999; 48: 2270–2276. [DOI] [PubMed] [Google Scholar]
- 23. Ahren B. Incretin dysfunction in type 2 diabetes: clinical impact and future perspectives. Diabetes Metab 2013; 39: 195–201. [DOI] [PubMed] [Google Scholar]
- 24. Xu G, Kaneto H, Laybutt DR, et al Downregulation of GLP‐1 and GIP receptor expression by hyperglycaemia: possible contribution to impaired incretin effects in diabetes. Diabetes 2007; 56: 1551–1558. [DOI] [PubMed] [Google Scholar]
- 25. Meier JJ, Menge BA, Breuer TG, et al Functional assessment of pancreatic beta‐cell area in humans. Diabetes 2009; 58: 1595–1603. [DOI] [PMC free article] [PubMed] [Google Scholar]
- 26. Fujita Y, Kozawa J, Iwahashi H, et al Increment of serum C‐peptide measured by glucagon test closely correlates with human relative beta‐cell area. Endocr J 2015; 62: 329–337. [DOI] [PubMed] [Google Scholar]
Associated Data
This section collects any data citations, data availability statements, or supplementary materials included in this article.
Supplementary Materials
Table S1 List of primer sequences for target gene.


