

Abstract
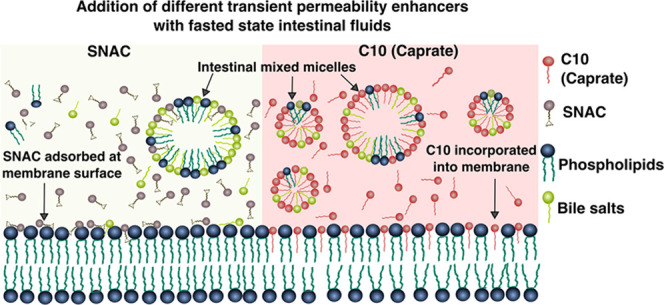
Transient permeability enhancers (PEs), such as caprylate, caprate, and salcaprozate sodium (SNAC), improve the bioavailability of poorly permeable macromolecular drugs. However, the effects are variable across individuals and classes of macromolecular drugs and biologics. Here, we examined the influence of bile compositions on the ability of membrane incorporation of three transient PEs—caprylate, caprate, and SNAC—using coarse-grained molecular dynamics (CG-MD). The availability of free PE monomers, which are important near the absorption site, to become incorporated into the membrane was higher in fasted-state fluids than that in fed-state fluids. The simulations also showed that transmembrane perturbation, i.e., insertion of PEs into the membrane, is a key mechanism by which caprylate and caprate increase permeability. In contrast, SNAC was mainly adsorbed onto the membrane surface, indicating a different mode of action. Membrane incorporation of caprylate and caprate was also influenced by bile composition, with more incorporation into fasted- than fed-state fluids. The simulations of transient PE interaction with membranes were further evaluated using two experimental techniques: the quartz crystal microbalance with dissipation technique and total internal reflection fluorescence microscopy. The experimental results were in good agreement with the computational simulations. Finally, the kinetics of membrane insertion was studied with CG-MD. Variation in micelle composition affected the insertion rates of caprate monomer insertion and expulsion from the micelle surface. In conclusion, this study suggests that the bile composition and the luminal composition of the intestinal fluid are important factors contributing to the interindividual variability in the absorption of macromolecular drugs administered with transient PEs.
Keywords: transient permeability enhancers, molecular simulation, coarse-grained molecular dynamics, medium-chain fatty acids, SNAC, membrane incorporation
1. Introduction
One of the challenges in drug discovery and development is the low oral bioavailability of poorly permeable drugs such as peptides, proteins, and oligonucleotide molecules. One approach to enhance the absorption of poorly permeable drugs through the intestinal epithelium is coadministration with transient permeability enhancers (PEs).1−3 A number of formulations for oral peptide delivery based on transient PEs went into clinical trials.4−9 Among the most efficient transient PEs for poorly permeable molecules are the medium-chain fatty acids (MCFAs) such as sodium caprate, caprylate, and MCFA-based enhancers such as salcaprozate sodium (SNAC; a derivative of caprylate).2,10,11 MCFAs modulate the epithelial membranes in a mild, transient, and rapidly reversible way12,13 and are therefore ideal to use as transient PEs. They are natural constituents of food products such as milk, coconut oil, and dairy triglycerides, and their use as transient PEs has shown no significant toxicity effect, even on individuals receiving multiple doses.7,10,14 It was found that the antisense oligonucleotides when coadministered with caprate to 15 male volunteers achieved an oral bioavailability of 9.5% compared to the subcutaneous (SC) injection.7 Oral insulin tablets formulated with caprate achieved a bioavailability of 1.5–2% compared to insulin delivered with SC injection.8 A novel oily suspension containing caprylate for oral delivery of Octreotide was found to be capable of achieving a relative bioavailability of 2.3% compared to SC injection in monkeys.9 SNAC, another PE, which was used as a coformulation strategy with semaglutide (a therapeutic peptide), increased the absorption of orally delivered peptides transiently from the stomach and showed a bioavailability of 1.22% in preclinical dog studies.11 After testing the various aspects of oral semaglutide in a total of 10 clinical trials named PIONEER,15−24 semaglutide tablet Rybelsus was approved by the Food and Drug Administration (FDA) in 2019.25
However, most transient PE-based dosage forms have not gone beyond clinical trials mainly due to large interindividual variability and poor commercial viability.2 To develop products that are robust and can reproducibly deliver macromolecular drugs, it is important to understand the fate of the PEs after oral administration. Currently, the physicochemical aspects of these PEs, and their interactions and enhancement mechanisms at the molecular level in the intestine, are not well understood.
In the intestine, excipients such as PEs can interact with various components of the intestinal fluid. MCFA molecules self-assemble and form micelles with different shapes, sizes, and structures above their critical micelle concentration (CMC) in the aqueous solution.26 Therefore, above the CMC, the number of free MCFA monomers is reduced. The CMC of MCFA-based permeability enhancers can be affected by fasted- and fed-state intestinal fluid components. The secretion of bile also produces self-assembled colloidal structures that can form mixed micelles with the MCFAs. These intestinal colloidal structures typically reduce the CMC of MCFAs, which subsequently decreases the free concentration of MCFAs available to interact with the enterocytes of the intestinal wall. The free MCFA monomers near the absorption site increase the permeability through both transcellular and paracellular pathways, and therefore, the intestinal fluid may affect the efficiency of the transient PEs.3
Recently, Roos et al. showed that the absorption of four different drugs (atenolol, enalaprilat, ketoprofen, and metoprolol) administered with different transient PEs in a rat model is lower in the fed-state simulated intestinal fluid (FeSSIF) than the fasted-state simulated intestinal fluid (FaSSIF).27 Investigation of FD4 through Caco-2 cells shows that the presence of FaSSIF components reduces the permeability enhancing capability of dodecyl-maltoside (DDM).28 DDM’s capability to promote permeation further diminished in the presence of FeSSIF. Typically, FeSSIF contains 5–6 times more phospholipids and bile salts than FaSSIF. The ionic strength, an important factor for the CMC, of FeSSIF is also twice as high as the ionic strength of FaSSIF. Therefore, the interaction of transient PEs with the higher number of mixed micelles formed in FeSSIF significantly lowers the free PE monomers, which may affect the drug permeability in the fed state. A similar discrepancy is also expected for the fasted-state human intestinal fluid (FaHIF) and fed-state human intestinal fluid (FeHIF) components. Riethorst et al. characterized human intestinal fluid (HIF) components in the fasted and fed states collected from the duodenum from 20 healthy volunteers.29 Fasted-state intestinal fluids were sampled from the volunteers after an overnight fasting period of 12 h. Fed-state intestinal fluids were sampled after ingesting a liquid meal (400 mL of Ensure Plus) following the fasted state. For each case, the fluids were sampled every 10 min for a period of 90 min. The mean values of bile salts, phospholipids, and free fatty acids (FFA) in the FaHIF were 3–5 times lower than those in the FeHIF. In addition to that, significant interindividual variability is present within the FaHIF. For FaHIF, the mean values of total bile salts and phospholipids were 4.40 ± 2.87 and 0.95 ± 0.56 mM, respectively.29 Similarly, the FeHIF also shows significant variability among the types and amount of intestinal fluid components. Riethorst et al. also characterized the colloidal structures present in the human and simulated intestinal fluid compositions and found large multilamellar vesicles and lipid droplets in the FeHIF.30 On the other hand, FaHIF and FaSSIF only contained mixed micelles of various sizes.
The interaction of these mixed micelles from different intestinal fluid compositions with the transient PEs is not well understood at the molecular level. The variation in free PE monomers—at a given concentration in the presence of physiologically relevant intestinal fluid compositions—makes an important piece of information for understanding the intestinal efficacy of the PEs. Likewise, the influence of interindividual variability of fluid composition is important for understanding the final permeability enhancement of macromolecular drugs.
Experimental techniques have been used to study the interaction of various surfactant molecules, mixed micelles, and cell membranes.31−33 However, it has been difficult to understand PE interactions with intestinal fluids and cell membranes at a molecular level with these techniques. An attractive alternative to experimental measurements is molecular simulations. Recently, coarse-grained molecular dynamics (CG-MD) has been used for the study of molecular aggregation related to PEs, such as the aggregation behavior of various MCFA molecules,26,34,35 structural details of bile salts and phospholipids micelles31 as well as the octaethylene glycol monododecyl ether micelles with different small molecules,36 and the interaction of PE molecules with lipid membranes.37−39 CG-MD has also been used to investigate the complex micelle kinetics of various surfactant molecules40,41 and bile salts.42
The main aim of our study was to quantitatively determine how variations in the intestinal fluid composition affected the free transient PE monomers that interacted with the cell membrane. We also investigated how different transient PEs interact with model cell membranes to understand, on a molecular level, their transport to the membrane in the presence of mixed colloidal structures. We performed CG-MD simulations to estimate the number of free PE monomers when PEs are added to systems containing human as well as simulated intestinal fluids. We also used CG-MD simulations to investigate the interaction of the PEs with a model cell membrane in the presence of the different intestinal fluid compositions. Three transient PEs were used in the simulations: caprylate, caprate, and SNAC. To evaluate the simulation of PE interaction with the cell membrane, we also performed complementary membrane interactions experiments using the quartz crystal microbalance with dissipation (QCM-D) technique43 and total internal reflection fluorescence (TIRF) microscopy.44
2. Methods
2.1. Composition of Intestinal Fluids
The intestinal fluid compositions for the simulations and in vitro experiments are presented in Table 1. Data for the components and compositions of human intestinal fluid in both fasted and fed states were taken from the study by Riethorst et al. on human duodenal fluids from 20 healthy volunteers (HVs).29 We used the data from five of the HVs in their study, as shown in Table 1. These five were selected to capture as high interindividual variability in bile components as possible, and we are using the same numbering of HVs as in the Riethorst et al. study.29,30 Note that this study is limited to the investigation of bile components, more specifically bile salts and phospholipids, and the effect on the availability and membrane incorporation of free PE monomers only. Therefore, for simplicity, we did not include the effect of pH of the systems.
Table 1. Components (in mM) of the Studied Fasted- and Fed-State Human Intestinal Fluids from Five Healthy Volunteers Used in the Simulations of This Studya.
| fasted
state |
fed
state |
||||||||||
|---|---|---|---|---|---|---|---|---|---|---|---|
| BS | PL | FFA | pHb | BS | PL | FFA | MG | DG | TG | pH | |
| HV3 | 6.5 | 0.4 | 1.5 | 6.4 | 10.8 | 4.2 | 11.1 | 8.2 | 1.4 | 0.7 | 5.8 |
| HV6 | 1.2 | 1.0 | 1.0 | 7.0 | 28.0 | 6.9 | 13.8 | 6.4 | 1.4 | 0.3 | 6.5 |
| HV9 | 6.2 | 1.8 | 3.2 | 6.9 | 13.6 | 6.5 | 44.9 | 11.8 | 2.2 | 0.8 | 6.5 |
| HV16 | 1.8 | 0.8 | 1.1 | 6.1 | 10.7 | 7.7 | 38.4 | 11.2 | 1.5 | 0.9 | 6.4 |
| HV20 | 3.8 | 0.5 | 0.5 | 6.8 | 15.4 | 4.2 | 27.2 | 12.1 | 3.2 | 1.4 | 6.5 |
| SIF | 3 | 0.75 | 6.5 | 15 | 3.8 | 5.0 | |||||
The following abbreviations are used: HV, healthy volunteer; SIF, simulated intestinal fluid; BS, bile salt; PL, phospholipid; FFA, free fatty acid; MG, monoacylglyceride; DG, diacylglyceride; and TG, triacylglyceride. The data were taken from Riethorst et al.29
The pH values mentioned in the table are also taken from Riethorst et al.29 However, we did not include the effect of pH of the systems in this study.
The bile salts from the HVs presented in Table 1 were composed of four types: sodium taurocholate (NaTC), sodium taurodeoxycholate (NaTDC), sodium glycocholate (NaGC), and sodium glycodeoxycholate (NaGDC). The ratios of these four bile salts were also obtained from Riethorst et al.29 and are presented in Table 2. For the simulated intestinal fluid, the only bile salt species was taurocholate. In total, 95% of the phospholipids secreted in bile are phosphatidylcholine or lecithin.45 Therefore, 1-palmitoyl-2-oleoyl-sn-glycero-3-phosphatidylcholine (POPC) and 1,2-dilinoleoyl-sn-glycero-3-phosphatidylcholine (DLiPC) were used to represent the phospholipids of the human and simulated intestinal fluids, respectively. Oleate (OA) (oleic acid at the deprotonated state) was used to represent the free fatty acids (FFAs) in the human intestinal fluid systems since it is the largest portion of the FFAs observed in the HIFs.29
Table 2. Ratio of Different Bile Salts for Each of the Simulated Human Intestinal Fluids Used in This Studya.
| HIF | TC | TDC | GC | GDC |
|---|---|---|---|---|
| HV3 | 13.7 | 23.2 | 25.5 | 37.5 |
| HV6 | 8.3 | 10.7 | 30.5 | 50.4 |
| HV9 | 10.2 | 17.9 | 24.8 | 47.1 |
| HV16 | 15.9 | 33.6 | 18.0 | 32.4 |
| HV20 | 11.5 | 17.6 | 28.9 | 42.0 |
2.2. Coarse-Gained Molecular Dynamics (CG-MD) Simulations
The CG-MD simulations were performed using the Martini force field46,47 for systems containing three permeability enhancers (caprylate, caprate, and SNAC) and different intestinal fluid compositions, as presented in Table 1. For the parameterization of caprylate and caprate molecules, we modified the existing Martini topology for the FFA as described and validated in Hossain et al.26 To develop the CG-SNAC model, we first generated an all-atom SNAC model with an automated parameterization process using the Charmm General Force Field (CGenFF) 1.0.0 program.48,49 This program provides penalty scores associated with partial charges and torsional bonding; penalty scores within 10–50 are judged reasonable but require further validation of the model. For the SNAC all-atom model, the maximum penalty scores were 16 and 43 for the partial charges and torsional bonds, respectively. The all-atom SNAC topology was therefore further modified using the force field toolkit developed by Mayne et al.50 The modified all-atom SNAC topology was then used to obtain the Martini CG topology following the parameterization of new molecules described on the Martini website. Parameterization of different bile salts was based on the Martini cholesterol topology as described and validated in Clulow et al.31 The topologies of phospholipid (POPC and DLiPC), oleate, diacylglyceride, and triacylglyceride molecules in our study were readily available on the Martini website. The topology of monoacylglycerides was obtained from the triacylglycerides by removing two fatty acid chains (positions 1 and 3) from the triacylglyceride molecule.
MD simulations were performed with Gromacs 2016 software using a 30 fs time step at 37 °C.51 The details of the CG-MD simulated colloidal structures formed in the intestinal fluid of the HVs presented in Table 1 have been reported in a previous study.52 Molecules, representing the molar concentrations from the five samples, were randomly distributed in a cubic simulation box of 45 nm side length using Packmol.53 Micelles were observed to be formed spontaneously during the 3 μs long simulation. In the current study, the formed micelles are simulated together with the PEs (in the deprotonated state with negatively charged headgroups) and after enclosure of the luminal compartment with model intestinal membranes. For the simulations with PEs and intestinal fluids, a cubic box with a side length of 50 nm was used. Isotropic pressure coupling with a reference pressure of 1 bar (1 bar = 100 kPa) was maintained with the Berendsen coupling method.54 For the simulations with membranes, we first simulated the fasted- and fed-state components of the simulated and human intestinal fluids for 3 μs in a simulation box with dimensions of 18.5, 18.5, and 22 nm in the x, y, and z directions, respectively. Then, we added 100 mM each PE at the end state of the intestinal fluid simulation and performed the simulation for additional 1 μs to let the system reach equilibrium.
Next, we placed the simulation box in between two identical POPC membranes to mimic a realistic system where intestinal fluids and PE components can only interact with one side of the membrane (see Supporting Figure 1). The lower membrane was placed 5 nm from the bottom of the box, and the upper membrane was placed 12 nm from the top. POPC was selected as the model lipid since phosphatidylcholine is a common phospholipid found in the plasma membrane of intestinal epithelial cells.55 The POPC membrane was generated using the method Insane developed by Wassenaar et al.56 For each membrane, 1058 POPC molecules were used with 529 molecules in each leaflet. The resulting bilayer from Insane was then equilibrated and used in the simulations. The thickness of the formed bilayer and the area per lipid for the equilibrated membrane were 4.05 nm and 0.64 nm2, respectively, at 37 °C. These values are close to the experimentally measured ones for the POPC membrane.57 The overall dimensions of the system became 18.5, 18.5, and 50 nm in the x, y, and z directions, respectively. The simulations were then performed for another 6 μs with semi-isotropic pressure coupling. Note that a smaller box size was used for the systems with membranes because we wanted to run longer simulations. Each system was energy-minimized using the steepest descent algorithm, followed by four short equilibration runs (50 000 steps) with time steps of 1, 2, 5, and 20 fs, before the final production run. A periodic boundary condition was also applied for all of the simulations.
We calculated the number of micelles and free monomers using in-house python code. Two molecules were considered to be in the same micelle if their constituent beads were within a specific cutoff distance. For the Martini model, this cutoff distance was determined to be 0.6 nm.58 To calculate the monomer insertion and expulsion events, we mapped all molecules into two different states—aggregated or free—at each time step. We then detected the molecules that changed their state between two consecutive saved configurations. Molecules that changed their state from aggregated to free were considered as expulsion events, and those that changed their state from free to aggregated were considered as insertion events. Note that in this approach we did not identify whether a molecule transferred from one micelle to another. However, since we used a smaller time step (5 ns) between two saved configurations, the occurrence of such an event, which includes the detachment of the C10 molecule from one micelle and then reattachment to another micelle, was considered highly unlikely and thus negligible.
2.3. Umbrella Sampling (US) Simulations
The potential of mean force (PMF) profiles were computed for caprate monomer expulsion from the micelle surface to the water phase using umbrella sampling (US) simulations.59 We first generated four different micelles for the US simulations (see Supporting Table 1 for the compositions). To generate the micelles, we placed the molecules constituting the micelles close to each other in a cubic box with a 5 nm side length using Packmol.53 After energy minimization and equilibration, we performed a 100 ns production run and the micelles were formed with the caprate monomer present near the shell region in each case. To perform the US simulations, a series of configurations were generated along the reaction coordinate that, in this case, was the distance from the micelle shell to the bulk water phase. We generated 20 configurations separated at a distance of 0.1 nm along the reaction coordinate. Each configuration served as the starting point for the US simulations and was energy-minimized, equilibrated for 2 ns, followed by a production run for 20 ns. To extract the potential of mean force (PMF) along the reaction coordinate from the US simulations, the weighted histogram analysis method (WHAM) implemented in Gromacs as gmx wham utility was used.60 Statistical errors were estimated from bootstrap analysis over 100 runs using a tolerance of 1 × 10⁻⁵. For comparison and further validation of the CG-SNAC parameters, US simulations were also performed to compute the PMF profile for pulling caprate and SNAC molecules from the membrane center to water phase using the all-atom Charmm force field.61 The all-atom POPC membrane was generated using the CHARMM-GUI membrane builder.62
2.4. Quartz Crystal Microbalance with Dissipation (QCM-D) Monitoring
QCM-D measurements were performed on silicon dioxide-coated QSX 303 QCM-D sensors mounted in a Q-Sense E4 system (Biolin Scientific AB, Sweden). The sensor and solution chambers were maintained at 37 ± 0.1 °C for the duration of the experiments, and the third, fifth, and seventh harmonics were recorded simultaneously for data collection. The sensors were first flushed with Tris buffer (10 mM Tris, 125 mM NaCl, 1 mM Na2EDTA, pH 7.4 adjusted with HCl) at a flow rate of 50 μL/min. POPC membrane formation was monitored for ∼10 min by incubating POPC (Avanti Lipids) vesicles (0.1 mg/mL in Tris buffer) at a continuous flow. Following rinsing, the POPC membrane was exposed to various simulated intestinal fluid conditions, with or without the presence of PEs (Supporting Table 2), for ∼30 min to allow time for the intestinal fluid components to interact with the membrane. The system was again rinsed to observe the final changes in frequency (Δf) and dissipation (ΔD).
2.5. Total Internal Reflection Fluorescence (TIRF) Microscopy
Total internal reflection fluorescence (TIRF) microscopy was performed on an inverted Eclipse Ti-E microscope (Nikon Corporation) equipped with a Perfect Focus System (PFS), a CFI Apo TIRF 100× oil objective (NA 1.49), a high-pressure mercury lamp, and an Andor Neo SCC-01322 sCMOS camera (Andor Technology). Lipid membranes were formed on a glass microscopy slide (0.13–0.16 mm thickness) in custom-made polydimethylsiloxane wells with a volume of ∼50 μL by incubating POPC vesicles (0.1 mg/mL, 10 μL) mixed with lissamine rhodamine B sulfonyl (Rh-PE, Avanti Lipids) vesicles at a ratio of 1:100. A rhodamine filter set (TRITC, Semrock) was used for visualizing the lipid membrane or POPC/Rh-PE vesicles. Lipid membrane formation was confirmed by fluorescent recovery after photobleaching (FRAP), i.e., by bleaching the rhodamine tracer lipids with a Kr–Ar mixed gas ion laser (Stabilite 2018, Spectra-Physics Lasers, Mountain View, CA) at a wavelength of 531 nm. The diffusivity of Rh-PE within the membrane was determined using a custom-written analysis software in MATLAB (MathWorks), as described by Jönsson et al.63
The impact of each PE on lipid membrane diffusivity was first established by preincubating the POPC/Rh-PE mix at various concentrations (5–80 mM) of caprylate, caprate, or SNAC, prior to membrane formation. POPC/Rh-PE/PE mixed vesicles (10 μL) were then deposited onto the glass substrate and lipid membrane formation was monitored with TIRF microscopy. The formed lipid membranes were subsequently rinsed with either buffer, FaSSIF, or FeSSIF to remove any unbound vesicles. FRAP analysis was performed in triplicate on the lipid membrane at each PE concentration, enabling the PE concentration-dependent membrane diffusivity to be derived.
Once the impact of PE incorporation on membrane diffusivity was established, POPC/Rh-PE vesicles (10 μL; in the absence of PEs) were deposited onto a glass substrate to form POPC bilayers. The POPC membrane was rinsed with Tris buffer to remove the unbound vesicles and then exposed to various SIF conditions, with or without PEs (Supporting Table 2), for 30 min. FRAP analysis was again performed on the membrane to determine any incubation effects in the SIF conditions on lipid diffusivity. It was assumed that any changes in membrane diffusivity, compared to a pure POPC membrane, were due to the incorporation of PEs within the lipid membrane.
2.6. Statistical Analysis
Statistics were performed by one-way analysis of variance (ANOVA) using Tukey’s posthoc test for multicomparison between the groups. All calculations were carried out using GraphPad Prism Version 8.2.1 (GraphPad Software Inc.).
3. Results and Discussions
3.1. Interactions of Transient Permeability Enhancers (PEs) with Intestinal Fluids (IFs)
The components of intestinal fluids form colloidal structures of various sizes and shapes. Excipients such as transient PEs may interact with the intestinal fluids as well as the mixed colloidal structures. In this study, we therefore simulated the FaHIFs from five healthy volunteers, as well as FaSSIF to investigate whether the variation in their components can influence the availability of free PE monomers. This was done as FaSSIF is a very common substitute solvent for FaHIF in experimental studies and we wanted to analyze potential similarities and differences of FaSSIF with FaHIFs in interactions with PE. We used a cubic simulation box with a side length of ∼50 nm and performed each simulation for 3 μs to allow the systems to reach an equilibrated state. To evaluate whether the system has reached equilibrium, we observed the variation in the number of micelles with the simulation time that was reported in our previous study. We found none or very few dynamic changes using this measure in the last 0.5–1 μs and hence concluded that the systems had reached equilibrium.52
For each human and simulated intestinal fluid, the numbers of mixed micelles and free bile salt monomers at the end of the simulation were different from each other due to the variation in the fluid composition. Figure 1A,B shows the snapshots of simulations at 3 μs with FaHIF from healthy volunteers HV3 and HV6. Note that in our simulations, HV3 and HV6 had the highest and lowest amount of bile salts, respectively, in the FaHIF compositions. In line with our previous study, Figure 1A,B shows the difference in number of mixed micelles and the available free bile salt monomers for the two volunteers, as a result of the variability in their FaHIF compositions.52 The size of micelles formed during the simulation ranged between 2.3 and 7.3 nm.
Figure 1.

Colloidal structures from the simulations with fasted-state human intestinal fluids (FaHIFs) and caprate. (A, B) Representative snapshots of simulations with FaHIFs from two healthy volunteers (HV3 and HV6, respectively) at 3 μs. Snapshot of the simulations for the same volunteers at 1 μs with 20 mM (C, D) and 100 mM (E, F) caprate added to the FaHIF simulations at 3 μs shown in (A, B). The amount of free caprate monomers at the end of simulations with the addition of (G) 20 mM and (H) 100 mM caprate. Each bar represents the average monomer concentration with the standard deviation (n = 3). Statistical significance was defined as p ≤ 0.05 for the one-way ANOVA test. Here, p < 0.01 and p < 0.001 are denoted with ** and ***, respectively. Note that for clarity, only p < 0.001 is shown in (G). In (H), only FeSSIF was statistically different from the other sample (p < 0.01, indicated by **). Abbreviations used: TC, taurocholate; TDC, taurodeoxycholate; GC, glycocholate; GDC, glycodeoxycholate; OA, oleate; PL, phospholipids; HV, human volunteer; FaSSIF, fasted-state simulated intestinal fluid; and FeSSIF, fed-state simulated intestinal fluid.
With each equilibrated system of intestinal fluid components, we added two concentrations of caprate: 20 mM, which is close to its CMC in water in the absence of ionic strength,26 and 100 mM, which is typically used in vivo studies to overcome the physiological variability.5 The aim of this study was to explore a low concentration (20 mM) and a high concentration (100 mM) to understand the impact of dilution in the small intestine. While local high concentration may be reached, i.e., at the 100 mM scale, dilution may quickly lower the concentrations used and hence the membrane interaction pattern may be changed. The simulations were run an additional 1 μs after the addition of the caprate to the already equilibrated HIFs, mimicking dispersion of PEs into the intestinal fluid after ingestion of e.g., a PE-containing tablet or capsule. To evaluate whether the system has reached equilibrium with respect to the available free caprate monomers, variations in the number of free caprate monomers were estimated during the simulation (Supporting Figure 2). The number of free caprate molecules reduces during the simulations and reached a plateau after 0.60 and 0.15 μs when 20 and 100 mM of caprate were added, respectively.
During the simulation, the added caprate monomers interacted with the existing mixed micelles or free bile salt monomers and either (i) coalesced with the existing micelles, (ii) formed new mixed micelles, or (iii) formed pure caprate micelles (Figure 1). Figure 1C,D shows simulations snapshots for HV3 and HV6 at 1 μs with 20 mM of caprate. The snapshots indicate that the number of free caprate monomers for HV6 was higher than for HV3, mainly because the FaHIF of HV6 contained fewer mixed micelles and free bile salt monomers as shown in Figure 1B. Therefore, the interaction of the caprate with the intestinal components was lower in HV6 than HV3, resulting in a higher number of free caprate monomers for HV6.
The sizes of the micelles formed during the simulations for all cases are summarized in Supporting Table 3. In our previous study, we reported that the size of the micelles formed with the fasted-state intestinal components alone ranged between 2.3 and 7.3 nm.52 The reported sizes were close to the lower fraction of the mixed micelles observed experimentally (10–50 nm).30 In this study, the size of the micelles is found to be ranged between 2.7 and 13.3 nm with averages between 4.1 and 5.6 nm when different concentrations of PEs are added. The increase in the maximum micelle size was due to the addition of caprate molecules. We also plotted the distribution of the aggregate sizes for all cases expressed as the aggregation number, N (Supporting Figure 3). When 20 mM caprate were added in the systems, we observed a larger peak in the range of N = 20–25 and a number of smaller peaks higher than N = 40. However, for each case, the location of the peaks and the number of peaks were different. This indicates the difference in micelle sizes among different intestinal fluids due to the variation in the fluid components. However, when 100 mM caprate was added, for all cases, the distribution profile was very similar. We mainly observe a single peak near N = 35, which corresponds to the average aggregation number for caprate alone, which is typically in the range of 34–47 measured experimentally.32,64 This suggests that, with the addition of 100 mM caprate, the systems were mainly dominated by caprate.
We then determined the amount of free caprate monomers at the end of the 1 μs simulation for all cases, and Figure 1G shows the results when 20 mM caprate were added to the systems. The number of free caprate monomers was significantly different for each case because of the variability in the number of mixed micelles and available free bile salt monomers at the end of simulations with intestinal fluids alone. In general, the systems that contained a higher amount of intestinal fluid components had a lower number of available free caprate monomers.
When 100 mM caprate was added, the snapshots at 1 μs for HV3 (Figure 1E) and HV6 (Figure 1F) showed no differences. With 100 mM caprate, the system was so dominated by caprate molecules that variations in the fasted-state intestinal fluids became negligible. Figure 1H shows the free caprate monomers at the end of the 1 μs simulation after the addition of 100 mM caprate. The available free caprate monomers were very similar to each other. Only the value for the caprate addition to FeSSIF was statistically different from the other intestinal fluids. On the other hand, the results here indicate that the fasted-state interindividual variability significantly affected the availability of the free caprate monomers at caprate concentrations near its CMC (Figure 1G). However, the difference in the fasted- and fed-state compositions clearly impacted the number of free caprate monomers irrespective of the added caprate concentrations, with fewer caprate molecules being freely dissolved in the aqueous phase in the fed state. To further increase our understanding of the PEs intestinal performance, we continued investigating the PE interaction with the intestinal fluids in the presence of cell membranes to mimic more realistic in vivo conditions.
3.2. Amount of the Transient Permeability Enhancer That Reaches the Membrane
To investigate the PEs interaction with the membrane, as described in Section 2.2, we placed the components of the intestinal fluid and 100 mM caprate in between two POPC membranes. Note that such a high concentration of caprate achieved in the GI lumen can be quickly diluted. However, it is important to understand the effect of such a high concentration on the membrane incorporation ability of caprate in the presence of fasted- and fed-state intestinal fluids. The simulations were performed for only 6 μs, and Figure 2 shows the initial snapshots of the system with POPC membranes and 100 mM caprate added to the FaHIF (Figure 2A) and FeHIF (Figure 2C) of HV3. Both snapshots indicate a number of mixed micelles and free caprate monomers in between the membranes. The mixed micelles in the system with fed-state components were larger than in the fasted-state system. This is mainly due to the large difference in the compositions of the fasted- and fed-state fluids; for HV3, the sum of all of the intestinal fluid components was five times higher in FeHIF than that in FaHIF (Table 1). During the simulations, the caprate monomers interacted with the mixed micelles as well as the lipid membranes. The system is highly dynamic. During the simulations, it becomes evident that caprate, after insertion into the mixed micelles, also can be released into the aqueous phase as free monomers. The free monomers then can come in contact with other mixed micelles, remain as free monomers, or get inserted into the cell membrane. Figure 2B,D shows the final snapshots of the simulations with FaHIF and FeHIF of HV3. The number of caprate monomers inserted into the membrane was higher in the simulation with FaHIF (Figure 2B) than that with FeHIF (Figure 2D). Table 3 shows the calculated caprate molecules inserted into the membrane at the end of a 6 μs simulation for each intestinal fluid condition. The number of inserted caprates after the simulation was 1.7–2.6 times higher in the fasted-state fluid components than that in the fed-state components. This suggests that the systems with fasted-state fluids allow more caprate to interact with the membrane, which in turn increases the caprate incorporation in the membrane.
Figure 2.
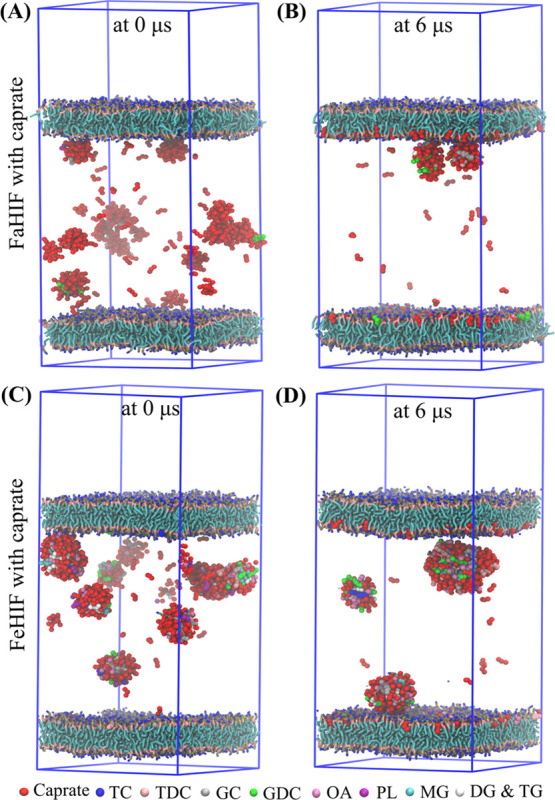
Interaction of 100 mM caprate in the presence of POPC membranes. Fasted-state human intestinal fluid (FaHIF; A and B), and fed-state human intestinal fluid (FeHIF; C and D) from human volunteer 3. Snapshots of the simulations at the initial and final time steps with (A, B) FaHIF and (C, D) FeHIF components placed between the two membranes. Abbreviations: TC, taurocholate; TDC, taurodeoxycholate; GC, glycocholate; GDC, glycodeoxycholate; OA, oleate; PL, phospholipid; MG, monoacylglyceride; DG, diacylglyceride; and TG, triacylglyceride.
Table 3. Percentage and Standard Deviation of the Transient Permeability Enhancer (PE) Inserted into or Adsorbed onto the Membrane Surface by the End of a 6 μs Simulationa.
| PE | intestinal fluid | fasted state | fed state |
|---|---|---|---|
| caprate | HV3 | 77.0 ± 0.6 | 44.7 ± 0.6 |
| HV6 | 81.4 ± 0.2 | 31.5 ± 0.1 | |
| HV9 | 71.3 ± 0.2 | 40.2 ± 0.2 | |
| HV16 | 82.0 ± 0.5 | 46.7 ± 0.2 | |
| HV20 | 74.3 ± 0.5 | 39.5 ± 0.4 | |
| simulated | 83.6 ± 0.3 | 50.7 ± 0.2 | |
| caprylate | simulated | 94.3 ± 0.3 | 51.0 ± 0.4 |
| SNAC | simulated | 25.2 ± 1.6 | 19.8 ± 1.4 |
Data is shown as mean ± SD, where mean and SD were obtained by averaging the last 30 snapshots within 5.8–6.0 μs of the simulation time. Abbreviation: HV, human volunteer.
Interestingly, despite adding a higher caprate concentration (100 mM) into the system, we found a large discrepancy in the amount of inserted caprate for different fasted-state fluid compositions. Note that in the fasted-state intestinal fluids with 100 mM caprate, the amount of available free caprate monomers was not different compared to each other as discussed in Section 3.1. However, with a membrane, variations in the fasted-state fluids become crucial because the membrane can extract caprate and hence substantially decrease its concentration in the aqueous phase. The amount of inserted caprate for different fed-state fluid compositions was also different when compared to each other. This is mainly due to the large variation in the fluid components as well as the decrease of caprate concentration in the aqueous phase during the simulation.
We also investigated the interaction of caprylate and SNAC with FaSSIF and FeSSIF between the POPC membranes. Caprylate performed similarly to caprate. During the simulations, caprylate molecules were inserted into the membrane and the number of inserted caprylate molecules was ∼1.8 times higher for FaSSIF than that for FeSSIF. Figure 3 shows how the PE molecules varied in their interactions with the membrane during the simulation. The simulations of FaSSIF with caprylate and caprate (Figure 3A) showed that the rate of insertion into the lipid bilayer plateaued faster for caprylate (2.8 μs) than that for caprate (5.8 μs). This kinetic difference is because the CMC of caprylate is higher than that of caprate, and therefore, a greater number of free caprylate monomers are immediately available to interact with the membrane. Note that the higher insertion rate does not necessarily mean that caprylate will be more efficacious than caprate. The increase in membrane fluidity is also related to the fatty acid chain length, meaning that the concentration required to increase the cell membrane fluidity decreases with the chain length.65 The profiles of the FeSSIF simulations with caprylate and caprate were similar, i.e., both compounds had similar kinetics with similar fractions being inserted (Figure 3B). The profiles of caprate and caprylate insertion increased continuously with time (Figure 3A,B), which suggests that, once inserted, the caprate and caprylate molecules remain in the membrane for the duration of the simulation period.
Figure 3.
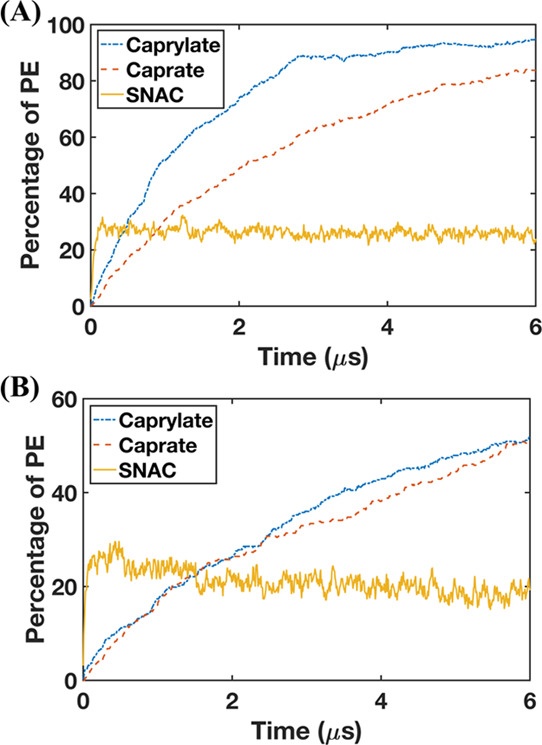
Inserted and adsorbed molecules of transient permeability enhancers (PE) on the membrane surface when 100 mM PEs is added in the systems with (A) fasted-state simulated intestinal fluid and (B) fed-state simulated intestinal fluid (n = 1).
The interaction of SNAC with the membrane was different from those of caprylate and caprate in the simulation with FaSSIF and FeSSIF. The SNAC profile quickly plateaued, i.e., the SNAC molecules reached the maximum level that could interact with the membrane. The plateau was reached within less than 0.15 μs and was thereafter oscillating during the simulation. From Figure 3, it is also evident that fewer molecules of SNAC than those of caprylate and caprate were adsorbed onto and incorporated into the membrane surface. The amount of SNAC molecules that interacted with the membrane was about 1.3 times higher for FaSSIF than that for FeSSIF. During the simulations, we also observed that the taurocholate molecules are absorbed on the membrane surface and occupy the membrane surface area. The relatively lower insertion of SNAC for FeSSIF is mainly due to the competition with a higher amount of taurocholate present in FeSSIF.
We then investigated the adsorption onto or insertion of caprate and SNAC molecules into the membrane. We calculated the average distance, d, between the membrane center (along membrane normal direction) and the center of mass for both caprate and SNAC molecules that were adsorbed on or inserted into the membrane (Supporting Figure 4b). The value of d was 1.4 nm for caprate and 1.9 nm for SNAC molecules, indicating that the center of mass of the caprate molecules was deeper inside the membrane leaflet than that of the SNAC molecules. We then calculated the average lipid tail order parameters, P2, for the inserted or absorbed fatty acid chains using the following equation
where θ is the angle between the membrane normal or the z-axis of the simulation box and the vector from two consecutive beads of the fatty acid chain (Supporting Figure 4). Note that P2 = 1 means a perfect alignment of the fatty acid chain with the z-axis and P2 = 0 means a random orientation. The P2 values for caprate were 0.6 and 0.15 for SNAC, suggesting that the SNAC molecules were mostly randomly oriented on the membrane surface, while the caprate molecules were mostly aligned with the z-axis. Overall, the values of d and P2 suggest that the caprate molecules are incorporated into the membrane during the simulation, while SNAC molecules are mostly adsorbed on the membrane surface. From this adsorbed position, they could interact either with the membrane or the aqueous phase. This is also evident in Figure 4A,B that shows the different interaction behaviors of caprate and SNAC with the membrane, respectively. Hence, our results indicate that transcellular perturbation is not the key mechanism for SNAC, whereas it is a likely mechanism of how caprylate and caprate increase permeability.
Figure 4.

Transient permeability enhancers (PEs) inserted into and adsorbed on the membrane. (A) Caprate inserted (mostly aligned vertically with the POPC molecules) into the membrane and (B) SNAC adsorbed on the membrane surface. The black circle indicates a SNAC molecule adsorbed (laying horizontally) on the membrane surface. In (A) and (B), the POPC molecules of the membrane are shown as bonded lines; caprate and SNAC are represented by beads. The blue, orange, and pink beads represent the headgroup, fatty acid chain, and salicylamide region, respectively. (C) PMF profiles obtained using all-atom molecular dynamics simulations, depicting the energy required to pull the PE molecules from the membrane center to the aqueous phase. In the PMF profiles, the lines and shaded regions represent the means and standard deviations, respectively, of triplicate simulations.
To verify the CG simulation results, we also performed umbrella sampling simulations using all-atom force fields (Section 2.3) to obtain PMF profiles associated with the pulling of caprate and SNAC molecules from the membrane center to the water phase. The free energy profiles are presented in Figure 4C. From the profiles, we calculated the energy minima, which were at 1.46 and 1.93 nm from the membrane center for caprate and SNAC profiles, respectively. The energy minima here represent the maximum probability of finding the molecules along the membrane normal direction. Interestingly, this energy minima correspond well with the calculated average distance, d, obtained from the CG simulations. Note that the value of d was 1.4 nm for caprate and 1.9 nm for SNAC molecules, respectively. Also, below the membrane headgroup region (<1.9 nm), the caprate profile always has a lower value compared to the SNAC profile. Hence, similar to the findings from CG simulations, the all-atom PMF profiles also indicated different interaction patterns for caprate and SNAC with the POPC membrane.
These findings—that SNAC is merely adsorbed on the surface of the membrane, whereas the caprate molecules are inserted into the bilayers—are in agreement with the literature. The in vitro and in vivo studies of the mode of action of caprate to improve permeability suggest that, at low concentrations, the enhancer molecules act on tight junctions and mainly enhance permeability using paracellular pathways.13,65−74At higher concentrations, caprate primarily promotes transcellular permeability by membrane perturbation.2 On the other hand, various mechanisms are proposed in the literature for how SNAC promotes permeability. Some studies suggest that SNAC improves passive transcellular permeability by forming a noncovalent complex with the drug molecules.66 Another study shows that SNAC increases the absorption of semaglutide in the stomach by increasing the local pH around the semaglutide peptide.11 It has also been implied that membrane insertion is unfavorable for SNAC due to the hydrophilic functional group of the salicylamide region.2 In a recent study by Twarog et al., the mechanisms of action of caprate and SNAC were investigated using the Caco-2 assay. They suggested that SNAC was less potent than caprate at inducing plasma membrane perturbation associated with membrane permeabilization.67 Indeed, this was observed in our simulations, where SNAC were randomly adsorbed onto the surface rather than being inserted into the phospholipid bilayer.
For the fed-state compositions, large-scale colloidal structures (i.e., droplets or large vesicles) in the scale of micrometers are also observed in experimental studies.30 The system size of the CG-MD simulations performed in this study was not large enough to observe such large-scale structures. Note that, although in the simulations with fed-state components do not produce the full range of colloidal structures typically present in the intestine, the simulations were still capable of elucidating the higher amount of caprate incorporation into the membrane in the fasted state than that in the fed state. Another simplification made in the current study is to compose a membrane of POPC only, while a typical intestinal membrane is composed of a mixture of different phospholipids and cholesterol. To which extent the variation in membrane composition further impacts caprate interaction with membrane requires further exploration and experimental validation.
3.3. Investigating the Interaction between PEs and a Lipid Membrane in the Presence of Intestinal Fluids Using QCM-D
The interaction between PEs (dispersed in FaSSIF and FeSSIF) and a lipid membrane was experimentally assessed using QCM-D (Figure 5). Briefly, QCM-D affords the ability to monitor the mass and structural changes of thin films adsorbed on the quartz crystal surface through changes in the frequency, f, and dissipation energy, D; where f relates to the mass of the adsorbed material (i.e., decreasing f = increasing mass adsorbed) and D relates to the film elasticity/rigidity (i.e., increasing D = increasing viscoelasticity).43 First, lipid bilayer formation was monitored and confirmed, prior to exposure of the membrane to PEs, as demonstrated through characteristic changes in f and D for bilayer formation, shown previously.43 That is, POPC vesicle adsorption on the silica substrate was identified after 7–8 min by an initial decrease in f, coupled with an increase in D (Figure 5, step i). The membrane formation was evidenced by a subsequent increase in f, coupled with a decrease in D, due to the vesicles rupturing and forming a rigid lipid bilayer on the sensor surface. In each case, the f and D changes corresponding to the membrane formation were ∼−25 Hz and 0.1 × 10⁻⁶ (third overtone), respectively, consistent with previous findings.43 After a buffer rinse to remove the unbound lipid vesicles, only minor changes in f and D profiles were observed.
Figure 5.
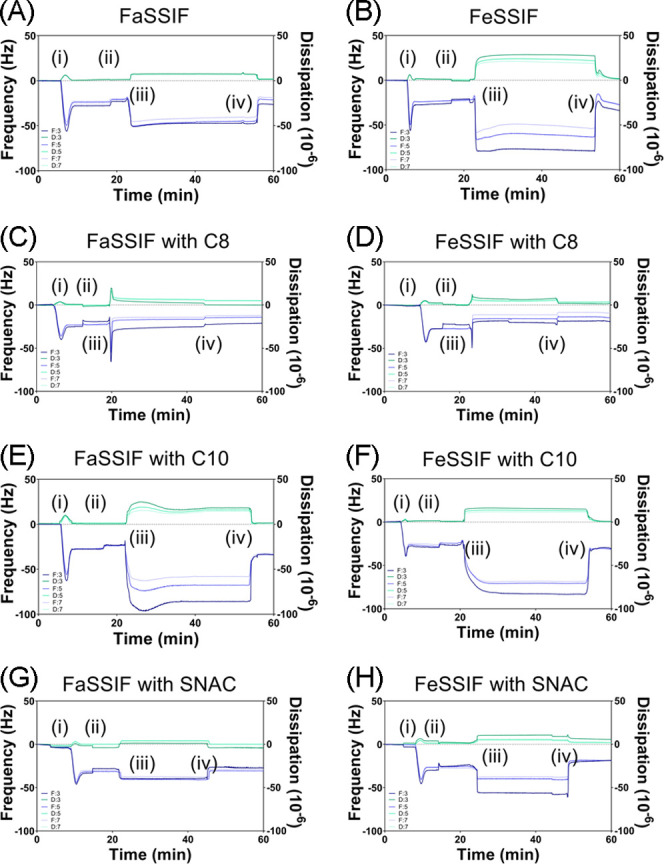
Frequency and dissipation changes at the third, fifth, and seventh harmonics at different stages of QCM-D monitoring. The following procedure was used: (i) addition of 0.1 mg/mL POPC vesicles in Tris buffer to the Q-Sense system; (ii) rinse with Tris buffer; (iii) addition of the fasted-state simulated intestinal fluid or fed-state simulated intestinal fluid in the absence (A, B) or presence (C–H) of permeability enhancers caprylate (C8), caprate (C10), and SNAC; and (iv) final rinse with Tris buffer.
After 20 min, the POPC membranes were exposed to a continuous flow of FaSSIF or FeSSIF in the presence or absence of 100 mM caprylate, caprate, or SNAC. A comparison of Figure 5A with B shows a greater initial decrease in the frequency for FeSSIF than that for FaSSIF (in the absence of PEs), which indicates greater colloidal vesicle adsorption onto the lipid membrane for FeSSIF, likely due to the increased concentration of micellar species. Further evidence of this was a greater change in dissipation for FeSSIF, demonstrating the viscoelastic adsorption of mobile vesicles.43 After a final buffer rinse, the change in frequency was twofold greater for FeSSIF than that for FaSSIF, suggesting more lipid transfer from the colloidal vesicles to the lipid membrane. For both FaSSIF and FeSSIF, only a small final change in dissipation was observed, meaning that the structural integrity of the lipid membrane was mostly maintained.
A comparison of the QCM-D profiles for FaSSIF and FeSSIF in the presence of PEs showed the variations in the adsorption mechanisms for each PE. Here, the FaSSIF and FeSSIF were preincubated with each PE, and thus, it was predicted that three micelle/vesicle population groups existed (as observed in CG-MD simulations): (i) mixed micelles/vesicles with PE included, (ii) mixed micelles/vesicles with only phospholipids and bile salts (i.e., no PE), and (iii) pure PE micelles. When 100 mM caprylate was included within FaSSIF and FeSSIF, a two-step spontaneous adsorption/fusion process was observed. Here, there was a large decrease in frequency (−48.4 Hz for FaSSIF and −27.2 Hz for FeSSIF) and an increase in dissipation. This indicates that viscoelastic vesicle adsorption onto the lipid bilayer was followed by a rapid increase in frequency and decrease in dissipation due to vesicle fusion within the bilayer. Put another way, the QCM-D profiles suggested that caprylate-rich micelles/vesicles first adsorbed onto the POPC membrane before their complete incorporation within the membrane. Since this two-phase adsorption/fusion mechanism was not evident for FaSSIF and FeSSIF in the absence of caprylate, it suggests that the fusion process is controlled by those micelles/vesicles that were mostly composed of caprylate. Furthermore, the final changes in frequency and dissipation (after a buffer rinse) highlight differences in the extent of caprylate bilayer fusion in the fed state versus fasted state, with the fasted state having a greater negative frequency (Figure 6).
Figure 6.
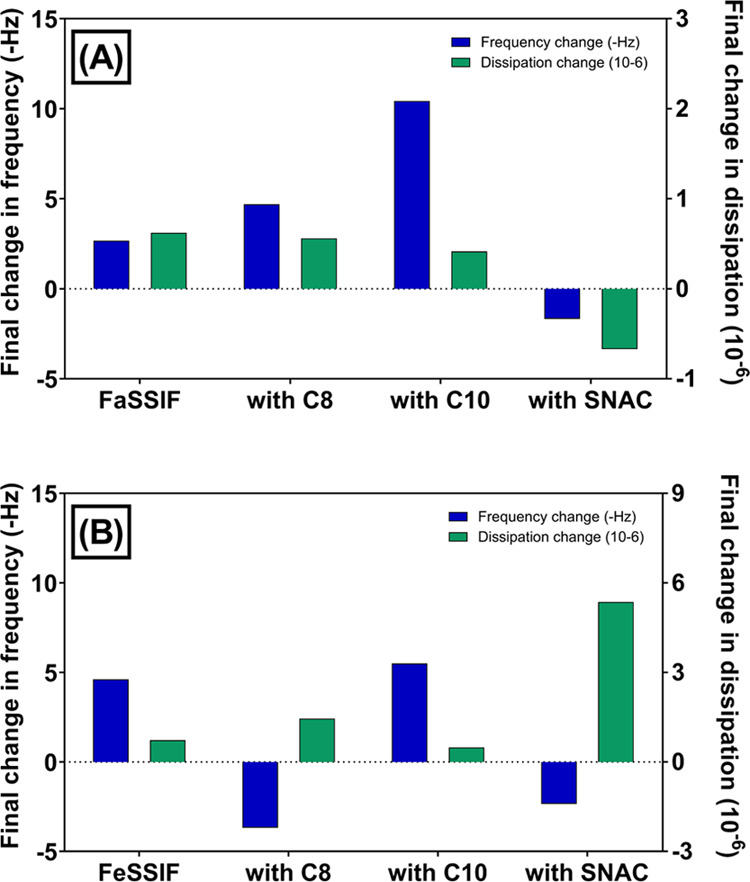
Final changes in the frequency (Δf) and dissipation (ΔD) for permeability enhancers caprylate (C8), caprate (C10), and salcaprozate sodium (SNAC) were studied in the presence or absence of (A) fasted-state simulated intestinal fluid or (B) fed-state simulated intestinal fluid. The change was obtained by subtracting the frequency and dissipation values at the end of step (iv) from the values at the end of step (ii).
QCM-D observations indicated that the adsorption and fusion mechanism for caprate varies considerably between the fed and fasted states. In the fasted state, caprate revealed a less pronounced two-step adsorption and fusion step, where the initial decrease and increase in f and D, respectively (due to vesicle adsorption), was followed by a small and prolonged increase and decrease in f and D, respectively. The rate and extent of this fusion step were considerably reduced compared to the fusion of caprylate-rich micelles/vesicles with the lipid membrane. In the fed state, however, QCM-D profiles were representative of viscoelastic adsorption of micelles/vesicles, without evidence of a clear fusion step. This suggests that under these conditions, caprate-rich vesicles adsorb onto the lipid bilayer, but the reduced availability of free caprate monomers limits the potential for membrane perturbation. The final rinse with Tris buffer removed any adsorbed vesicles on the surface of the membrane, as evidenced by an increase in f and a decrease in D. Importantly, the final change in frequency for caprate in the fasted state was >2-fold greater than in the fed state (Figure 6). This directly supports our CG-MD simulations and our hypothesis that greater exposure of caprate to the lipid membrane is induced in the fasted state.
CG-MD simulations indicated that SNAC only adsorbed onto the lipid membrane, without the presence of membrane perturbation, which was supported by one-step viscoelastic adsorption QCM-D profiles in FaSSIF and FeSSIF. SNAC also triggered a positive change in frequency in both FaSSIF and FeSSIF, which suggests that the final mass adsorbed onto the QCM-D sensor was reduced after exposure to SNAC. Furthermore, the change in dissipation for SNAC in the fed state was 4–16-fold greater than the dissipation change for FeSSIF in the presence of caprylate and caprate, respectively, indicating that a highly viscoelastic adsorbed layer formed for lipid membranes exposed to SNAC. These findings indicate that SNAC (i) poorly inserted into the lipid membrane, potentially due to a reduced affinity for the membrane, (ii) adsorbed onto the lipid membrane surface in a nonrigid manner, and/or (iii) altered the lipid packing density within the membrane due to its larger molecular size and spatial orientation compared to the translocated POPC molecules (and caprylate and caprate molecules), thus reducing the adsorbed mass and increasing membrane viscoelasticity.
3.4. Impact of PEs on Lipid Bilayer Diffusivity Studied by TIRF Microscopy
FRAP analysis was used to quantify the lipid mobility and diffusivity within a lipid bilayer supported on a silica substrate by monitoring the rate of recovery of a photobleached hole within the lipid membrane (Figure 7). The first step was to establish and validate the role of PE incorporation into lipid membranes in lipid diffusivity. To achieve this, various concentrations of PEs were preincubated with fluorescently labeled POPC vesicles prior to membrane formation. The POPC–PE mixed vesicles were deposited onto a glass substrate, which triggered vesicle fusion and the creation of POPC–PE mixed membranes. The known concentrations of PEs used for lipid bilayer formation ranged between 5 and 80 mM since bilayer formation was not possible for all PEs at concentrations exceeding 80 mM. A PE concentration-dependent effect on lipid membrane diffusivity was evident for caprylate, caprate, and SNAC (Figure 7A–C). That is, lipid diffusivity increased in a linear concentration-dependent manner for increasing concentrations of caprylate (Figure 7A) and caprate (Figure 7B), after the lipid membrane was rinsed with buffer, FaSSIF, and FeSSIF. This is in agreement with previous studies that demonstrate that the insertion of saturated fatty acids into lipid membranes increases packing density and the reduced molecular size of lipids reduces membrane viscosity.68,69 Subsequently, the kinetic and thermal energy required to promote lipid mobility is also reduced.70 In contrast, lipid diffusivity decreased in a concentration-dependent manner, in all conditions, when hybrid membranes were formed with SNAC and POPC (Figure 7C). It has been hypothesized that the steric hindrance associated with the larger molecular size and reduced degree of saturation of SNAC increases membrane disorder and thus impedes lipid mobility within the membrane.69
Figure 7.
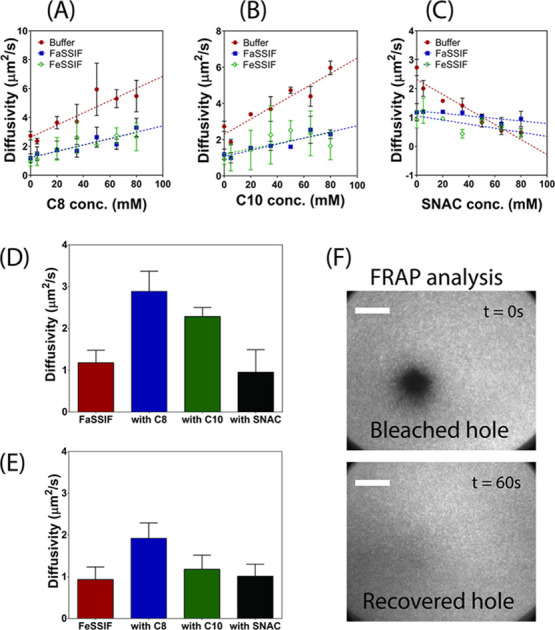
PE concentration-dependent diffusivity of lipid membranes. Varying concentrations of caprylate (C8; A), caprate (C10; B), and SNAC (C) were preincubated with POPC prior to lipid membrane formation. The resultant hybrid POPC–PE lipid membranes were then rinsed with buffer, fasted-state simulated intestinal fluid (FaSSIF), or fed-state simulated intestinal fluid (FeSSIF), and the diffusivity was measured using FRAP analysis. Following this, pure POPC membranes were formed and incubated with 100 mM PE in FaSSIF and FeSSIF. After 30 min incubation, FRAP analysis was performed, and diffusivity measurements of the incubated membranes are shown in (D) and (E), respectively. Data represents mean ± SD (n = 3). (F) TIRF micrographs demonstrating the fluorescent recovery of a bleached hole within the lipid bilayer incubated with buffer and no PEs. Scale bars: 20 μm.
Once the role of PE concentration in lipid diffusivity was established (using hybrid POPC–PE membranes), pure POPC membranes were formed and subsequently incubated in SIF media containing 100 mM caprylate, caprate, or SNAC. After 30 min incubation, FRAP analysis was performed to determine the changes in membrane diffusivity as a result of exposure to PEs. It was assumed that any changes to membrane diffusivity would be linked with PE inclusion within the POPC membrane. As demonstrated in Figure 7D, the diffusivity of the lipid membrane was 2.5- to 3-fold greater when caprylate and caprate were incubated with FaSSIF, compared to incubation with FaSSIF alone. Since the concentration-dependent studies (Figure 7A–C) proved that caprylate and caprate increased membrane diffusivity, the increase in diffusivity of the pure POPC membrane following PE incubation can therefore be attributed to caprylate and caprate insertion into the lipid membrane. However, the degree of diffusivity enhancement when caprylate and caprate were incubated with FeSSIF was considerably reduced compared to that when included in FaSSIF. Again, this suggests that more caprylate and caprate was inserted into the lipid bilayer in the fasted state, compared to the fed state. Importantly, incubation of the POPC membrane with caprylate was shown to increase diffusivity to a greater degree than caprate, in both FaSSIF and FeSSIF, and thus, it can be assumed that a greater amount of caprylate is capable of being incorporated into the membrane, which is hypothesized to be due to caprylate having a more optimal chain length for membrane insertion. For SNAC, no significant change in diffusivity was observed in either the fasted or fed state, which further suggests that SNAC has a reduced ability to be inserted into the POPC bilayer. Thus, these findings using TIRF microscopy directly support our CG-MD simulations and QCM-D findings, in that (i) both caprylate and caprate inserted into the lipid membrane, (ii) caprylate and caprate inserted into the membrane at a higher extent in fasted-state conditions, (iii) caprylate inserted into the membrane to a higher extent than caprate in both FaSSIF and FeSSIF, and (iv) SNAC showed a poor ability to be inserted into the lipid membrane in both FaSSIF and FeSSIF.
3.5. Molecular Understanding of Variable PE Delivery into the Membrane
3.5.1. Micelle Kinetics
For systems with relatively smaller head–tail surfactant molecules, such as bile salts, the dominant process in micelle kinetics is the monomer insertion and expulsion, although occasional fission and fusion of micelles can also be involved.42,71 These insertion and expulsion rates depend on the micelle size and their composition.42 To explore the role of micelle kinetics for caprate in the FaSSIF and FeSSIF components—when it was placed between the POPC membrane—we calculated the insertion or expulsion events occurring from the micelles. These events are shown in Figure 8. For the FaSSIF system, the average caprate insertion and expulsion events were 2.3 and 2.1 times higher, respectively, than those for FeSSIF.
Figure 8.
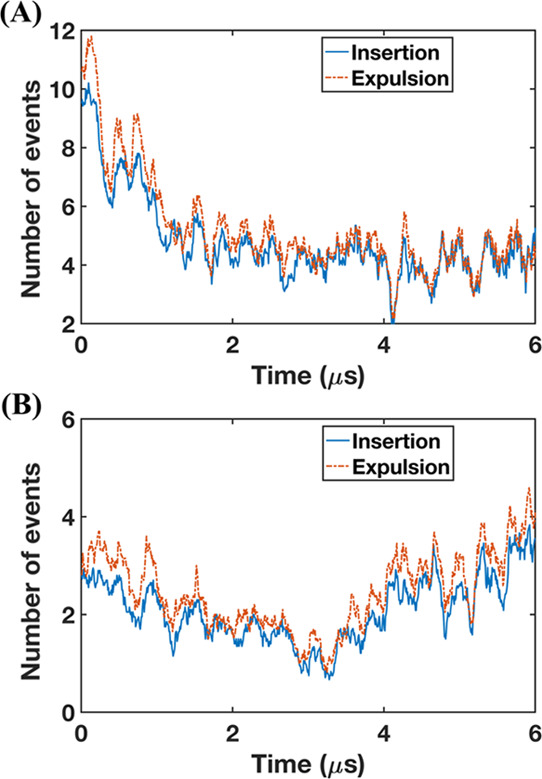
Number of insertion and expulsion events of caprate monomers during the simulation using simulated intestinal fluids. (A) Fasted-state simulated intestinal fluid (FaSSIF) and (B) fed-state simulated intestinal fluid (FeSSIF) with 100 mM caprate placed between two model cell membranes.
Furthermore, for both FaSSIF and FeSSIF, the caprate expulsion events are slightly higher than the insertion ones. Note that, in an equilibrium state, the insertion and expulsion events are supposedly similar.41,42 However, the caprate insertion into the membrane changes the overall equilibrium of the system. Over time, less caprate is available for inclusion into the micelles, resulting in lower insertion. This also suggests that, at any instance, the extraction compartment can interact with the total amount of free caprate monomers—including the monomers released from the micelles in the system. Therefore, the caprate insertion into the membrane is affected by the insertion and expulsion processes of the micelle kinetics.
3.5.2. Micelle Composition
To understand the effect of micelle composition on the insertion and expulsion of caprate, we explored how different components affected a single expulsion event of a caprate monomer. We calculated the potential of mean force (PMF) using umbrella sampling (US) simulations. The PMF calculation was associated with the change in the caprate molecule distance from the mixed micelle surface to the water phase, which mimics a typical expulsion event. Micelles with different compositions (Figure 9A and Supporting Table 1) were used for the US simulations. The PMF profiles for all four micelles presented in Figure 9B showed similar patterns. The PMF values were close to zero at the water phase and decreased as the caprate molecules insert into the shell region of the micelles. Note that the PMF profile for expulsion or desorption of a surfactant from a micelle, using the US with WHAM, often shows a decrease at a higher distance from the micelle due to an entropic effect.72 A phase volume correction is therefore required using PMFcorrected = PMFOriginal + kT (ln R). However, since we did not see such a decrease in our PMF profiles, we did not apply this correction.
Figure 9.

Potential mean force (PMF) profiles observed when pulling caprate through typical micelles observed in the fasted human intestinal fluid and caprate micelle. (A) Snapshots of the micelles consisting of different components found in the intestinal fluids with one caprate (red) attached to the surface. (B) PMF profiles depicting the energy required to pull the caprate molecule from the surface of the micelle into the aqueous phase. In the PMF profiles, the lines and shaded regions represents the means and standard deviations, respectively (n = 3). Abbreviations: PL, phospholipid; OA, oleate; BS, bile salts; C10, caprate.
From the PMF profiles, we estimated the free energy difference, ΔG, required to move a caprate molecule from the micelle surface to the water phase. ΔG values were 3.2, 3.5, 4.3, and 4.5 kcal/mol for the bile salts, caprate, oleate, and mixed micelles, respectively. Note that a lower ΔG value favors the insertion and expulsion of a caprate molecule from the micelle surface. Therefore, a bile salt micelle is the most favorable for the monomer insertion and expulsion event for the caprate monomer. For the caprate, oleate, and mixed bile salt–phospholipid micelles with a 4:1 ratio, the ΔG value increases by about 1.1, 1.3, and 1.4 times, respectively, compared to the bile salt micelles. This suggests that the micelle composition can affect the caprate monomer expulsion from the micelle surface. Also, among the typical intestinal fluid components, the presence of more phospholipids in the intestinal fluid increases the number of phospholipids in the mixed micelles or pure phospholipid vesicles. This subsequently decreases the caprate monomer expulsion and insertion events. Overall, the results in this section also indicate that caprate will interact with the membrane in a more dynamic manner in the presence of FaSSIF than FeSSIF.
Conclusions
In this work, we used CG-MD to study the effect of bile composition on the ability of membrane incorporation of PEs. Free caprate monomers were more available in the fasted-state fluids than the fed-state fluids. We then investigated the interaction of three PEs—caprylate, caprate, and SNAC—with a model cell membrane in the presence of human and simulated bile compositions. Thereafter, we estimated the number of free PE monomers interacting with the membrane. The results revealed that caprylate and caprate were incorporated into the membrane. The amount of caprylate and caprate incorporated into the membrane in the presence of FaSSIF was 1.7–2.6-fold higher than when dispersed in FeSSIF. In contrast, SNAC molecules were mainly adsorbed onto the membrane surface. Also, this interaction was more pronounced in FaSSIF than FeSSIF.
These in silico results were verified using QCM-D and TIRF microscopy. QCM-D showed that a large amount of caprylate and caprate was incorporated into the membrane, whereas SNAC was only adsorbed onto the lipid membrane surface. The amount of incorporated caprate in the FaSSIF was about 2 times higher than in the FeSSIF. TIRF microscopy indicated that the lipid diffusivity increased in a concentration-dependent manner for caprylate and caprate and the diffusivity of the membrane was 2.5–3-fold greater when caprylate and caprate were incorporated with FaSSIF than with FaSSIF. SNAC behaved differently, i.e., lipid diffusivity decreased in a concentration-dependent manner, with no significant change in diffusivity for FaSSIF or FeSSIF.
Both QCM-D and TIRF microscopy results were in agreement with our CG-MD findings, which suggests that transmembrane perturbation is a key mechanism by which caprylate and caprate increase permeability. Further, bile composition can affect the ability of caprylate and caprate to perturb the membrane. The simulation and experimental results also showed that the transcellular perturbation was not the mode of action for SNAC and that bile composition did not affect SNAC interaction with the membrane. Finally, the CG-MD simulations in this study revealed that the composition of the micelles present in the system can affect the number of caprate monomers inserted into or expelled from the micelle surface, which in turn affects the caprate insertion into the membrane.
Acknowledgments
We gratefully acknowledge the discussion and insights provided by the industrial partners of this project: Nigel Davies (AstraZeneca), Andreas Hugerth (Ferring), Jens Landström (Orexo), Lindvi Gudmundsdotter (Affibody), and Bengt Dahlström (CTC). The computation/data handling was enabled by resources provided by the Swedish National Infrastructure for Computing (SNIC) at the Uppsala Multidisciplinary Center for Advanced Computational Science (UPPMAX), the Center for High Performance Computing (PDC), and the High-Performance Computing Center North (HPC2N) partially funded by the Swedish Research Council (grant agreement no. 2018-05973).
Supporting Information Available
The Supporting Information is available free of charge at https://pubs.acs.org/doi/10.1021/acs.molpharmaceut.0c00668.
Simulation system used to study the interaction of PEs, bile components, and membranes; distribution of the micelle sizes from the simulations of different intestinal fluids with the addition of caprate; composition details of the four different micelles in the US simulations; and QCM-D experiments using different combinations of fasted- and fed-state simulated intestinal fluids and permeability enhancers (PDF)
This study is part of the science program of the Swedish Drug Delivery Forum (SDDF) and received financial support from Vinnova (Dnr 2017-02690), European Research Council (grant 638965), and Swedish Research Council (grant 2014-3309). ÅForsk Foundation (16-463) is gratefully acknowledged for the postdoctoral fellowship support and funding to Paul Joyce. We also acknowledge funding from NordForsk for the Nordic University Hub project #85352 (Nordic POP, Patient-Oriented Products).
The authors declare no competing financial interest.
Supplementary Material
References
- Maher S.; Brayden D. J.; Casettari L.; Illum L. Application of Permeation Enhancers in Oral Delivery of Macromolecules: An Update. Pharmaceutics 2019, 11, 41. 10.3390/pharmaceutics11010041. [DOI] [PMC free article] [PubMed] [Google Scholar]
- Twarog C.; Fattah S.; Heade J.; Maher S.; Fattal E.; Brayden D. J. Intestinal Permeation Enhancers for Oral Delivery of Macromolecules: A Comparison between Salcaprozate Sodium (SNAC) and Sodium Caprate (C 10). Pharmaceutics 2019, 11, 78. 10.3390/pharmaceutics11020078. [DOI] [PMC free article] [PubMed] [Google Scholar]
- Maher S.; Leonard T. W.; Jacobsen J.; Brayden D. J. Safety and Efficacy of Sodium Caprate in Promoting Oral Drug Absorption: From in Vitro to the Clinic. Adv. Drug Delivery Rev. 2009, 61, 1427–1449. 10.1016/j.addr.2009.09.006. [DOI] [PubMed] [Google Scholar]
- Leonard T. W.; Lynch J.; McKenna M. J.; Brayden D. J. Promoting Absorption of Drugs in Humans Using Medium-Chain Fatty Acid-Based Solid Dosage Forms: GIPET. Expert Opin. Drug Delivery 2006, 3, 685–692. 10.1517/17425247.3.5.685. [DOI] [PubMed] [Google Scholar]
- Walsh E. G.; Adamczyk B. E.; Chalasani K. B.; Maher S.; O’Toole E. B.; Fox J. S.; Leonard T. W.; Brayden D. J. Oral Delivery of Macromolecules: Rationale Underpinning Gastrointestinal Permeation Enhancement Technology (GIPET). Ther. Delivery 2011, 2, 1595–1610. 10.4155/tde.11.132. [DOI] [PubMed] [Google Scholar]
- Aungst B. J. Absorption Enhancers: Applications and Advances. AAPS J. 2012, 14, 10–18. 10.1208/s12248-011-9307-4. [DOI] [PMC free article] [PubMed] [Google Scholar]
- Tillman L. G.; Geary R. S.; Hardee G. E. Oral Delivery of Antisense Oligonucleotides in Man. J. Pharm. Sci. 2008, 97, 225–236. 10.1002/jps.21084. [DOI] [PubMed] [Google Scholar]
- Halberg I. B.; Lyby K.; Wassermann K.; Heise T.; Zijlstra E.; Plum-Mörschel L. Efficacy and Safety of Oral Basal Insulin versus Subcutaneous Insulin Glargine in Type 2 Diabetes: A Randomised, Double-Blind, Phase 2 Trial. Lancet Diabetes Endocrinol.. 2019, 7, 179–188. 10.1016/S2213-8587(18)30372-3. [DOI] [PubMed] [Google Scholar]
- Tuvia S.; Pelled D.; Marom K.; Salama P.; Levin-Arama M.; Karmeli I.; Idelson G. H.; Landau I.; Mamluk R. A Novel Suspension Formulation Enhances Intestinal Absorption of Macromolecules via Transient and Reversible Transport Mechanisms. Pharm. Res. 2014, 31, 2010–2021. 10.1007/s11095-014-1303-9. [DOI] [PMC free article] [PubMed] [Google Scholar]
- Leonard T. W.; Lynch J.; McKenna M. J.; Brayden D. J. Promoting Absorption of Drugs in Humans Using Medium-Chain Fatty Acid-Based Solid Dosage Forms: GIPET. Expert Opin. Drug Delivery 2006, 3, 685–692. 10.1517/17425247.3.5.685. [DOI] [PubMed] [Google Scholar]
- Buckley S. T.; Vegge A.; Pyke C.; Ahnfelt-Rønne J.; Madsen K. G.; Schéele S. G.; Alanentalo T.; Kirk R. K.; Pedersen B. L.; Skyggebjerg R. B.; et al. Transcellular Stomach Absorption of a Derivatized Glucagon-like Peptide-1 Receptor Agonist. Sci. Transl. Med. 2018, 10, eaar7047 10.1126/scitranslmed.aar7047. [DOI] [PubMed] [Google Scholar]
- Wang X.; Maher S.; Brayden D. J. Rapid Restoration of the Colonic Epithelium of Rats after in Situ Instillation of the Absorption Promoter, Sodium Caprate. Ther. Delivery 2010, 1, 75–82. 10.4155/tde.10.5. [DOI] [PubMed] [Google Scholar]
- Brayden D. J.; Gleeson J.; Walsh E. G. A Head-to-Head Multi-Parametric High Content Analysis of a Series of Medium Chain Fatty Acid Intestinal Permeation Enhancers in Caco-2 Cells. Eur. J. Pharm. Biopharm. 2014, 88, 830–839. 10.1016/j.ejpb.2014.10.008. [DOI] [PubMed] [Google Scholar]
- Mori K. Production of Gastric Lesions on the Rat by the Diet Containing Fatty Acids. Gann 1953, 44, 427. 10.20772/cancersci1907.44.4_421. [DOI] [PubMed] [Google Scholar]
- Aroda V. R.; Rosenstock J.; Terauchi Y.; Altuntas Y.; Lalic N. M.; Villegas E. C. M.; Jeppesen O. K.; Christiansen E.; Hertz C. L.; Haluzík M. PIONEER 1: Randomized Clinical Trial of the Efficacy and Safety of Oral Semaglutide Monotherapy in Comparison with Placebo in Patients with Type 2 Diabetes. Diabetes Care 2019, 42, 1724–1732. 10.2337/dc19-0749. [DOI] [PubMed] [Google Scholar]
- Rodbard H. W.; Rosenstock J.; Canani L. H.; Deerochanawong C.; Gumprecht J.; Lindberg SØ.; Lingvay I.; Søndergaard A. L.; Treppendahl M. B.; Montanya E. Oral Semaglutide versus Empagliflozin in Patients with Type 2 Diabetes Uncontrolled on Metformin: The PIONEER 2 Trial. Diabetes Care 2019, 42, 2272–2281. 10.2337/dc19-0883. [DOI] [PubMed] [Google Scholar]
- Rosenstock J.; Allison D.; Birkenfeld A. L.; Blicher T. M.; Deenadayalan S.; Jacobsen J. B.; Serusclat P.; Violante R.; Watada H.; Davies M. Effect of Additional Oral Semaglutide vs Sitagliptin on Glycated Hemoglobin in Adults with Type 2 Diabetes Uncontrolled with Metformin Alone or with Sulfonylurea: The PIONEER 3 Randomized Clinical Trial. JAMA, J. Am. Med. Assoc. 2019, 321, 1466–1480. 10.1001/jama.2019.2942. [DOI] [PMC free article] [PubMed] [Google Scholar]
- Pratley R.; Amod A.; Hoff S. T.; Kadowaki T.; Lingvay I.; Nauck M.; Pedersen K. B.; Saugstrup T.; Meier J. J. Oral Semaglutide versus Subcutaneous Liraglutide and Placebo in Type 2 Diabetes (PIONEER 4): A Randomised, Double-Blind, Phase 3a Trial. Lancet 2019, 394, 39–50. 10.1016/S0140-6736(19)31271-1. [DOI] [PubMed] [Google Scholar]
- Mosenzon O.; Blicher T. M.; Rosenlund S.; Eriksson J. W.; Heller S.; Hels O. H.; Pratley R.; Sathyapalan T.; Desouza C.; Abramof R.; et al. Efficacy and Safety of Oral Semaglutide in Patients with Type 2 Diabetes and Moderate Renal Impairment (PIONEER 5): A Placebo-Controlled, Randomised, Phase 3a Trial. Lancet Diabetes Endocrinol. 2019, 7, 515–527. 10.1016/S2213-8587(19)30192-5. [DOI] [PubMed] [Google Scholar]
- Husain M.; Birkenfeld A. L.; Donsmark M.; Dungan K.; Eliaschewitz F. G.; Franco D. R.; Jeppesen O. K.; Lingvay I.; Mosenzon O.; Pedersen S. D.; et al. Oral Semaglutide and Cardiovascular Outcomes in Patients with Type 2 Diabetes. N. Engl. J. Med. 2019, 381, 841–851. 10.1056/NEJMoa1901118. [DOI] [PubMed] [Google Scholar]
- Pieber T. R.; Bode B.; Mertens A.; Cho Y. M.; Christiansen E.; Hertz C. L.; Wallenstein S. O. R.; Buse J. B.; Akın S.; Aladağ N.; et al. Efficacy and Safety of Oral Semaglutide with Flexible Dose Adjustment versus Sitagliptin in Type 2 Diabetes (PIONEER 7): A Multicentre, Open-Label, Randomised, Phase 3a Trial. Lancet Diabetes Endocrinol. 2019, 7, 528–539. 10.1016/S2213-8587(19)30194-9. [DOI] [PubMed] [Google Scholar]
- Zinman B.; Aroda V. R.; Buse J. B.; Cariou B.; Harris S. B.; Hoff S. T.; Pedersen K. B.; Tarp-Johansen M. J.; Araki E. Efficacy, Safety, and Tolerability of Oral Semaglutide versus Placebo Added to Insulin with or without Metformin in Patients with Type 2 Diabetes: The PioNEER 8 Trial. Diabetes Care 2019, 42, 2262–2271. 10.2337/dc19-0898. [DOI] [PMC free article] [PubMed] [Google Scholar]
- Yamada Y.; Katagiri H.; Hamamoto Y.; Deenadayalan S.; Navarria A.; Nishijima K.; Seino Y.; Fukushima Y.; Hamamoto Y.; Hisatomi A.; et al. Dose-Response, Efficacy, and Safety of Oral Semaglutide Monotherapy in Japanese Patients with Type 2 Diabetes (PIONEER 9): A 52-Week, Phase 2/3a, Randomised, Controlled Trial. Lancet Diabetes Endocrinol. 2020, 8, 377–391. 10.1016/S2213-8587(20)30075-9. [DOI] [PubMed] [Google Scholar]
- Yabe D.; Nakamura J.; Kaneto H.; Deenadayalan S.; Navarria A.; Gislum M.; Inagaki N.; Arisaka T.; Asakura T.; Azuma N.; et al. Safety and Efficacy of Oral Semaglutide versus Dulaglutide in Japanese Patients with Type 2 Diabetes (PIONEER 10): An Open-Label, Randomised, Active-Controlled, Phase 3a Trial. Lancet Diabetes Endocrinol. 2020, 8, 392–406. 10.1016/S2213-8587(20)30074-7. [DOI] [PubMed] [Google Scholar]
- Novo Nordisk Inc. Rybelsus Prescribing Information. https://www.accessdata.fda.gov/drugsatfda_docs/label/2019/213051s000lbl.pdf (accessed Aug 9, 2020).
- Hossain M. S.; Berg S.; Bergström C. A. S.; Larsson P. Aggregation Behavior of Medium Chain Fatty Acids Studied by Coarse-Grained Molecular Dynamics Simulation. AAPS PharmSciTech 2019, 20, 61. 10.1208/s12249-018-1289-4. [DOI] [PMC free article] [PubMed] [Google Scholar]
- Roos C.; Dahlgren D.; Sjögren E.; Sjöblom M.; Hedeland M.; Lennernäs H. Effects of Absorption-Modifying Excipients on Jejunal Drug Absorption in Simulated Fasted and Fed Luminal Conditions. Eur. J. Pharm. Biopharm. 2019, 142, 387–395. 10.1016/j.ejpb.2019.07.012. [DOI] [PubMed] [Google Scholar]
- Gradauer K.; Nishiumi A.; Unrinin K.; Higashino H.; Kataoka M.; Pedersen B. L.; Buckley S. T.; Yamashita S. Interaction with Mixed Micelles in the Intestine Attenuates the Permeation Enhancing Potential of Alkyl-Maltosides. Mol. Pharmaceutics 2015, 12, 2245–2253. 10.1021/mp500776a. [DOI] [PubMed] [Google Scholar]
- Riethorst D.; Mols R.; Duchateau G.; Tack J.; Brouwers J.; Augustijns P. Characterization of Human Duodenal Fluids in Fasted and Fed State Conditions. J. Pharm. Sci. 2016, 105, 673–681. 10.1002/jps.24603. [DOI] [PubMed] [Google Scholar]
- Riethorst D.; Baatsen P.; Remijn C.; Mitra A.; Tack J.; Brouwers J.; Augustijns P. An In-Depth View into Human Intestinal Fluid Colloids: Intersubject Variability in Relation to Composition. Mol. Pharmaceutics 2016, 13, 3484–3493. 10.1021/acs.molpharmaceut.6b00496. [DOI] [PubMed] [Google Scholar]
- Clulow A. J.; Parrow A.; Hawley A.; Khan J.; Pham A. C.; Larsson P.; Bergström C. A. S.; Boyd B. J. Characterization of Solubilizing Nanoaggregates Present in Different Versions of Simulated Intestinal Fluid. J. Phys. Chem. B 2017, 121, 10869–10881. 10.1021/acs.jpcb.7b08622. [DOI] [PMC free article] [PubMed] [Google Scholar]
- Rodríguez-Pulido A.; Casado A.; Muñoz-Úubeda M.; Junquera E.; Aicart E. Experimental and Theoretical Approach to the Sodium Decanoate-Dodecanoate Mixed Surfactant System in Aqueous Solution. Langmuir 2010, 26, 9378–9385. 10.1021/la100373r. [DOI] [PubMed] [Google Scholar]
- Heerklotz H. Interactions of Surfactants with Lipid Membranes. Q. Rev. Biophys. 2008, 41, 205–264. 10.1017/S0033583508004721. [DOI] [PubMed] [Google Scholar]
- Bennett W. F. D.; Chen A. W.; Donnini S.; Groenhof G.; Tieleman D. P. Constant PH Simulations with the Coarse-Grained MARTINI Model — Application to Oleic Acid Aggregates. Can. J. Chem. 2013, 91, 839–846. 10.1139/cjc-2013-0010. [DOI] [Google Scholar]
- Janke J. J.; Bennett W. F. D.; Tieleman D. P. Oleic Acid Phase Behavior from Molecular Dynamics Simulations. Langmuir 2014, 30, 10661–10667. 10.1021/la501962n. [DOI] [PubMed] [Google Scholar]
- Warren D. B.; McPhee E.; Birru W. A.; Benameur H.; Chalmers D. K.; Pouton C. W. Location of Solvated Probe Molecules Within Nonionic Surfactant Micelles Using Molecular Dynamics. J. Pharm. Sci. 2019, 108, 205–213. 10.1016/j.xphs.2018.10.055. [DOI] [PubMed] [Google Scholar]
- Dai X.; Yin Q.; Wan G.; Wang R.; Shi X.; Qiao Y. Effects of Concentrations on the Transdermal Permeation Enhancing Mechanisms of Borneol: A Coarse-Grained Molecular Dynamics Simulation on Mixed-Bilayer Membranes. Int. J. Mol. Sci. 2016, 17, 1349. 10.3390/ijms17081349. [DOI] [PMC free article] [PubMed] [Google Scholar]
- Gupta R.; Rai B. Molecular Dynamics Simulation Study of Translocation of Fullerene C60 through Skin Bilayer: Effect of Concentration on Barrier Properties. Nanoscale 2017, 9, 4114–4127. 10.1039/C6NR09186E. [DOI] [PubMed] [Google Scholar]
- Gupta R.; Dwadasi B. S.; Rai B.; Mitragotri S. Effect of Chemical Permeation Enhancers on Skin Permeability: In Silico Screening Using Molecular Dynamics Simulations. Sci. Rep. 2019, 9, 1456 10.1038/s41598-018-37900-0. [DOI] [PMC free article] [PubMed] [Google Scholar]
- Burov S. V.; Vanin A. A.; Brodskaya E. N. Principal Role of the Stepwise Aggregation Mechanism in Ionic Surfactant Solutions near the Critical Micelle Concentration. Molecular Dynamics Study. J. Phys. Chem. B 2009, 113, 10715–10720. 10.1021/jp9025305. [DOI] [PubMed] [Google Scholar]
- Mysona J. A.; McCormick A. V.; Morse D. C. Simulation of Diblock Copolymer Surfactants. II. Micelle Kinetics. Phys. Rev. E 2019, 100, 012603 10.1103/PhysRevE.100.012603. [DOI] [PubMed] [Google Scholar]
- Vila Verde A.; Frenkel D. Kinetics of Formation of Bile Salt Micelles from Coarse-Grained Langevin Dynamics Simulations. Soft Matter 2016, 12, 5172–5179. 10.1039/C6SM00763E. [DOI] [PubMed] [Google Scholar]
- Cho N. J.; Frank C. W.; Kasemo B.; Höök F. Quartz Crystal Microbalance with Dissipation Monitoring of Supported Lipid Bilayers on Various Substrates. Nat. Protoc. 2010, 5, 1096–1106. 10.1038/nprot.2010.65. [DOI] [PubMed] [Google Scholar]
- Tabaei S. R.; Rabe M.; Zhdanov V. P.; Cho N. J.; Höök F. Single Vesicle Analysis Reveals Nanoscale Membrane Curvature Selective Pore Formation in Lipid Membranes by an Antiviral α-Helical Peptide. Nano Lett. 2012, 12, 5719–5725. 10.1021/nl3029637. [DOI] [PubMed] [Google Scholar]
- van Berge Henegouwen G. P.; van der Werf S. D. J.; Ruben A. T. Fatty Acid Composition of Phospholipids in Bile in Man: Promoting Effect of Deoxycholate on Arachidonate. Clin. Chim. Acta 1987, 165, 27–37. 10.1016/0009-8981(87)90215-4. [DOI] [PubMed] [Google Scholar]
- Marrink S. J.; de Vries A. H.; Mark A. E. Coarse Grained Model for Semiquantitative Lipid Simulations. J. Phys. Chem. B 2004, 108, 750–760. 10.1021/jp036508g. [DOI] [Google Scholar]
- Marrink S. J.; Risselada H. J.; Yefimov S.; Tieleman D. P.; De Vries A. H. The MARTINI Force Field: Coarse Grained Model for Biomolecular Simulations. J. Phys. Chem. B 2007, 111, 7812–7824. 10.1021/jp071097f. [DOI] [PubMed] [Google Scholar]
- Vanommeslaeghe K.; MacKerell A. D. Automation of the CHARMM General Force Field (CGenFF) I: Bond Perception and Atom Typing. J. Chem. Inf. Model. 2012, 52, 3144–3154. 10.1021/ci300363c. [DOI] [PMC free article] [PubMed] [Google Scholar]
- Vanommeslaeghe K.; Raman E. P.; MacKerell A. D. Automation of the CHARMM General Force Field (CGenFF) II: Assignment of Bonded Parameters and Partial Atomic Charges. J. Chem. Inf. Model. 2012, 52, 3155–3168. 10.1021/ci3003649. [DOI] [PMC free article] [PubMed] [Google Scholar]
- Mayne C. G.; Saam J.; Schulten K.; Tajkhorshid E.; Gumbart J. C. Rapid Parameterization of Small Molecules Using the Force Field Toolkit. J. Comput. Chem. 2013, 34, 2757–2770. 10.1002/jcc.23422. [DOI] [PMC free article] [PubMed] [Google Scholar]
- Abraham M. J.; Murtola T.; Schulz R.; Páll S.; Smith J. C.; Hess B.; Lindah E. Gromacs: High Performance Molecular Simulations through Multi-Level Parallelism from Laptops to Supercomputers. SoftwareX 2015, 1–2, 19–25. 10.1016/j.softx.2015.06.001. [DOI] [Google Scholar]
- Parrow A.; Larsson P.; Augustijns P.; Bergström C. A. S.. Molecular Dynamics Simulations on Interindividual Variability of Intestinal Fluids: Impact on Drug Solubilization Mol. Pharmaceutics 2020, 10.1021/acs.molpharmaceut.0c00588. [DOI] [PMC free article] [PubMed]
- Martínez L.; Andrade R.; Birgin E. G.; Martínez J. M. Packmol: A Package for Building Initial Configurations for Molecular Dynamics Simulations. J. Comput. Chem. 2009, 20, 2157–2164. 10.1002/jcc.21224. [DOI] [PubMed] [Google Scholar]
- Berendsen H. J. C.; Postma J. P. M.; van Gunsteren W. F.; DiNola A.; Haak J. R. Molecular Dynamics with Coupling to an External Bath. J. Chem. Phys. 1984, 81, 3684–3690. 10.1063/1.448118. [DOI] [Google Scholar]
- Koichi K.; Michiya F.; Makoto N. Lipid Components of Two Different Regions of an Intestinal Epithelial Cell Membrane of Mouse. Biochim. Biophys. Acta, Lipids Lipid Metab 1974, 369, 222–233. 10.1016/0005-2760(74)90253-7. [DOI] [PubMed] [Google Scholar]
- Wassenaar T. A.; Ingólfsson H. I.; Böckmann R. A.; Tieleman D. P.; Marrink S. J. Computational Lipidomics with Insane: A Versatile Tool for Generating Custom Membranes for Molecular Simulations. J. Chem. Theory Comput. 2015, 11, 2144–2155. 10.1021/acs.jctc.5b00209. [DOI] [PubMed] [Google Scholar]
- Kučerka N.; Nieh M. P.; Katsaras J. Fluid Phase Lipid Areas and Bilayer Thicknesses of Commonly Used Phosphatidylcholines as a Function of Temperature. Biochim. Biophys. Acta, Biomembr. 2011, 1808, 2761–2771. 10.1016/j.bbamem.2011.07.022. [DOI] [PubMed] [Google Scholar]
- Sanders S. A.; Panagiotopoulos A. Z. Micellization Behavior of Coarse Grained Surfactant Models. J. Chem. Phys. 2010, 132, 114902. 10.1063/1.3358354. [DOI] [PubMed] [Google Scholar]
- Torrie G. M.; Valleau J. P. Nonphysical Sampling Distributions in Monte Carlo Free-Energy Estimation: Umbrella Sampling. J. Comput. Phys. 1977, 23, 187–199. 10.1016/0021-9991(77)90121-8. [DOI] [Google Scholar]
- Hub J. S.; De Groot B. L.; Van Der Spoel D. G-Whams-a Free Weighted Histogram Analysis Implementation Including Robust Error and Autocorrelation Estimates. J. Chem. Theory Comput. 2010, 6, 3713–3720. 10.1021/ct100494z. [DOI] [Google Scholar]
- Huang J.; Mackerell A. D. CHARMM36 All-Atom Additive Protein Force Field: Validation Based on Comparison to NMR Data. J. Comput. Chem. 2013, 34, 2135–2145. 10.1002/jcc.23354. [DOI] [PMC free article] [PubMed] [Google Scholar]
- Wu E. L.; Cheng X.; Jo S.; Rui H.; Song K. C.; Dávila-Contreras E. M.; Qi Y.; Lee J.; Monje-Galvan V.; Venable R. M.; et al. CHARMM-GUI Membrane Builder toward Realistic Biological Membrane Simulations. J. Comput. Chem. 2014, 35, 1997–2004. 10.1002/jcc.23702. [DOI] [PMC free article] [PubMed] [Google Scholar]
- Jönsson P.; Jonsson M. P.; Tegenfeldt J. O.; Höök F. A Method Improving the Accuracy of Fluorescence Recovery after Photobleaching Analysis. Biophys. J. 2008, 95, 5334–5348. 10.1529/biophysj.108.134874. [DOI] [PMC free article] [PubMed] [Google Scholar]
- Huang H.; Verrall R. E. Thermodynamic and Aggregation Behavior of Mixed Micellar Systems of Sodium Decanoate and Ethoxylated Alcohols in Water at 25 °C. J. Solution Chem. 1997, 26, 135–162. 10.1007/BF02767918. [DOI] [Google Scholar]
- Lindmark T.; Nikkila T.; Arturson P. Mechanisms Fatty Acids of Absorption Enhancement in Intestinal Epithelial Caco-2 by Medium Chain. J. Pharmacol. Exp. Ther. 1995, 275, 958–964. [PubMed] [Google Scholar]
- Krug S. M.; Amasheh M.; Dittmann I.; Christoffel I.; Fromm M.; Amasheh S. Sodium Caprate as an Enhancer of Macromolecule Permeation across Tricellular Tight Junctions of Intestinal Cells. Biomaterials 2013, 34, 275–282. 10.1016/j.biomaterials.2012.09.051. [DOI] [PubMed] [Google Scholar]
- Anderberg E. K.; Lindmark T.; Artursson P. Sodium Caprate Elicits Dilatations in Human Intestinal Tight Junctions and Enhances Drug Absorption by the Paracellular Route. Pharm. Res. 1993, 10, 857–864. 10.1023/A:1018909210879. [DOI] [PubMed] [Google Scholar]
- Malkov D.; Angelo R.; Wang H.; Flanders E.; Tang H.; Gomez-Orellana I. Oral Delivery of Insulin with the Eligen Technology: Mechanistic Studies. Curr. Drug Delivery 2005, 2, 191–197. 10.2174/1567201053586001. [DOI] [PubMed] [Google Scholar]
- Twarog C.; Liu K.; O’Brien P. J.; Dawson K. A.; Fattal E.; Illel B.; Brayden D. J. A Head-to-Head Caco-2 Assay Comparison of the Mechanisms of Action of the Intestinal Permeation Enhancers: SNAC and Sodium Caprate (C10). Eur. J. Pharm. Biopharm. 2020, 152, 95–107. 10.1016/j.ejpb.2020.04.023. [DOI] [PubMed] [Google Scholar]
- Calder P. C.; Yaqoob P.; Harvey D. J.; Watts A.; Newsholme E. A. Incorporation of Fatty Acids by Concanavalin A-Stimulated Lymphocytes and the Effect on Fatty Acid Composition and Membrane Fluidity. Biochem. J. 1994, 300, 509–518. 10.1042/bj3000509. [DOI] [PMC free article] [PubMed] [Google Scholar]
- Burns C. P.; Luttenegger D. G.; Dudley D. T.; Spector A. A.; Buettner G. R. Effect of Modification of Plasma Membrane Fatty Acid Composition on Fluidity and Methotrexate Transport in L1210 Murine Leukemia Cells 1. Cancer Res. 1979, 39, 1726–1732. [PubMed] [Google Scholar]
- Hagve T. A. Effects of Unsaturated Fatty Acids on Cell Membrane Functions. Scand. J. Clin. Lab. Invest. 1988, 48, 381–388. 10.1080/00365518809085746. [DOI] [PubMed] [Google Scholar]
- Patist A.; Kanicky J. R.; Shukla P. K.; Shah D. O. Importance of Micellar Kinetics in Relation to Technological Processes. J. Colloid Interface Sci. 2002, 245, 1–15. 10.1006/jcis.2001.7955. [DOI] [PubMed] [Google Scholar]
- Yuan F.; Wang S.; Larson R. G. Potentials of Mean Force and Escape Times of Surfactants from Micelles and Hydrophobic Surfaces Using Molecular Dynamics Simulations. Langmuir 2015, 31, 1336–1343. 10.1021/la5044393. [DOI] [PubMed] [Google Scholar]
Associated Data
This section collects any data citations, data availability statements, or supplementary materials included in this article.