Abstract
The cohesin complex plays an essential role in maintaining genome organization. However, its role in gene regulation remains largely unresolved. Here, we report that the cohesin release factor WAPL creates a pool of free cohesin, in a process known as cohesin turnover, which reloads it to cell-type specific binding sites. Paradoxically, stabilization of cohesin binding, following WAPL ablation, results in depletion of cohesin from these cell-type specific regions, a loss of gene expression and differentiation. Chromosome conformation capture experiments show that cohesin turnover is important for maintaining promoter-enhancer loops. Binding of cohesin to cell-type specific sites is dependent on the pioneer transcription factors OCT4 (POU5F1) and SOX2, but not NANOG. We show the importance of cohesin turnover in controlling transcription and propose that a cycle of cohesin loading and off-loading, instead of static cohesin binding, mediates promoter and enhancer interactions critical for gene regulation.
Introduction
The ring-shaped cohesin complex is essential for maintaining chromosome organization at the sub-megabase scale. Cohesin is a multimeric complex consisting of SMC1A, SMC3, RAD21 and one SA subunit (SA1 or SA2). In vertebrate genomes, stable chromatin loops are formed between two convergent CTCF-binding sites that block cohesin1–3. We and others have recently shown that the three-dimensional (3D) genome can be massively re-organized by knocking out or rapidly depleting cohesin subunits, regulators of cohesin or CTCF4–8. Despite severe changes in loop and TAD structure, the effects of 3D genome changes on transcription are either mild or difficult to explain genome-wide5,6,9. Although specific examples exist where CTCF assists in bringing promoters and enhancers together to activate gene expression10,11, these results cannot be generalized. Interestingly, whereas the role of architectural proteins in genome organization is becoming clearer, the detailed molecular mechanisms of how these proteins contribute to gene regulation is still poorly understood.
This is also the case for the cohesin release factor WAPL, which dissociates cohesin rings from chromatin12,13 and is thereby important for controlling cohesin levels on chromosomes14. By dissociating cohesin from chromatin WAPL is a key regulator in a cycle of loading and unloading that is collectively referred to as cohesin turnover. WAPL is required for various cellular process including sister chromatid resolution15 and DNA repair16. The cohesin removal function of WAPL is also important in regulating genome architecture in mammalian cells. Loss of the WAPL protein results in a genome-wide stabilization of cohesin on chromatin, resulting in the formation of vermicelli chromosomes. This state is characterized by increased chromatin loop size, decreased intra-TAD contact frequency and a suppression of compartments4,7. However, also here it remains to be solved how these changes in 3D genome organization affect transcriptional regulation.
A significant fraction of chromatin-bound cohesin is not bound at CTCF sites, but co-localizes with cell-type specific transcription factors and active chromatin features (enhancers) in specific regions of the genome17–19 and are frequently associated with cell identity genes. The SA2 subunit defines a subset of cohesin complexes that preferably bind to enhancers sequences20,21. CTCF-binding sites, on the other hand, seem to be occupied by both SA1 and SA2 containing cohesin. Clearly, different subsets of cohesin are bound to chromatin, which may affect genome function in different ways.
In this study, we employed acute protein depletion to deplete WAPL in mouse embryonic stem cells (mESCs), to examine the immediate effects of changes in cohesin binding and 3D genome changes. We identified regions that lose cohesin binding and local chromatin interactions upon WAPL depletion. These regions are frequently located near pluripotency genes and are enriched for pluripotency transcription factor binding sites. Binding of cohesin to pluripotency transcription factor binding sites is dependent on SOX2 and OCT4, but not NANOG. Finally, we show that WAPL-dependent cohesin binding sites exist in differentiated cells as well, indicating the general importance of WAPL for transcriptional regulation in the mammalian genome.
Results
WAPL is required for maintaining the pluripotent transcriptional state
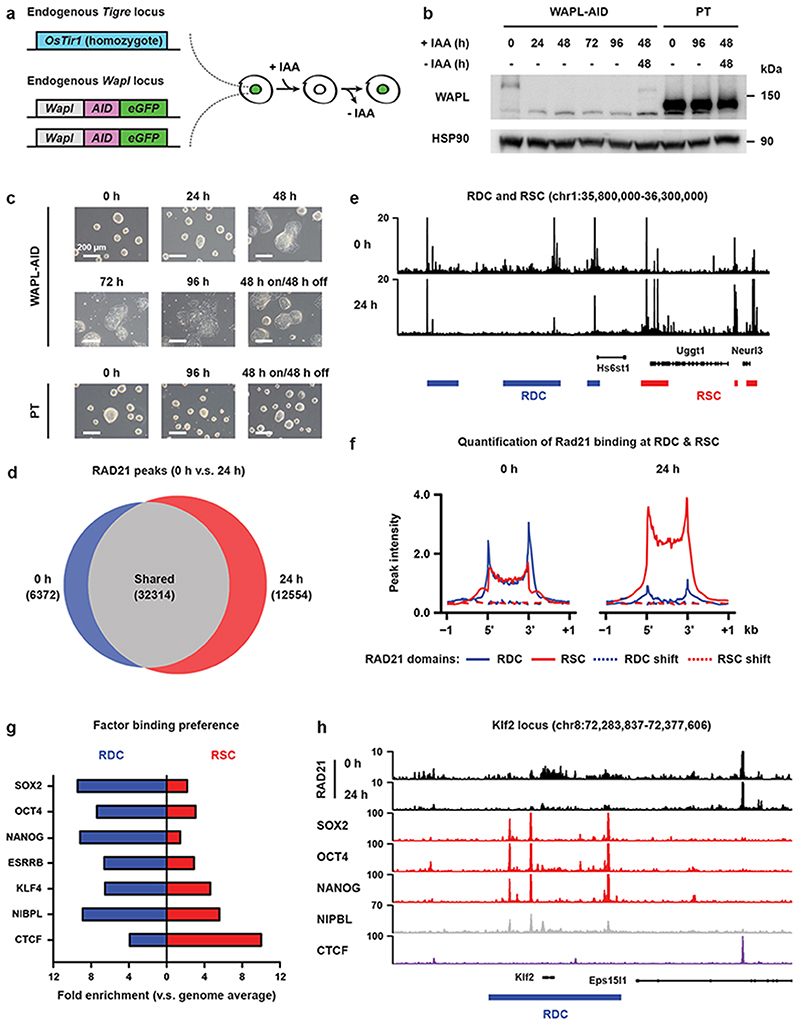
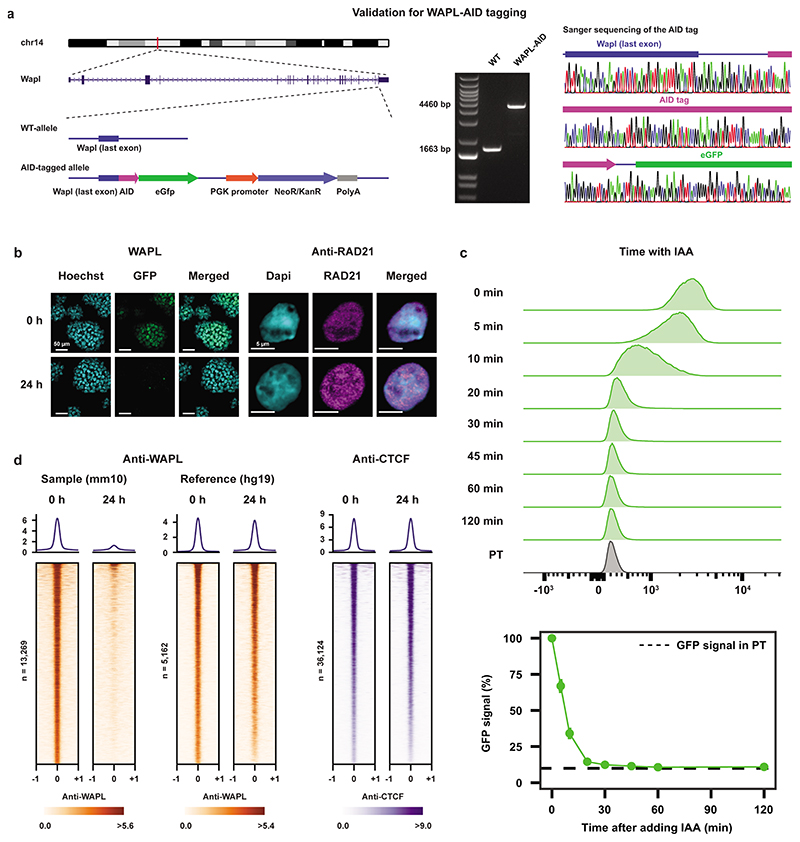
We have previously shown the importance of the cohesin release factor WAPL in regulating 3D genome organization. To study the immediate effects of WAPL loss, cohesin stabilization and 3D genome changes on gene expression we created an acute depletion line for WAPL. Because loss of WAPL is known to result in p53-dependent cell-cycle arrest22,23 we chose mouse embryonic stem cells (mESCs), which have been shown to have decreased activity of the p53 pathway24. We fused an AID-eGFP sequence at the C-terminus of the endogenous WAPL protein using CRISPR-Cas9 genome editing (Fig. 1a and Extended Data Fig. 1a)25 into an OsTir1 parental line6. As expected the tagged WAPL protein showed rapid degradation when indole-3-acetic acid (IAA) was added in the culture medium (Fig. 1b and Extended Data Fig. 1b). Upon WAPL depletion, we stained for chromatin-bound cohesin subunit RAD21 (also known as SCC1) and observed the formation of the characteristic vermicelli chromosomes22 (Extended Data Fig. 1b). Nearly complete WAPL depletion was achieved after 45 minutes of IAA treatment (Extended Data Fig. 1c). We performed calibrated ChIP-seq analysis for WAPL and CTCF and found that acute depletion leads to a genome-wide loss of WAPL binding, but has almost no impact on the genome-wide distribution of CTCF (Extended Data Fig. 1d). These results show that our WAPL-AID cell line enables us to study the effects of rapid cohesin stabilization on cellular functions.
Fig. 1. Acute depletion of WAPL leads to cohesin redistribution and mESC differentiation.
a, The endogenous Wapl gene was tagged with AID-eGFP in OsTir1 parental mouse E14 mESCs. IAA (auxin) treatment results in rapid degradation which can be followed live through eGFP fluorescence. b, Western blot analysis of WAPL levels in WAPL-AID and parental (PT) cells following different times after IAA (auxin) treatment (cropped, n = 1). c, Bright-field microscopy images showing morphology of WAPL-AID (top row) and parental (bottom row) mESCs in the same time course as (b) (representative images from 2 independent clones). d, Venn diagram showing the shared and unique RAD21 peaks in untreated cells and cells treated for 24 hours with IAA. Peak calling was performed on a subset of 7 M sequencing reads for both of the samples. e, Example regions showing ChIP-seq coverage tracks for RAD21 in untreated and treated cells. Blue and red rectangles indicate the positions of the Regions of Dynamic Cohesin (RDC) and Regions of Stalled Cohesin (RSC) identified by our hidden Markov model. f, Alignment of RAD21 ChIP-seq data from untreated and treated cells on RDCs and RSCs. g, DNA/chromatin binding factor binding preference in RDCs and RSCs. Bar plot indicates fold enrichment of the ChIP-seq peaks in RDCs and RSCs in comparison with genome average. h, Example region showing the relationship between the factors analyzed in (g) and the position of a RDC.
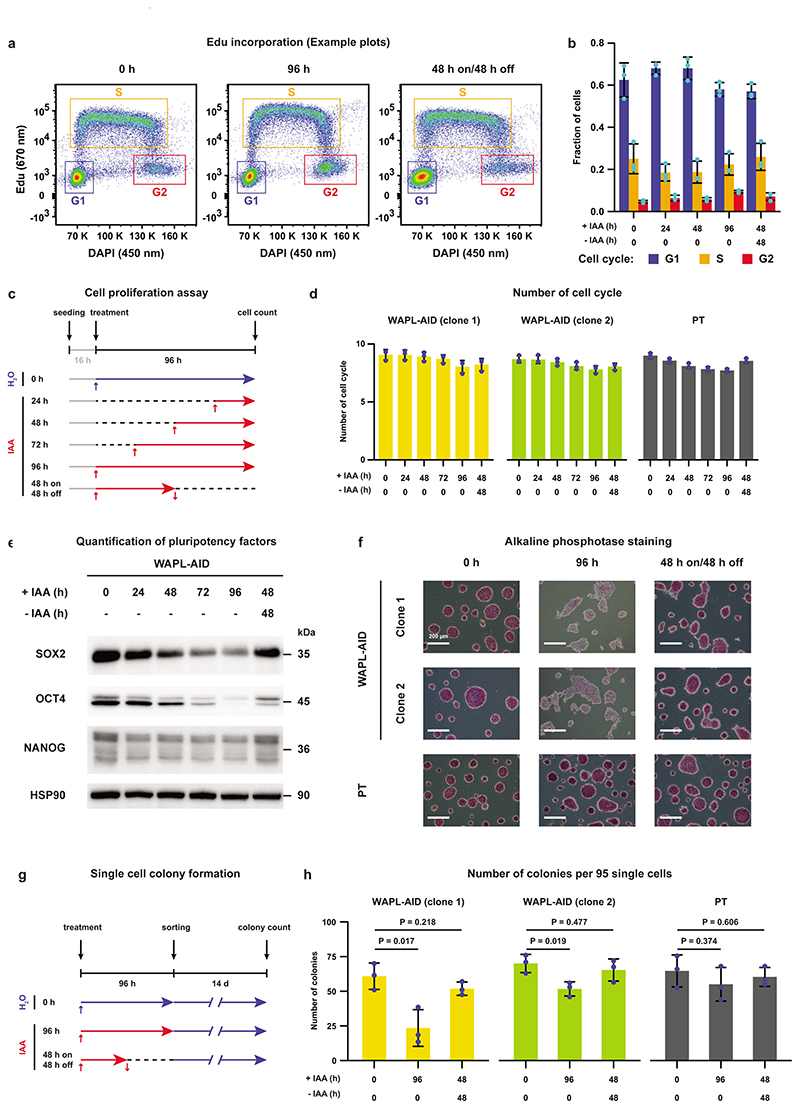
To ensure that our cells indeed show no cell cycle arrest after WAPL depletion we performed the following control experiments. We confirmed that there were no major shifts in the cell cycle phases following WAPL depletion by measuring EdU incorporation using FACS (Extended Data Fig. 2a,b). Furthermore, we measured cell proliferation by seeding a fixed amount of cells and treating the cells with IAA for different amounts of time. After 112 hours we counted the number of cells using automated cell counting and calculated the average number of cell cycles the cells had gone through. Cells that have been depleted for WAPL for 96h show at most one cell cycle fewer compared to untreated cells, which is actually less than the parental line treated with IAA (Extended Data Fig. 2c,d). Collectively, this indicates that in the absence of WAPL mESCs remain proliferative and the cell cycle is hardly affected.
Although mESCs depleted for WAPL proliferated normally we did observe morphological changes that are characteristic of differentiation (Fig. 1c). The protein levels of key pluripotency transcription factors were decreased upon WAPL depletion (Extended Data Fig. 2e). Correspondingly, WAPL-depleted cells showed a clear decrease in alkaline phosphatase staining after 4 days of IAA treatment in two independent WAPL-AID clones (Extended Data Fig. 2f), suggesting that these cells exit the pluripotent state. Alkaline phosphatase staining remains constant in the OsTir1 parental cells treated with IAA (Extended Data Fig. 2f). To test whether WAPL-depleted cells were differentiated we performed a colony formation assay. Following 96 hours of WAPL depletion we sorted single cells into medium without IAA and counted the number of colonies after 14 days of culture. There was a significant decrease in the colony-forming capacity after 96 hours of WAPL depletion (Extended Data Fig. 2g,h), suggesting that WAPL, which ensures normal off-loading of cohesin, is essential to maintain the pluripotent state of mESCs.
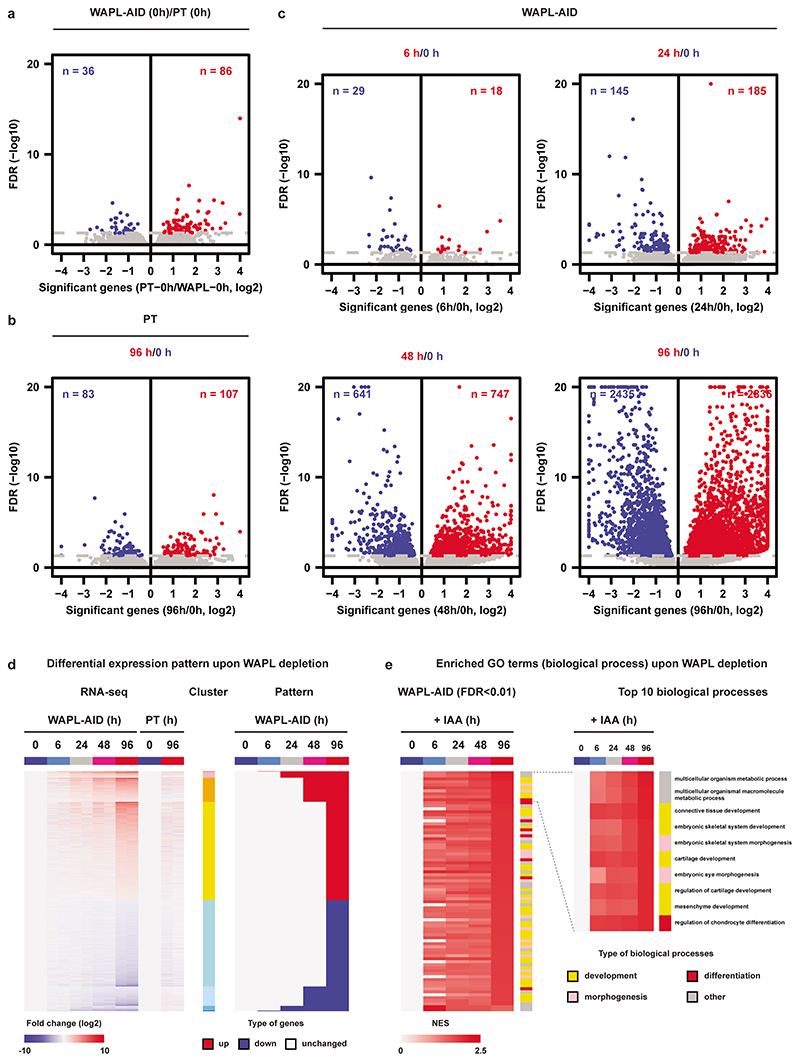
In order to better understand the molecular mechanisms that induce mESC differentiation following WAPL-depletion we performed RNA-seq analysis. Tagging WAPL with the AID-GFP tag hardly affects the transcriptome compared to the parental cell line (Extended Data Fig. 3a). Furthermore, treatment of the OsTir1 parental with IAA induced very few differences in gene expression after 96 hours (Extended Data Fig. 3b). Acute depletion of WAPL, on the other hand, resulted in a gradual change in gene expression over the course of 96 hours (FDR < 0.05, Extended Data Fig. 3c,d). When we performed gene set enrichment analysis we found that > 80% of the up-regulated biological processes (FDR < 0.01) are associated with (embryonic) tissue development, (embryonic) morphogenesis, and cell differentiation (Extended Data Fig. 3e). Note that there is a strong enrichment among downregulated genes for embryonic stem cell identity genes (Supplementary Fig. 1a). The absence of cell cycle effects is compounded in our transcriptomic analysis where we find no strong enrichment for cell cycle of DNA damage categories (Supplementary Fig. 1a). The effects we observed on gene expression are highly reproducible and fully recapitulated in a second WAPL-AID clone (Supplementary Fig. 2a,b).
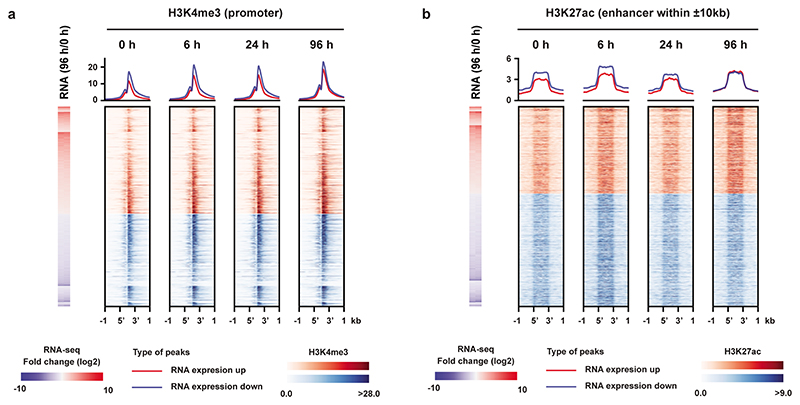
To determine whether these gene expression changes were associated with a change in the epigenomic landscape, we profiled H3K4me3 and H3K27ac using ChIP-seq following IAA treatment and observed only subtle changes following even 96 hours of WAPL depletion (Extended Data Fig. 4a,b) These data indicate that the transcriptomic changes that occur in the absence of WAPL are not caused by massive changes in the promoter- or enhancer-associated epigenetic landscape.
Regions of depleted cohesin are strongly enriched for pluripotency genes and enhancers
In cells lacking WAPL, cohesin rings are loaded onto chromatin, but fail to be released during interphase, leading to a global stabilization of cohesin molecules on DNA22. To determine what happens to the genomic distribution of cohesin after acute WAPL depletion we performed calibrated ChIP-seq of the core cohesin subunit RAD21. Stabilization of cohesin results in the formation of 12,554 novel cohesin binding sites. Unexpectedly, we observed a concomitant loss of 6,372 RAD21 binding sites after global stabilization of cohesin by WAPL depletion (Fig. 1d). The change in cohesin binding sites suggests a global redistribution of chromatin bound cohesin upon WAPL depletion. We could recapitulate this redistribution of cohesin in an independent WAPL-AID clone (Extended Data Fig. 5a,b).
When we looked more closely into the distribution of RAD21 in treated vs. untreated cells, we observed that RAD21 was lost over large stretches of the genome and accumulated at more focused regions (Fig. 1e). To systematically analyze the lost and gained regions we developed a hidden Markov model (HMM, see Methods for details), which identified 898 regions from which cohesin was lost and 2,789 regions that showed increased cohesin binding after WAPL depletion (see Supplementary Table 1 for a list of RDCs and RSCs and the closest gene). Alignment of the RAD21 ChIP-seq signal on these regions clearly confirmed reduction and increase of cohesin at the lost and gained regions after WAPL depletion, respectively (Fig. 1f). Next, we aligned the RAD21 ChIP-seq signal from our second independently generated WAPL-AID clone on the regions that were identified in the first clone and observed similar changes (Extended Data Fig. 5c). Note that these domains are not cell line or antibody specific, since alignment of publicly available ChIP-seq profiles of 5 different cohesin subunits in V6.5 mESCs at the cohesin lost and gained regions showed a similar binding pattern (Extended Data Fig. 5d,e). These data indicate that these cohesin binding domains in mESCs are well conserved between different mouse strains. We will refer to the regions where cohesin is lost as Regions of Depleted Cohesin (RDC); the loci where cohesin accumulates we will refer to as Regions of Stalled Cohesin (RSC).
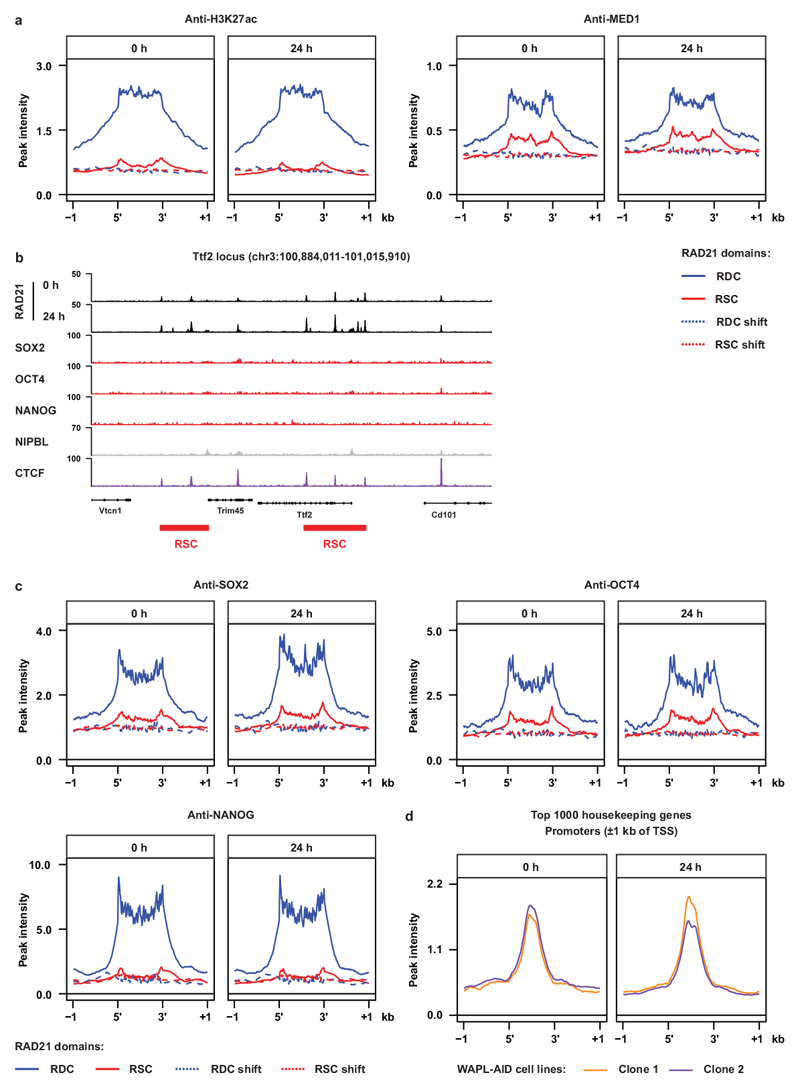
To understand the role of RDCs and RSCs we annotated the overlapping and nearby genes by performing GREAT analysis26. In the MGI mouse developmental database27 the RDCs show strong enrichment for genes that are expressed in early embryonic stages (Extended Data Fig. 5f). For the RSCs we could not find any significant gene categories that are associated with the pluripotent state. When we aligned the active enhancer markers H3K27ac and MED1 ChIP-seq signal, we found a strong enrichment over RDCs, but not on RSCs. (Extended Data Fig. 6a). Moreover, We observed that the binding sites of pluripotency transcription factors SOX2, OCT4 and NANOG, and the cohesin loading factor NIPBL are over-represented in RDCs, while CTCF is enriched at RSCs (Fig. 1g,h and Extended Data Fig. 6b,c). Cohesin is also bound to transcriptional start sites4,28, but cohesin occupancy at promoters of highly transcribed housekeeping (i.e. cell-type invariant) genes29 was unchanged after WAPL depletion (Extended Data Fig. 6d). Therefore, although cohesin at cell-type specific loci is dependent on cohesin turnover, cohesin bound to active transcriptional start sites is not.
Collectively, our data show a global redistribution of cohesin upon WAPL depletion, leading to a loss of cohesin at cell-type specific RDCs but an accumulation at CTCF-dense RSCs.
Dynamic cohesin is required to form local self-interacting domains
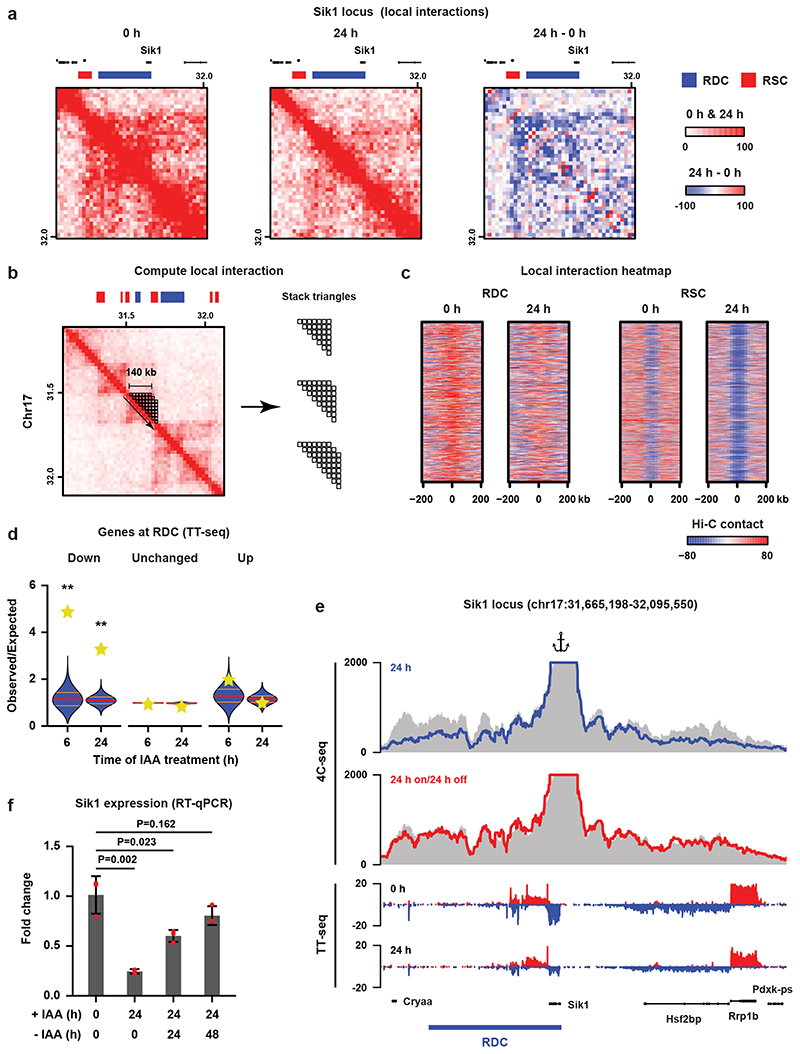
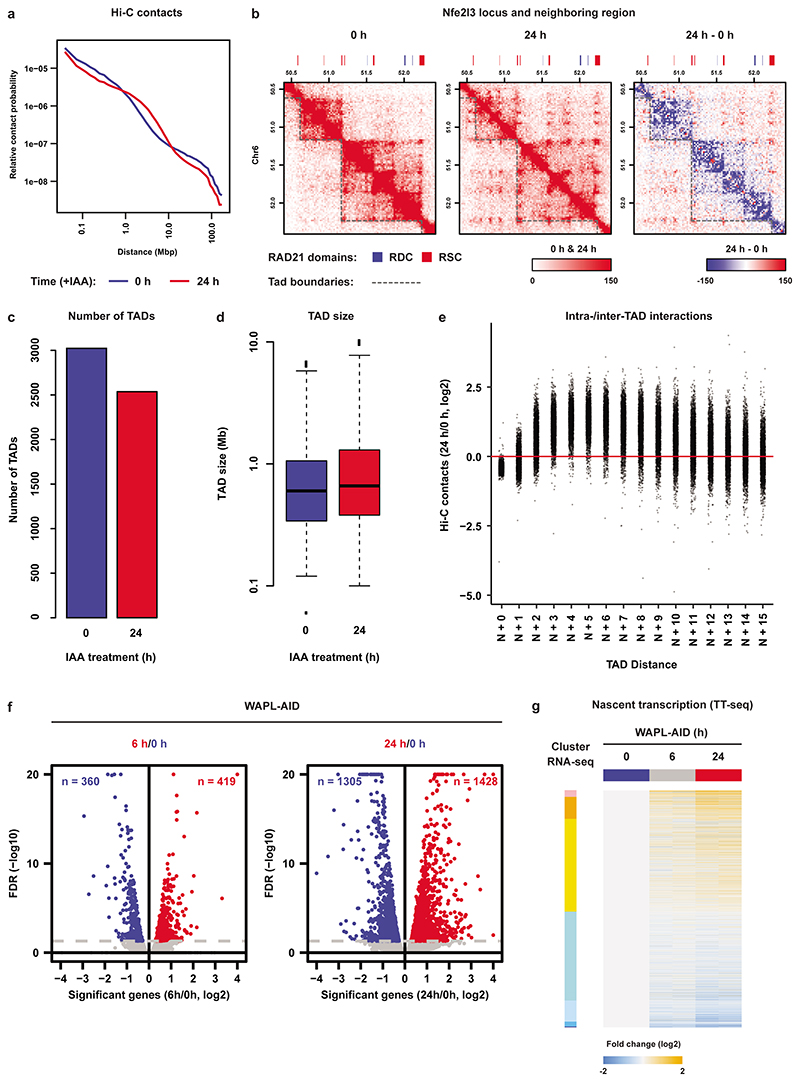
Cohesin is instrumental in the formation of CTCF-anchored chromatin loops and the formation of TADs5,7,8. In order to understand the effects of cohesin redistribution on 3D genome organization, we generated Hi-C maps in untreated (0 h) and WAPL-depleted (24 h) cells. Contact frequency in the range of 1-10 Mb, (i.e. inter-TAD) was increased upon WAPL depletion, but decreased below 1 Mb (i.e. intra-TAD, Extended Data Fig. 7a). In addition, we observed an extension of loops similar to what had been observed previously (Extended Data Fig. 7b). Note that the number and size of TADs does not drastically change, although the interactions between neighboring TADs do increase (Extended Data Fig. 7c-e). These results show that acute depletion of WAPL largely recapitulates what we and others observed upon WAPL knock-out or knock-down4,7. When we looked at the Hi-C contact maps in regions surrounding an RDC we observed that they form regions of high self-interaction, reminiscent of TADs, for instance surrounding the Sik1 gene (Fig. 2a). To systematically quantify self-interaction strength on and surrounding RDCs we applied a 140-kb triangular shaped window sliding along the genome in 20-kb steps (see Fig. 2b for explanation) and aligned the signal on the RDCs. We show that the high degree of self-interaction is a genome-wide feature of RDCs, which is diminished upon WAPL depletion (Fig. 2c).
Fig. 2. Cohesin turnover creates regions of increased self-interaction and regulates transcription.
a, Hi-C data and RDC and RSC locations shown for the Sik1 locus. Third panel shows differential Hi-C contacts between untreated and 24 h IAA-treated cells. b, Calculation of the self-interaction (SI) score (see Methods). c, Heatmaps show alignment of the SI scores for RDCs and RSCs. d, For every RDC, the closest gene was identified and we determined whether the fraction of genes that were significantly down- or upregulated or showed no significant change in the TT-seq analysis. The yellow stars indicate the observed over expected enrichment of the TT-seq data (n = 2 independent experiments), and the violin plots show distribution of enrichment based on 10,000 random circular permutations (red lines: median values, orange lines: interquartile range, **: P < 0.0001). e, High-resolution 4C-seq data for the Sik1 locus (viewpoint: the Sik1 promoter). Top two rows show the contact profile at 24 h after WAPL depletion (blue line) and 24 h depletion followed by 24 h wash-off (red line) compared to the untreated cells (grey area).The bottom two rows show nascent transcription of all the genes within the same regions in the untreated (0 h) and treated (24 h) cells. f, Expression of the Sik1 gene was quantified by RT-qPCR (n = 3 independent experiments) after 24 h of WAPL depletion and 24 h depletion followed by 24/48 h wash-off (two-sided Student’s t-test without multiple testing correction, bar height: mean values, error bars: standard deviations, red dots: individual data points).
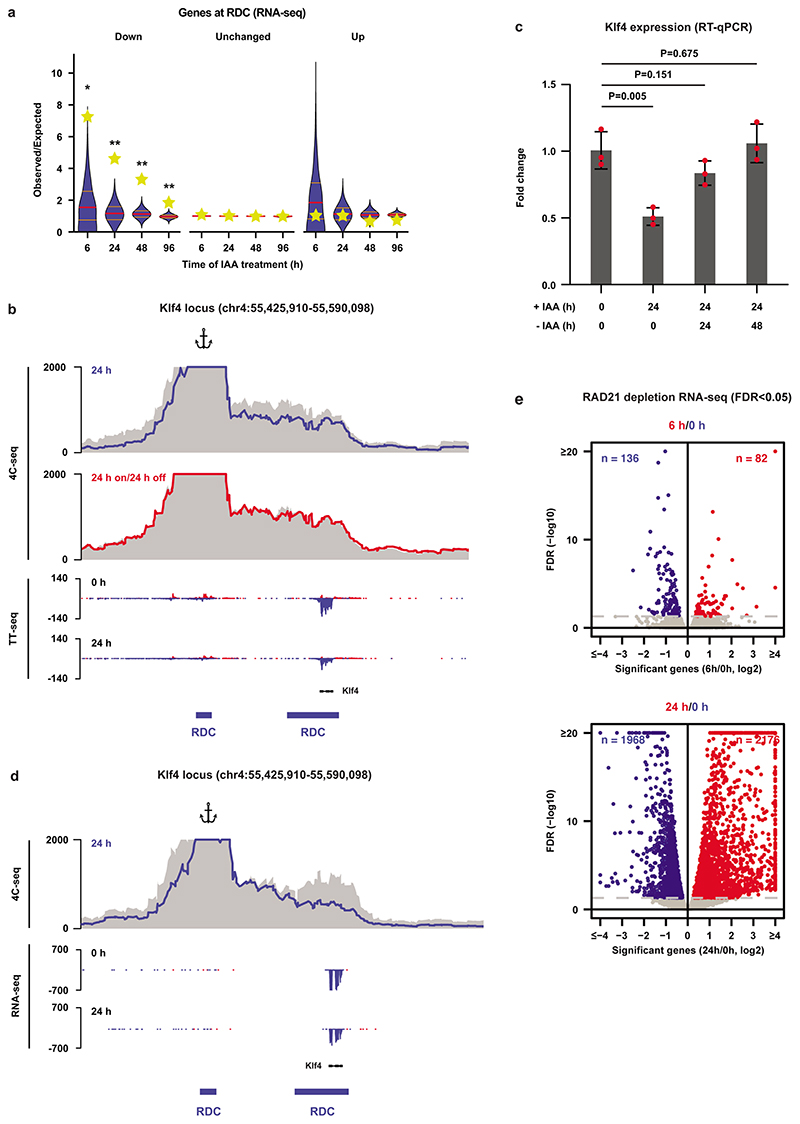
To understand the immediate effect of cohesin redistribution on gene expression we generated nascent transcriptome datasets using TT-seq30,31 in untreated cells and cells depleted for WAPL for 6 and 24 hours (Extended Data Fig. 7f,g and Supplementary Fig.1b). When we intersected significantly downregulated genes with RDCs we found an almost 5-fold enrichment after 6 hours of WAPL depletion (P < 1 × 10⁻⁴, circular permutation test, Fig. 2d). No such enrichment was found for upregulated genes or unchanged genes. These results were recapitulated in the RNA-seq analysis, albeit to a lesser extent due to lower number of deregulated genes (Extended Data Fig. 8a). To improve the resolution of the effects that we observe we performed 4C-seq32 from the transcription start site of Sik1 (Fig. 2e) and a distal RDC downstream of Klf4 (Extended Data Fig. 8b). For Sik1 we find a self-interaction domain that spans three genes, i.e. Hsf2bp and Rrp1b in addition to Sik1. All three showed significant down-regulation in the TT-seq analysis (Fig. 2e). By washing out IAA we can restore WAPL expression. We find that for both Sik1 and Klf4 the interaction profile is restored upon re-expression of WAPL (Fig. 2e and Extended Data Fig. 8b). The expression of Sik1 and Klf4, which is diminished following WAPL depletion, is also restored after re-expression of WAPL (Fig. 2f and Extended Data Fig. 8c).
In summary, the redistribution of cohesin affects local chromatin interactions and affects gene expression in a reversible manner.
Cohesin is required for maintaining pluripotency-specific gene expression
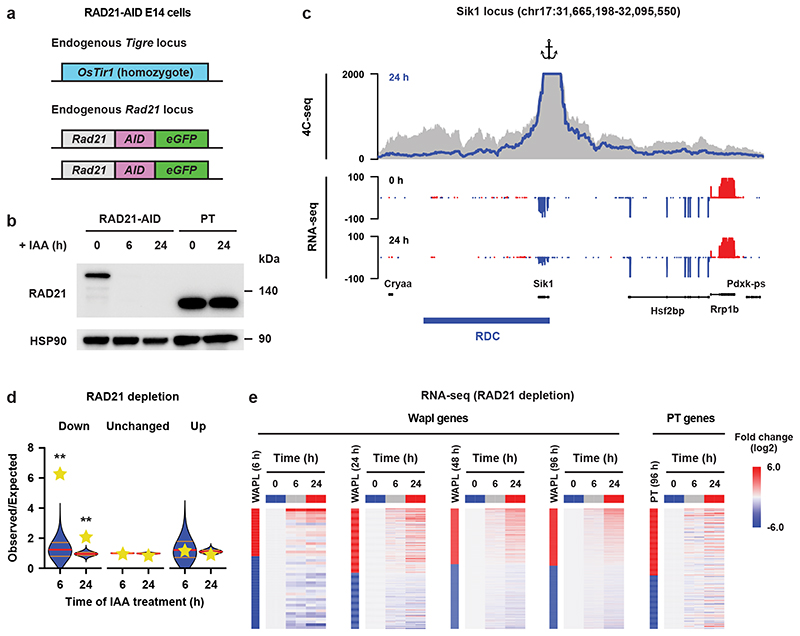
We reasoned that if local depletion of cohesin from RDCs results in decreased expression of genes close to RDCs, we should be able to phenocopy this by a complete loss of cohesin. To test this, we generated a degron line to acutely deplete RAD21. We fused AID-GFP in frame with RAD21 (Fig. 3a). The AID-tagged RAD21 protein was completely degraded after 6 hours of IAA treatment (Fig. 3b). 4C-seq analysis revealed that local interactions were diminished, consistent with previous reports5,33 (Fig. 3c and Extended Data Fig. 8d). After 6 and 24 hours of RAD21 depletion RNA-seq analysis revealed 218 (82 up and 136 down) and 4,144 (2,176 up and 1,968 down) differential genes, respectively (Extended Data Fig. 8e). Similar to the WAPL-depleted cells, Sik1, Hsf2bp and Rrp1b also showed significantly decreased expression upon RAD21 depletion (Fig. 3c). When we intersected the differentially expressed genes following RAD21 depletion with RDCs we found that there was an enrichment for down-regulated genes, but not upregulated genes (Fig. 3d). Importantly, expression changes upon RAD21 depletion were strikingly similar to expression changes as a result of WAPL depletion (Fig. 3e).
Fig. 3. Cohesin is required for maintaining gene expression at Regions of Depleted Cohesin.
a, The endogenous Rad21 gene was tagged with AID-eGFP in OsTir1 parental mouse E14 mESCs. b, Western blot showing acute depletion of RAD21 (cropped, n = 1). c, High-resolution 4C-seq analysis of the Sik1 locus. Viewpoint primers were designed as close as possible to the Sik1 promoter. The 4C-seq data are visualized in the same way as Figure 2e. The bottom two rows show expression of all the genes within the same region. d. For every RDC the closest gene was identified and we determined whether the fraction of genes that were significantly down- or upregulated or showed no significant change in the RNA-seq of the RAD21 depletion experiment. The yellow stars indicate the observed over expected enrichment of the RNA-seq data (n = 2 independent experiments), and the violin plots show distribution of enrichment based on 10,000 random circular permutations (red lines: median values, orange lines: interquartile range, **: FDR ≤ 0.0001). e, For the differentially expressed genes detected in WAPL-AID cells, the relative expression levels in RAD21-depleted cells are plotted as heatmaps. The vertical bars show the differentially expressed genes in the respective timepoints following WAPL depletion. Red signifies upregulated genes, blue down. Next to the bar the RAD21 depletion time series heatmap for the same genes is shown.
Our data indicate that cohesin binding at RDCs is essential to control expression of a subset of genes in mESCs. Loss of cohesin binding in these regions, either via redistribution of cohesin as a result of stabilization of the complex or the complete loss of cohesin leads to decreased expression of genes associated with RDCs.
Pioneer transcription factors create a platform for cohesin binding
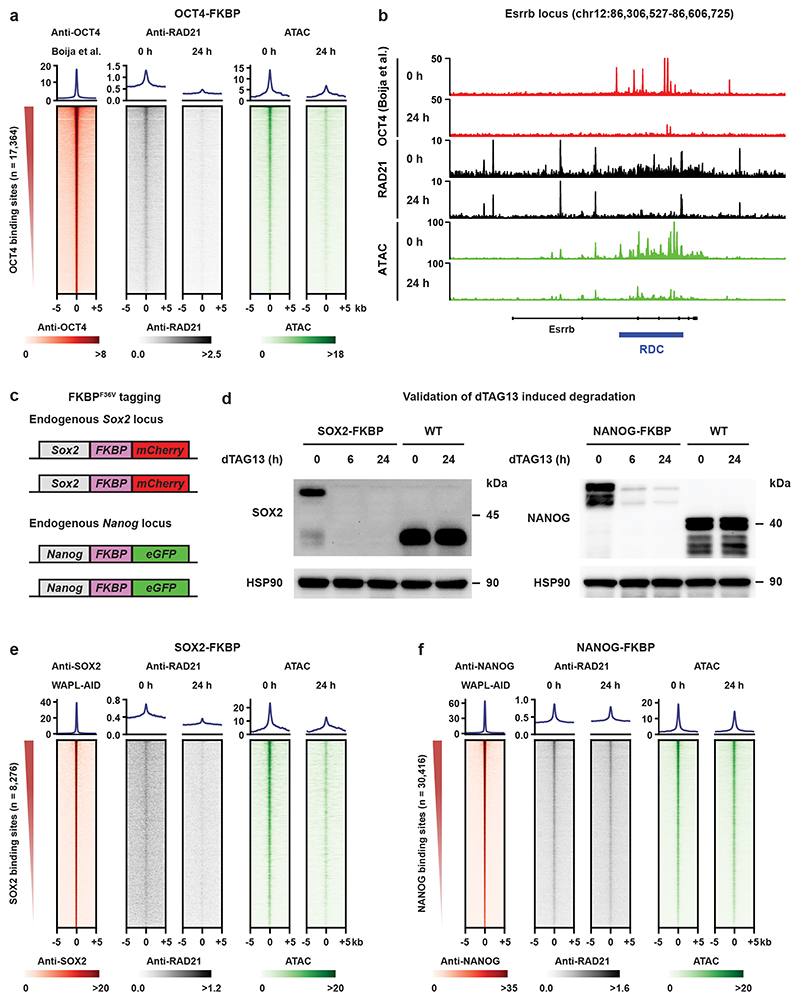
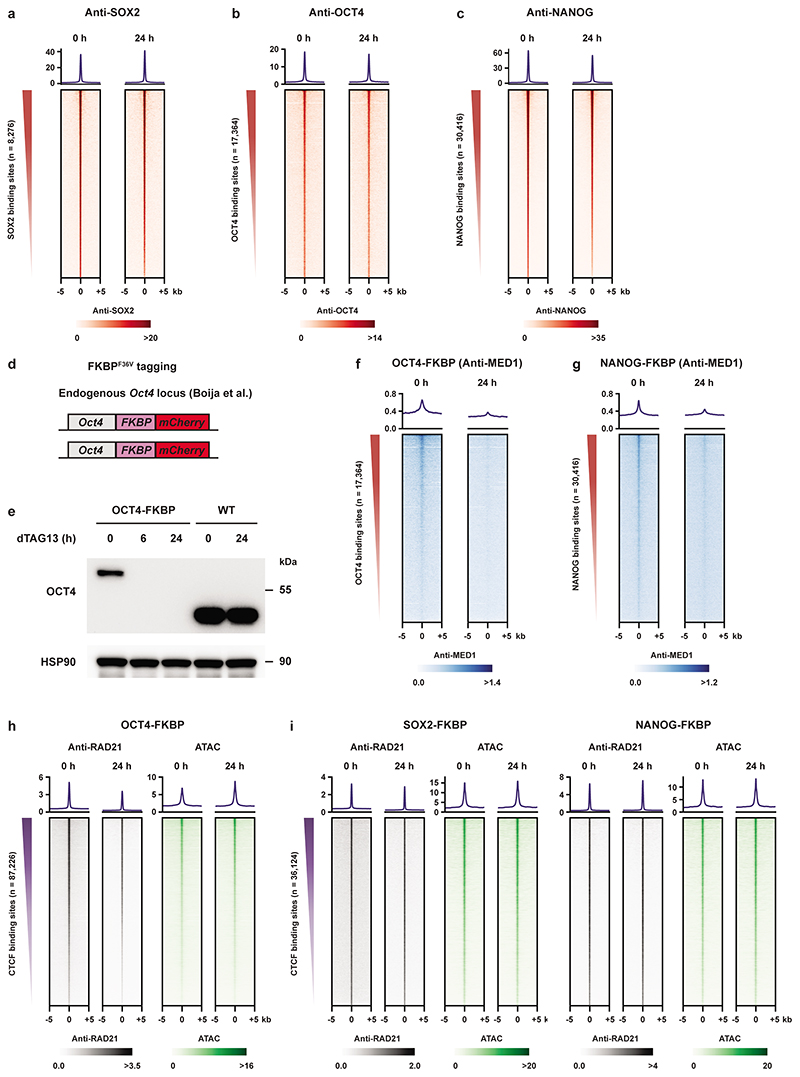
The overlap between CTCF-independent cohesin binding sites and pluripotency transcription factor binding sites prompted us to check the sequence of dependency. We determined the binding of pluripotency transcription factors SOX2, OCT4, and NANOG in the absence of WAPL, but found they were largely unaffected by the redistribution of cohesin (Extended Data Fig. 9a-c and Supplementary Fig. 3a-c). Based on this result we hypothesized that some of these factors may be responsible for the binding of cohesin molecules at these cell-type specific regulatory regions. To test this hypothesis, we employed a published OCT4-FKBP cell line34. FKBP12F36V fusion proteins can be rapidly degraded by addition of the heterobifunctional dTAG molecule35. Depletion of OCT4 was achieved within 24 h of adding 500 nM dTAG-13 molecule into the cell culture (Extended Data Fig. 9d,e). We examined what happened to RAD21 binding at OCT4 binding sites before and after dTAG-13 treatment. Strikingly, OCT4 depletion resulted in a strong decrease of cohesin binding as measured by RAD21 ChIP-seq and chromatin accessibility as measured by ATAC-seq at OCT4 binding sites (Fig. 4a,b).
Fig. 4. Pioneer factors OCT4 and SOX2 create an open chromatin platform for cohesin binding.
a, heatmaps showing RAD21 level and chromatin accessibility over OCT4 binding sites following 24 h of OCT4 depletion. b, Example locus containing the Esrrb gene shows RAD21 binding and chromatin accessibility over RDCs in treated and untreated OCT4-FKBP cells. OCT4 ChIP-seq track shows previously published OCT4 profiles in the same cell line34. c, Two FKBP-tagged cell lines were generated, a SOX2-FKBP-mCherry line and a NANOG-FKPB-eGFP (see Methods for details on construction). The FKBP degron can be degraded with the dTAG-13 molecule35. d, Western blots show protein levels of SOX2 (left) and NANOG (right) after 6 and 24 hours of dTAG-13 treatment (cropped, n = 1). e, Similar heatmaps as (a), but over SOX2 binding sites following SOX2 depletion. f, Similar heatmaps as (a,e), but over NANOG binding sites following NANOG depletion.
To determine whether loss of other pluripotency transcription factors also resulted in a change in cohesin binding we generated FKBP degron lines for SOX2 and NANOG (Fig. 4c) which also showed rapid depletion (Fig. 4d). We found that SOX2 depletion resulted in a loss of RAD21 and open chromatin at SOX2 binding sites, which is similar to the results of the OCT4 depletion (Fig. 4e). Depletion of NANOG, on the other hand, did not result in a change in cohesin binding and open chromatin (Fig. 4f). Depletion of OCT4 and NANOG in their respective degron lines results in a decrease in MED1 binding at OCT4 and NANOG binding sites, respectively (Extended Data Fig. 9f,g), indicating that depletion of these factors is functional. It should be noted that cohesin binding at CTCF sites36 is largely unchanged following OCT4, SOX2 or NANOG depletion (Extended Data Fig. 9h,i). Collectively, these data show that cohesin binding to pluripotency-specific regulatory sites is dependent on the pioneer transcription factors OCT4 and SOX2, but not NANOG.
Cohesin redistribution in differentiated cells
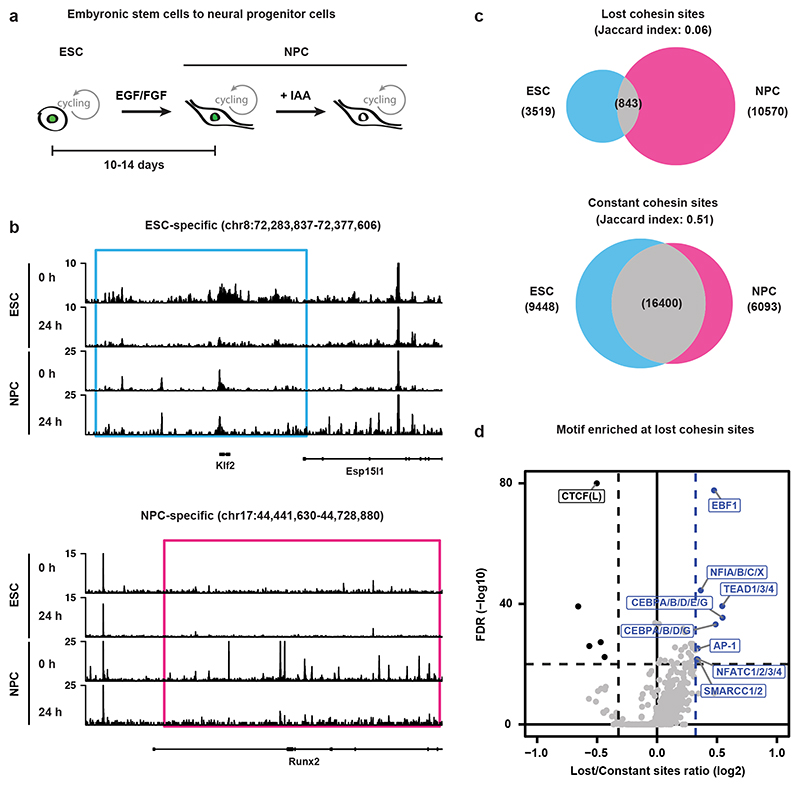
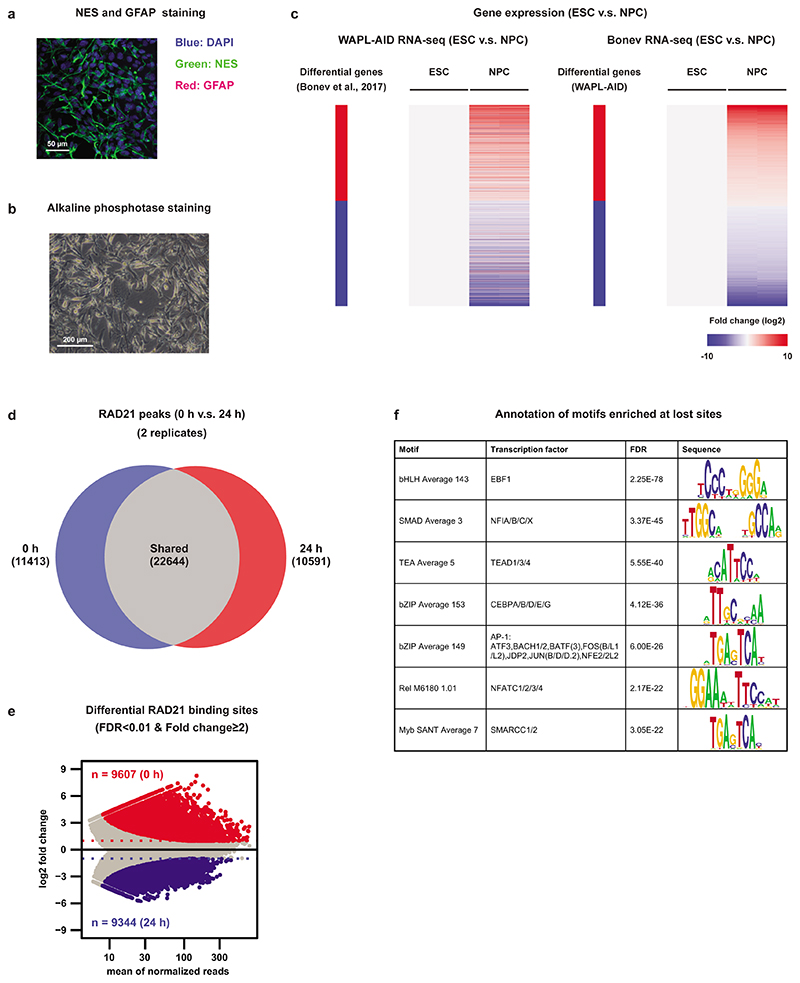
We wondered whether the redistribution of cohesin was unique to pluripotent cells or could be found in other cell types as well. To address this question, we differentiated WAPL-AID mESCs into neural progenitor cells (NPCs) in vitro following a standard differentiation protocol (Fig. 5a)37. We confirmed that the generated NPCs were positive for NESTIN (an NPC marker) and negative for GFAP (an astrocyte marker) (Extended Data Fig. 10a), did not show alkaline phosphatase staining (Extended Data Fig. 10b) and had a similar expression profile as a previously published NPC transcriptome38 (Extended Data Fig. 10c).
Fig. 5. Cohesin binding redistribution is a feature in differentiated cells.
a, WAPL-AID cells were differentiated to neural precursor cells using a standard differentiation protocol37. b, Example regions show the ChIP-seq tracks of RAD21 for treated and untreated WAPL-AID mESCs and NPCs. Light blue and pink rectangles highlight RAD21 lost regions in mESCs and NPCs, respectively. c, Venn diagram showing overlap between lost and constant cohesin binding sites in mESCs and NPCs. Lost cohesin sites are regions bound in the presence of WAPL, but not bound in the absence of WAPL. Constant cohesin sites are regions bound in the presence and absence of WAPL. Peak calling was performed on a subset of 7 M sequencing reads for all the samples. d, Motif enrichment analysis for lost cohesin binding sites. Sites bound preferentially in untreated cells (“Lost”) and sites bound stably in both treated and untreated cells (“Constant”) were analyzed with GimmeMotifs63. P values are calculated using the two-sided Fisher exact test for motif frequency for lost and constant peaks for every motif. Log2 fold-change of motif frequency is determined by calculating the ratio of relative motif frequency (i.e. corrected for the total motif frequency of all motifs) between lost and constant peaks (see Methods for details on fold-change and Pvalue calculation).
We performed RAD21 ChIP-seq after WAPL depletion in these NPCs and found that cohesin stabilization resulted in a clear redistribution as well (Fig. 5b). In control and WAPL-depleted NPCs we found a total of 11,413 and 10,591 RAD21 binding sites unique to either condition, respectively, across two replicates (Extended Data Fig. 10d). We found 22,644 RAD21 binding sites that were identified in both treated and untreated cells (i.e. ‘constant’ binding sites). When we compared the constant RAD21 binding sites that were identified in both mESCs and NPCs we found a strong overlap in the binding sites (Jaccard index 0.51, Fig. 5c). However, when we performed the same analysis for sites that were lost upon WAPL depletion in mESCs and NPCs a much weaker overlap was observed (Jaccard index 0.06, Fig. 5c). To further characterize sites that lose cohesin in NPCs, we performed a stringent identification using DESeq2 (see Methods, Extended Data Fig. 10e). We subsequently performed motif analysis to identify potential transcription factors associated with cohesin binding sites. As expected, the constant sites are enriched for the CTCF motif (Fig. 5d). For the cohesin binding sites lost after WAPL depletion we observed a significant enrichment for transcription factor motifs that are associated to neuronal development, such as EBF139 and nuclear factor I (NFI)40 (Fig. 5d and Extended Data Fig. 10f). These results indicate that stable CTCF-associated cohesin sites are largely tissue-invariant, but that lost cohesin sites are cell-type specific, associated with cell-type specific transcription factors and are likely to be involved in the control of cellular identity.
Discussion
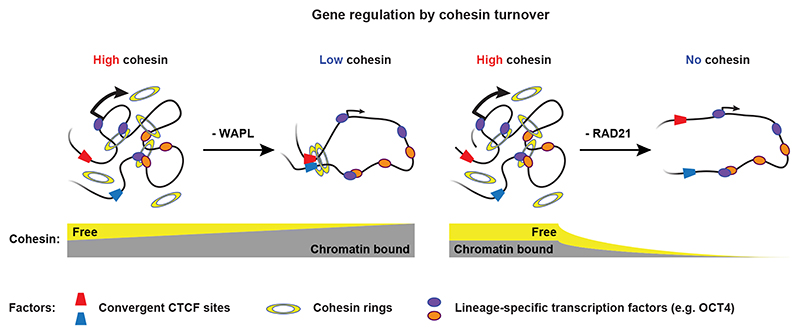
In this study, we used acute depletion of chromatin-associated proteins to study the role of the cohesin complex in the regulation of cell-type specific genes. The effects on gene expression following stabilization of cohesin by WAPL depletion are almost phenocopied by acute depletion of RAD21. These paradoxical results can be explained by considering the two pools of cohesin, a dynamic pool, which is dependent on the global off-loading of cohesin by WAPL and a stable pool associated with CTCF sites. Cohesin turnover is important for the regulation of genes, because regions where cohesin binding is dependent on the dynamic pool are strongly associated with genes that lose expression after removal of WAPL. This is corroborated by the observation that the RDCs are enriched for active enhancer marks and pluripotency transcription factors. Our 3D genome analyses suggest that cohesin turnover mediates interactions between promoters and enhancers and that disruption of these contacts by either WAPL or RAD21 depletion leads to a decrease in expression (Fig. 6). This activating role is consistent with the observation that in mature mouse macrophages inducible knock-out of Rad21 resulted in a failure to upregulate genes upon stimulation with LPS41. Moreover, although in human HCT116 colon cancer cells there was a relatively mild effect on gene expression following acute RAD21 depletion, there was an enrichment of downregulated genes closer to super-enhancers. Given that the RDCs that we identified are enriched for the enhancer mark H3K27ac these results are consistent with our data. In agreement with our observation that loss or redistribution of cohesin results in differentiation, heterokaryon-mediated reprogramming fails in the absence of RAD2142, suggesting that reprogramming requires the activity of the cohesin complex.
Fig. 6. Model for the consequences of WAPL and RAD21 depletion.
WAPL depletion results in an accumulation of cohesin at CTCF-binding sites. RAD21 depletion leads to a general loss of cohesin from the genome. Both WAPL and RAD21 depletion results in loss of cohesin binding turnover from cell-type-specific transcription factor binding sites and decreased 3D genome interactions between promoters and these sites.
We and others have previously shown that stabilization of cohesin results in increased loop lengths4,7. We fully recapitulate this phenotype using acute depletion of WAPL in mESCs. The loop extension phenotype after WAPL depletion is in line with the loop extrusion model, which posits that formation of TADs is dependent on a cycle of loading, extrusion and off-loading43. Stabilization of cohesin breaks this cycle and results in diminished intra-TAD interactions4. Genomic regions where cohesin binding is dependent on an active cycle of loading and unloading form self-interaction domains. Depletion of WAPL results in decreased self-interaction in these domains and a decreased contact frequency between promoters and regulatory elements.
In keeping with the above, we believe that the extrusion cycle, which depends on cohesin turnover, is important for bringing distal regulatory sites into contact with their cognate promoter as well. Loss of dynamic cohesin by either removing all cohesin molecules (RAD21 depletion) or exhausting the freely available cohesin (WAPL depletion), disrupts the loop extrusion cycle (Fig. 6). Compared to a diffusion model, loop extrusion effectively turns a 3D search into 1D scanning44. Furthermore, the diffusion model hypothesizes that promoter-enhancer interactions within a TAD are mediated by high local concentration of diffusible activators45, such as transcription factors and the Mediator complex. Although transcription factor and Mediator binding is largely unchanged in the context of WAPL and RAD21 depletion, the contact frequency between promoters and enhancers is strongly diminished, emphasizing the importance of cohesin over diffusion mediated interactions. Although the cohesin complex has been shown extrude DNA in vitro 46,47, the details of in vivo cohesin mediated loop extrusion remain to be worked out. The genes that depend on cohesin-mediated promoter-enhancer communication for their activation that we have identified can be used to further examine the role of loop extrusion in gene regulation.
Cohesin has previously been shown to overlap with the binding sites of sequence specific transcription factors18,19. In mESCs we found a subset of weakly bound cohesin sites overlapping with binding sites of pluripotency factors OCT4, SOX2 and NANOG. Stabilization of cohesin results in loss of cohesin from these binding sites. This binding can be either the result of direct or indirect recruitment by transcription factors at these sites or the result of stalling of the extrusion process akin to CTCF. Co-immunoprecipitation (Co-IP) experiments have identified an interaction between OCT4 and SMC1A in mESCs48, which could indicate that cohesin is directly recruited by OCT4, although the interaction between OCT4 and cohesin may occur via a third protein that interacts with both. Note that although Co-IP experiments for NANOG picked up an interaction with cohesin subunit STAG118, NANOG depletion did not affect cohesin binding in our experiments. Alternatively, OCT4, which acts as a pioneer factor, creates regions of open chromatin in conjunction with the chromatin remodeler BRG149. Since cohesin is recruited to sites of open chromatin50, this could explain why loss of OCT4 and SOX2, but not NANOG, leads to a loss of cohesin binding. However, not all open chromatin sites are enriched for cohesin binding, suggesting that there are additional signals to bring cohesin specifically to OCT4 bound open chromatin sites. Although the stalling scenario is a formal possibility to explain why cohesin is bound to transcription factor binding sites, this would effectively mean that transcription factor binding sites act as boundaries, for which there is currently little evidence in mammalian cells.
Importantly, we found that there is no difference in OCT4, SOX2 and NANOG binding upon WAPL depletion. This suggests that cohesin is not required for maintaining an open chromatin structure to allow for transcription factor binding in mESCs51. Our results also seem to conflict with earlier observations, where heterozygous knock-out of Rad21 leads to a loss of transcription factor binding19. However, the number of lost sites is rather limited and the differences may be attributed to pleiotropic effects of pan-cellular knock-out of one of the Rad21 alleles. In our acute depletion experiments we can assay the direct effects on transcription factor binding and do not find a severe change in binding. Based on this this we conclude that cohesin is not involved in transcription factor recruitment.
Our results shed light on the mechanism by which cohesin is involved in regulating gene expression. We show that a subset of cohesin binding sites depend on the activity of WAPL and are largely independent of CTCF and CTCF-anchored loops. Rather, the binding of cohesin depends on a specific subset of transcription factors. The pioneer transcription factors OCT4 and SOX2 create open chromatin regions which may serve as a binding platform for cohesin. Through the loop-forming capacity of the cohesin complex regulatory elements may in this way be connected to promoters in a dynamic manner to enhance expression. Cohesin binding sites found in the proximity of cell-type specific genes emphasize the importance of this complex for the proper expression of genes throughout development and may explain the pleiotropic effects found in cohesinopathies such as Cornelia de Lange syndrome52.
Methods
Mouse Embryonic Stem Cells (mESCs)
E14Tg2a (129/Ola isogenic background) and the derived cell lines were cultured on 0.1% gelatin-coated plates in serum-free DMEM/F12 (Gibco) and Neurobasal (Gibco) medium (1:1) supplemented with N-2 (Gibco), B-27 (Gibco), BSA (0.05%, Gibco), 104 U of Leukemia Inhibitory Factor/LIF (Millipore), MEK inhibitor PD0325901 (1 μM, Selleckchem), GSK3-β inhibitor CHIR99021 (3 μM, Cayman Chemical) and 1-Thioglycerol (1.5 × 10⁻⁴ M, Sigma-Aldrich). The cell lines were passaged every 2 days in daily culture. During the protein depletion experiments, the cells were seeded overnight before the start of the time course in the following densities: For a 96 h time course, 2.5 k, 35 k, 150 k, and 400 k cells were seeded in 24-well, 6-well, 10-cm and 15-cm plates, respectively. For 24 h time course, 5 k, 0.5 M, and 4 M cells were seeded in chamber slide (ThermoFisher Scientific), 6-well and 15-cm plates, respectively. The media were refreshed or the cells were split in 1:10 every 2 days during a time course.
Neural Progenitor Cells (NPCs)
The OsTir1 parental and WAPL-AID cells were seeded at 100 k cells and cultured in serum-free medium without LIF and 2i. After 7 days, the cells were transferred on a 3.5-cm gelatinized (0.15%; gelatin) plate and cultured in presence of recombinant murine EGF (10 ng/ml, PeproTech) and recombinant human FGF-basic (10 ng/ml, PeproTech) for an additional 7-10 days. The medium was refreshed daily during the differentiation procedure. The obtained neural progenitor cells were cultured on 0.1% gelatin-coated plates in the medium supplemented with EGF and FGF-basic and passaged every 3-4 days.
Indole-3-acetic Acid (IAA) and dTAG-13 Treatment
WAPL and RAD21 depletion were induced by treating the cells with a final concentration of 500 μM IAA (I5148-10G, Sigma Aldrich). OCT4-, SOX2- and NANOG-FKBP proteins were depleted by adding a final concentration of 500 nM dTAG-13 molecule (requested from Dr. Nathanael S. Gray from Dana-Faber Cancer Institute)35. All the time series experiments were performed by inducing protein degradation at different time points and harvest the samples in the end of the time course.
Plasmid Construction
The donor plasmid used to target the endogenous mouse WAPL protein was constructed by modifying a published pEN84 plasmid (Plasmid #86230, Addgene), and the donor plasmid used for mouse SOX2 and NANOG protein targeting was constructed using a published pAW62.YY1.FKBP.knock-in.mCherry (Plasmid #104370, Addgene). Two homology arms around the stop codon of the Wapl gene were amplified by PCR from genome DNA of the OsTir1 parental E14Tg2a cells. Two homology arms around the stop codon of the Sox2 gene were amplified by PCR from genome DNA of the E14Tg2a cells. Two homology arms of the Nanog gene (3’ end) and FKBPF36V-HA-2A sequence were purchased from Integrated DNA Technologies, Eurofins Genomics and Twist Bioscience, respectively. To construct the Wapl donor plasmid, the AID-eGFP tag linked with a puromycin resistance gene driven by a PGK promoter (AID-eGFP-PuroR) and the backbone sequence were PCR amplified from the pEN84 vector. The homology arms, AID-eGFP-PuroR and the backbone were then assembled using Gibson Assembly Cloning Kit (E5510S, New England BioLabs), followed by replacing the PuroR into a Neomycin/Kanamycin resistance gene. Construction of the donor plasmid for Rad21 targeting is similar to Wapl targeting with a replacement of Wapl homology arms and PuroR into Rad21 homology arms and blasticidin resistance gene (BlastR), respectively. To construct the donor plasmid for Sox2 and Nanog targeting, the homology arms, the FKBPF36V-HA-2A sequence, the mCherry (Sox2) or eGFP (Nanog) sequence and the backbone sequence were assembled using the same method as used for the Wapl donor plasmid.
To modify the Wapl gene, two sgRNAs were designed to target 3’-end sequence of the mouse Wapl gene. The Wapl-targeting sgRNAs were annealed, and consequently cloned into a pX335 dual nickase plasmid (Plasmid #42335, Addgene). The sgRNA sequence for targeting the Rad21 gene was cloned into a pX330 plasmid (Plasmid #42230, Addgene). To target the Sox2 gene, the sgRNA sequence was cloned into a pX330 plasmid (Plasmid #42230, Addgene). To target the Nanog gene, the sgRNA sequence was cloned into a pX330 plasmid (Plasmid #42230, Addgene).
The donor sequences and sgRNAs in the obtained plasmids were validated by Sanger sequencing before using for further experiments. sgRNA oligonucleotides, primers and DNA sequences used for plasmid construction are available in Supplementary Table 2.
Gene Targeting
The donor plasmids and their corresponding sgRNAs for Wapl and Nanog targeting were co-transfected into the parental cell lines using Lipofectamine 3000 Reagent (TheromFisher Scientific). Two to three days after transfection, the eGFP positive cells were sorted into a gelatinized 96-well plate for single clone selection. The obtained clones were genotyped by PCR and the fusion sequences were validated by Sanger sequencing. For Rad21 targeting, the donor plasmid and the sgRNA were electroporated into wild-type E14Tg2a cells using Neon Transfection System (ThermoFisher Scientific). The transfected cells were selected with 10 μg/ml blasticidin for 10 days, and then the BlastR was removed by transiently expressing flippase to trigger FRT recombination. Colonies were manually picked and genotyped by PCR for homozygous insertion of AID-GFP. An obtained homozygous RAD21-AID-eFP clone was electroporated in presence of 15 μg of an OsTIR1 donor plasmid (Plasmid #92142, Addgene) and 5 μg of a sgRNA plasmid targeting endogenous Tigre locus. Clones were manually picked and grew in a 96-well plate, and further validated by PCR and flow cytometry.
Western Blots
mESCs and NPCs were harvested and lysed in RIPA lysis buffer (150 mMNaCl, 1% NP-40, 0.5% sodium deoxycholate, 0.1% SDS, and 25 mM Tris (pH = 7.4)). The 6% in-house made SDS-PAGE gels were used to separate the WAPL and RAD21 proteins, and the 10% SDS-PAGE gels was used for SOX2, OCT4 and NANOG. The separated protein was transferred to a pre-activated PVDF membrane using Trans-Blot Turbo Transfer System (Bio-Rad). The blots were incubated with the following primary antibodies overnight at 4°C: (1) WAPL (1:1,000, 16370-1-AP, Proteintech), (2) RAD21 (1:1,000, ab154769, Abcam), (3) SOX2 (1:1,000, D9B8N, Cell Signaling), (4) OCT4 (1:1,000, D6C8T, Cell Signaling), (5) NANOG (1:1,000, D2A3, Cell Signaling), and (6) HSP90 (1:2,000, 13171-1-AP). After incubation, the blots were washed 3 times with TBS-0.1% Tween-20. The blots were then incubated with secondary antibody against rabbit IgG at room temperature for 1 h, following by 3-time TBS-0.1% Tween-20 washing. The proteins attached with antibodies were hybridized with Clarity Western ECL Substrate reagent (Bio-Rad) and visualized in a ChemiDoc MP Imaging System (Bio-Rad).
GFP Quantification and Cell Cycle Analysis
To quantify GFP signaling of WAPL depletion experiment, the WAPL-AID cells were treated with 500 nM IAA for 8 different time points (0, 5, 10, 20, 30, 45, 60, and 120 min), harvested and fixed with 2% paraformaldehyde at room temperature for 15 min. The parental cell line was also processed as a negative control. GFP signal was quantified on BD LSRFortessa analyzer (BD Biosciences).
Cell cycle analysis was performed following the protocol of Click-iT EdU Alexa Fluor 647 Flow Cytometry Assay Kit (Invitrogen). Briefly, cells were labeled with 10 μM Click-iT EdU for 1.5 h. The cells were then fixed and permeabilized. The EdU was detected using Click-iT Plus reaction cocktail for 30 min at room temperature and protected from light, and DNA content of the cells was stained with DAPI. DAPI and EdU signals were quantified on BD LSRFortessa analyzer.
All the raw data recorded in FACS analysis were processed using FlowJo software (version 10.3).
Cell Proliferation Analysis
To analyze proliferation rate of WAPL-depleted and parental cells, 10,000 cells were seeded in each well on a 6-well plate 16 h before start of the treatment. For depletion condition, 500 nM IAA was added into WAPL-AID and parental cells 24, 48, 72 and 96 h before harvesting. For wash-off condition, 500 nM IAA was added 96 h before harvesting, but withdrawn 48 h before harvesting (48 h on 48 h off). The control cells were treated with H2O (0 h). In the end of 96 h treatment, cells were trypsinized into single cells and counted using BioRad TC20™ Automated Cell Counter. Each of the samples were counted twice, and each of the treatment conditions were performed in triplicates in 3 continuous weeks,
Number of cell cycles in the end of treatment was estimated for each of the treatment condition using the following formula: number of cell cycles = log2(total number of cells/10,000).
Immunofluorescence Staining
For GFP visualization cells were grown on poly-L-lysine (Sigma Aldrich) coated chamber slides (ThermoFisher Scientific), fixed in 4% formaldehyde (FA) and nuclei were counterstained with Hoechst 33342 (ThermoFisher Scientific).
For RAD21 immunofluorescence analysis in mESCs, we let single cells adhere for 30 min on poly-L-lysine coated slides. Next, pre-extraction of the non-chromatin-associated RAD21 fraction was performed by incubation with 0.1% Triton X-100 in PBS for 1 min followed by fixation with 4% FA. Staining was performed with rabbitanti-RAD21 (Abcam, ab154769, 1:200) followed by incubation with goat anti-rabbit Alexa Fluor 647 (Abcam, 1:250). Nuclei were counterstained with 4’,6-Diamidino-2-Phenylindole (DAPI) (ThermoFisher Scientific). For NPCs, cells were grown on poly-L-lysine coated coverslips fixed in 4% FA and stained with mouse anti-NESTIN (BD biosciences, 611659, 1:200) and rabbit anti-GFAP (DAKO, Z033429-2, 1:100) antibodies, followed by incubation with goat anti-mouse Alexa Fluor 488 and goat anti-rabbit Alexa Fluor 568 antibodies (both ThermoFisher Scientific, 1:250). Nuclei were counterstained with DAPI. Prior to imaging all samples were mounted with FluorSave reagent (Merck). Fluorescent confocal images were captured on a Leica SP5 system (Leica, Wetzlar, Germany). All the immunofluorescence images were processed using ImageJ software (version 1.53c).
Alkaline Phosphatase Staining
Alkaline phosphatase staining was performed following the protocol of Leukocyte Alkaline Phosphatase Kit (Sigma-Aldrich). Cells were fixed in Citrate-Acetone-Formaldehyde solution for 30 s and gently washed in deionized water for 45 s, followed by stained in diluted Naphthol AS-BI Alkaline Solution at room temperature for 15 min, and visualized under bright-field microscopy.
Single-cell colony formation assay
Single-cell colony formation assay was performed using a previously published protocol53. WAPL-AID and parental cells were pre-treated with H2O (0 h) or 500 nM IAA (96 h) 96 h before harvesting, or 500 nM IAA treatment for 48 h and wash-off for another 48 h (48 h on 48 h off). After harvesting, DAPI negative single cells were sorted into 0.1% gelatinized 96-well plates. For each of the treatment conditions, 95 single cells were seeded and followed by 2-week colony formation. Each of the treatment conditions were performed in triplicates in 3 continuous weeks, and number of colonies was blindly scored by two independent researchers.
RT-qPCR
Total RNA was isolated, treated with DNase I to remove residual of genomic DNA contamination, and reversed transcribed into cDNA using iScript™ cDNA Synthesis Kit (Bio-Rad). The Sik1, Klf4 and S26 genes were quantified using the qPCR primers and SensiFAST™ SYBR No-Rox Kit (Bioline) described in Supplementary Table 2.
ChIP-seq
All the ChIP-seq experiments were performed in presence of 10% HEK293T cells as an internal reference using a published protocol with small modifications54. For chromatin preparation, mESCs were mixed with 10% HEK293T cells and cross-linked by a final concentration of 1% formaldehyde for 10 min. The cross-linking reaction was quenched using 2.0 M glycine. The cross-linked cells were then lysed and sonicated to obtain ~300 bp chromatin using Bioruptor Plus sonication device (Diagenode). For ChIP assays, antibodies were first coupled with Protein G beads (ThermoFisher Scientific), and then the sonicated chromatin were incubated overnight at 4°C with the antibody coupled Protein G beads. After over incubation, captured chromatin was washed, eluted and de-crosslinked. The released DNA fragments were purified using MiniElute PCR Purification Kit (Qiagen). The ChIP experiments were performed using the following antibodies: (1) WAPL (16370-1-AP, Proteintech, 5 μg per ChIP), (2) CTCF (07-729, Merck Millipore, 5 μl per ChIP), (3) RAD21 (ab154769, Abcam, 2.2 μg per ChIP), (4) SOX2 (AF2018, R&D Systems, 5 μg per ChIP), (5) OCT4 (AF1759, R&D Systems, 5 μg per ChIP), (6) NANOG (RCAB002P-F, Cosmo Bio Co., 5 μg per ChIP), (7) MED1 (A300-793A, Bethyl Laboratories, 5 μg per ChIP), (8) H3K4me3 (pAb-003-050, Diagenode, 5 μg per ChIP), and (9) H3K27ac (ab4729, Abcam, 5 μg per ChIP).
The purified DNA fragments were prepared according to the protocol of KAPA HTP Library Preparation Kit (Roche) prior to sequencing. All the ChIP-seq libraries were sequenced using the single-end 65-cycle mode on an Illumina HiSeq 2500.
RNA-seq
RNA was isolated following a standard TRIzol RNA isolation protocol (Ambion). The cells were lysed using 1 ml of TRIzol reagent, and 200 μl chloroform was added to the lysates. The mixture was vortexed and centrifuged at 12,000 g at 4°C for 15 min. Upper phase was homogenized with 0.5 ml of 100% isopropanol, incubated at room temperature for 10 min, and centrifuged at 4°C for 10 min. The resulted RNA pellet was washed with 75% ice-cold ethanol, dried at room temperature for 10 min, and resuspended in RNase-free water. The isolated RNA was treated with DNase using RNeasy Mini Kit (Qiagen).
TT-seq
TT-seq libraries were prepared following a published protocol31,. The untreated and 500 nM treated WAPL-AID cells (6 and 24 h) were labeled using 2 mM 4SU for 10 min. Total RNA from the labeled cells was isolated and fragmented. Then 4SU-labeled RNA fragments were biotinylated and enriched using streptavidin MicroBeads. TT-seq libraries were prepared using KAPA RNA HyperPrep Kits (Roche) and KAPA Dual-Indexed Adapter Kits (Roche). TT-seq libraries were sequenced on a NextSeq 550.
ATAC-seq
ATAC-seq libraries were prepared following a published protocol54. Nuclei were isolated, permeabilized, and tagmented using in-house produced Tn5 transposase. The resulted DNA fragments underwent two sequential 9-cycle PCR amplification and the fragments < 700 bp were purified using SPRI beads. ATAC-seq libraries were sequenced on a NextSeq 550.
Hi-C
We generated Hi-C data as previously described1 with minor modifications4. For each template, 10 million cells were harvested and crosslinked using 2% formaldehyde. Crosslinked DNA was digested in nucleus using MboI, and biotinylated nucleotides were incorporated at the restriction overhangs and joined by blunt-end ligation. The ligated DNA was enriched in a streptavidin pull-down. Hi-C libraries were prepared using a standard end-repair and A-tailing method and sequenced on an Illumina HiSeq X sequencer generating paired-end 150-bp reads.
4C-seq
We generated 4C data for untreated and 24 h IAA-treated WAPL-AID and RAD21-AID cells. 4C was performed as previously described32,55 using a two-step PCR method for indexing described first in4. We used MboI as the first restriction enzyme and Csp6I as the second restriction fragment. Viewpoint specific primers can be found in Supplementary Table 2. The 4C-seq libraries were sequenced using the same platform as the ChIP-seq libraries.
ChIP-seq Analysis
Calibrated ChIP-seq data were analyzed based on a modified method described in previously56. Raw sequencing data were mapped to a concatenated reference genome (mm10 and hg19) using Bowtie 2 mapper (version 2.3.4.1)57. The mapped reads with mapping quality score < 15 and the optical PCR duplicates were discarded using SAMtools (version 1.9)58. The reads derived from the reference HEK293T cells (hg19, raw human reads/HRraw) were scaled to 1 M reads which resulted in a scaling factor for normalizing the reads from mouse embryonic stem cells (mm10, raw mouse reads/MRraw). The scaling method can be summarized using the following steps:
-
(1)
derive a scaling factor (SF): SF = 1,000,000/HRraw;
-
(2)
compute scaled ChIP-seq coverage: MRscale = MRraw × SF, HRscale = HRraw × SF.
The coverage files (bigWig files) were generated by applying the above computed scaling factor using deepTools (version 3.0). Peak calling was performed using MACS2 (version 2.1.1.20160309)60 at a q-value cutoff of 0.01.
The scaled coverage files are not corrected for intensity bias caused by quality difference of the individual ChIP-seq profiles. Therefore, we computed average enrichment of the ChIP-seq experiments under direct comparison using their spike-in reference. The ratio between average enrichment of the spike-in reference was used to normalize the corresponding ChIP-seq profiles (see an example in Extended Data Fig. 1d).
Standard ChIP-seq Analysis
The re-analyzed publicly available ChIP-seq data (Supplementary Table 3) were mapped to a mm10 reference. The mapped reads with mapping quality score < 15 and the optical PCR duplicates were discarded using SAMtools. Peak calling was performed using MACS2 at a q-value cutoff of 0.01. The coverage files of uncalibrated ChIP-seq data and the data of pluripotency factors (due to absence of these factors in HEK293T cells) were generated using “normalize to 1× genome coverage” methods in deepTools (version 3.0).
ChIP-seq Peak Alignment and Functional Annotation
Alignment of ChIP-seq signal was performed using deepTools (version 3.0)61. “Scale-regions” methods was applied to align the signal coverage from broad regions (RDC and RSC). Heatmaps were directly made using deepTools. Alignment plots were generally made with aligned matrices that were further processed in R.
The RDC and RSC were annotated using a web-version GREAT analysis tool (version 3.0.0)26 against Mouse Genome Informatics (MGI) database (version 6.15)27 using a “basal plus extension” method to link ChIP-seq peaks to their gene targets.
External data
The external datasets that have been used in this study are listed in Supplementary Table 3.
Motif Analysis
A merged peak list was created from RAD21 ChIP-seq data of the control and treated NPCs. The read coverage under the peaks was determined using “peakstats.py” function in SolexaTools (version 2.1). The peaks with at least 10 reads in both replicates were kept for further analysis. DESeq2 (version 1.18.1)62 was used to normalize the filtered coverage data between the samples based on their size factors. A Wald test in DESeq2 was used to detect differential peaks between the control and treated samples using a FDR cutoff of 0.01 and a fold change of 2.
We performed motif identification on the peaks higher in the untreated samples (0 h enriched) and the unchanged peak set from the DESeq2 analysis using the GimmeMotifs (version 0.13.1)63 using the non-redundant cis-bp database (version 3.0). Next, we calculated for every motif the frequency in the 0 h enriched peak set and the constant peak set. We normalized the motif frequency by dividing the individual motif frequency by to total number of identified motifs (relative motif frequency). We calculated the log2 -enrichment score by calculating the ratio of the 0 h enriched relative motif frequency dividing the constant relative motif frequency. The P value was calculated using the Fisher exact test on the following 2 × 2 table: for every motif M, we determine the number of the 0 h enriched peaks with or without M and for the constant peaks with or without M.
RNA-seq Analysis
Raw RNA-seq data were mapped against mm10 reference genome using a TopHat2 pipeline (version 2.1.1)64. The mapped reads with mapping quality score < 10 were discarded using SAMtools. The read coverage for each gene (exon only) in “Mus musculus GRCm38.92” annotation file was determined using a HTSeq tool (version 0.9.1). The coverage files were generated using “normalize to 1× genome coverage” methods in deepTools.
The genes with at least 20 reads in both replicates were kept for further analysis. The filtered expression data were normalized based on the size factors of the individual samples using a DESeq2 package (version 1.18.1). The significant genes were detected by comparing the control and treated samples using Wald test built in DESeq2 with an FDR of 0.05. The results were visualized using “heatmap.2” function in a “gplots” package (version 3.0.1.1). GSEA was performed using a desktop version of GSEA tool (version 3.0)65 and a Molecular Signatures Database (MSigDB, version 6.2)66. The genes were ranked based on the difference in log2 ratios between the control and treated samples. The seed for permutation was set at the option “149”.
TT-seq Analysis
Raw TT-seq data were mapped against mm10 reference genome using a TopHat2 pipeline (version 2.1.1)64 with the following settings adjusted for nascent RNA sequencing: (1) microexon-search, and (2) fr-firststrand. The mapped reads with mapping quality score < 10 were discarded using SAMtools. The read coverage for each gene (the entire gene) in “Mus musculus GRCm38.92” annotation file was determined using a HTSeq tool (version 0.9.1).
The downstream analysis of TT-seq data was performed using the same settings as RNA-seq for proper data comparison using A DESeq2 package (version 1.18.1).
ATAC-seq Analysis
ATAC-seq data were mapped against mm10 reference genome using BWA-MEM (version 0.7.15-r1140)67. The mapped reads with mapping quality score < 15, as well as optical PCR duplicates, were discarded using SAMtools. The coverage files were generated using “normalize to 1× genome coverage” methods in deepTools (version 3.0). Alignment of ATAC-seq was performed the same as ChIP-seq data.
Hi-C data Processing
Raw Hi-C data were mapped with HiC-Pro68, which performs mapping, identification of valid Hi-C pairs, generation of contact matrices and ICE normalization69. Loops were called using HiCCUPS (version 0.9). Subsequent analyses were performed in GENOVA, a Hi-C visualization tool written in R (http://github.com/deWitLab/GENOVA).
Self-interaction Score
In order to calculate the degree of local self-interaction we calculated a self-interaction score (SI). We used 20-kb Hi-C matrices to calculate the SI. In order to calculate the degree of self-interaction for a given region i of window size w, we calculate the mean contact frequency of all the Hi-C bins in this region with each other. Effectively, this means calculating the average signal within a triangle close to the diagonal (Fig. 2b). Note that the bottom of the triangle is nearest to the diagonal. Because the highest signal is on the diagonal itself we remove the diagonal from the self-interaction score. To correct for chromosome-wide trends in the self-interaction score, we subtract for every region i in the genome the median of the 100 self-interaction scores up and down from that window and the self-interaction score of that window itself (SIi – median {SIi-100, SIi-99,…,SIi+100}). In this way the self-interaction score is calculated over a local background, explaining negative SI scores.
Identification of RDCs and RSCs
In order to identify RDCs and RSCs we binned the RAD21 ChIP-seq signal in untreated and 24 hour treated WAPL-AID cells to 100-bp bins. Next we perform per chromosome quantile normalization70. We calculate the difference between untreated and the treated and discretize into three observation values: ‘ChIP_up’ (difference between 0 h and 24 h > 1), ‘ChIP_down’ (difference between 0 h and 24 h < -1) and ‘ChIP_same’ (difference between 0 h and 24 h > -1 and < 1). We create a fully connected hidden Markov model with three states: RDC, RSC and no_change. Every state has specific emission probabilities for the different observations and transition probabilities of 10-6 to transition into a different state. This analysis is implemented using the function from the R package HMM.
RDC/RSC RNA-seq Intersection
We intersected the RDCs and RSCs with the expression data by determining for every RDC and RSC the closest gene, from here on called RDC or RSC gene. Next, we determined for the RDC and RSC genes whether they are upregulated, downregulated or unchanged. The fraction of genes in every category (observed) was compared to the genome-wide fraction of genes in the upregulated, downregulated or unchanged category (expected). The ratio of observed over expected was calculated for every time point, RDC, RSC and cell line. To determine the probability of this happening by accident we performed a circular permutation analysis using regioneR71. The confidence intervals and empirical P values are the result of 10,000 permutations.
4C-seq Analysis
The raw sequence data were mapped using our 4C mapping pipeline (http://github.com/deWitLab/4C_mapping). We normalized our 4C data to 1 million intrachromosomal reads using peakC (http://github.com/deWitLab/peakC)55.
Extended Data
Extended Data Fig. 1. Generating a WAPL-AID degron line.
a, Homologous recombination strategy for tagging the endogenous Wapl gene with AID-eGFP. Note that the targeting construct contains a NeoR/KanR resistance gene, but that this has not been used for selecting the first clone. Middle panel shows PCR validation (primers highlighted in left panel) showing homozygous integration of the donor vector (n=1). Right panel shows Sanger sequencing results confirming in-frame tagging of AID tag. b, Left panel shows live cell imaging of WAPL in untreated (0h) and treated (24h) cells (representative images from 3 separate fields). DNA is visualized with Hoechst. Right panel show immunostaining of cohesin subunit RAD21 (representative images from 100 independent cells). DNA is labeled with DAPI. c, WAPL-AID-GFP levels were measured by FACS (gated on all cells besides debris). High temporal resolution shows rapid depletion of WAPL-AID-GFP upon IAA treatment. Median GFP intensity is quantified in bottom plots. Signals are the average of three experiments. Dots indicate mean values. Error bars indicate standard deviation. d, ChIP-seq of WAPL and CTCF before and after IAA treatment. Heatmaps show the distribution of signal for the peaks called in the untreated cells. Average signal is shown above the heatmap. ChIP-seq data is calibrated using spiked-in human HEK-293T cells. Middle two heatmaps show WAPL ChIP-seq signal derived from the human cells.
Extended Data Fig. 2. Effects of WAPL depletion on cell cycle and pluripotency of ES cells.
a, FACS plots showing EdU incorporation to measure the cycle phase of individual cells. All single cells are gated, and G1, S and G2 cells are then separated using the blue, orange and red gates, respectively. b, Quantification of cycle phases based on DAPI/EdU FACS analysis for various times after WAPL depletion (n=3 independent experiments). Height of bar indicates mean value. Error bars show standard deviation. Cyan dots show the value of individual measurements. c, An illustration of cell proliferation assay following WAPL depletion. d, Cell cycles measured following WAPL depletion (n=3 independent experiments). Height of bar indicates mean value. Error bars show standard deviation. Blue dots show the value of individual measurements. e, Western blot showing the protein levels of the pluripotency transcription factors SOX2, OCT4 and NANOG (cropped, n=1). f, Alkaline phosphatase (AP) staining is measured as a marker for pluripotency on the untreated (0 h), treated (96 h) and 48 h treatment followed by 48 h wash-off WAPL-AID and parental cell line (representative images from 2 independent clones). g, An illustration of single cell colony formation experiment following WAPL depletion. h, Single cell colony formation measured following WAPL depletion (n=3 independent experiments). Height of bar indicates mean value. Error bars show standard deviation. Blue dots show the value of individual measurements.
Extended Data Fig. 3. Effects of WAPL depletion on global gene expression.
a, A volcano plot shows differential genes between the untreated parental (PT) and WAPL-AID cells at a false discovery rate (FDR) cutoff of 0.05. b, Transcriptomic changes of PT cells with 96 h IAA treatment following using the same FDR cutoff as (a). c, Transcriptomic changes at different time points following WAPL depletion using the same FDR cutoff as (a,b). d, Heatmap showing the genes that are differentially expressed following IAA treatment in WAPL-AID cells. Genes are clustered according to the timepoint in which they are first observed to be differentially expressed (left panel). e, Gene Set Enrichment Analysis of RNA-seq data following WAPL depletion. Analysis was performed for Gene Ontology databases and the significant (FDR < 0.01) terms with a positive normalized enrichment score (NES) are plotted. Terms that are related to development, differentiation or morphogenesis are highlighted.
Extended Data Fig. 4. ChIP-seq heatmaps of two active histone modifications.
Left panel shows signal of the active promoter mark H3K4me3 aligned to the promoters of differentially expressed genes. Right panel shows H3K27ac alignment to enhancers within 10kb up- or downstream of the promoter of a differentially expressed gene.
Extended Data Fig. 5. Validation and functional annotation of the Regions of Dynamic Cohesin.
a, Venn diagram showing the uniquely bound and overlapping RAD21 binding sites identified by ChIP-seq in a second WAPL-AID clone. Peak calling was performed on a subset of 7 M sequencing reads for both of the samples. b, Scatter plot showing the Pearson correlation of RAD21 ChIP-seq data between the two different WAPL-AID clones. Red rectangle highlighting the correlation of the same time points. c, Alignment of RAD21 binding data from a second WAPL-AID clone on the RDCs and RSCs identified in the original WAPL-AID clone. d, Alignment of published ChIP-seq data for five different cohesin subunits generated in V6.5 mESC line (see Supplementary Table 2 for details). e, Example locus showing a region with an RDC and RSC. RAD21 binding is shown for treated and untreated cell for two WAPL-AID clones. Cohesin binding is shown for the five subunits shown in (d). f, Table containing the top 5 (by lowest FDR) categories in a GREAT analysis using the Mouse Genome Informatics (MGI) expression database for RDCs and RSCs.
Extended Data Fig. 6. Molecular features of the Regions of Dynamic Cohesin and the Regions of Stalled Cohesin.
a, Alignments of H3K27ac and MED1 ChIP-seq data on RDCs and RSCs. b, Example region showing the relationship between the factors analyzed in Fig. 1g and the position of a RSC. c, similar alignments as (a) but for SOX2, OCT4 and NANOG ChIP-seq data. d, RAD21 alignment on the transcription start sites (TSS) of the top 1000 most stably expressed housekeeping genes for treated and untreated cells in two different clones.
Extended Data Fig. 7. Global effects of WAPL depletion on genome architecture and nascent transcription.
a, Relative contact probability plot (RCP) showing the distribution of the chance of two loci contacting in the context of the 3D genome as a function of the distance between them on the linear chromosome. b, Example locus showing the formation of extended loops upon WAPL depletion. Heatmaps visualize the contact frequency matrices for the Nfe2l3 locus. Rightmost panel shows the differential contacts between the 24h treated cells and the untreated cells. c, Total number of TADs detected in control (0 h) and WAPL depleted (24 h) cells. d, TAD size from control (0 h) and WAPL depleted (24 h) depleted cells (Box plot elements: center line, median; box, inter quartile range/IQR; whiskers, 1.5 times the IQR from the median value; dots, instances lower or higher than the IQR from the median value). e, Distribution of intra- and inter-TAD interactions. f, Global effects of WAPL depletion on nascent transcription at early time points (6 and 24 h). g, Nascent transcription changes following WAPL depletion are plotted using the same gene clusters described in Extended Data Fig. 3d.
Extended Data Fig. 8. Depletion of WAPL and RAD21 reorganizes the 3D genome and affects gene expression.
a, Effects of WAPL depletion on gene expression similar to Fig. 2d but using RNA-seq. The yellow stars indicate the observed over expected enrichment of the RNA-seq data (n=2 independent experiments), and the violin plots show distribution of enrichment based on 10,000 random circular permutations (red lines: median values, orange lines: interquartile range, *: FDR<0.001, **: FDR<0.0001). b, High-resolution 4C-seq data for the Klf4 locus (viewpoint: Klf4 enhancer, overlapping with the distal RDC of the Klf4 gene). The 4C-seq data is visualized in the same way as Fig. 2e. The bottom two rows show nascent transcription of the Klf4 gene and neighboring region in the untreated (0 h) and treated (24 h) ES cells. c, Expression of the Klf4 gene was quantified by RT-qPCR (n=3 independent experiments) after 24 h of WAPL depletion and 24 h depletion followed by 24/48 h wash-off (two-sided student’s t-test without multiple testing correction, bar height: mean values, error bars: standard deviations, red dots: individual data points). d, High-resolution 4C-seq analysis of the Klf4 locus in the RAD21 depletion experiment (viewpoint: the same as (b)). The 4C-seq data is visualized in the same way as Fig. 2e. The bottom two rows show expression of the Klf4 gene and neighboring region in the untreated (0 h) and treated (24 h) ES cells. e, Global effects of RAD21 depletion on gene expression at early time points (6 and 24 h).
Extended Data Fig. 9. The role of transcription factors in the recruitment of cohesin.
a-c, heatmaps showing the binding of pluripotency transcription factor SOX2 (a), OCT4 (b) and NANOG (c) remain unchanged following WAPL depletion. d, A published OCT4-FKBP-mCherry cell lines was used. The FKBP degron can be degraded with the dTAG-13 molecule. e, A western blot shows protein levels of OCT4 after 6 and 24 hours of dTAG-13 treatment (cropped). f-g, ChIP-seq heatmaps showing MED1 binding at OCT4 binding sites and NANOG binding sites in the OCT4-FKBP (f) and NANOG-FKBP (g) lines, respectively. h-i, ChIP-seq heatmaps showing RAD21 binding and chromatin accessibility at CTCF binding sites in OCT4-FKBP (h), SOX2-FKBP (i, left) and NANOG-FKBP (i right). For OCT4-FKBP CTCF sites from V6.5 mESCs were used for alignment and for Nanog-FKBP, which are derived from E14 mESCs CTCF sites identified in WAPL-AID cells were used.
Extended Data Fig. 10. Further characterization of RAD21 binding in WAPL-AID NPCs.
a, Staining for Nestin (Green) and GFAP (red) in NPCs derived from the WAPL-AID cell line (representative images from 2 experiments and 3 separate fields per experiment). b, Staining for alkaline phosphatase in NPCs derived from the WAPL-AID cell line (n=1). c, Comparison of the differential genes between ESC and NPC identified in a published study and in the WAPL-AID line. d, Venn diagram shows overlap of RAD21 binding sites measured ChIP-seq for untreated and 24h treated WAPL-AID NPCs. Only sites that showed consistent unique or shared binding across two replicates were included. Peak calling was performed on a subset of 7 M sequencing reads for all the samples. e, MA-plot showing the log2 fold-change as a function of the number of reads in a RAD21 peak. Highlighted dots indicate significantly changed RAD21 levels based on DESeq2 with an FDR <0.01 and a fold-change of at least 2 up or down. Red is increase in RAD21, blue is decrease. f, Annotation of the motifs identified in Fig. 5d.
Supplementary Material
Acknowledgements
We thank the NKI Genomics Core Facility for help with sequencing, the NKI Bioimaging Facility for help with microscopy, the NKI Flow Cytometry Facility for help with single-cell sorting of genome-edited cells. We thank Masato Kanemaki for his suggestions on AID tagging and sharing OsTir1 antibody. We thank Behnam Nabet and Nathaniel Gray for providing the dTAG-13 molecule. We thank Richard Young for providing the OCT4-dTAG mESC line. Work in the de Wit laboratory is supported by an ERC StG 637587 (‘HAP-PHEN’) and a Vidi grant from the Netherlands Scientific Organization (NWO, ‘016.16.316’). N.Q.L. is supported by a Veni grant from the Netherlands Scientific Organization (NWO, ‘016.Veni.181.014’). N.Q.L., M.M., T.v.d.B, L.B., H.T., M.M.G.A.S., and E.d.W. are part of Oncode which is partly financed by the Dutch Cancer Society.
Footnotes
Author Contributions
N.Q.L. and E.d.W. conceived and designed the study; N.Q.L., M.M., L.B., and H.T. performed experiments in the laboratory of E.d.W.; E.P.N. engineered OsTir1 and RAD21-AID cell lines in the laboratory of B.G.B; N.Q.L., T.v.d.B., M.M.G.A.S. and E.d.W. analyzed data; E.d.W. supervised the study; N.Q.L. and E.d.W. wrote the manuscript with input from all authors.
Competing Financial Interests
The authors declare no competing financial interests.
Data Availability
Raw and processed sequencing data generated in this study are available from the Gene Expression Omnibus under accession GSE135180. Source data are provided with this paper.
Code Availability
Custom R code associated with this manuscript can be found at https://github.com/deWitLab/Liu_2020_NatureGenetics.
References
- 1.Rao SSP, Huntley MH, Durand NC, Stamenova EK. A 3D Map of the Human Genome at Kilobase Resolution Reveals Principles of Chromatin Looping. Cell. 2014;159:1665–1680. doi: 10.1016/j.cell.2014.11.021. [DOI] [PMC free article] [PubMed] [Google Scholar]
- 2.de Wit E, et al. CTCF Binding Polarity Determines Chromatin Looping. Mol Cell. 2015;60:676–684. doi: 10.1016/j.molcel.2015.09.023. [DOI] [PubMed] [Google Scholar]
- 3.Sanborn AL, et al. Chromatin extrusion explains key features of loop and domain formation in wild-type and engineered genomes. Proc Natl Acad Sci. 2015;112 doi: 10.1073/pnas.1518552112. 201518552. [DOI] [PMC free article] [PubMed] [Google Scholar]
- 4.Haarhuis JHI, et al. The Cohesin Release Factor WAPL Restricts Chromatin Loop Extension. Cell. 2017;169:693–707.e14. doi: 10.1016/j.cell.2017.04.013. [DOI] [PMC free article] [PubMed] [Google Scholar]
- 5.Rao SSP, et al. Cohesin Loss Eliminates All Loop Domains. Cell. 2017;171:305–320.e24. doi: 10.1016/j.cell.2017.09.026. [DOI] [PMC free article] [PubMed] [Google Scholar]
- 6.Nora EP, et al. Targeted Degradation of CTCF Decouples Local Insulation of Chromosome Domains from Genomic Compartmentalization. Cell. 2017;169:930–944.e22. doi: 10.1016/j.cell.2017.05.004. [DOI] [PMC free article] [PubMed] [Google Scholar]
- 7.Wutz G, et al. Topologically associating domains and chromatin loops depend on cohesin and are regulated by CTCF, WAPL, and PDS5 proteins. EMBO J. 2017 doi: 10.15252/embj.201798004. e201798004. [DOI] [PMC free article] [PubMed] [Google Scholar]
- 8.Schwarzer W, et al. Two independent modes of chromatin organization revealed by cohesin removal. Nature. 2017;551:51–56. doi: 10.1038/nature24281. [DOI] [PMC free article] [PubMed] [Google Scholar]
- 9.Hyle J, et al. Acute depletion of CTCF directly affects MYC regulation through loss of enhancer-promoter looping. Nucleic Acids Res. 2019;47:6699–6713. doi: 10.1093/nar/gkz462. [DOI] [PMC free article] [PubMed] [Google Scholar]
- 10.Hadjur S, et al. Cohesins form chromosomal cis-interactions at the developmentally regulated IFNG locus. Nature. 2009;460:410–413. doi: 10.1038/nature08079. [DOI] [PMC free article] [PubMed] [Google Scholar]
- 11.Paliou C, et al. Preformed chromatin topology assists transcriptional robustness of Shh during limb development. Proc Natl Acad Sci. 2019;116:12390–12399. doi: 10.1073/pnas.1900672116. [DOI] [PMC free article] [PubMed] [Google Scholar]
- 12.Chan K-L, et al. Cohesin’s DNA exit gate is distinct from its entrance gate and is regulated by acetylation. Cell. 2012;150:961–74. doi: 10.1016/j.cell.2012.07.028. [DOI] [PMC free article] [PubMed] [Google Scholar]
- 13.Huis in ‘t Veld PJ, et al. Characterization of a DNA exit gate in the human cohesin ring. Science. 2014;346:968–972. doi: 10.1126/science.1256904. [DOI] [PubMed] [Google Scholar]
- 14.Kueng S, et al. Wapl Controls the Dynamic Association of Cohesin with Chromatin. Cell. 2006;127:955–967. doi: 10.1016/j.cell.2006.09.040. [DOI] [PubMed] [Google Scholar]
- 15.Nishiyama T, et al. Sororin Mediates Sister Chromatid Cohesion by Antagonizing Wapl. Cell. 2010;143:737–749. doi: 10.1016/j.cell.2010.10.031. [DOI] [PubMed] [Google Scholar]
- 16.Misulovin Z, Pherson M, Gause M, Dorsett D. Brca2, Pds5 and Wapl differentially control cohesin chromosome association and function. PLOS Genet. 2018;14 doi: 10.1371/journal.pgen.1007225. e1007225. [DOI] [PMC free article] [PubMed] [Google Scholar]
- 17.Kagey MH, et al. Mediator and cohesin connect gene expression and chromatin architecture. Nature. 2010;467:430–435. doi: 10.1038/nature09380. [DOI] [PMC free article] [PubMed] [Google Scholar]
- 18.Nitzsche A, et al. RAD21 Cooperates with Pluripotency Transcription Factors in the Maintenance of Embryonic Stem Cell Identity. PLoS One. 2011;6 doi: 10.1371/journal.pone.0019470. e19470. [DOI] [PMC free article] [PubMed] [Google Scholar]
- 19.Faure AJ, et al. Cohesin regulates tissue-specific expression by stabilizing highly occupied cis-regulatory modules. Genome Res. 2012;22:2163–2175. doi: 10.1101/gr.136507.111. [DOI] [PMC free article] [PubMed] [Google Scholar]
- 20.Kojic A, et al. Distinct roles of cohesin-SA1 and cohesin-SA2 in 3D chromosome organization. Nat Struct Mol Biol. 2018;25:496–504. doi: 10.1038/s41594-018-0070-4. [DOI] [PMC free article] [PubMed] [Google Scholar]
- 21.Cuadrado A, et al. Specific Contributions of Cohesin-SA1 and Cohesin-SA2 to TADs and Polycomb Domains in Embryonic Stem Cells. Cell Rep. 2019;27:3500–3510.e4. doi: 10.1016/j.celrep.2019.05.078. [DOI] [PMC free article] [PubMed] [Google Scholar]
- 22.Tedeschi A, et al. Wapl is an essential regulator of chromatin structure and chromosome segregation. Nature. 2013;501:564–568. doi: 10.1038/nature12471. [DOI] [PMC free article] [PubMed] [Google Scholar]
- 23.Haarhuis JHI, et al. WAPL-mediated removal of cohesin protects against segregation errors and aneuploidy. Curr Biol. 2013;23:2071–2077. doi: 10.1016/j.cub.2013.09.003. [DOI] [PubMed] [Google Scholar]
- 24.Aladjem MI, et al. ES cells do not activate p53-dependent stress responses and undergo p53-independent apoptosis in response to DNA damage. Curr Biol. 1998;8:145–155. doi: 10.1016/s0960-9822(98)70061-2. [DOI] [PubMed] [Google Scholar]
- 25.Natsume T, Kiyomitsu T, Saga Y, Kanemaki MT. Rapid Protein Depletion in Human Cells by Auxin-Inducible Degron Tagging with Short Homology Donors. Cell Rep. 2016;15:210–218. doi: 10.1016/j.celrep.2016.03.001. [DOI] [PubMed] [Google Scholar]
- 26.McLean CY, et al. GREAT improves functional interpretation of cis-regulatory regions. Nat Biotechnol. 2010;28:495–501. doi: 10.1038/nbt.1630. [DOI] [PMC free article] [PubMed] [Google Scholar]
- 27.Bult CJ, et al. The Mouse Genome Database: enhancements and updates. Nucleic Acids Res. 2010;38:D586–D592. doi: 10.1093/nar/gkp880. [DOI] [PMC free article] [PubMed] [Google Scholar]
- 28.Busslinger GA, et al. Cohesin is positioned in mammalian genomes by transcription, CTCF and Wapl. Nature. 2017;544:503–507. doi: 10.1038/nature22063. [DOI] [PMC free article] [PubMed] [Google Scholar]
- 29.de Jonge HJM, et al. Evidence Based Selection of Housekeeping Genes. PLoS One. 2007;2 doi: 10.1371/journal.pone.0000898. e898. [DOI] [PMC free article] [PubMed] [Google Scholar]
- 30.Schwalb B, et al. TT-seq maps the human transient transcriptome. Science. 2016;352:1225–1228. doi: 10.1126/science.aad9841. [DOI] [PubMed] [Google Scholar]
- 31.Gregersen LH, Mitter R, Svejstrup JQ. Using TTchem-seq for profiling nascent transcription and measuring transcript elongation. Nat Protoc. 2020;15:604–627. doi: 10.1038/s41596-019-0262-3. [DOI] [PubMed] [Google Scholar]
- 32.van de Werken HJG, et al. Robust 4C-seq data analysis to screen for regulatory DNA interactions. Nat Methods. 2012;9:969–972. doi: 10.1038/nmeth.2173. [DOI] [PubMed] [Google Scholar]
- 33.Rhodes JDP, et al. Cohesin Disrupts Polycomb-Dependent Chromosome Interactions in Embryonic Stem Cells. Cell Rep. 2020;30:820–835.e10. doi: 10.1016/j.celrep.2019.12.057. [DOI] [PMC free article] [PubMed] [Google Scholar]
- 34.Boija A, et al. Transcription Factors Activate Genes through the Phase-Separation Capacity of Their Activation Domains. Cell. 2018;175:1842–1855.e16. doi: 10.1016/j.cell.2018.10.042. [DOI] [PMC free article] [PubMed] [Google Scholar]
- 35.Nabet B, et al. The dTAG system for immediate and target-specific protein degradation. Nat Chem Biol. 2018;14:431–441. doi: 10.1038/s41589-018-0021-8. [DOI] [PMC free article] [PubMed] [Google Scholar]
- 36.Beagan JA, et al. YY1 and CTCF orchestrate a 3D chromatin looping switch during early neural lineage commitment. Genome Res. 2017;27:1139–1152. doi: 10.1101/gr.215160.116. [DOI] [PMC free article] [PubMed] [Google Scholar]
- 37.Peric-Hupkes D, et al. Molecular Maps of the Reorganization of Genome-Nuclear Lamina Interactions during Differentiation. Mol Cell. 2010;38:603–613. doi: 10.1016/j.molcel.2010.03.016. [DOI] [PMC free article] [PubMed] [Google Scholar]
- 38.Bonev B, et al. Multiscale 3D Genome Rewiring during Mouse Neural Development. Cell. 2017;171:557–572.e24. doi: 10.1016/j.cell.2017.09.043. [DOI] [PMC free article] [PubMed] [Google Scholar]
- 39.Garel S, Marín F, Grosschedl R, Charnay P. Ebf1 controls early cell differentiation in the embryonic striatum. Development. 1999;126:5285–94. doi: 10.1242/dev.126.23.5285. [DOI] [PubMed] [Google Scholar]
- 40.Driller K, et al. Nuclear factor I X deficiency causes brain malformation and severe skeletal defects. Mol Cell Biol. 2007;27:3855–3867. doi: 10.1128/MCB.02293-06. [DOI] [PMC free article] [PubMed] [Google Scholar]
- 41.Cuartero S, et al. Control of inducible gene expression links cohesin to hematopoietic progenitor self-renewal and differentiation. Nat Immunol. 2018;19:932–941. doi: 10.1038/s41590-018-0184-1. [DOI] [PMC free article] [PubMed] [Google Scholar]
- 42.Lavagnolli T, et al. Initiation and maintenance of pluripotency gene expression in the absence of cohesin. Genes Dev. 2015;29:23–38. doi: 10.1101/gad.251835.114. [DOI] [PMC free article] [PubMed] [Google Scholar]
- 43.Fudenberg G, et al. Formation of Chromosomal Domains by Loop Extrusion. Cell Rep. 2016;15:2038–2049. doi: 10.1016/j.celrep.2016.04.085. [DOI] [PMC free article] [PubMed] [Google Scholar]
- 44.Bulger M, Groudine M. Functional and mechanistic diversity of distal transcription enhancers. Cell. 2011;144:327–39. doi: 10.1016/j.cell.2011.01.024. [DOI] [PMC free article] [PubMed] [Google Scholar]
- 45.Gurumurthy A, Shen Y, Gunn EM, Bungert J. Phase Separation and Transcription Regulation: Are Super-Enhancers and Locus Control Regions Primary Sites of Transcription Complex Assembly? BioEssays. 2019;41 doi: 10.1002/bies.201800164. 1800164. [DOI] [PMC free article] [PubMed] [Google Scholar]
- 46.Davidson IF, et al. DNA loop extrusion by human cohesin. Science. 2019;366:1338–1345. doi: 10.1126/science.aaz3418. [DOI] [PubMed] [Google Scholar]
- 47.Kim Y, Shi Z, Zhang H, Finkelstein IJ, Yu H. Human cohesin compacts DNA by loop extrusion. Science. 2019;366:1345–1349. doi: 10.1126/science.aaz4475. [DOI] [PMC free article] [PubMed] [Google Scholar]
- 48.van den Berg DLC, et al. An Oct4-Centered Protein Interaction Network in Embryonic Stem Cells. Cell Stem Cell. 2010;6:369–381. doi: 10.1016/j.stem.2010.02.014. [DOI] [PMC free article] [PubMed] [Google Scholar]
- 49.King HW, Klose RJ. The pioneer factor OCT4 requires the chromatin remodeller BRG1 to support gene regulatory element function in mouse embryonic stem cells. Elife. 2017;6 doi: 10.7554/eLife.22631. e22631. [DOI] [PMC free article] [PubMed] [Google Scholar]
- 50.Lopez-Serra L, Kelly G, Patel H, Stewart A, Uhlmann F. The Scc2-Scc4 complex acts in sister chromatid cohesion and transcriptional regulation by maintaining nucleosome-free regions. Nat Genet. 2014;46:1147–1151. doi: 10.1038/ng.3080. [DOI] [PMC free article] [PubMed] [Google Scholar]
- 51.Yan J, et al. Transcription Factor Binding in Human Cells Occurs in Dense Clusters Formed around Cohesin Anchor Sites. Cell. 2013;154:801–813. doi: 10.1016/j.cell.2013.07.034. [DOI] [PubMed] [Google Scholar]
- 52.Krantz ID, et al. Cornelia de Lange syndrome is caused by mutations in NIPBL, the human homolog of Drosophila melanogaster Nipped-B. Nat Genet. 2004;36:631–635. doi: 10.1038/ng1364. [DOI] [PMC free article] [PubMed] [Google Scholar]
- 53.Fedr R, et al. Automatic cell cloning assay for determining the clonogenic capacity of cancer and cancer stem-like cells. Cytometry A. 2013;83:472–482. doi: 10.1002/cyto.a.22273. [DOI] [PubMed] [Google Scholar]
- 54.Liu NQ, et al. The non-coding variant rs1800734 enhances DCLK3 expression through long-range interaction and promotes colorectal cancer progression. Nat Commun. 2017;8:14418. doi: 10.1038/ncomms14418. [DOI] [PMC free article] [PubMed] [Google Scholar]
- 55.Geeven G, Teunissen H, de Laat W, de Wit E. peakC: a flexible, non-parametric peak calling package for 4C and Capture-C data. Nucleic Acids Res. 2018;46:e91–e91. doi: 10.1093/nar/gky443. [DOI] [PMC free article] [PubMed] [Google Scholar]
- 56.Orlando DA, et al. Quantitative ChIP-Seq normalization reveals global modulation of the epigenome. Cell Rep. 2014;9:1163–1170. doi: 10.1016/j.celrep.2014.10.018. [DOI] [PubMed] [Google Scholar]
- 57.Langmead B, Trapnell C, Pop M, Salzberg SL. Ultrafast and memory-efficient alignment of short DNA sequences to the human genome. Genome Biol. 2009;10 doi: 10.1186/gb-2009-10-3-r25. R25. [DOI] [PMC free article] [PubMed] [Google Scholar]
- 58.Li H, et al. The Sequence Alignment/Map format and SAMtools. Bioinformatics. 2009;25:2078–2079. doi: 10.1093/bioinformatics/btp352. [DOI] [PMC free article] [PubMed] [Google Scholar]
- 59.Ramírez F, Dündar F, Diehl S, Grüning BA, Manke T. deepTools: a flexible platform for exploring deep-sequencing data. Nucleic Acids Res. 2014;42:W187–W191. doi: 10.1093/nar/gku365. [DOI] [PMC free article] [PubMed] [Google Scholar]
- 60.Liu T. Use Model-Based Analysis of ChIP-Seq (MACS) to Analyze Short Reads Generated by Sequencing Protein-DNA Interactions in Embryonic Stem Cells. Methods in Mol Biol. 2014;1150:81–95. doi: 10.1007/978-1-4939-0512-6_4. [DOI] [PubMed] [Google Scholar]
- 61.Ramírez F, et al. deepTools2: a next generation web server for deep-sequencing data analysis. Nucleic Acids Res. 2016;44:W160–W165. doi: 10.1093/nar/gkw257. [DOI] [PMC free article] [PubMed] [Google Scholar]
- 62.Anders S, Huber W. Differential expression analysis for sequence count data. Genome Biol. 2010;11 doi: 10.1186/gb-2010-11-10-r106. R106. [DOI] [PMC free article] [PubMed] [Google Scholar]
- 63.van Heeringen SJ, Veenstra GJC. GimmeMotifs: a de novo motif prediction pipeline for ChIP-sequencing experiments. Bioinformatics. 2011;27:270–271. doi: 10.1093/bioinformatics/btq636. [DOI] [PMC free article] [PubMed] [Google Scholar]
- 64.Kim D, et al. TopHat2: accurate alignment of transcriptomes in the presence of insertions, deletions and gene fusions. Genome Biol. 2013;14 doi: 10.1186/gb-2013-14-4-r36. R36. [DOI] [PMC free article] [PubMed] [Google Scholar]
- 65.Subramanian A, et al. Gene set enrichment analysis: a knowledge-based approach for interpreting genome-wide expression profiles. Proc Natl Acad Sci USA. 2005;102:15545–15550. doi: 10.1073/pnas.0506580102. [DOI] [PMC free article] [PubMed] [Google Scholar]
- 66.Liberzon A, et al. The Molecular Signatures Database Hallmark Gene Set Collection. Cell Syst. 2015;1:417–425. doi: 10.1016/j.cels.2015.12.004. [DOI] [PMC free article] [PubMed] [Google Scholar]
- 67.Li H, Wren J. Toward better understanding of artifacts in variant calling from high-coverage samples. Bioinformatics. 2014;30:2843–2851. doi: 10.1093/bioinformatics/btu356. [DOI] [PMC free article] [PubMed] [Google Scholar]
- 68.Servant N, et al. HiC-Pro: an optimized and flexible pipeline for Hi-C data processing. Genome Biol. 2015;16:259. doi: 10.1186/s13059-015-0831-x. [DOI] [PMC free article] [PubMed] [Google Scholar]
- 69.Imakaev M, et al. Iterative correction of Hi-C data reveals hallmarks of chromosome organization. Nat Methods. 2012;9:999–1003. doi: 10.1038/nmeth.2148. [DOI] [PMC free article] [PubMed] [Google Scholar]
- 70.Bolstad BM, Irizarry R, Astrand M, Speed TP. A comparison of normalization methods for high density oligonucleotide array data based on variance and bias. Bioinformatics. 2003;19:185–193. doi: 10.1093/bioinformatics/19.2.185. [DOI] [PubMed] [Google Scholar]
- 71.Gel B, et al. regioneR: an R/Bioconductor package for the association analysis of genomic regions based on permutation tests. Bioinformatics. 2016;32:289–291. doi: 10.1093/bioinformatics/btv562. [DOI] [PMC free article] [PubMed] [Google Scholar]
Associated Data
This section collects any data citations, data availability statements, or supplementary materials included in this article.
Supplementary Materials
Data Availability Statement
Raw and processed sequencing data generated in this study are available from the Gene Expression Omnibus under accession GSE135180. Source data are provided with this paper.
Custom R code associated with this manuscript can be found at https://github.com/deWitLab/Liu_2020_NatureGenetics.


