Abstract
High laser powers are common practice in single molecule localization microscopy (SMLM) to speed up data acquisition. Here, we systematically quantified how excitation intensity influences localization precision and labeling density, the two main factors determining data quality. We found a strong trade-off between imaging speed and quality and present optimized imaging protocols for high-throughput, multi-color and 3D SMLM with greatly improved resolution and effective labeling efficiency.
Single molecule localization microscopy (SMLM) techniques such as (f)PALM and (d)STORM provide unmatched spatial resolution among fluorescence microscopy techniques1–3. As fluorophore blinking kinetics depend on the excitation intensity, the combination of high excitation laser intensity and fast detection can speed up data acquisition by orders of magnitude4–6. Powerful lasers are therefore common practice, although, to date, no clear consensus on the impact on SMLM image quality has been reached. The photon count per localization is the major determining factor of localization precision7. Investigating a variety of labels, different groups either reported no substantial influence of the excitation intensity8, decreasing photon counts with increasing intensities8, or highest photon counts with intermediate intensities that decrease with both increasing and decreasing intensities6,9. The second major factor determining SMLM image quality is the labeling efficiency or density10, which has been estimated via photobleaching measurements8,11 or localization density6,10,12.
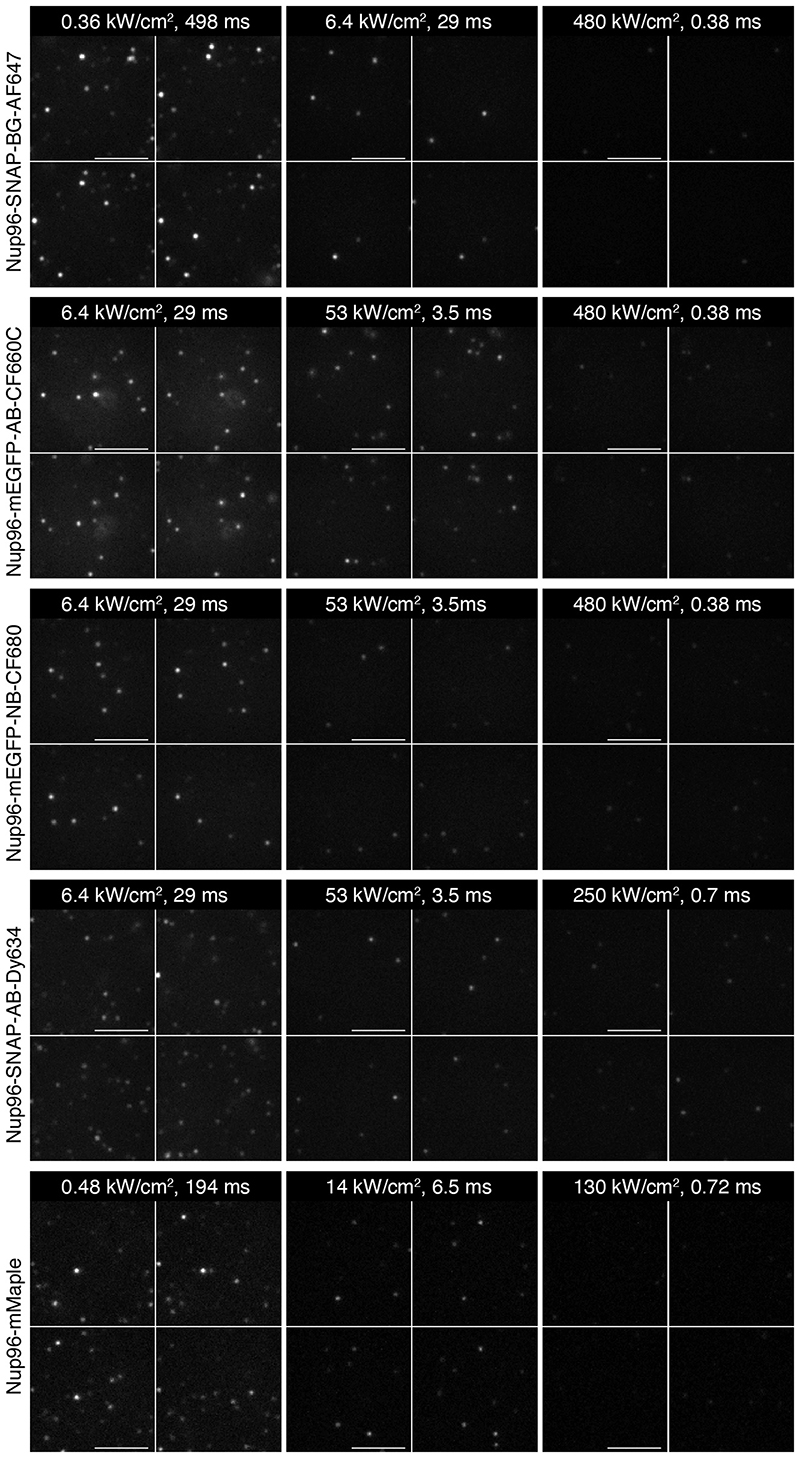
Here, we revisited this question using a recently developed, highly quantitative assay based on nuclear pore complexes (NPCs) as reference standards13. We found that the two major factors determining SMLM image quality, i.e. localization precision and labeling efficiency12, strongly deteriorate with high excitation intensity and, thus, imaging speed. We systematically investigated the effect of imaging speed on image quality for a variety of fluorophores, labeling approaches and imaging buffers. We varied the excitation intensity over three orders of magnitude, while adjusting the exposure time inversely to keep a constant light dose per frame, resulting in optimal average on-times of the fluorophores of a few frames. We merged localizations persistent over consecutive frames to measure the total photon count per localization, which is largely independent of the exposure time (Extended Data Figure 1). In addition, the precise stoichiometry and eight-fold symmetric arrangement of the reference protein Nup96 in the nuclear pore complex allowed us to quantify absolute effective labeling efficiencies (fraction of target proteins which are detected during the image acquisition), as well as the number of localizations per fluorophore13 (Supplementary Table 1).
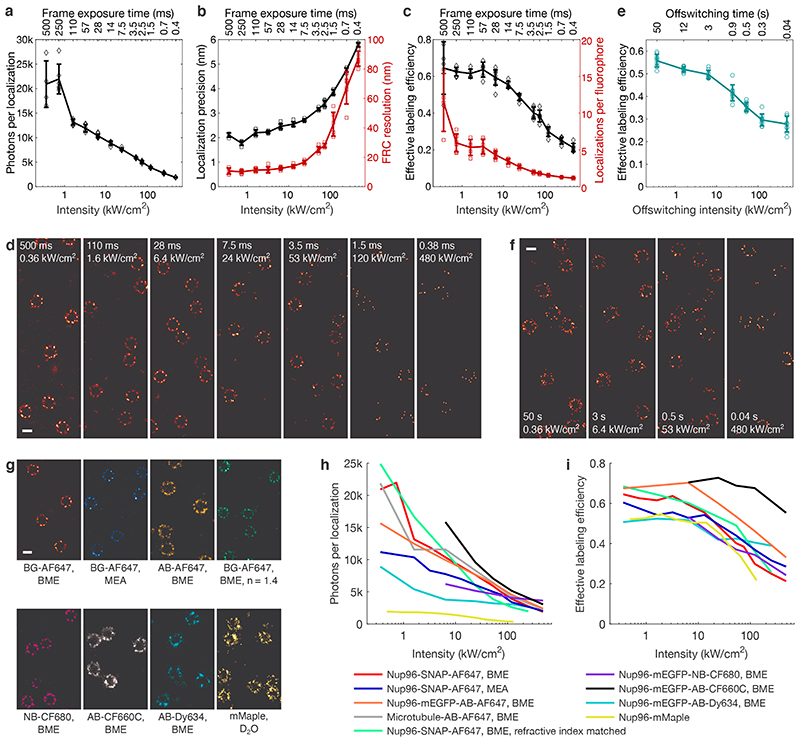
For the popular organic dye Alexa Fluor 647 (AF64711) in a common oxygen depleting and thiol containing blinking buffer (dSTORM approach3), fast imaging decreased the photon count per localization by a factor of 10 (Figure 1a), resulting in a three-fold deteriorated localization precision and 8-fold deteriorated Fourier Ring Correlation (FRC) resolution14 (Figure 1b). The effective labeling efficiency decreased by a factor of three (Figure 1c), leading to sparse images (Figure 1d), suggesting photo-bleaching during the initial off-switching phase, in which fluorophores are pushed into their dark state and cannot yet be localized due to high density of emitting fluorophores. Fluorophores that are irreversibly bleached during this phase are lost and reduce the effective labeling efficiency. In contrast, fluorophores bleached during the subsequent single-molecule imaging are likely to have emitted a sufficient number of photons to be localized and thus have little impact on the effective labeling efficiency.
Figure 1. Effect of laser intensity and imaging speed on image quality.
a, Mean number of photons per localization, b, median localization precision and Fourier Ring Correlation (FRC) resolution, and c, effective labeling efficiency and mean number of localizations per fluorophore for AF647 in BME-based buffer as a function of the excitation intensity and single frame exposure time. d, SMLM images of Nup96-SNAP-AF647 corresponding to data shown in a - c. e, Effective labeling efficiency as a function of different off-switching intensities, recorded at identical imaging intensities of 61 kW/cm2. f, SMLM images of Nup96-SNAP-AF647 corresponding to data shown in e. g, SMLM images of Nup96 using different buffers or labeling approaches recorded at 6.4 kW/cm2 (organic dyes) or 1.9 kW/cm2 (mMaple). h, Mean number of photons per localization, and i, effective labeling efficiency as a function of excitation intensity for different buffers or labeling approaches. All data taken on U2OS cells. Error bars indicate mean ± standard deviation. See Supplementary Table 1 for sample size and replicates. See Supplementary Figures 2-10 for detailed data of individual conditions. Scale bars 100 nm.
To test this hypothesis, we performed the initial off-switching at different intensities (Figure 1e, Supplementary Figure 1), while keeping the conditions for subsequent single molecule imaging identical. Remarkably, the effective labeling efficiency increased by up to a factor of two for low-intensity off-switching. Consequently, nuclear pore complexes appeared more densely labeled and, thus, seem more complete in the reconstructed image (Figure 1f). This observation has huge implications for the experimental design: In contrast to common practice15, the initial off-switching should be performed with low intensities to retain a high effective labeling efficiency, otherwise up to half of the fluorophores are bleached before single-molecule detection even begins.
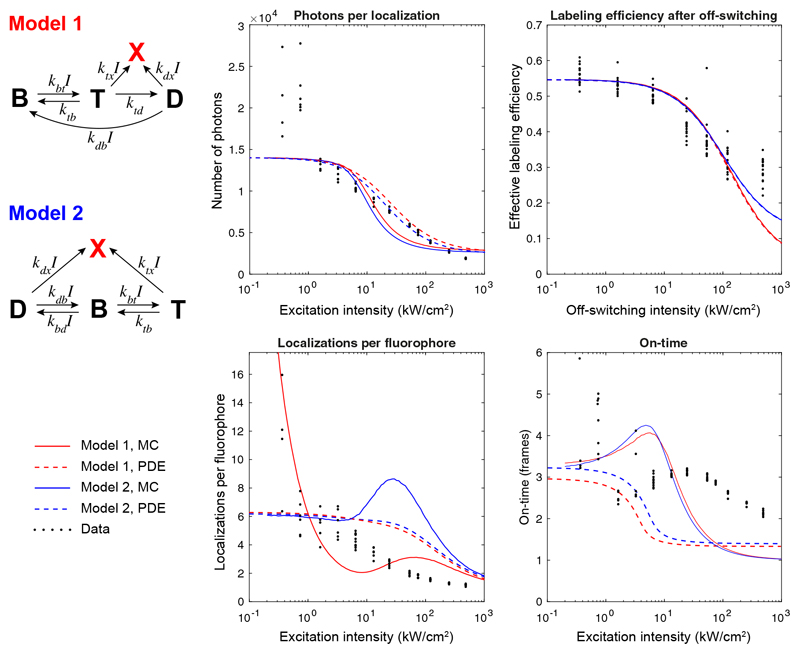
Our findings can be qualitatively illustrated with simple models describing fluorophore switching in dSTORM16,17 in presence of bleaching (Extended Data Figure 2, Supplementary Note 2). The triplet state is long-lived in oxygen depleted buffers18, which leads to saturation of the fluorescence emission and thus decreased photon counts with high intensities. Photobleaching occurs predominantly from this triplet state19, leading to an intensity dependent bleaching that competes with transition into the dark state and recovery of the bright state. Thus, photobleaching becomes dominant for high intensities, reducing on-times, photon counts and the number of localizations per fluorophore. Indeed, for low intensities, we could observe individual AF647 fluorophores five to ten times, while high intensities resulted in virtually no re-activations (Figure 1c).
We tested the generality of our observations by investigating the effect of imaging speeds using different dSTORM imaging buffers (glucose oxidase/catalase (GLOX) buffer with MEA, BME, or BME including refractive index matching), different tagging approaches (SNAP-tag, nanobody, antibody, endogenous fusion of fluorescent proteins), as well as different fluorophores (AF647, CF680, CF660C, Dy634, mMaple) (Extended Data Figure 3, Supplementary Table 1, Supplementary Figures 2-10). All conditions (Figure 1g) qualitatively showed a similar trend of strongly decreased photon counts (Figure 1h) and effective labeling efficiencies (Figure 1i) for fast, high-intensity imaging.
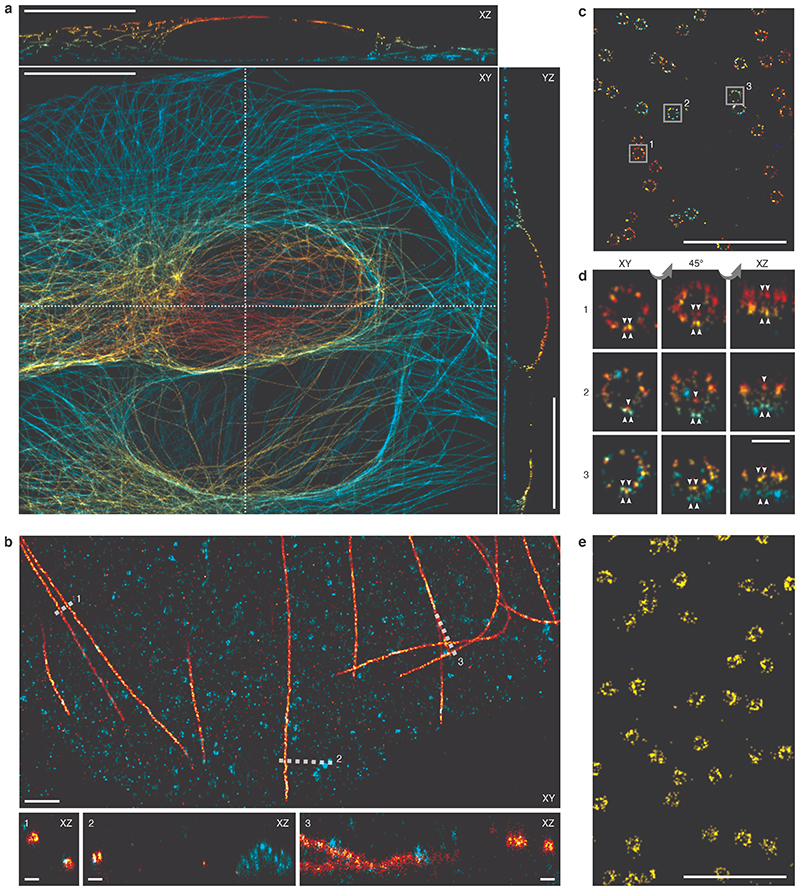
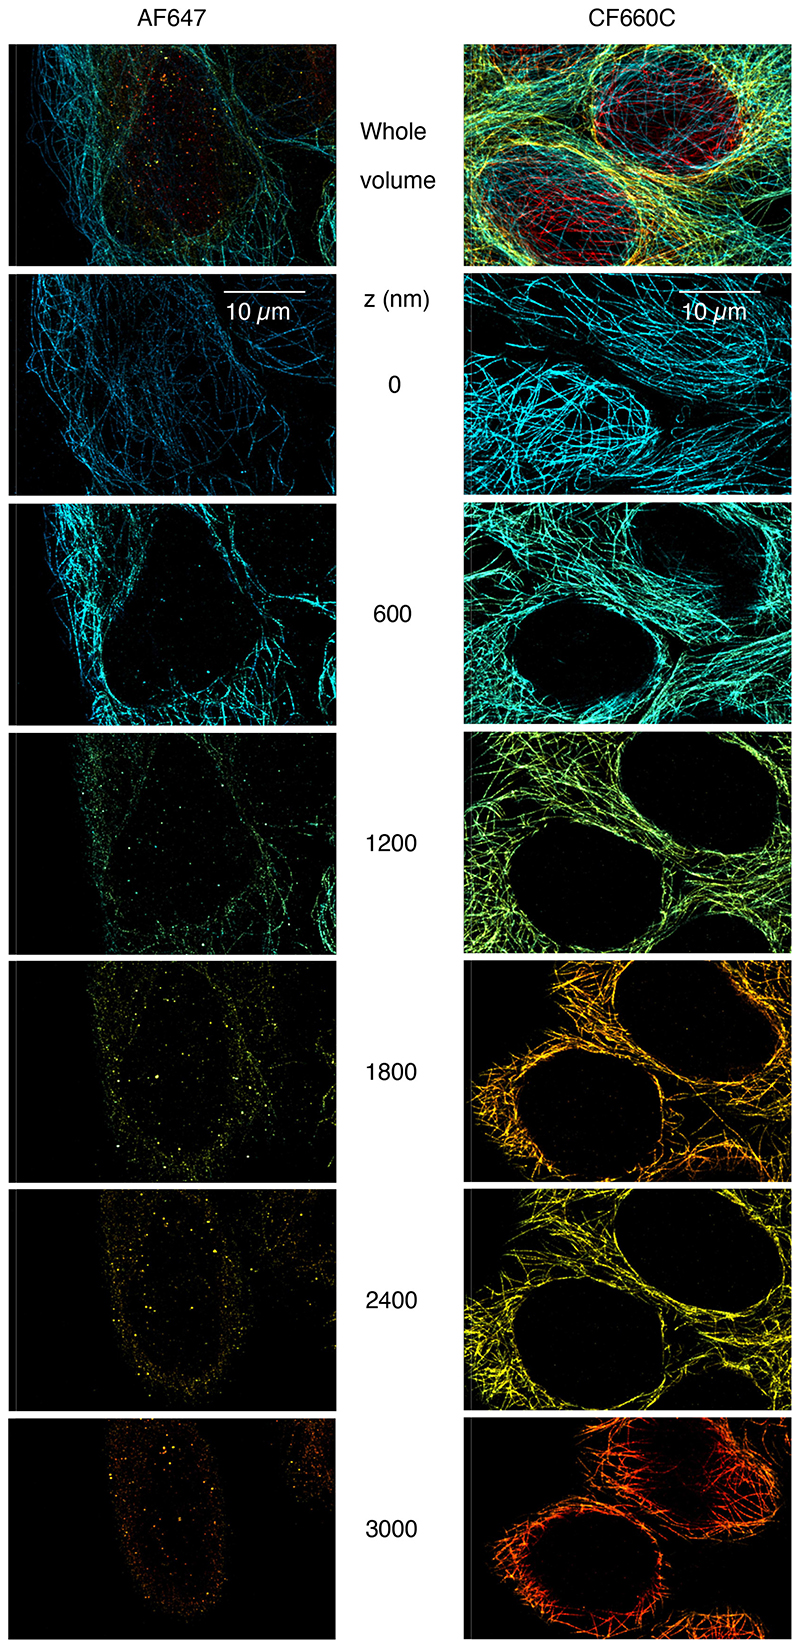
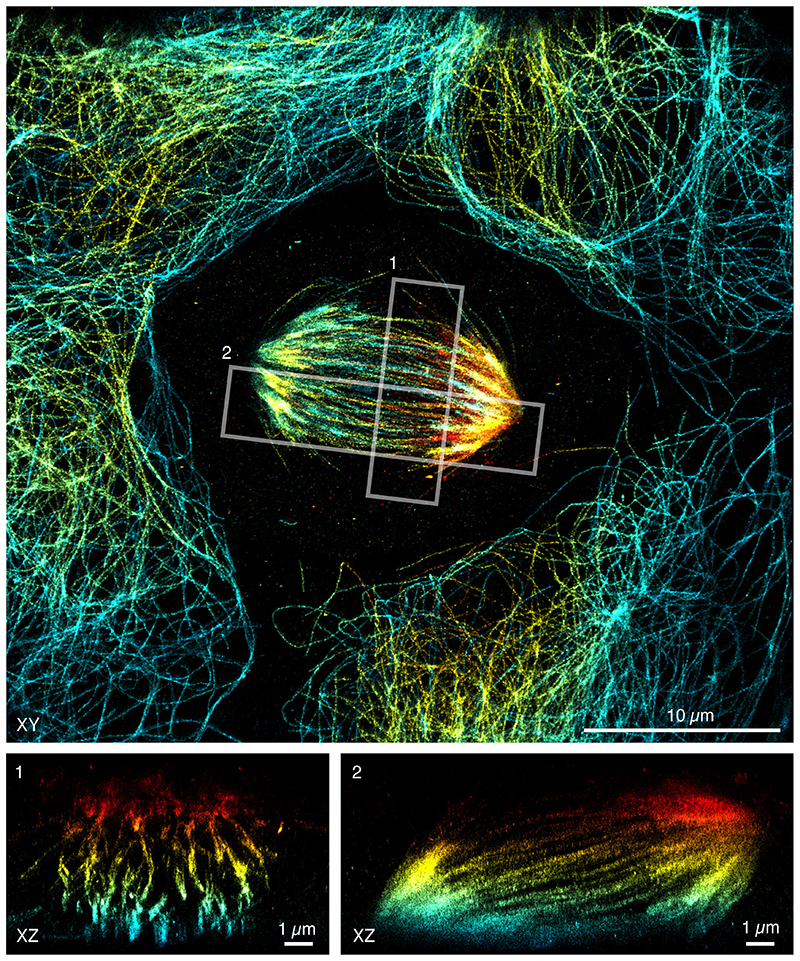
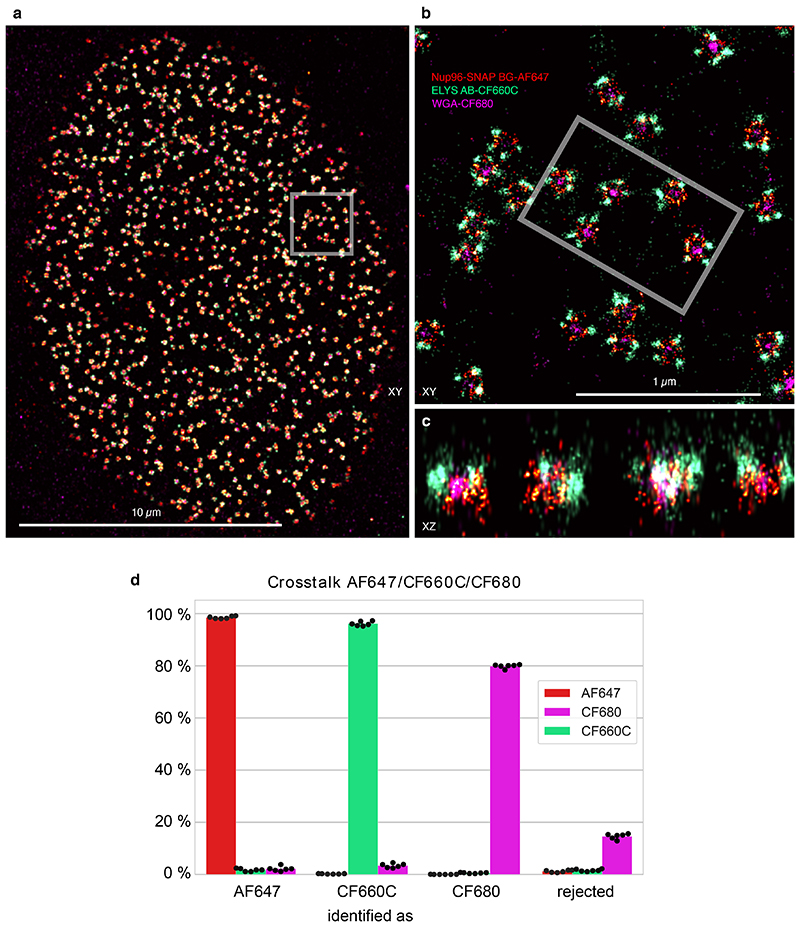
Intriguingly, we found that CF660C was much less prone to bleaching (Supplementary Figure 11) and resulted in higher numbers of re-activations than any other dye, making it a favorable dye for long high intensity acquisitions. It enabled us to image whole cells via astigmatism-based 3D by stepping through multiple z-positions in widefield illumination20 (Figure 2a, Supplementary Video 1, 2). This is very challenging when using other dyes, as the acquisition of each image plane bleaches fluorophores in all planes (Extended Data Figure 4) and has before been tackled by sophisticated excitation/detection schemes of different light-sheet geometries12,21,22. With CF660C, on the other hand, we could image about 1 million frames, covering a volume up to about 40 μm × 40 μm × 6 μm fitting an entire mitotic cell (Extended Data Figure 5, Supplementary Video 3). CF660C can well be combined with CF680 and AF647 for ratiometric three-color SMLM23,24 at medium to high intensities (Extended Data Figure 6, Supplementary Video 4). For low intensities, however, CF660C and CF680 exhibit a fraction of dim and long-lived states, rendering them unsuitable for SMLM (Extended Data Figure 3, Supplementary Video 5). On the other hand, both AF647 and Dy634 showed excellent performance at low intensity conditions for highest-quality two-color SMLM (Figure 2b, Extended Data Figure 7).
Figure 2. Optimization of various imaging applications.
a, Whole-cell 3D reconstruction of microtubules stained with CF660C from 900,000 frames recorded at 24 kW/cm2 excitation intensity and 83 Hz frame rate. Top-view projection and orthogonal slices through the positions indicated by the dashed line. b, Two-color ratiometric 3D imaging of microtubules stained with AF647 (red) and clathrin stained with Dy634 (turquoise), recorded at 1.6 kW/cm2 excitation intensity and 8.6 Hz frame rate. Top-view projection and orthogonal slices through the indicated positions. c, 3D imaging of Nup96-SNAP-AF647 recorded at 0.36 kW/cm2 and 2 Hz framerate. d, Magnified images of individual nuclear pore complexes, as indicated in c, show individual Nup96 proteins per symmetric unit. e, Live-cell PALM of Nup96-mMaple recorded in 20 s at 70 Hz framerate. Representative results are shown from N = 3 and nc = 5 (a), N = 2, nc = 4 (b), N = 4, nc = 4 (c, d) and N = 2, nc = 4 (e) experiments. N denotes the number of independent experiments and nc denotes the number of imaged cells. All data taken on U2OS cells. Scale bars 10 μm (a), 1 μm (b, c, e), 100 nm (b1-3, d).
Lowest intensities result in very high photon counts and numerous localizations per fluorophore, allowing us to approach the resolution of DNA-PAINT by dSTORM, albeit without suffering from high background inherent to DNA-PAINT and without the need for TIRF/HILO illumination. This allowed us to visualize the four individual Nup96 proteins per symmetric unit of the nuclear pore complex (Figure 2c, d, Supplementary Video 6) only 12 nm apart13, a resolution that had been deemed out of reach for SMLM25. Compared to recent 3D DNA-PAINT measurements on the NPC26, we could more than double the effective labeling efficiencies to 65% (Figure 1c) with a comparable resolution.
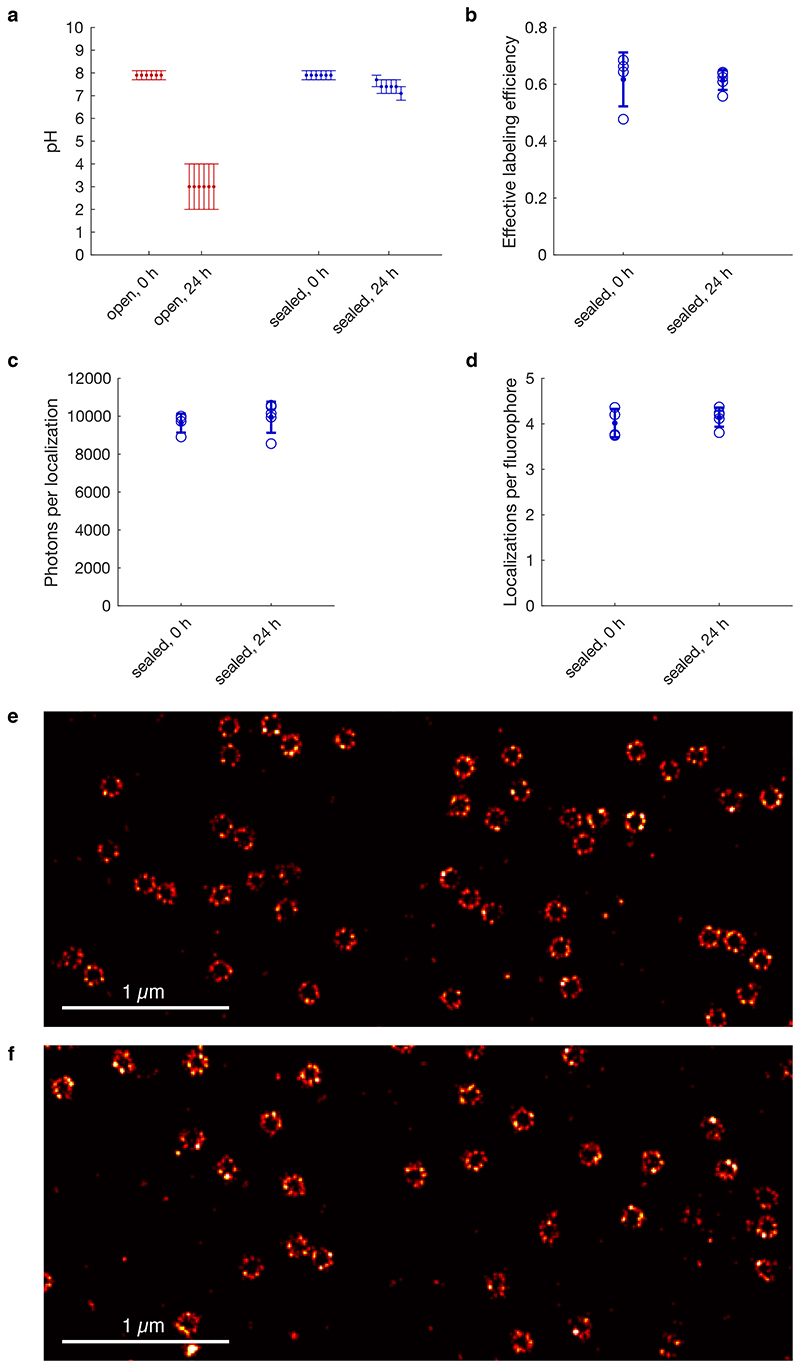
Buffer acidification is known to limit long imaging times that are necessary when using low intensities by altering fluorophore properties. Tight chamber sealing can overcome this issue27. Simple parafilm sealing excluding any air bubbles enabled us to use the conventional glucose oxidase/catalase buffer for more than 24 hours without a substantial drop in pH or deteriorated data quality (Extended Data Figure 8, Supplementary Video 7).
Slow imaging is not an option for live-cell SMLM, where the biological process of interest dictates the imaging speed. As genetically encoded photoconvertible fluorescent proteins are labels of choice for live-cell imaging, we also tested the performance of mMaple for PALM at varying imaging speeds (Supplementary Figure 10). Unfortunately, we found the same trade-off between imaging speed and image quality for mMaple as for organic dyes, in line with previous findings by Jones et al. for mEOS2, who attributed the loss in labels to bleaching from the unconverted state8. Still, an excitation intensity of ~7.5 kW/cm2 and a framerate of ~70 Hz represented a good compromise for mMaple, with high localization precision at only a moderate loss of effective labeling efficiency. This allowed us to resolve the circular structure of the nuclear pore complex arrangement of Nup96 in living cells in only 20 s acquisition time (Figure 2e, Supplementary Video 8). We note that with these intensities, phototoxicity cannot be excluded28.
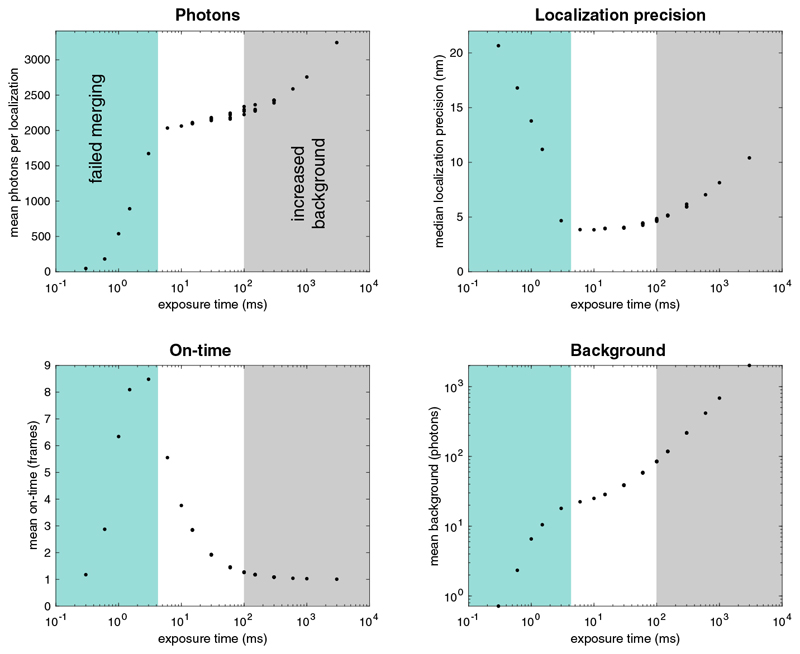
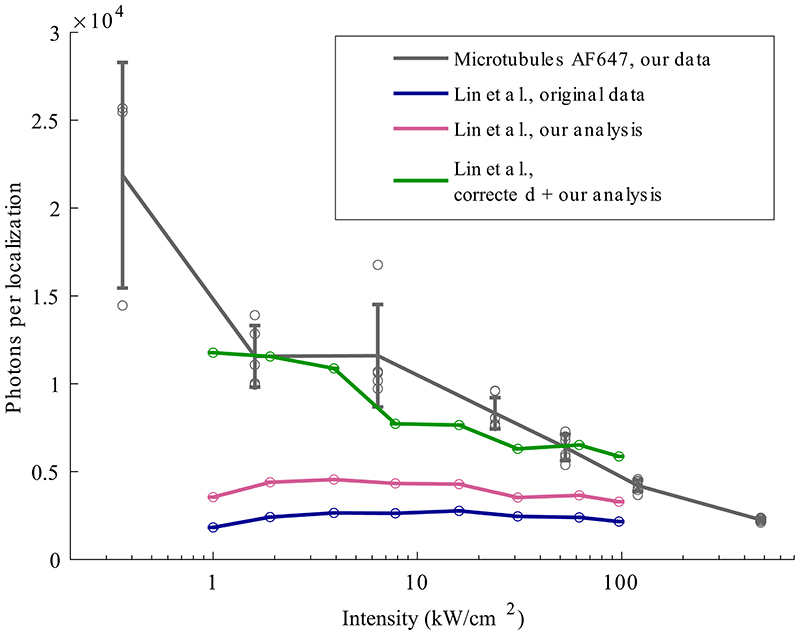
In conclusion, we identified a clear trade-off between image quality and imaging speed in SMLM with slow imaging resulting in exceptional resolution and effective labeling efficiency. These findings were surprising in light of a recent report6, but a re-analysis of that data could resolve the contradiction and attribute it to sub-optimal matching of exposure time and excitation intensity, which impeded correct merging of localizations (Extended Data Figure 9).
If high throughput is required, our findings provide a guideline on how to choose the best compromise between imaging speed and quality. Specifically, we could identify CF660C as a dye with increased photo stability, which retains high effective labeling efficiencies under fast imaging conditions and allowed us to assemble whole-cell super-resolution data with optimal labeling densities in all slices. Optimizing the composition of the imaging buffer specifically at high excitation intensities has the potential to further improve image quality.
Importantly, we found that the common practice of performing the initial switching-off phase with high laser powers bleaches up to half of the fluorophores before they can be localized even once. Thus, to retain high labeling efficiencies, the initial switch-off should be performed with low laser powers.
In light of the recent community effort to enhance SMLM via optically more and more complex detection schemes29, our results demonstrate a complementary and much simpler approach without optical modifications. Shifting to low laser powers will enable many labs to easily and directly improve their data quality.
Methods
Sample seeding
Before seeding of cells, high-precision 24 mm round glass coverslips (No. 1.5H, catalog no. 117640, Marienfeld) were cleaned by placing them overnight in a methanol:hydrochloric acid (50:50) mixture while stirring. After that, the coverslips were repeatedly rinsed with water until they reached a neutral pH. They were then placed overnight into a laminar flow cell culture hood to dry them before finally irradiating the coverslips by ultraviolet light for 30 min.
Cells were seeded on clean glass coverslips 2 days before fixation to reach a confluency of about 50 – 70% on the day of fixation. They were grown in growth medium (DMEM (catalog no. 11880-02, Gibco)) containing 1× MEM NEAA (catalog no. 11140-035, Gibco), 1× GlutaMAX (catalog no. 35050-038, Gibco) and 10% (v/v) fetal bovine serum (catalog no. 10270-106, Gibco) for approximately 2 days at 37 °C and 5% CO2. Before further processing, the growth medium was aspirated and samples were rinsed twice with PBS to remove dead cells and debris. Unless otherwise stated, all experimental replicates were performed on cells of a different passage with separated sample preparation.
Imaging buffers
The following buffers were used to image the indicated samples:
GLOX+MEA: Glucose oxidase/catalase buffer supplemented with cysteamine (MEA) was used to image Nup96-SNAP-AF647. GLOX+MEA contained 50 mM Tris/HCl pH8, 10 mM NaCl, 10% (w/v) D-glucose, 500 μg/ml glucose oxidase, 40 μg/ml glucose catalase and 35 mM MEA in H2O.
GLOX+BME: Glucose oxidase/catalase buffer supplemented with b-mercaptoethanol (BME) was used to image Nup96-SNAP-AF647, Microtubule-AB-AF647, Nup96-mEGFP-NB-CF680, Nup96-mEGFP-AB-AF647, Nup96-mEGFP-AB-CF660C, Nup96-mEGFP-AB-Dy634, two-color samples (Clathrin-AB-Dy634 and Microtubule-AB-AF647) and three-color samples (Nup96-SNAP-AF647, ELYS-AB-CF660C, WGA-CF680). GLOX+BME contained 50 mM Tris/HCl pH8, 10 mM NaCl, 10% (w/v) D-glucose, 500 μg/ml glucose oxidase, 40 μg/ml glucose catalase and 143 mM BME in H2O.
GLOX+BME refractive index matched: Glucose oxidase/catalase buffer supplemented with BME and glycerol for refractive index matching (n=1.4) was used to image Nup96-SNAP-AF647 and samples for whole-cell imaging (Microtubule-AB-AF647 and Microtubule-AB-CF660C). GLOX+BME refractive index matched contained 40 mM Tris/HCl pH 8, 8 mM NaCl, 8% (w/v) D-glucose, 55% (v/v) Glycerol 85%, 500 μg/ml glucose oxidase, 40 μg/ml glucose catalase and 143 mM BME in H2O.
50 mM Tris in D2O was used to image Nup96-mMaple in fixed cells. 50 mM Tris in D2O contained 50 mM Tris/HCl pH 8 in 95% (v/v) D2O.
Growth medium with HEPES was used to image Nup96-mMaple in live cells. Growth medium with HEPES contained 1x MEM NEAA (catalog no. 11140-035, Gibco), 1x GlutaMax (catalog no. 35050-038, Gibco), 10% (v/v) fetal bovine serum (catalog no. 10270-106, Gibco), 20 mM HEPES (pH 7.25) in DMEM.
Sample staining
Preparation of Nup96-mMaple samples (live and fixed cells)
For imaging of live cells, coverslips containing Nup96-mMaple cells (catalog no. 300461, CLS Cell Line Service, Eppelheim, Germany) were rinsed twice with warm PBS before they were mounted onto a custom manufactured sample holder in 1 ml growth medium containing 20 mM HEPES buffer and imaged directly.
For data acquisition on fixed Nup96-mMaple cells, the coverslips were rinsed twice with warm PBS. Prefixation was carried out in a 2.4% (w/v) formaldehyde (FA) in PBS solution for 40 s before the samples were permeabilized in 0.4% (v/v) Triton X-100 in PBS for 3 min. Complete fixation was carried out in 2.4% (w/v) FA in PBS for 30 min followed by 3x 5 min washing steps in PBS after fixation. To quench FA, the samples were placed in 100 mM NH4Cl in PBS for 5 min and afterwards washed three times in PBS for 5 min each. Samples were then mounted into custom manufactured sample holders in appropriate imaging buffer (see section Imaging buffers). The holder was sealed with parafilm.
Preparation of Nup96-SNAP samples
Nup96-SNAP-tag cells (catalog no. 300444, CLS Cell Line Service, Eppelheim, Germany) were fixed analogous to the procedure described for preparation of fixed Nup96-mMaple samples. Subsequently, the sample was incubated for 30 min with Image-iT FX Signal Enhancer (catalog no. I36933, ThermoFisher Scientific) before staining with SNAP dye buffer (3 μM BG-AF647 (catalog no. S9136S, New England Biolabs) and 3 μM dithiothreitol in 0.5% (w/v) BSA in PBS) for 2 h at room temperature. To remove unbound dye, coverslips were washed 3x 5 min in PBS. Samples were then mounted into custom sample holders in appropriate imaging buffers (see section Imaging buffers). The holder was sealed with parafilm.
Preparation of Nup96-mEGFP samples
Nanobody staining
Nup96-mEGFP cells (catalog no. 300174, CLS Cell Line Service, Eppelheim, Germany) on glass coverslips were prefixed for 40 s in 2.4% (w/v) FA in transport buffer (TRB: 20 mM HEPES pH 7.5, 110 mM KAc, 1 mM EGTA, 250 mM sucrose in H2O), followed by washing 2x 5 min in TRB. Plasma membrane specific permeabilization was achieved by 8 min incubation on ice in TRB containing 25 μg/ml digitonin (catalog no. D141, Sigma Aldrich). Samples were washed 2x 5 min in TRB supplemented with 1% (w/v) BSA (TBA). The first round of staining was achieved by incubating the samples upside-down in a drop of TBA containing 100 nM of anti-GFP nanobodies (catalog no. N0301 conjugated to CF680, NanoTag Biotechnologies) for 30 min at RT. Residual nanobodies were rinsed off 2x 5 min in TBA before the cells were further fixed in TBA containing 3% (w/v) FA for 10 min followed by two additional washing steps in TBA for 5 min each. Permeabilization of the nuclear envelope was facilitated by 3 min incubation in 0.4% (v/v) Triton X-100 in PBS. Samples were washed 2x 5 min in PBS before incubating them upside down in a drop of anti-GFP nanobodies (100 nM in TBA, same nanobodies as in the first round of staining) for 30 min at RT. Finally, weakly bound and unbound nanobodies were rinsed off 2x 15 min in PBS. Samples were then mounted into custom manufactured sample holders in appropriate imaging buffer (see section Imaging buffers). The holder was sealed with parafilm.
Indirect immunostaining
Nup96-mEGFP cells (catalog no. 300174, CLS Cell Line Service, Eppelheim, Germany) on glass coverslips were prefixed in 2.4% (w/v) FA in PBS for 40 s before incubating them 3 min in 0.1% (v/v) Triton X-100 in PBS and washing them 2x 5 min in PBS. Fixation was completed in 2.4% (w/v) FA in PBS for 20 min. FA was quenched for 5 min in 100 mM NH4Cl in PBS and then washed 2x 5 min in PBS. Fixed cells were permeabilized using 0.2% (v/v) Triton X-100 in PBS for 10 min, followed by two more washing steps in PBS for 5 min each before blocking in 2% (w/v) BSA in PBS for 1 h. Binding of primary rabbit anti-GFP antibodies (catalog no. 598, MBL International) to Nup96-mEGFP fusion proteins was achieved by placing the coverslips upside down onto a drop of primary antibody solution (diluted 1:250 in PBS containing 2% (w/v) BSA) at 4 °C overnight. Weakly and unbound primary antibodies were subsequently rinsed away with three washing steps in PBS for 5 min each. Secondary antibody labeling was achieved by placing the samples upside-down onto a drop of anti-rabbit antibodies (inhouse made by NHS ester coupling of AF647 or Dy634 to catalog no. 711-005-152, Dianova, Hamburg, Germany, or premanufactured CF660C conjugated antibodies (catalog no. 20183, Biotium, Fremont, CA)) diluted 1:300 in PBS containing 2% (w/v) BSA for 1 h at RT. Residual secondary antibody was removed by washing three times with PBS for 5 min. Samples were then mounted into custom manufactured sample holders in appropriate imaging buffer (see section Imaging buffers). The sample holder was sealed with parafilm.
Preparation of microtubule samples
Coverslips prepared with Nup96-SNAP-tag (catalog no. 300444, CLS Cell Line Service, Eppelheim, Germany) were first rinsed twice with warm PBS before simultaneous prefixation and permeabilization of cells with 0.3% (v/v) glutaraldehyde (GA) and 0.25% (v/v) Triton X-100 in cytoskeleton buffer (CB: 10 mM MES pH 6.1, 150 mM NaCl, 5 mM EGTA, 5 mM D-glucose, 5 mM MgCl2 in H2O) for 2 min. Subsequently, fixation was completed in 2% (v/v) GA in CB for 10 min before incubating the sample in 0.1% (w/v) NaBH4 in PBS for 7 min to quench autofluorescence. After washing the samples 2x 5 min in PBS, they were incubated for 30 min upside down in a drop of mouse anti α-Tubulin antibody (diluted 1:500 in PBS containing 2% (w/v) BSA, catalog no. T6074, Sigma Aldrich). Unbound antibodies were washed off 3x 5 min in PBS. Successive secondary anti mouse antibody staining with AF647 (diluted 1:500 in PBS containing 2% w/v BSA, catalog no. A-21236, Thermo Fisher) or CF660C (diluted 1:500 in PBS containing 2% w/v BSA, catalog no. 20050-1, Biotium) was done for 1 h at RT. Finally, samples were washed 3x 5 min in PBS and mounted onto a custom manufactured sample holder in appropriate imaging buffer (see section Imaging buffers). The holder was sealed with parafilm.
Preparation of two-color microtubule and clathrin samples
Cells (Nup96-SNAP-tag, catalog no. 300444, CLS Cell Line Service, Eppelheim, Germany) were permeabilized and fixed as described for microtubule staining. Successive blocking was done for 30 min in 2% (w/v) BSA in PBS and 30 min in Image-iT FX Signal Enhancer before the sample was incubated in a mixture of rabbit antibodies against clathrin light chain (diluted 1:100, catalog no. sc-28276, Santa Cruz Biotechnology) and clathrin heavy chain (diluted 1:300, catalog no. ab21679, abcam) in 1% w/v BSA in PBS overnight at 4 °C. Unbound antibodies were washed away 3x 5 min in PBS before the sample was stained with secondary anti rabbit antibody coupled to Dy643 (diluted 1:300 in PBS containing 1% (w/v) BSA, inhouse made by NHS ester coupling of Dy634 to catalog no. 711-005-152, Dianova, Hamburg, Germany) for 3 h at RT. Microtubules were further stained with AF647, as described previously. The sample was washed 3x 5 min with PBS, before mounting it onto a custom manufactured sample holder in appropriate imaging buffer (see section Imaging buffers). The holder was sealed with parafilm.
Preparation of three-color NPC samples
Cells (Nup96-SNAP-tag, catalog no. 300444, CLS Cell Line Service, Eppelheim, Germany) on glass coverslips were prefixed in 2.4% (w/v) FA in PBS for 20 s before incubating them 10 min in 0.5% (v/v) Triton X-100 in PBS. Fixation was completed in 2.4% (w/v) FA in PBS for 20 min. FA was quenched for 5 min in 100 mM NH4Cl in PBS and then washed 3x 5 min in PBS. Fixed cells were blocked with Image-IT signal enhancer for 30 min and then incubated with 1 μM BG-AF647, 0.5% BSA and 1 mM DTT in PBS for 1 h to stain Nup96-SNAP-tag. Cells were washed 3x for 5 min with PBS and subsequently blocked with 5% (v/v) NGS (catalog no. PCN5000, lifeTech) in PBS for 1 h. Primary antibody labeling against ELYS was achieved by incubation with anti-AHCTF1 (HPA031658, Sigma-Aldrich) diluted 1:30 in 5% (v/v) NGS in PBS for 1 h. Coverslips were washed 3 times for 5 min with PBS to remove unbound antibody and subsequently stained with CF660C labeled anti-rabbit antibody (catalog no. 20183, Biotium, Fremont, CA) diluted 1:150 in PBS containing 5% (v/v) NGS for 1 h. After 3 washes with PBS for 5 min, the sample was postfixed for 30 min using 2.4% (w/v) FA in PBS, rinsed with PBS, quenched in 50 mM NH4Cl for 5 min and rinsed 3x 5 min with PBS. Shortly before imaging, the sample was incubated for 10 min with 1:5000 diluted WGA-CF680 (catalog no. 29029-1, Biotium, Fremont, CA) in PBS, rinsed 3x with PBS and mounted onto a custom manufactured sample holder in appropriate imaging buffer (see section Imaging buffers). The holder was sealed with parafilm.
Microscope setup
The custom-build widefield microscope used for acquiring all single-color data is described in Supplementary Note 1 and shown in Supplementary Figure 12.
SMLM data acquisition for intensity titration
For intensity dependent measurements, we recorded a region of 128 by 128 pixels in the center of the camera chip. We used the global exposure trigger to illuminate the sample only during the time in which all lines of the rolling shutter sCMOS camera where exposed simultaneously. This effective laser exposure time was 1.55 ms shorter than the camera exposure time set in Micro-Manager. We chose the excitation intensities such that the product of the effective laser exposure time and the intensity stayed constant for all conditions of individual fluorophores (Supplementary Table 1, Supplementary Dataset 1). For the fastest acquisition settings, we kept the camera exposure time setting on 3 ms each but triggered the AOTF only for 0.725 ms or 0.375 ms, respectively. The 405 nm UV laser for active photoswitching was run at constant power resulting in an intensity of 0.015 kW/cm2, but at variable pulse-widths.
For SNAP- and mMaple-labeled cells, imaging was stopped when almost all emitters in the ROI were bleached. For antibody- and nanobody-labeled cells, imaging was stopped after 31,000 frames. For Dy634, we observed dense labeling. Therefore, we prebleached the samples for 45 sec (1500 frames at 30 ms camera exposure time) for every titration step using 28.5 kW/cm2 excitation laser and UV activation intensity of 0.04 kW/cm2. The first 1,000 frames were discarded for all conditions.
SMLM data acquisition for off-switching intensity titration
Different off-switching conditions were realized by recording, but not analyzing, 100 frames each at the respective pair of off-switching intensity and camera exposure time (Supplementary Table 1). Hence, the effective laser off-switching times were slightly lower, but the duration of the off-switching phase was limited by the camera exposure time. We then changed both the intensity, camera exposure time and effective laser exposure time to either 24 kW/cm2, 9 ms and 7.45 ms or 61 kW/cm2, 3 ms and 1.25 ms, respectively. Note that the latter condition (shown in Figure 1e,f) does not fit our otherwise applied standard of keeping the product of effective laser exposure time and intensity constant, but was instead chosen to effectively fit the image acquisition conditions of a recent study by Barentine et al.5. Other than this, the same procedure was applied as described above.
SMLM data acquisition for other experiments
Whole-cell 3D images were recorded at a set camera exposure time of 12 ms, corresponding to an effective single frame laser exposure time of about 7.6 ms. A mean excitation laser intensity of 24.3 kW/cm2 and UV activation intensity of 0.011 kW/cm2 were used. Long-term imaging for comparison of AF647 and CF660C was recorded with the same conditions as for whole-cell 3D imaging, but on a smaller ROI (128 x 128 pixel). Images were acquired until all fluorophores were bleached.
Nup96 3D images were recorded at a set camera exposure time of 500 ms, corresponding to an effective single frame laser exposure time of 498 ms, a mean excitation laser intensity of 0.36 kW/cm2 and a UV activation intensity of 0.015 kW/cm2.
Live-cell mMaple images were recorded at a set camera exposure time of 14 ms, corresponding to an effective single frame exposure time of 12.45 ms, a mean excitation laser intensity 7.5 kW/cm2 and a UV activation intensity of 0.015 kW/cm2.
Two-color ratiometric images of AF647 and Dy634 were recorded at a set and effective single frame exposure time of 116 ms using an EM-CCD camera in frame transfer mode, a mean excitation laser intensity of 1.6 kW/cm2 and a UV activation intensity of 0.08 kW/cm2. Three-color ratiometric images of AF647, CF660C and CF680 were recorded at a set and effective single frame exposure times of 20-30 ms using an EM-CCD camera in frame transfer mode, mean laser intensity of 7 kW/cm2 and a UV activation intensity of 0.08 kW/cm2.
Long-term buffer pH stability
The chamber in the sample holder was filled with 1 ml of freshly mixed GLOX+BME buffer and sealed with parafilm excluding all air bubbles, identical to chamber preparations for the imaging experiments. We measured the pH value directly before sealing the chamber, and directly after opening the chamber 24 h later. For comparison, 1 ml of freshly mixed GLOX+BME buffer was stored in unclosed tubes with a buffer/air interface area of 0.8 cm2 for 24 h. Storage was performed at room temperature identical to all image acquisitions. Indicator paper was used to determine the pH value (MColorpHast for pH 6.5 - 10.0, Merck, or pH 0-14 Universal indicator, Merck).
SMLM data analysis
SMLM data analysis was conducted as described in Supplementary Note 3 using previously published algorithms13 with custom software written in MATLAB (superresolution microscopy analysis platform, SMAP30), available as open source at github.com/jries/SMAP.
3D bead calibration
Tetra-Speck beads (0.75 μl from stock, catalog no. T7279, Thermo Fisher) were diluted in 360 μl H2O, mixed with 40 μl 1 M MgCl2 and put on a coverslip in a custom manufactured sample holder. After 10 min, the mix was replaced with 400 μl H2O. For experiments where the Si-Oil objective was used, the mix was replaced by 400 μl refractive index matched buffer consisting of 55% Glycerol (85%) and 45% H2O. Using Micro-Manager, about 20 positions on the coverslip were defined and the beads were imaged acquiring z-stacks (-1 μm to 1 μm, 10 nm step size) using the same filters as used in the intended experiment. In SMAP, an average PSF model was calculated from tens of beads30.
Fitting and post-processing
2D data were fitted with a symmetric Gaussian PSF model with the PSF size, x, y, photons per localization, and the background as free fitting parameters using maximum likelihood estimation30 (MLE). 3D data were fitted using an experimentally derived PSF model from the 3D bead calibration with x, y, z, photons per localization, and the background as free fitting parameters using maximum likelihood estimation30 (MLE).
Fitted data were first grouped by merging localizations persistent over consecutive frames within 35 nm from each other (with an allowed gap of one dark frame) into one localization with its position calculated by the weighted average of individual x, y, and z positions. Photons per localization as well as the background were summed over all frames in which the grouped localization was detected. Data was then drift corrected in x, y and z by a custom algorithm based on redundant cross-correlation. From the spread of the redundant displacements we estimated the accuracy of the drift correction to be better than 1.5 nm in x and y and 2 nm in z.
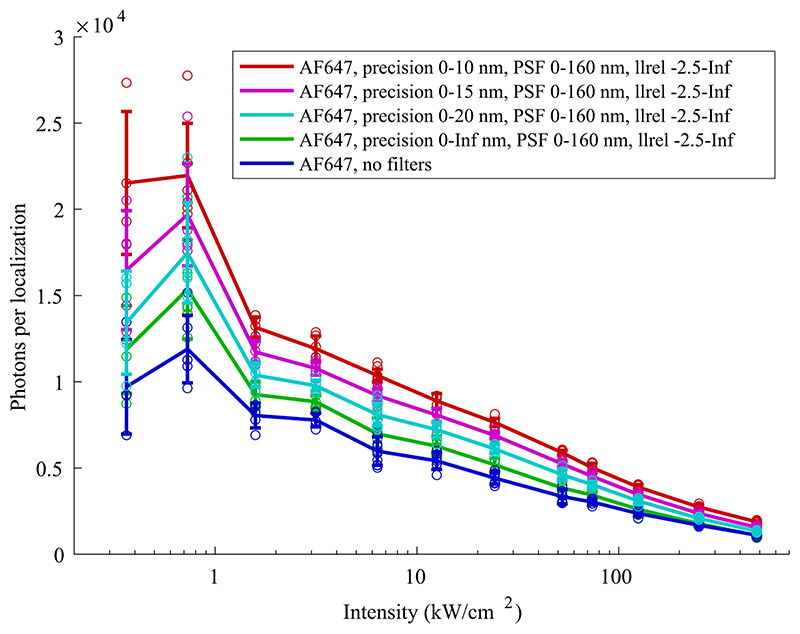
Before analysis, the localizations were filtered based on localization precision (0-10 nm for dSTORM data of organic dyes shown in Figure 1, 0-15 nm for PALM data of mMaple shown in Figure 1) to exclude extraordinarily dim localizations, PSF size (laterally 0-160 nm for dSTORM data of organic dyes or laterally 0-160 nm for PALM data of mMaple, for 2D data only) to remove out of focus localizations, frames (from 1000 until completion, except for antibody-staining and nanobody-staining data used for power titration measurements where the acquisition was stopped after 31000 frames; no frame filter was applied to mMaple data shown in Figure 1). Additionally, localizations with a bad fit were filtered based on log-likelihood. We note that different filters affect the absolute number of photons, but the loss of photons with increasing excitation intensity stays qualitatively the same (Extended Data Figure 10).
3D data of Nup96 were filtered based on localization precision (0-5 nm laterally, 45 nm axially), log-likelihood to exclude bad fits, and z-position to reject molecules far away from the focal plane.
3D two-color data were filtered based on localization precision (0-10 nm for Dy634 and 0-4 nm for AF647), frames (1000 to completion), log-likelihood to exclude bad fits, and z-position to reject molecules far away from the focal plane. 3D three-color data were filtered based on localization precision (0-10 nm laterally for all dyes), log-likelihood to exclude bad fits, and z-position to reject molecules far away from the focal plane. Whole cell 3D data were filtered based on lateral localization precision (0-10 nm), axial localization precision (0-40 nm) and log-likelihood. Slices of different z-position were first drift corrected individually and then registered in 3D based on cross-correlation.
Super-resolved images were finally reconstructed, where every localization was rendered as an elliptical Gaussian. Reported photons per localization are calculated on merged and filtered localizations. We did not use a sCMOS-specific fitter4, but confirmed that ignoring the sCMOS specific properties of pixel-dependent noise, gain, and offset had negligible influence on the photon statistics. All given photon counts are based on the manufacturer’s camera calibration.
To separate the colors in ratiometric imaging, the localizations were filtered and the ratio between photons from both channels were plotted. The channels for each fluorophore were assigned manually by drawing ROIs in the plot. This assignment was saved and used later for crosstalk determination.
Determination of crosstalk in ratiometric imaging
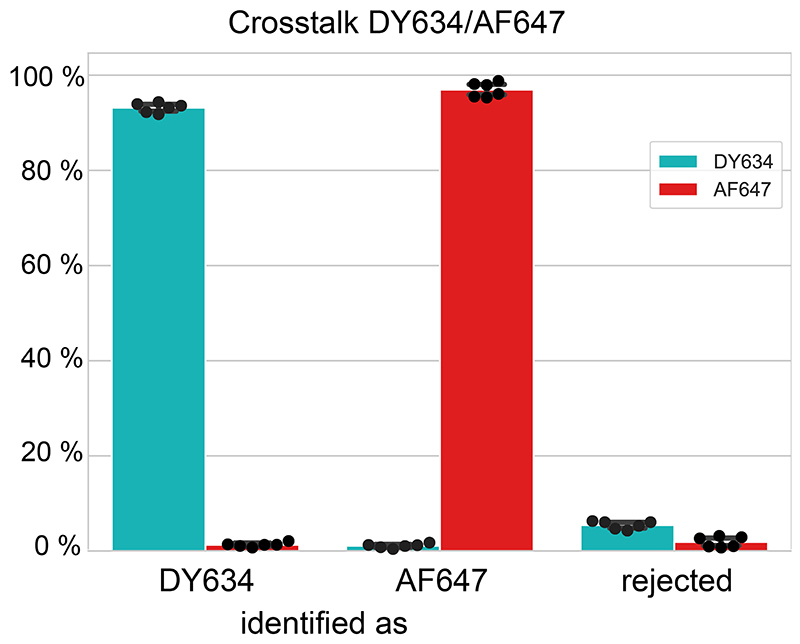
To determine the crosstalk between AF647 and Dy634, cells expressing Nup96-SNAP were labeled with BG-AF647 and cells expressing Nup96-mEGFP were immunostained with an antibody coupled to Dy634, as described previously. The samples were imaged, reconstructed and filtered individually using the same conditions as used for the two-color acquisition. The same filters for ratiometric color separation were used and the localizations identified as AF647, Dy634 and not assigned (i.e. rejected) were counted.
For three-color imaging, the crosstalk was identically determined, but based on the individually stained structures as described above: Nup96-SNAP via BG-AF647 staining, ELYS via indirect immunostaining with CF660C, and WGA-CF680).
Segmentation of nuclear pores
All images used in this work that are based on Nup96-derived data, were segmented automatically in SMAP. For this, reconstructed images were convolved with a kernel consisting of a ring with a radius corresponding to the radius of the NPC, convolved with a Gaussian. Local maxima over a user-defined threshold were treated as possible candidates. Candidates were cleaned up by two additional steps: (1) We fitted the localizations corresponding to each candidate with a circle and excluded structures with a very small (<50 nm for antibody-labeled data, <40 nm for other) or very large (>80 nm for antibody-labeled data, >70 nm for other) ring radius. (2) Localizations were refitted with a circle of fixed radius to determine the center coordinates. Structures were rejected if more than 25% of localizations were closer than 40 nm to the center (50 nm for antibody-labeled data) or if more than 40% of localizations were further away than 70 nm (80 nm for antibody-labeled data) from the center, as these typically did not visually resemble NPCs or were two adjacent wrongly segmented NPCs.
Determination of effective labeling efficiencies
Calculation of effective labeling efficiencies was done on all successfully segmented NPCs and followed an automated six-step protocol. (1) Localizations were fitted with a ring with a fixed radius corresponding to the mean radius determined before. Additionally, localization coordinates were converted into polar coordinates ϕI,rI. (2) Localizations closer to the center than 30 nm (50 nm for antibody-labeled data) or further away than 70 nm (80 nm for antibody-labeled data) were excluded as background localizations. (3) Rotational alignment of structures was achieved by minimizing . (4) The structures were overlayed with a mask consisting of 8-fold symmetric segments, recapitulating the arrangement of Nup96 in the NPC. We counted the number of segments containing a localization from a histogram of ϕI with a bin width of and a start bin of . (5) We then constructed a histogram of the number of detected non-empty segments in all NPCs in the data set and fitted it using a probabilistic model as described before13 with the effective labeling efficiency as a free fitting parameter. (6) Statistical error was determined by bootstrapping with 20 re-sampled data sets.
Determination of the number of localizations per fluorophore
The number of localizations per fluorophore was calculated by dividing the number of localizations per NPC by the effective labeling efficiency times 32, i.e. the number of Nup96 molecules per NPC.
Extended Data
Extended Data Figure 1.
Extended Data Figure 2.
Extended Data Figure 3.
Extended Data Figure 4.
Extended Data Figure 5.
Extended Data Figure 6.
Extended Data Figure 7.
Extended Data Figure 8.
Extended Data Figure 9.
Extended Data Figure 10.
Supplementary Material
Acknowledgements
We thank A. Rahmani and V. Dunsing for assistance in the data acquisition and processing. We thank Y. Lin and J. Bewersdorf for sharing their raw data and discussing the reanalysis. This work was supported by the European Research Council (grant no. ERC CoG-724489 to J.R.), the National Institutes of Health Common Fund 4D Nucleome Program (grant no. U01 EB021223 to J.R.), the Human Frontier Science Program (RGY0065/2017 to J.R.), the Engelhorn Foundation (Postdoctoral Fellowship to R.D.) and the European Molecular Biology Laboratory.
Footnotes
Author Contributions
R.D., M.K. and J.R. conceived the project. R.D. built the main optical setup. M.K., A.S. and U.M. prepared the samples. R.D., M.K. and A.S. acquired and analyzed the data. J.D. wrote the acquisition software. J.R. wrote the analysis software and performed the simulations. R.D., M.K., A.S. and J.R. wrote the manuscript with input from all authors.
Competing Interests
The authors declare no competing interests.
Data Availability
All processed data (lists of localizations) and for each condition at least one example file of raw data (camera frames of blinking fluorophores) are deposited on BioStudies (https://www.ebi.ac.uk/biostudies/S-BSST425) under access number S-BSST425.
Code Availability
The software for the data acquisition and analysis used in this paper is available at github.com/jdeschamps/htSMLMandgithub.com/jries/SMAP, respectively.
References
- 1.Betzig E, et al. Imaging Intracellular Fluorescent Proteins at Nanometer Resolution. Science. 2006;313:1642–1645. doi: 10.1126/science.1127344. [DOI] [PubMed] [Google Scholar]
- 2.Rust MJ, Bates M, Zhuang X. Sub-diffraction-limit imaging by stochastic optical reconstruction microscopy (STORM) Nat Methods. 2006;3:793–796. doi: 10.1038/nmeth929. [DOI] [PMC free article] [PubMed] [Google Scholar]
- 3.Heilemann M, et al. Subdiffraction-Resolution Fluorescence Imaging with Conventional Fluorescent Probes. Angew Chem Int Ed. 2008;47:6172–6176. doi: 10.1002/anie.200802376. [DOI] [PubMed] [Google Scholar]
- 4.Huang F, et al. Video-rate nanoscopy using sCMOS camera-specific single-molecule localization algorithms. Nat Methods. 2013;10:653–658. doi: 10.1038/nmeth.2488. [DOI] [PMC free article] [PubMed] [Google Scholar]
- 5.Barentine AES, et al. 3D Multicolor Nanoscopy at 10,000 Cells a Day. bioRxiv. 2019 doi: 10.1101/606954. 606954. [DOI] [Google Scholar]
- 6.Lin Y, et al. Quantifying and Optimizing Single-Molecule Switching Nanoscopy at High Speeds. PLOS ONE. 2015;10 doi: 10.1371/journal.pone.0128135. e0128135. [DOI] [PMC free article] [PubMed] [Google Scholar]
- 7.Mortensen KI, Churchman LS, Spudich JA, Flyvbjerg H. Optimized localization analysis for single-molecule tracking and super-resolution microscopy. Nat Methods. 2010;7:377–381. doi: 10.1038/nmeth.1447. [DOI] [PMC free article] [PubMed] [Google Scholar]
- 8.Jones SA, Shim S-H, He J, Zhuang X. Fast, three-dimensional super-resolution imaging of live cells. Nat Methods. 2011;8:499–505. doi: 10.1038/nmeth.1605. [DOI] [PMC free article] [PubMed] [Google Scholar]
- 9.Pennacchietti F, Gould TJ, Hess ST. The Role of Probe Photophysics in Localization-Based Superresolution Microscopy. Biophys J. 2017;113:2037–2054. doi: 10.1016/j.bpj.2017.08.054. [DOI] [PMC free article] [PubMed] [Google Scholar]
- 10.Shroff H, Galbraith CG, Galbraith JA, Betzig E. Live-cell photoactivated localization microscopy of nanoscale adhesion dynamics. Nat Methods. 2008;5:417–423. doi: 10.1038/nmeth.1202. [DOI] [PMC free article] [PubMed] [Google Scholar]
- 11.Dempsey GT, Vaughan JC, Chen KH, Bates M, Zhuang X. Evaluation of fluorophores for optimal performance in localization-based super-resolution imaging. Nat Methods. 2011;8:1027–1036. doi: 10.1038/nmeth.1768. [DOI] [PMC free article] [PubMed] [Google Scholar]
- 12.Legant WR, et al. High-density three-dimensional localization microscopy across large volumes. Nat Methods. 2016;13:359–365. doi: 10.1038/nmeth.3797. [DOI] [PMC free article] [PubMed] [Google Scholar]
- 13.Thevathasan JV, et al. Nuclear pores as versatile reference standards for quantitative superresolution microscopy. Nat Methods. 2019;16:1045–1053. doi: 10.1038/s41592-019-0574-9. [DOI] [PMC free article] [PubMed] [Google Scholar]
- 14.Nieuwenhuizen RPJ, et al. Measuring image resolution in optical nanoscopy. Nat Methods. 2013;10:557–562. doi: 10.1038/nmeth.2448. [DOI] [PMC free article] [PubMed] [Google Scholar]
- 15.van de Linde S, et al. Direct stochastic optical reconstruction microscopy with standard fluorescent probes. Nat Protoc. 2011;6:991–1009. doi: 10.1038/nprot.2011.336. [DOI] [PubMed] [Google Scholar]
- 16.Dempsey GT, et al. Photoswitching Mechanism of Cyanine Dyes. J Am Chem Soc. 2009;131:18192–18193. doi: 10.1021/ja904588g. [DOI] [PMC free article] [PubMed] [Google Scholar]
- 17.van de Linde S, et al. Photoinduced formation of reversible dye radicals and their impact on super-resolution imaging. Photochem Photobiol Sci. 2011;10:499–506. doi: 10.1039/c0pp00317d. [DOI] [PubMed] [Google Scholar]
- 18.Zheng Q, et al. Ultra-stable organic fluorophores for single-molecule research. Chem Soc Rev. 2014;43:1044–1056. doi: 10.1039/c3cs60237k. [DOI] [PMC free article] [PubMed] [Google Scholar]
- 19.Donnert G, Eggeling C, Hell SW. Major signal increase in fluorescence microscopy through dark-state relaxation. Nat Methods. 2007;4:81–86. doi: 10.1038/nmeth986. [DOI] [PubMed] [Google Scholar]
- 20.Huang B, Jones SA, Brandenburg B, Zhuang X. Whole-cell 3D STORM reveals interactions between cellular structures with nanometer-scale resolution. Nat Methods. 2008;5:1047–1052. doi: 10.1038/nmeth.1274. [DOI] [PMC free article] [PubMed] [Google Scholar]
- 21.Kim J, et al. Oblique-plane single-molecule localization microscopy for tissues and small intact animals. Nat Methods. 2019;16:853–857. doi: 10.1038/s41592-019-0510-z. [DOI] [PubMed] [Google Scholar]
- 22.Gustavsson A-K, Petrov PN, Lee MY, Shechtman Y, Moerner WE. 3D single-molecule super-resolution microscopy with a tilted light sheet. Nat Commun. 2018;9:123. doi: 10.1038/s41467-017-02563-4. [DOI] [PMC free article] [PubMed] [Google Scholar]
- 23.Bossi M, et al. Multicolor Far-Field Fluorescence Nanoscopy through Isolated Detection of Distinct Molecular Species. Nano Lett. 2008;8:2463–2468. doi: 10.1021/nl801471d. [DOI] [PubMed] [Google Scholar]
- 24.Zhang Y, et al. Nanoscale subcellular architecture revealed by multicolor three-dimensional salvaged fluorescence imaging. Nat Methods. 2020;17:225–231. doi: 10.1038/s41592-019-0676-4. [DOI] [PMC free article] [PubMed] [Google Scholar]
- 25.Balzarotti F, et al. Nanometer resolution imaging and tracking of fluorescent molecules with minimal photon fluxes. Science. 2017;355:606–612. doi: 10.1126/science.aak9913. [DOI] [PubMed] [Google Scholar]
- 26.Schlichthaerle T, et al. Direct Visualization of Single Nuclear Pore Complex Proteins Using Genetically-Encoded Probes for DNA-PAINT. Angew Chem Int Ed. 2019;58:13004–13008. doi: 10.1002/anie.201905685. [DOI] [PMC free article] [PubMed] [Google Scholar]
- 27.Nahidiazar L, Agronskaia AV, Broertjes J, van den Broek B, Jalink K. Optimizing Imaging Conditions for Demanding Multi-Color Super Resolution Localization Microscopy. PLOS ONE. 2016;11 doi: 10.1371/journal.pone.0158884. e0158884. [DOI] [PMC free article] [PubMed] [Google Scholar]
- 28.Wäldchen S, Lehmann J, Klein T, van de Linde S, Sauer M. Light-induced cell damage in live-cell super-resolution microscopy. Sci Rep. 2015;5:1–12. doi: 10.1038/srep15348. [DOI] [PMC free article] [PubMed] [Google Scholar]
- 29.Reymond L, Huser T, Ruprecht V, Wieser S. Modulation-enhanced Localization Microscopy (meLM) J Phys Photonics. 2020 doi: 10.1088/2515-7647/ab9eac. [DOI] [Google Scholar]
- 30.Li Y, et al. Real-time 3D single-molecule localization using experimental point spread functions. Nat Methods. 2018;15:367–369. doi: 10.1038/nmeth.4661. [DOI] [PMC free article] [PubMed] [Google Scholar]
Associated Data
This section collects any data citations, data availability statements, or supplementary materials included in this article.
Supplementary Materials
Data Availability Statement
All processed data (lists of localizations) and for each condition at least one example file of raw data (camera frames of blinking fluorophores) are deposited on BioStudies (https://www.ebi.ac.uk/biostudies/S-BSST425) under access number S-BSST425.
The software for the data acquisition and analysis used in this paper is available at github.com/jdeschamps/htSMLMandgithub.com/jries/SMAP, respectively.


