Abstract
Plasmacytoid dendritic cells (pDCs) are a major source of type I interferon (IFN-I). What other functions pDCs exert in vivo during viral infections is controversial and more studies are needed to understand their orchestration. Here, we characterize in-depth and link pDC activation states in animals infected by mouse cytomegalovirus, by combining Ifnb1 reporter mice with flow cytometry, single-cell RNA sequencing, confocal microscopy and a cognate CD4 T cell activation assay. We show that IFN-I production and T cell activation were performed by the same pDC, but sequentially in time and in different micro-anatomical locations. In addition, we show that pDC commitment to IFN-I production was marked early on by their downregulation of LIFR and promoted by cell-intrinsic TNF signaling. We propose a novel model of how individual pDCs are endowed to exert different functions in vivo during a viral infection in a manner tightly orchestrated in time and space.
Introduction
Plasmacytoid dendritic cells (pDCs) produce massive amounts of type I interferons (IFN-I) in response to virus-type stimuli1, including in vivo during mouse cytomegalovirus (MCMV) infection2, 3. pDCs exert this function by engulfing material derived from viruses or infected cells, and routing it to dedicated endosomes for toll-like receptors 7/9 triggering and activation of the MyD88-to-IRF7 signaling pathway1.
Soon after their discovery, pDCs were proposed to first produce IFN-I and then acquire features of conventional dendritic cells (cDCs)4, including dendrites and the ability to present antigens4–7, upon specific stimulation conditions. However, adequate pDC purification methods and single-cell analysis tools were lacking to prove this hypothesis. Indeed, when defined by few surface markers, pDCs can be contaminated with cDC precursors8–10, pDC-like cells11, non-canonical CD8α+ cDCs12, 13 or transitional DCs (tDCs)14, 15. These cells harbor mixed phenotypic and functional characteristics of pDCs and cDCs and are more powerful than resting pDCs for T cell activation. Hence, T cell activation by pDCs was claimed to result from this contamination. However, discrepancies in the stimuli used to activate pDCs likely contributed to fuel the controversy on their T cell activation capacity16, 17. It is not clear to which extent pDC phenotypic and functional heterogeneity reflects their true developmental or stimulation-induced plasticity versus a lineage contamination by other cells18–21. pDC activation differs in response to synthetic TLR ligands, viral particles or infected cells22–24. Rigorously characterizing pDC cell fate and functional plasticity in vivo during viral infections thus remains a major challenge15, 19, 21.
Here, we characterized and linked pDC activation states in MCMV-infected animals, by combining Ifnb1-reporter mice25 with flow cytometry, single-cell RNA sequencing (scRNAseq), confocal microscopy and a CD4 T cell priming assay. Contrary to currently prevailing models of pDC plasticity19, 20, we demonstrated that IFN-I production and T cell activation were performed by the same pDC, but sequentially in time and in different microenvironments.
Results
pDCs specifically express IFN-I during MCMV infection
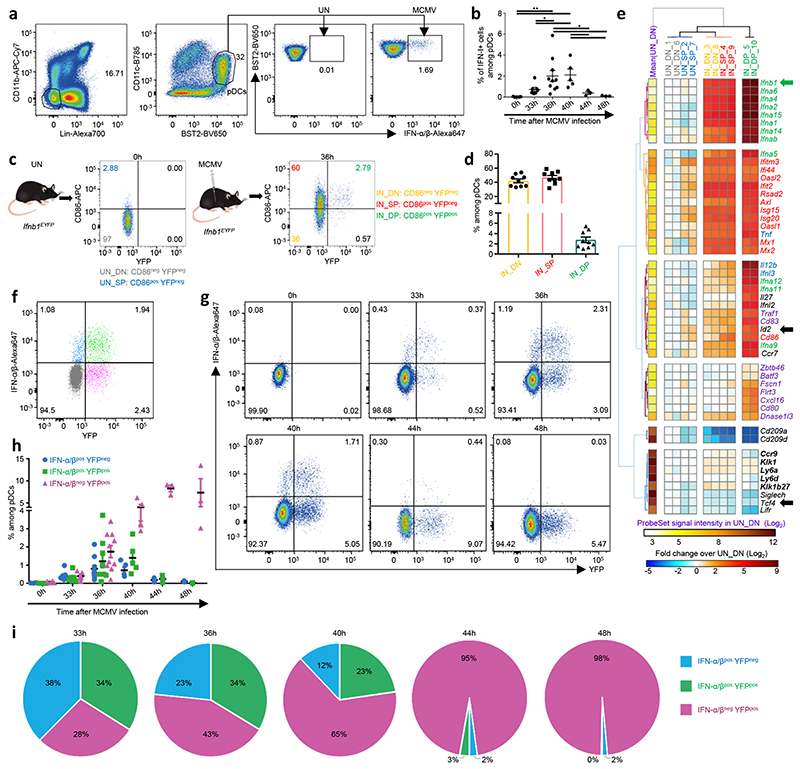
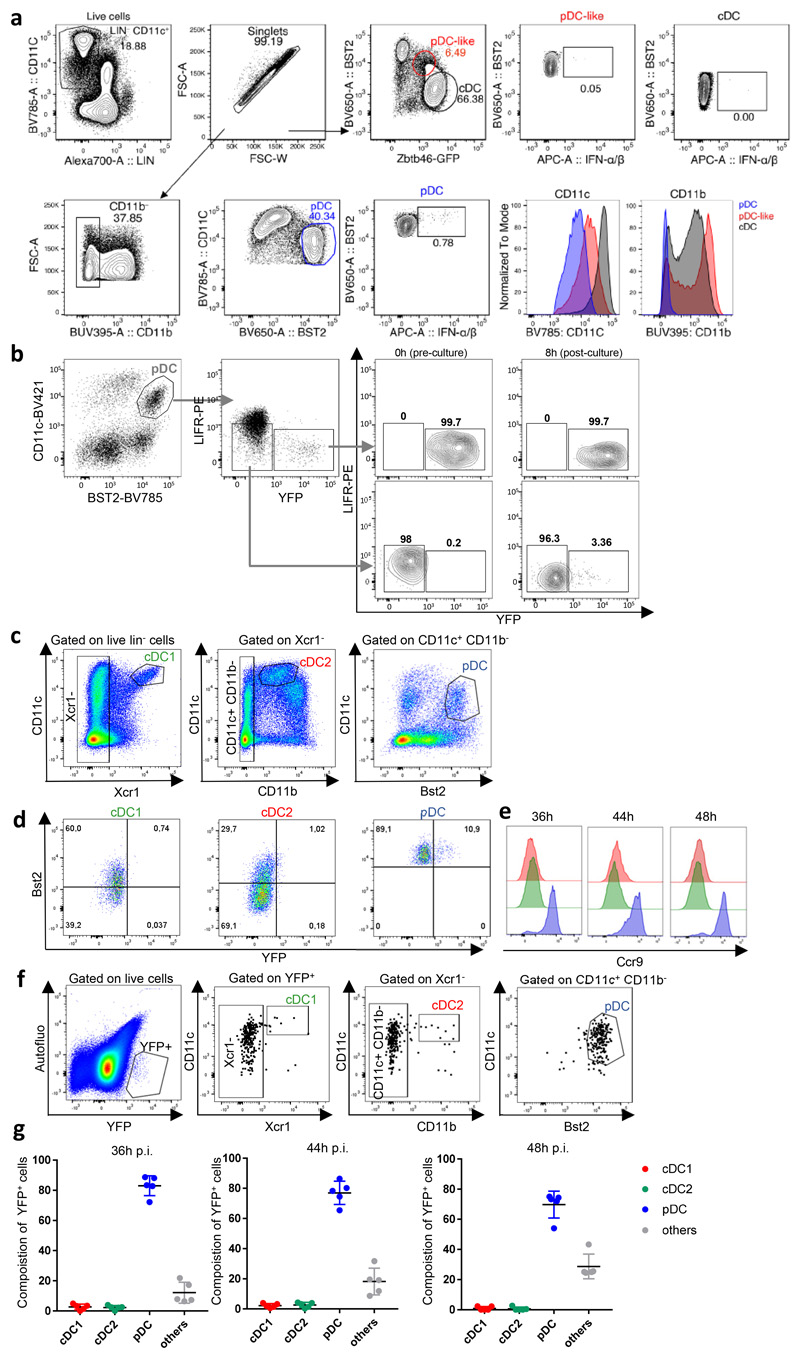
We analyzed IFN-I production kinetics in splenic pDCs during MCMV infection (Fig. 1a-b). IFN-I-producing pDCs were detected at 33h post-infection, their percentage increased at 36h and 40h, diminished at 44h and became undetectable at 48h. Since pDC-like cells share Zbtb46 expression with cDCs10, 11, 26, we harnessed Zbtb46Egfp mice to identify them and show that they do not express IFN-I at 36h post-infection (Extended Data Fig. 1a). Thus, IFN-I expression occurred specifically in a minor fraction of splenic pDCs around 36h post-infection, consistent with previous work27.
Fig. 1. Bulk transcriptional profiling suggests the induction of distinct pDC activation states in vivo during MCMV infection.
a, pDC gating strategy within live single-cells. b, Percentages of IFN-I+ cells within pDCs at indicated time points afterMCMV infection. *p<0.05, **p<0.01 (One-way ANOVA). c, YFP and CD86 co-expression in pDCs isolated from uninfected (UN) or 36h MCMV-infected (IN) Ifnb1EYFP mice. d, Percentages of subpopulations within splenic pDCs of 36h MCMV-infected Ifnb1EYFP mice. The data are shown for n=9 individual mice pooled from 3 independent experiments. e, Heatmap showing mRNA expression levels of selected genes (rows) across pDC subpopulations (columns), with hierarchical clustering using City block distance for cells and Euclidian distance for genes. f, Co-expression of IFN-α/β and YFP in pDCs isolated from one representative 36h MCMV-infected Ifnb1Eyfp mouse. g, Co-expression of IFN-α/β and YFP in pDCs isolated from Ifnb1Eyfp mice, at 0h (UN), 33h, 36h, 40h, 44h and 48h after MCMV infection. For each time point, one representative mouse is shown. h, Proportions of IFN-α/β+YFP–, IFN-α/β+YFP+ and IFN-α/β–YFP+ cells amongst pDCs, at indicated time points. i, Pie charts recapitulating the mean proportions of cells expressing IFN-I and/or YFP (see color key) amongst pDC positive for either molecule at different time points during the course of MCMV infection in Ifnb1Eyfp mice. For panels b, d and h, data are presented as mean±s.e.m, and for panel i as mean percentage. Panels b and f-i show data from individual mice, with n=5 at 0h, 7 at 33h, 10 at 36h, 5 at 40h, and 3 at 44h and 48h, pooled from 2 (resp. 3) independent experiments for 33h and 40h (resp. 0h and 36h). One experiment was performed for 44h and 48h.
Microarray analysis of pDCs isolated from MCMV-infected Ifnb1Eyfp mice suggests their heterogeneity
We harnessed the Ifnb1Eyfp reporter mice25 to characterize Ifnb1-producing pDCs and follow their fate in vivo during MCMV infection. The half-life of YFP in live cells exceeds 24h28, 29. Consistently, YFP+ pDCs sorted from 36h infected Ifnb1Eyfp mice and cultured ex vivo for 8h harbored stable YFP expression (Extended Data Fig. 1b). At 36h, 44h and 48h post-infection, both the percentage and MFI of YFP+ cDCs were very low (Extended Data Fig. 1c-e), whereas around 80% of YFP+ splenocytes were XCR1– CD11b– CD11cint Bst2hi (Extended Data Fig. 1f-g), therefore being bona fide CCR9+ pDCs (Extended Data Fig. 1c-e). Thus, Ifnb1Eyfp mice allow reliable identification and fate-mapping of Ifnb1-producing pDCs in vivo.
YFP and CD86 co-expression at 36h post-infection identified three pDC subpopulations (Fig. 1c,d). In uninfected (UN) animals, most pDCs were CD86–YFP– (DN cells), with the remainder being CD86+YFP– (SP cells). In infected (IN) mice, half of the pDCs expressed CD86 (IN_SP cells), with a minority being YFP+ (IN_DP cells). pDC subpopulations were sorted by flow cytometry for gene expression profiling (Fig. 1e). Interferon-stimulated genes (ISG) were induced in all pDC subpopulations from infected mice (Fig. 1e, red names). Cd86 induction was stronger in IN_SP and IN_DP pDCs (Fig. 1e), consistent with their purification as CD86+. Unexpectedly, IN_DN and IN_SP pDCs expressed IFN-I genes (Fig. 1e, green names), including Ifnb1 (green arrow), and other MyD88-dependent genes (MSG)22 (Fig. 1e, blue names), but at lower levels than IN_DP cells. The IN_DP cells specifically up-regulated genes known to be higher in steady state pDC-like cells11 or tDCs13, 15 (Fig. 1e, violet names), including genes involved in T cell activation by cDCs. The IN_DP cells expressed lower Tcf4 and higher Id2 levels (Fig. 1e, black arrows), two transcription factors driving pDC versus cDC1 differentiation and identity maintenance respectively19, 30. All pDC subpopulations expressed high and comparable levels of genes known to be specific of steady state pDCs as compared to cDC-like cells, tDCs and cDCs10, 11, 13, 15, including Ccr9, Ly6d, Klk1 and Klk1b27 (Fig. 1e, bold black names). Thus, YFP– pDCs isolated from infected mice unexpectedly expressed IFN-I genes, while YFP+ pDCs acquired a transcriptomic program shared with tDCs and cDCs, suggesting further heterogeneity within each pDC subpopulation.
IFN-I and YFP co-expression reveals three consecutive pDC activation states
We analyzed YFP and IFN-I co-expression in splenic pDCs isolated from 36h MCMV-infected Ifnb1Eyfp mice (Fig. 1f). A small fraction of YFP– pDCs expressed IFN-I, albeit with a lower MFI than YFP+ pDCs. Thus, IFN-I expression preceded YFP detection in pDCs, likely explaining the moderate induction of IFN-I genes in IN_DN and IN_SP pDCs in microarray analyses. Half of YFP+ pDCs did not express IFN-I, suggesting that they were in a late activation state, where they had already secreted IFN-I but retained YFP expression. Therefore, we examined IFN-I and YFP co-expression kinetically during infection (Fig. 1g-i). Whereas IFN-I expression peaked between 36h and 40h post-infection (Fig. 1g-h), the frequency of YFP+ pDCs continued increasing to reach a plateau between 44h and 48h (Fig. 1g-h). Hence, within pDCs expressing IFN-I or YFP, the proportions of IFN-I+YFP– cells decreased after 33h, to become undetectable at 48h, whereas the proportions of IFN-I+YFP+ cells peaked at 36h, and the proportions of IFN-I–YFP+ cells increased steadily (Fig. 1i). Thus, pDCs undergo a more complex activation than anticipated, encompassing at least three consecutive stages for IFN-I production. At an early stage, cytokine production starts at relatively low level as revealed by lack of YFP expression (IFN-I+YFP–). Then, high expression of both YFP and IFN-I marks pDCs at peak IFN-I production (IFN-I+YFP+). Finally, pDCs undergo a late activation stage, previously overlooked, where they have secreted IFN-I but remain fate-mapped for their expression (IFN-I–YFP+). Thus, pDCs survive more than 12h after ceasing IFN-I production, raising the question of their terminal activation state and functions.
scRNAseq confirms the existence of different pDC activation states during infection
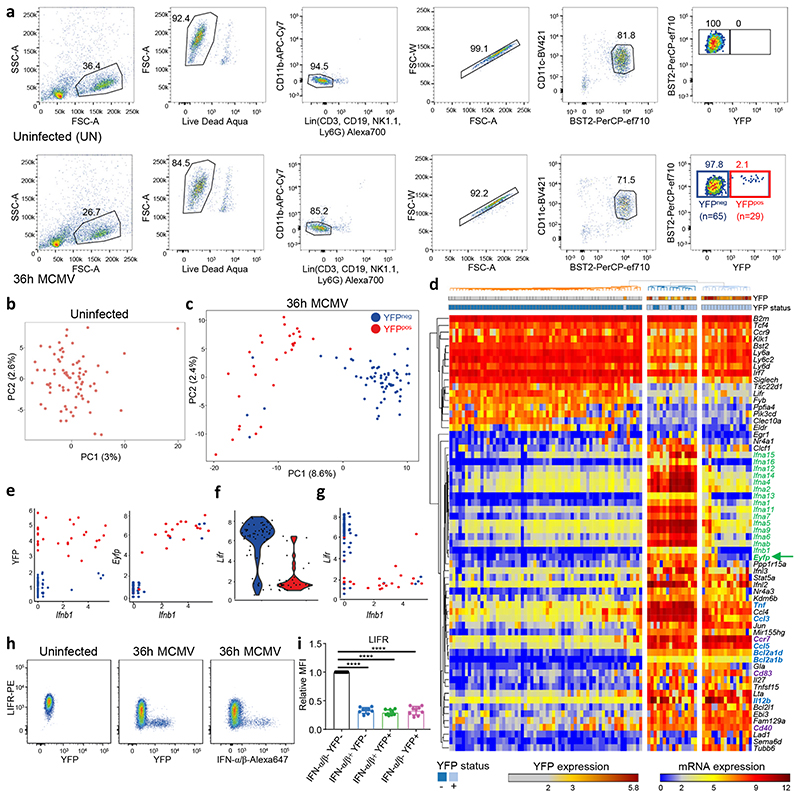
To better characterize pDC activation states without the confounding effect of cross-contamination between populations as can happen in bulk transcriptomics, we performed scRNAseq on splenic pDCs from one uninfected and one 36h MCMV-infected Ifnb1Eyfp mice (Fig. 2a), using Smart-seq2 (SS2)31. For the infected mouse, 94 pDCs were index sorted, with enrichment of YFP+ pDCs to one third of all cells (SS2 dataset#1).
Fig. 2. scRNAseq analysis of pDCs from 36h MCMV-infected mice confirms their heterogeneity and pinpoints to LIFR downregulation as a selective marker of IFN-I-producing pDCs.
a, Flow cytometry gating strategy for index sorting of pDC from one uninfected mouse (top) and from one 36h MCMV-infected mouse (bottom). Numbers in parentheses correspond to the number of cells sorted for each population. b-c, Principal component analysis (PCA) on 1,016 highly variable genes of single pDCs isolated from uninfected, b, or from one MCMV-infected mice (SS2 dataset#1), c, encompassing 29 YFP+ cells (red) and 65 YFP– cells (blue). d, Heatmap showing mRNA expression of selected genes, and YFP protein fluorescence intensity obtained from index sorting data, with hierarchical clustering using one minus Pearson correlation as distance metric for both cells and genes. e, Scatter plots showing Ifnb1 expression vs YFP protein fluorescence intensity (left), or Ifnb1 vs Eyfp mRNA expression (right). f, Violin plot showing Lifr expression in YFP– vs YFP+ pDCs. g, Scatter plot showing Ifnb1 vs Lifr mRNA expression. h, Flow cytometry analysis showing the downregulation of LIFR protein expression on IFN-α/β+ (middle) or YFP+ (right) pDC isolated from 36h MCMV-infected Ifnb1EYFP mice, as compared to pDC isolated from uninfected animals (left). The dot plots shown are from one mouse representative of 10 animals. i, Relative median fluorescence intensity (MFI) of LIFR on IFN-α/β–YFP– (black), IFN-α/β+YFP– (blue), IFN-α/β+YFP+ (green) and IFN-α/β–YFP+ (pink) populations. The data are shown for n=10 individual animals pooled from 2 independent experiments, with overlay of mean±s.e.m. values. ****p<0.0001 (One-way ANOVA with Tukey’s post hoc test).
Principal component analysis (PCA) did not show heterogeneity in steady-state pDCs (Fig. 2b). In contrast, the pDCs from the infected mouse (Fig. 2c) clearly segregated along the first PCA axis (PC1) into YFP+ (red dots) and YFP− (blue dots) subpopulations. Consistently, IFN-I genes and other MSG strongly contributed to PC1. Based on top PC1 genes, hierarchical clustering not only separated most YFP– from YFP+ pDCs, but also split YFP+ pDCs in two clusters (Fig. 2d). The first YFP+ pDC cluster co-expressed Eyfp and IFN-I genes (Fig. 2d, green arrow and names), therefore corresponding to the peak IFN-I+YFP+ activation state identified by flow cytometry. Most cells of the second YFP+ pDC cluster expressed neither Eyfp nor IFN-I genes, or at very low levels (Fig. 2d). However, Eyfp –YFP+ and Eyfp +YFP+ pDCs shared the expression of other MSG, including Il12b, Ccl5, Ccl3 and Tnf (Fig. 2d, bold blue names). As compared to YFP– pDCs, YFP+ pDCs expressed pDC-like cell/tDC/cDC genes, including Cd83, Cd40 and Ccr7 (Fig. 2d, bold violet names). Thus, the Eyfp –YFP+ pDC cluster matched with the late IFN-I–YFP+ activation state identified by flow cytometry, corresponding to pDCs that had secreted IFN-I and stopped transcribing IFN-I genes.
Out of the 65 YFP− pDCs, 4 segregated with YFP+ pDCs, both in PCA and hierarchical clustering (Fig. 2c-d). These YFP− pDCs expressed high levels of Eyfp and IFN-I genes (Fig. 2d,e), confirming that detectable induction of IFN-I precedes that of YFP. Thus, Eyfp +YFP− pDCs corresponded to the early IFN-I+YFP− activation state identified by flow cytometry.
Eyfp and IFN-I gene expression were tightly correlated in single pDCs (Fig. 2d-e and Supplementary Table 1), consistent with the known synchronous induction of all IFN-I32 in a manner dependent on IRF7 but not IFN-I receptor signaling, specfically in pDCs22, 33–35. Thus, in Ifnb1Eyfp mice, Eyfp reliably reports expression of all IFN-I genes in pDCs.
In summary, combined expression of the Eyfp gene and of the YFP protein in Ifnb1Eyfp mice enabled accurate tracking in scRNAseq analyses of three consecutive activation states of the pDCs engaged in IFN-I production, corresponding to early Eyfp +YFP−, peak Eyfp +YFP+ and late Eyfp −YFP+ pDC clusters.
LIFR is selectively downregulated on IFN-I-expressing pDCs
The small number of Eyfp +YFP– pDCs limited the accuracy of the analysis of their gene expression program. Therefore, we sought for a cell surface marker to enrich them. Cd83, Ccr7 and Lifr were differentially expressed between YFP+ and YFP– pDCs. Cd83 and Ccr7 were induced on pDCs expressing Ifnb1 or YFP. Reciprocally, Lifr was selectively downregulated in the vast majority of Ifnb1 + pDCs regardless of their YFP expression (Fig. 2f-g). Flow cytometry analysis confirmed a stronger downregulation of LIFR on YFP+ or IFN-I+ pDCs (Fig. 2h-i), whereas CD83 and CCR7 were induced only on a fraction of YFP+ pDCs. Since IFN-I+ pDCs express the highest levels of BST2 (Fig. 1a), we combined LIFR downregulation with YFP and BST2 expression for enriching Eyfp +YFP− pDCs (Extended Data Fig. 2a).
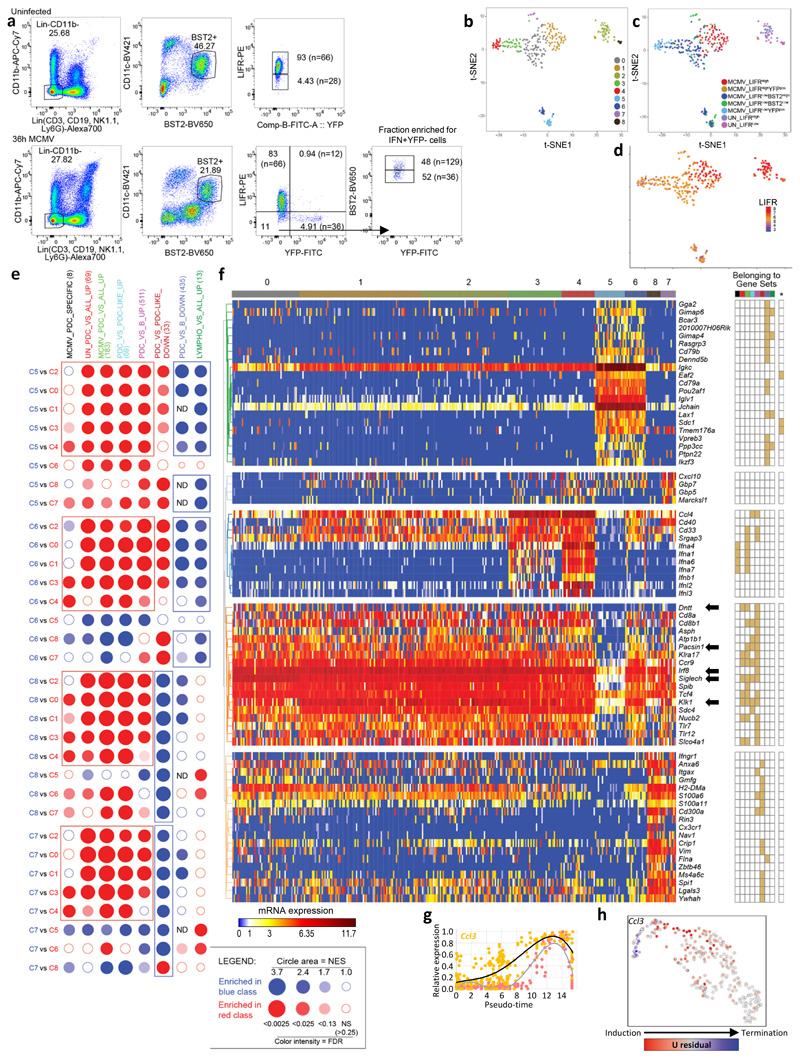
pDCs from one uninfected and one 36h MCMV-infected Ifnb1Eyfp mice were index-sorted with enrichment of LIFRlo cells (SS2 dataset#2). This led to a contamination of pDCs by limited numbers of pDC-like or B cells, none of which was YFP+ (Supplementary Data 1, Extended Data Fig 2b-f). The expression of Eyfp and IFN-I genes were again tightly correlated (Supplementary Table 2). The remaining cells were bona fide pDCs expressing high levels of key pDC signature genes, including Klk1, Siglech, Pacsin1, Dntt and Irf8 (Extended Data Fig 2f, black arrows), but low levels of the genes selective of lymphocytes36, B cells, plasma cells37 or pDC-like cells11 (Extended Data Fig 2f).
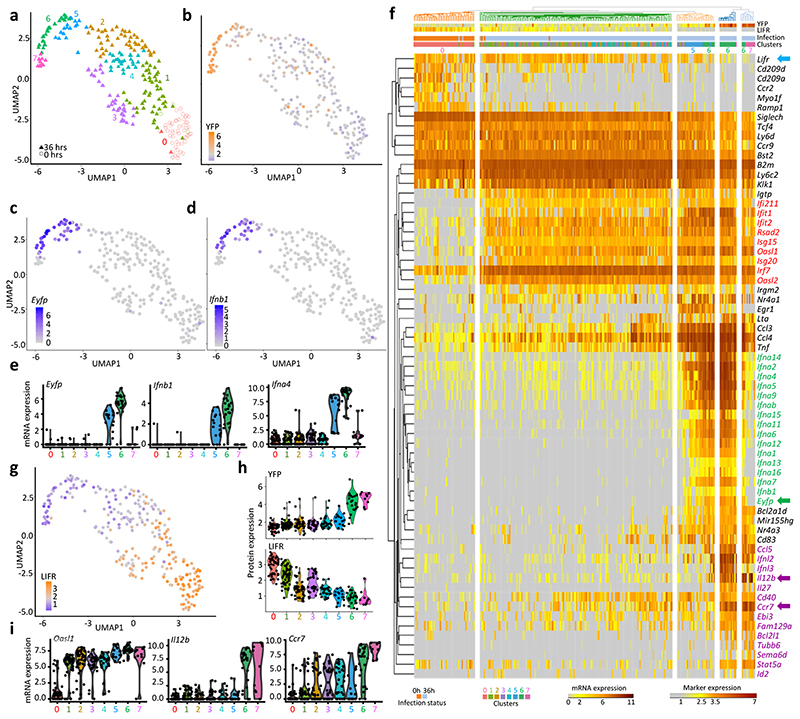
Upon UMAP dimensionality reduction and graph-based cell clustering (Fig. 3a), the pDCs from the uninfected mouse regrouped together (C0) remotely from the 7 clusters derived from the pDCs of the infected mouse. Projection on the UMAP of the expression levels of YFP (Fig. 3b), Eyfp (Fig. 3c) and Ifnb1 (Fig. 3d) identified the clusters corresponding to the three pDC activation states uncovered in our previous experiments: Eyfp +YFP– (C5), Eyfp +YFP+ (C6) and Eyfp –YFP+ (C7). Eyfp +YFP– C5 cells expressed Eyfp and most IFN-I genes, although at lower levels than the Eyfp +YFP+ C6 cells (Fig. 3e; green names on Fig. 3f). C5 represented 16% of the LIFRloBST2hi pDCs from the infected mouse (Supplementary Table 3), and encompassed 88% of LIFRloBST2hi sorted pDCs. LIFR expression was downregulated most strongly in clusters C5, C6 and C7 (Fig. 3g-h), thus helping to discriminate C5 Eyfp +YFP– cells from all other YFP– cells. In contrast to steady state pDCs (C0), all pDC clusters from the infected mouse (C1-C7) harbored high expression of Oasl1 (Fig. 3i) and other ISG (Fig. 3f, red names), confirming that all individual pDCs had responded to IFN-I at 36h post-infection. The expression of IL12b, Ccr7 and several other genes occurred in C6 rather than C5 and was maintained in C7, thus being delayed and prolonged as compared to IFN-I genes (Fig. 3f, violet names; Fig. 3i).
Fig. 3. scRNAseq analysis identifies 8 different pDC activation states in vivo during MCMV infection.
a, Dimensional reduction performed using the UMAP algorithm, and graph-based cell clustering, for 264 bona fide pDCs isolated from one control and one 36h MCMV-infected mice (SS2 dataset#2). b, Inverse hyperbolic arcsine (asinh) fluorescence intensity of YFP projected on the UMAP space. c-d, Expression of Yfp and Ifnb1 on the UMAP space. e, Violin plots showing mRNA expression profiles of selected genes across all individual cells and in comparison between the clusters identified in (a), cluster 0= UN pDCs, clusters 1-4= MCMV Eyfp –YFP– pDCs, cluster 5= MCMV Eyfp+YFP– pDCs, cluster 6= MCMV Eyfp+YFP+ pDCs, cluster 7= MCMV Eyfp–YFP+ pDCs. f, Heatmap showing mRNA expression levels of selected genes (rows) across individual pDCs (columns), with hierarchical clustering using one minus Spearman rank correlation for cells and Kendall’s tau distance for genes. The top differentially expressed genes between Seurat clusters are shown, as well as representative ISG and pDC-specific genes. B2m was included as an invariant control housekeeping gene. YFP and LIFR protein fluorescence intensities, obtained from index sorting data, are also shown on the top of the heatmap, as well as the infection status of the mice from which the pDCs were isolated, and the belonging of individual pDCs to the Seurat cell clusters. g, LIFR expression intensity projected on the UMAP space. h, Violin plots showing asinh fluorescence intensity of EYFP and LIFR across Seurat clusters. i, Violin plots showing mRNA expression profiles of selected genes across Seurat clusters.
In summary, our enrichment strategy of LIFRlo cells improved recovery of the rare Eyfp +YFP– pDCs, enabling the generation of a more robust scRNAseq dataset to characterize these cells including their relationships with other pDC activation states.
Reconstruction of the pDC activation trajectory
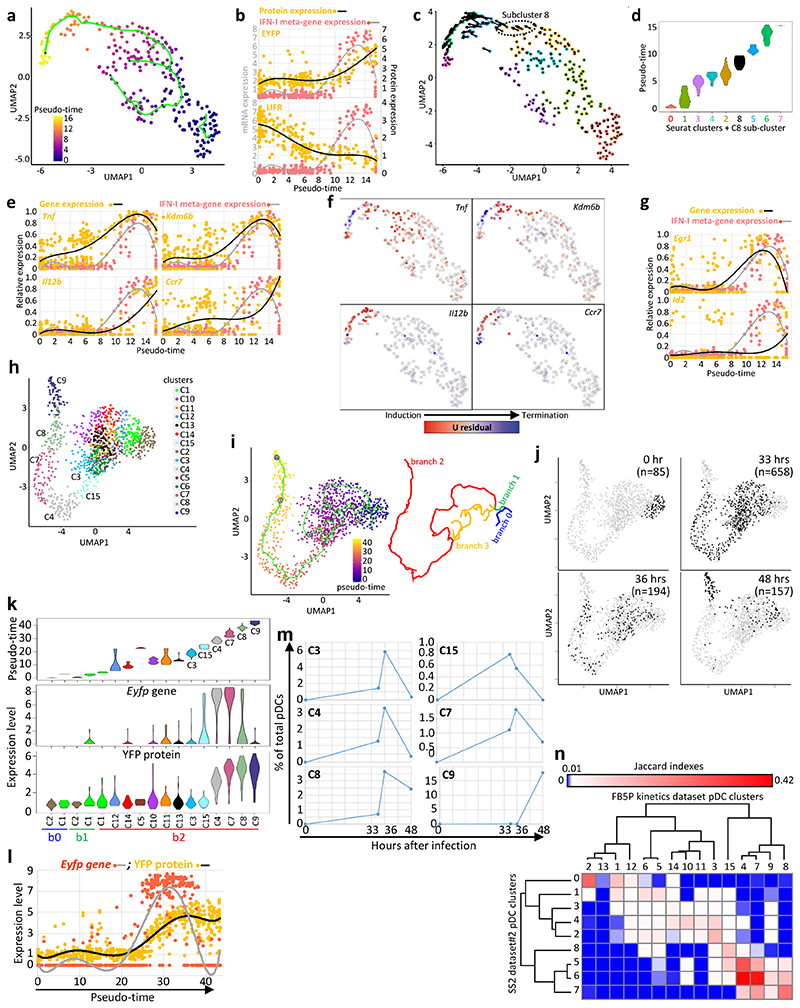
We used Monocle to infer a pseudo-temporal sequence of pDC activation states during MCMV infection (Fig. 4a), which yielded a distinctive linear branch ordering pDCs clusters along pseudo-time in the following sequence: Eyfp–YFP– (C2) → Eyfp+YFP– (C5) → Eyfp+YFP+ (C6) → Eyfp–YFP+ (C7) (Fig. 3a and Fig. 4a). We defined an IFN-I meta-gene and plotted its expression along pseudo-time in comparison with that of other genes or of phenotypic markers. Transcription of the IFN-I meta-gene started around pseudo-time 10, preceding detectable expression of YFP around pseudo-time 12 (Fig. 4b, upper graph). At later pseudo-time, expression of the IFN-I meta-gene stopped whereas YFP expression remained high. LIFR expression decreased to reach its minimal plateau around pseudo-time 10, simultaneously to the initiation of IFN-I meta-gene expression (Fig. 4b, lower graph). Hence, pseudo-time analysis fits with delayed but prolonged expression of YFP, as compared to IFN-I transcription, and with LIFR downregulation upon pDC engagement into IFN-I production.
Fig. 4. Inference of the pDC activation trajectory during MCMV infection.
a, Monocle pseudo-temporal inference of the pDC activation trajectory for the SS2 dataset#2. b, Expression of the YFP or LIFR proteins vs the IFN-I meta-gene along pseudo-time. Dots correspond to individual cells and a 6-order polynomial curve was fit to the data. c, RNA Velocity reconstruction of the pDC activation trajectory. Projections of the velocity vector of each pDC are represented as arrows in the UMAP space. The black dotted ellipse corresponds to the new subcluster 8. d, Violin plots showing pseudo-time distribution across Seurat clusters, including subcluster 8. e, Expression along pseudo-time of the indicated genes vs the IFN-I meta-gene, each normalized to their maximal value. f, Predicted induction (red) vs termination (blue) of the transcription of selected genes as obtained using Velocyto. g, Normalized expression along pseudo-time of Egr1 (top) and Id2 (bottom) vs the IFN-I meta-gene. h, UMAP and clustering analysis of the FB5P kinetics dataset after removal of contaminants. i, Pseudo-temporal inference of the pDC activation trajectory obtained using Monocle. j, Distribution in the UMAP space of the cells isolated at different time points after infection. The cell numbers analyzed for each time point (black dots) are indicated in parentheses. k, Violin plots showing the values for pseudo-time (top), Eyfp (middle) and YFP (bottom) expression, across cell clusters. l, Eyfp and YFP expression across pseudo-time. Individual cells are shown as dots and a polynomial curve was fit to the data. m, Calculus of the frequency over real-time of pDCs being in the different activation states (cell clusters) associated to IFN-I production. n, Heatmap showing the equivalences between the pDC clusters from the SS2 dataset#2 and the FB5P kinetics dataset based on the calculation of Jaccard Indexes reflecting their marker gene content overlap. One minus Pearson correlation was used as distance metric for hierarchical clustering.
For independent trajectory inference, we used the Velocyto software, which computes for each cell a vector predicting its future state by precisely defining and integrating the transcriptional states of all the cells from the dataset, based on their unspliced/spliced mRNA ratio for many genes38. The projection of Velocyto vectors onto the UMAP space revealed the predicted pDC activation trajectory (Fig. 4c). YFP expression was not taken into account in this model, and neither were Eyfp and IFN-I genes since they are intron-less. Yet, Velocyto predicted the same activation trajectory (Fig. 4c) as Monocle (Fig. 4a) and YFP/IFN-I co-expression analysis (Fig. 1g-i).
RNA Velocity unraveled a new pDC activation state among C2, immediately preceding the initiation of IFN-I production corresponding to C5. We manually assigned these pDCs to “sub-cluster 8” (Fig. 4c, dotted black ellipse). Consistent with their location in the Velocyto activation trajectory, sub-cluster 8 pDCs presented a distribution of Monocle pseudo-time values higher than those of other C2 pDCs and just below those of C5 Eyfp +YFP– pDCs (Fig. 4d), further illustrating the convergence and complementarity between Velocyto and Monocle for trajectory inference.
Both Monocle (Fig. 4e, Extended Data Fig. 2g) and Velocyto (Fig. 4f, Extended Data Fig. 2h) predicted similar waves of gene expression along the pDC activation trajectory. Tnf and Ccl3 induction preceded that of IFN-I genes, or of their most correlated intron-bearing genes such as Kdm6b. Il12b transcription started later, followed by that of Ccr7, both reaching their maximum at the latest pseudo-times. As compared to the other C2 pDCs, sub-cluster 8 pDCs specifically expressed Egr1, also detected in the C5 Eyfp +YFP– pDCs. Consistently, the pseudo-temporal analysis showed that Egr1 expression pattern resembled and closely preceded that of the IFN-I meta-gene (Fig. 4g, top graph). Egr1 is a transcription factor induced early in response to TLR triggering39, 40. Hence, Egr1 expression is likely an early and transient marker of the initial sensing of the viral infection by individual pDCs, and might promote their IFN-I production. Finally, Monocle showed a late induction of Id2 (Fig. 4g, bottom graph), which might have contributed to cDC gene induction in Eyfp–YFP+ pDCs.
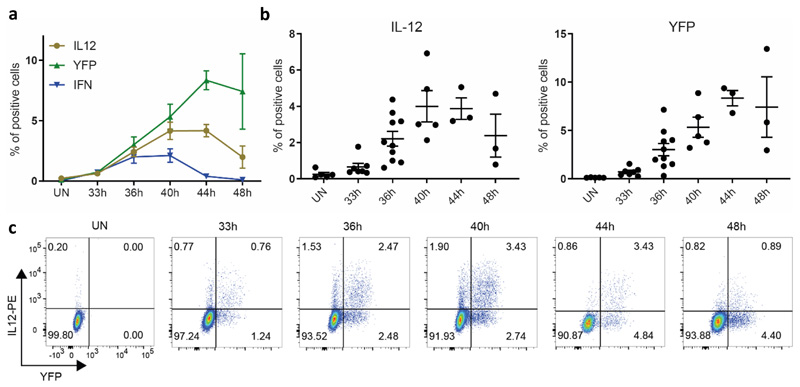
We analyzed the kinetic of IFN-I, YFP and IL-12 expression in pDCs during infection (Extended Data Fig. 3). IL-12 peak production was reached later than that of IFN-I (Extended Data Fig. 3a-b), and, at each time point analyzed, most IL-12+ pDCs were YFP+ (Extended Data Fig. 3c). Thus, these results confirm at the protein level that pDC IL-12 production during infection occurred mostly in the cells that expressed IFN-I, but with a delay and for a longer time window.
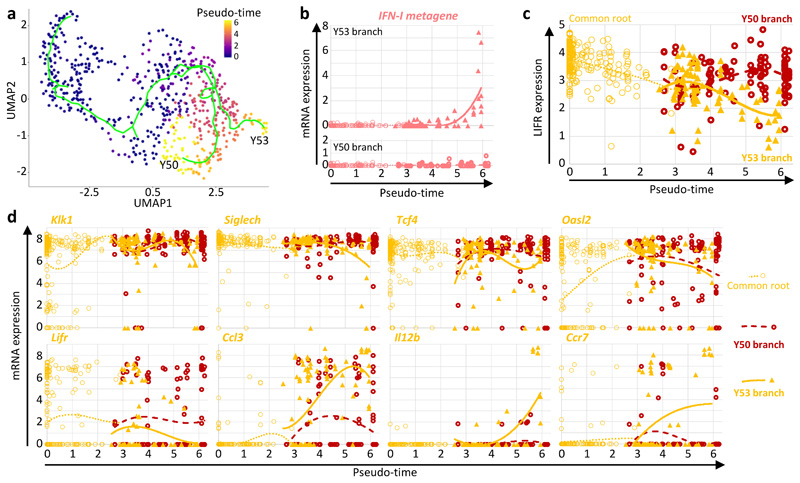
We attempted characterizing by scRNAseq the activation trajectory of splenic pDCs from 36h MCMV-infected WT C57BL/6 mice, upon harnessing LIFR downregulation to enrich the pDCs engaged in IFN-I production. We used a different method for library preparation, FB5P-seq41, that overcomes the throughput limitations of SS2, while keeping a better sensitivity for low copy number gene detection than high-throughput droplet-based methods. We index-sorted and analyzed 188 pDCs from one uninfected mouse, and 468 pDCs from a 36h infected animal split in 2/3 LIFRhi and 1/3 LIFRlo pDCs (FB5P C57BL/6 dataset, Extended Data Fig. 4). Monocle analysis resulted in a pDC activation trajectory bifurcating in two main branches, Y53 and Y50. The Y53 branch ended with IFN-I-expressing pDCs and harbored a stronger downregulation of LIFR shortly after its bifurcation from the Y50 branch (Extended Data Fig. 4a-c). The gene expression pattern of the IFN-I-producing pDCs from WT C57BL/6 mice was very similar to that observed in Ifnb1Eyfp mice, with an early induction of Ccl3 preceding that of the IFN-I genes, whereas Il12b and Ccr7 expression were maximal at late pseudo-times (Extended Data Fig. 4b,d).
In conclusion, three independent methods based on distinct information and different methodologies, flow cytometry, Monocle and Velocyto, converged onto the same pDC activation trajectory during infection, both in Ifnb1Eyfp reporter and WT mice, with Ccl3 and Tnf initial induction preceding the transient expression of IFN-I genes that was followed by prolonged Il12 expression and late Ccr7 induction.
An independent kinetic scRNAseq dataset confirms and extends the pDC activation trajectory
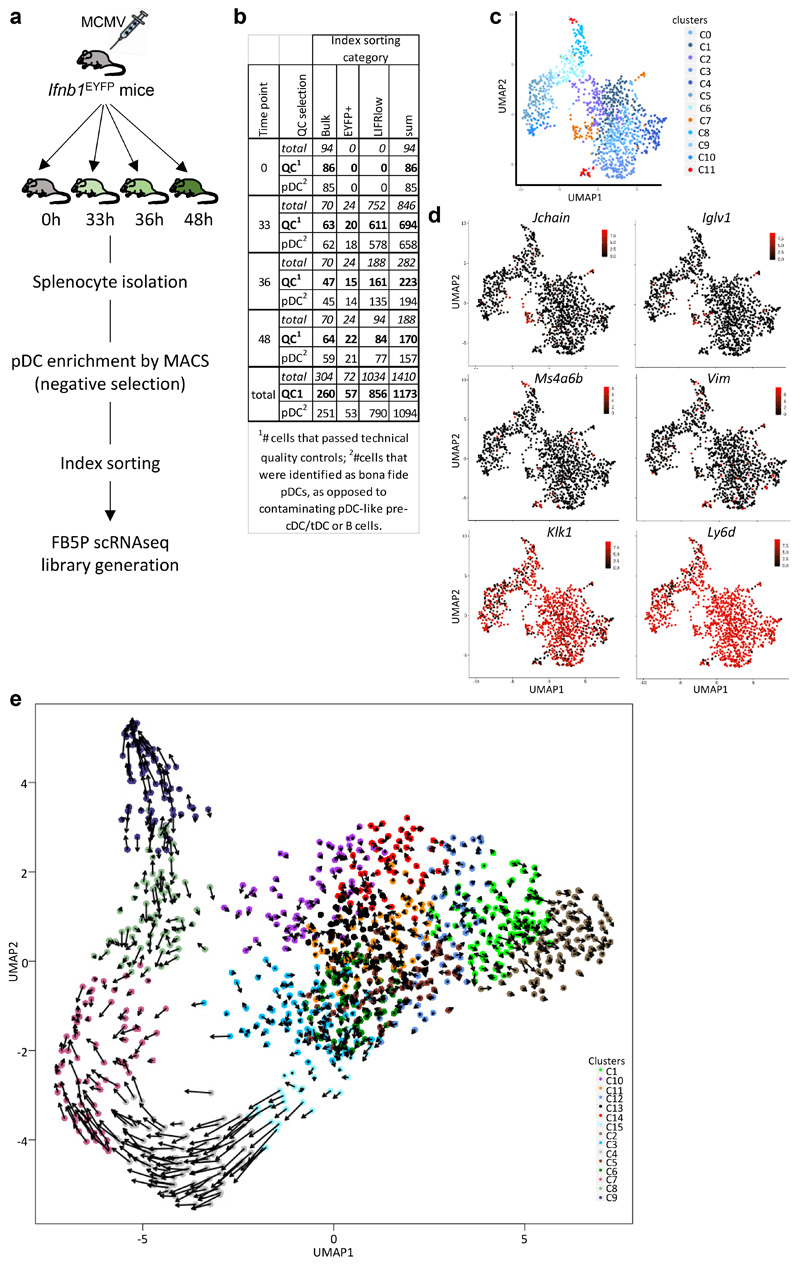
To reinforce our results, we performed another scRNAseq experiment using pDCs harvested at different times after infection: 0h, 33h, 36h and 48h (FB5P kinetic dataset). We surmised that using LIFR downregulation on pDCs from WT animals may not guarantee sufficiently unbiased and efficient sampling of the different pDC activation states for robust inference of their activation trajectories. Therefore, we used Ifnb1Eyfp mice. Total pDCs were sorted at 0h. For the other time points, we sorted LIFRlo pDCs for enriching cells engaged in IFN-I production, as well as YFP+ and bulk pDCs (Extended Data Fig. 5a-b). We removed contaminating pDC-like and B cells (Extended Data Fig. 5b-d).
Monocle identified 15 pDC clusters (Fig. 4h) and inferred an activation trajectory encompassing 4 branches (Fig. 4i). The pDCs from the uninfected mouse and most of those from the 48h infected animal were at opposite ends of the longest branch, whereas the pDCs from 33h and 36h infected animals were spread in-between (Fig. 4i-j). The pseudo-time analysis for this dataset confirmed the progression of pDC activation from “early” (cluster 15, Eyfp +YFP–) to “peak” (clusters 4, Eyfp hiYFP+ and 7, Eyfp hiYFPhi) to “late” (clusters 8, Eyfp loYFPhi and 9, Eyfp –YFPhi) states (Fig. 4k). IFN-I transcription started around pseudo-time 25, preceding detectable YFP expression, and stopped around pseudo-time 35 (Fig. 4l) at the transition from C7 to C8 (Fig. 4k), whereas YFP remained expressed at high levels until late pseudo-times in C8 and C9 (Fig. 4k-l). The activation state inferred as the initiation phase of IFN-I production (C15) was more represented in pDCs harvested at the earliest time points after infection (33h and 36h) and had disappeared at 48h (Fig. 4m). Conversely, the late activation states corresponding to post-IFN-I production (C8 and C9) were absent at 33h and increased at the latest time points (Fig. 4m).
Velocyto confirmed in part the trajectory inferred from Monocle (C15, Eyfp +YFP– → C4, Eyfp hiYFP+ → C7, Eyfp hiYFPhi), as well as C9 as one endpoint of pDC activation (Extended Data Fig. 5e). Results were less clear for the relationships between C7, C8 and C9. However, computing Jaccard indexes to determine equivalencies between the pDC clusters of the FB5P kinetic dataset and SS2 dataset#2 showed good consistency (Fig. 4n). Consistent with its late pseudo-time and detection only at 48h post-infection, the FB5P C9 Eyfp –YFPhi pDC cluster did not strongly overlap with a specific 36h SS2 cluster (Fig. 4m).
In summary, this kinetic analysis confirmed and extended the interpretation drawn from the 36h dataset, showing that, upon commitment to IFN-I production, individual pDCs sequentially underwent 5 distinct activate states: Eyfp –/loYFP– (FB5P C15, SS2 C8) → Eyfp hiYFP–/int (FB5P C4, SS2 C5)→ Eyfp hiYFPhi (FB5P C7, SS2 C6) → Eyfplo/ –YFPhi (FB5P C8, SS2 C7)→ Eyfp –YFPhi (FB5P C9).
IFN−YFP+ end-matured pDCs transcriptionally converge towards tDCs
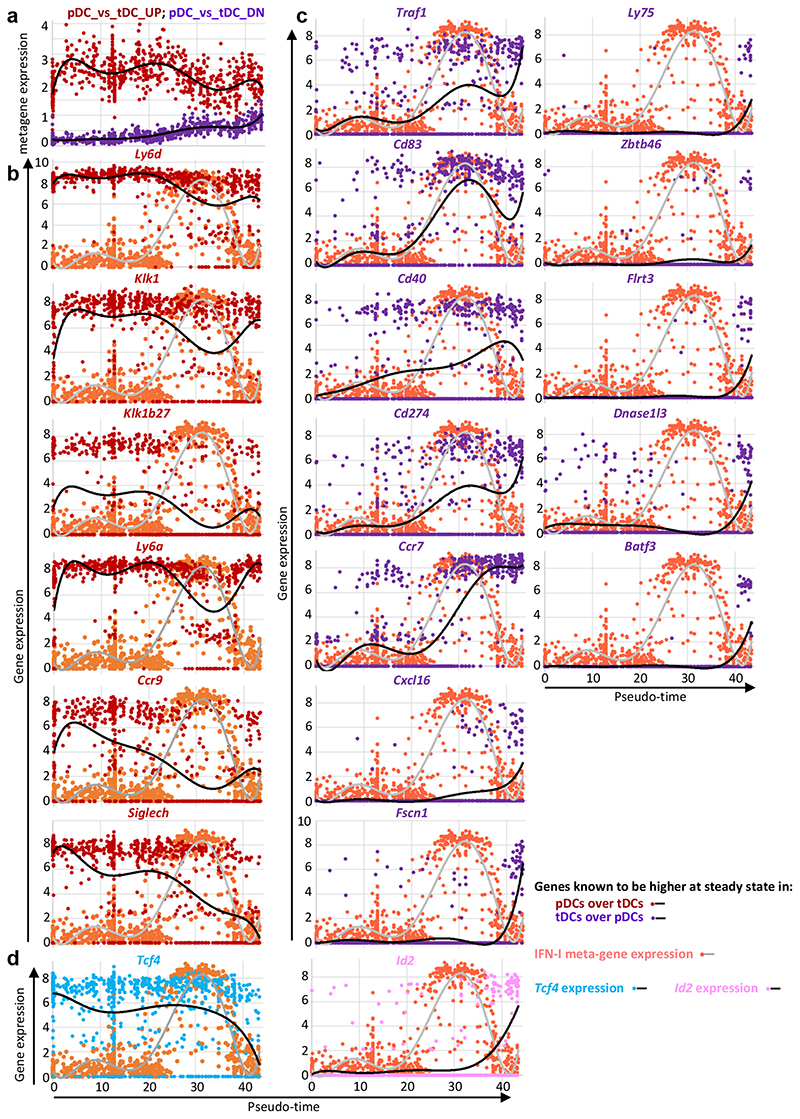
We examined in the FB5P kinetic dataset the expression along pseudo-time of genes known to be expressed at steady state to higher levels in pDCs over tDCs (“pDC-versus-tDC_UP” meta-gene) or conversely (“pDC-versus-tDC_DN” meta-gene). The latest IFN−YFP+ pDC activation state (FB5P C9, “end-matured”) transcriptionally converged towards tDCs (Fig. 5a). However, all pDCs expressed the pDC meta-gene at a higher level than the tDC meta-gene (Fig. 5a), and maintained a distinctive expression of pDC signature genes including Ly6d, Ly6a, Klk1, Klk1b27, and Ccr9 to some extent (Fig. 5b). Some pDC-like cell or tDC genes were induced to high levels in a sizeable fraction of end-matured pDCs (Fig. 5c), which also harbored a decreased Tcf4 and increased Id2 expression (Fig. 5d). Hence, the end-matured pDCs did not convert into pDC-like cells/tDCs. Rather, the pDCs engaged into IFN-I production progressively converged transcriptionally toward tDCs/cDCs, already starting at the time of their peak IFN-I production.
Fig. 5. Transcriptional convergence of pDCs towards tDCs over pseudo-time.
a, Meta-gene expression levels (y-axis) along pseudo-time (x-axis), in the FB5P kinetic dataset, for genes higher in steady state pDCs over tDCs (pDC_versus_tDC_UP gene set, dark red dots and upper black curve) and for the genes lower in steady state pDCs as compared to tDCs (pDC_versus_tDC_DN gene set, violet dots and lower black curve). Individual cells are shown as dots and a polynomial curve was fit to the data. The gene sets were generated by reanalyzing public data (GEO Series GSE76132, see Supplementary Data 2). b, Expression level along pseudo-time of representative individual genes of the pDC_versus_tDC_UP gene set. c, Expression level along pseudo-time of representative individual genes of the pDC_versus_tDC_DN gene set. d, Expression level along pseudo-time of the pDC master transcription factor Tcf4 (blue dots and black curve) and of its counter-regulated cDC1 master transcription factor Id2 (pink dots and black curve). The expression of the IFN-I meta-gene is shown on each graph for comparison (pale red dots and gray curve).
GSEA-based inference of the molecular regulation and functional specialization of pDC activation states
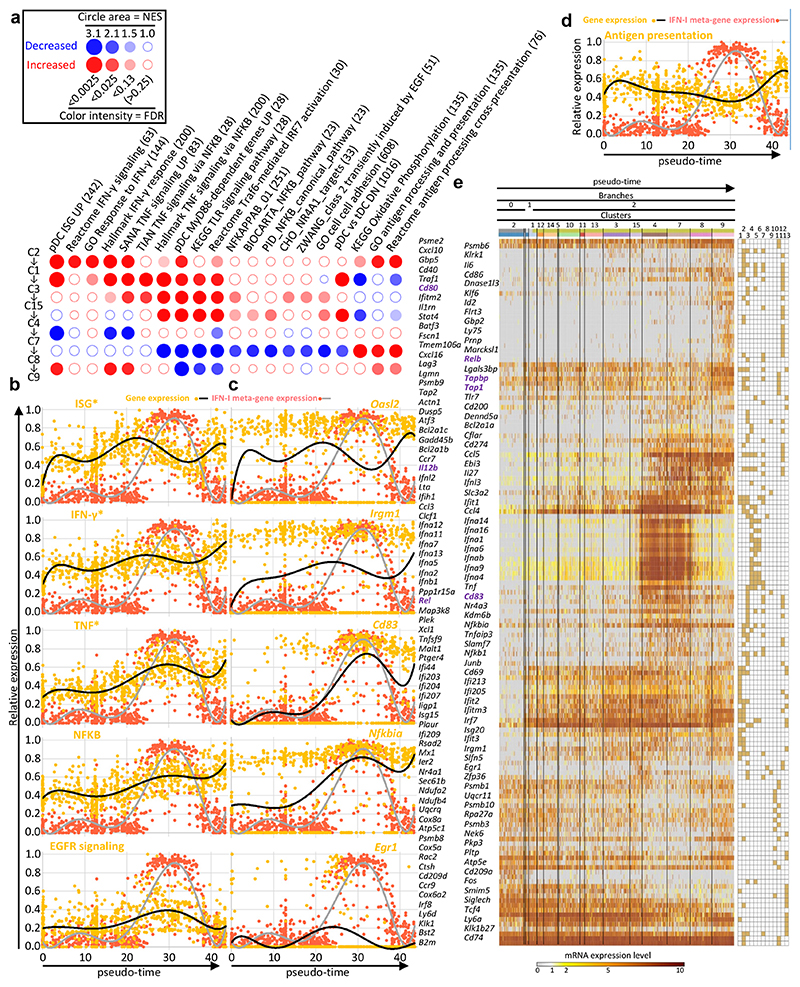
We performed a Gene Set Enrichment Analysis (GSEA) using BubbleGUM42, to identify candidate biological processes or upstream regulators associated to gene modules induced or repressed in the FB5P kinetic dataset along the pDC activation trajectory (Fig. 6a). The expression of selected meta-genes (Fig 6b) and of one of their representative genes (Fig. 6c, e) were plotted along pseudo-time. Egr1 was selectively expressed in C15, with a transient induction around pseudo-time 25 (Fig. 6c), consistent with its pattern of expression in the SS2 dataset#2 (Fig. 4g). ISG were induced strongly early on, around pseudo-time 5 (cluster C1), followed by a further increase centered around pseudo-time 20 (C3), a decrease most pronounced around pseudo-time 35 (C7), and a late re-expression (C8 and C9), as illustrated with Oasl2 (Fig. 6c). A similar expression pattern was observed for the genes induced by IFN-γ (Fig. 6a-c, e). The genes associated with TNF and NF-κB signaling also followed an induction pattern in three waves, but with a delayed central wave reaching its peak immediately before maximal expression of IFN-I genes, around pseudo-time 25 (C15) (Fig. 6a-c, e). This suggested that TNF signaling through NF-κB might be one of the early signals that pDCs need to receive together with TLR9 triggering to become high IFN-I producers. The last wave of TNF response encompassed genes associated with antigen processing and presentation, including Cd83 (Fig. 6c), Cd80, Il12b, Relb, Rel, Tap1 and Tapbp (Fig. 6e, bold violet names). This implied that TNF could be involved later in shutting off IFN-I production by pDCs and promoting their end maturation, as previously reported for human pDCs4, 17, 43.
Fig. 6. Identification of annotated gene modules regulated along pseudo-time during pDC activation.
a, BubbleMap showing the gene sets with the most relevant and significant enrichment patterns along the pseudo-time of pDC activation trajectory. Dark red bubbles represent significant increased expression of the gene set (columns) across two consecutive pDC clusters along pseudo-time (rows). Dark blue bubbles represent significant decreased expression. Empty bubbles correspond to lack of significant differences in gene set expression between the pDC clusters compared. Hence, the expression pattern of each gene set along pseudo-time is visualized as a vertical succession of red or blue bubbles. b,c Normalized expression level (y-axis) along pseudo-time (x-axis) of the meta-genes corresponding to the selected gene sets (left) and of one of their representative genes (right) (pale orange dots and black curves). The expression of the IFN-I meta-gene is shown on each graph for comparison (pale red dots and gray curve). d, Normalized expression level (y-axis) along pseudo-time (x-axis) of the metagene corresponding to the antigen presentation gene set, vs the IFN-I meta-gene. e, Heatmap showing the expression patterns along pseudo-time of individual genes selected from the analysis illustrated on panel (a), with hierarchical clustering of the genes using one minus Pearson correlation as distance metric. Belonging of the genes to the gene sets illustrated in a-c is shown in the grid on the right of the heatmap, with gene set 1, ISG; 2, IFN-γ responsive genes; 3, TNF signaling pathway and responsive genes; 4, pDC Myd88-dependent genes UP; 5, KEGG TLR signaling pathway; 6, Reactome Traf6-mediated IRF7 activation; 7, NFKB signaling pathways and responsive genes; 8, Zwang class 2 transiently induced by EGF; 9, CHO NR4A1 targets; 10, KEGG Oxidative phosphorylation; 11, GO antigen processing and presentation; 12, pDC_versus_tDC_DN; 13, pDC_versus_tDC_UP.
The expression of gene modules associated with antigen processing and presentation decreased progressively from early pseudo-time, until minimal expression coinciding with peak expression of the IFN-I genes, followed by a sharp increase at late pseudo-time (Fig. 6a, d-e). This is consistent with the transcriptomic convergence of end-matured pDCs with tDCs/cDCs (Fig. 5). Genes contributing to oxidative phosphorylation followed the same expression pattern (Fig. 6a, e), suggesting different metabolic regulation of IFN-I production versus cognate interaction with T cells in pDCs.
Cell-intrinsic TNF signaling promotes IFN-I production by pDCs
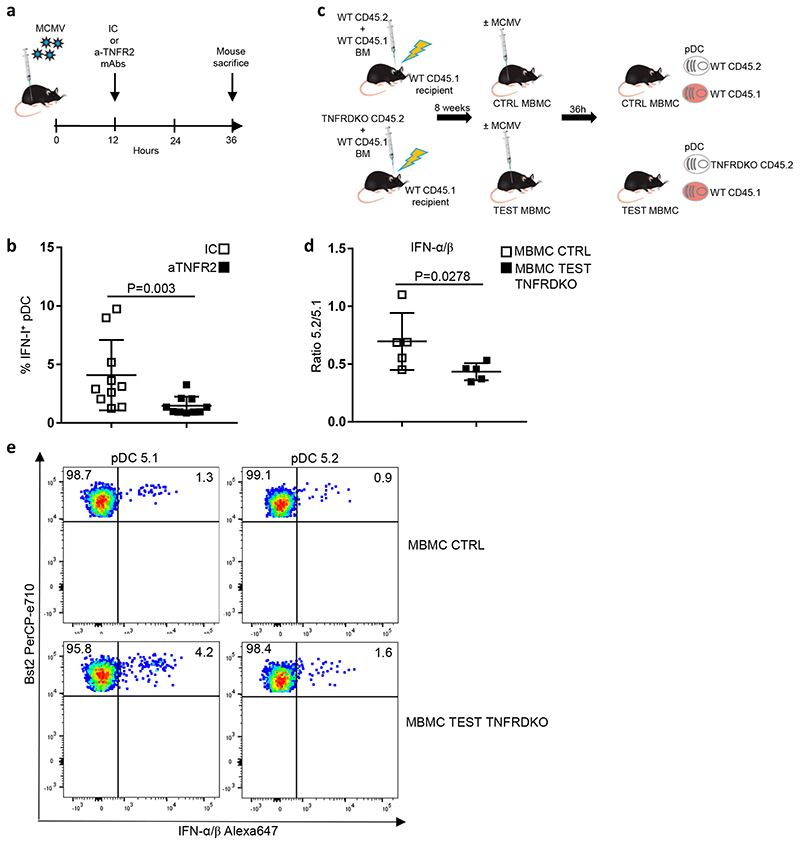
Because Tnf expression and transcriptomic responses to TNF were induced in pDCs earlier than IFN-I genes, we tested whether TNF activity promoted pDC IFN-I production. In vivo antibody blockade of the TNF receptor did significantly reduce the frequency of IFN-I+ pDCs at 36h post-infection (Fig. 7a-b). To test whether this process was due to cell-intrinsic TNF responses in pDCs, we examined IFN-I production in CD45.1 versus CD45.2 pDCs from CD45.1+ WT: CD45.2+ WT versus CD45.1+ WT: CD45.2+ Tnfr1 –/– Tnfr2 −/− (TNFRDKO) mixed bone marrow chimera mice infected with MCMV (Fig. 7c-d). We observed a significant decrease in the CD45.2+ to CD45.1+ ratio within IFN-I+ pDCs in the TNFRDKO MBMC mice as compared to their CTRL counterparts (Fig. 7d). Thus, cell-intrinsic TNF signaling is necessary for optimal IFN-I production by pDCs.
Fig. 7. Cell-intrinsic TNF signaling promotes pDC IFN-I production.
a, Experimental protocol followed to evaluate the role of TNF signaling in pDC activation during MCMV infection. b, Percentages of IFN+ cells in splenic pDCs isolated from isotype control (IC)-treated animals vs anti-TNFR2-treated mice. The data are shown for 10 individual animals pooled from 2 independent experiments, with overlay of mean±s.e.m. values. c, Generation of mixed bone marrow chimera (MBMC) mice; CTR, control. Recipient C57BL/6 CD45.1 (5.1) mice were lethally irradiated and then reconstituted with equal proportions of bone marrow (BM) cells isolated from WT 5.1 mice and from indicated CD45.2 (5.2) mice, either WT for CTR MBMC mice or TNFR1/2-KO (TNFRDKO) for TEST MBMC animals. Reconstituted MBMC mice were infected by MCMV and their splenic pDCs examined ex vivo for IFN-I production. d, Measuring the cell-intrinsic role of TNF signaling in promoting pDC IFN-I production. Results are expressed as 5.2/5.1 ratio of the percentages of IFN-I-producing pDCs obtained from MCMV-infected CTR WT versus TEST TNFRDKO MBMC mice. The data are shown for 5 individual animals for each type of MBMC mice, pooled from 2 independent experiments, with overlay of mean±s.e.m. values. For b and d, the statistical analysis was performed using one-sided Mann-Whitney U test. e, Dot plots show representative data of intracellular IFN-I staining in 5.2+ versus 5.1+ pDCs isolated from the indicated MCMV-infected MBMC mice.
YFP+CCR7+ pDCs harbor phenotypic and functional features of mature DCs
Our scRNAseq data suggested sequential induction in single pDCs first of IFN-I genes, transiently, and then of genes modules associated with antigen processing and presentation or transcriptional convergence towards tDCs. We thus analyzed the phenotype, functions and anatomical location of the early, peak and late IFN-I-producing pDC activation states, to investigate their abilities to activate T lymphocytes.
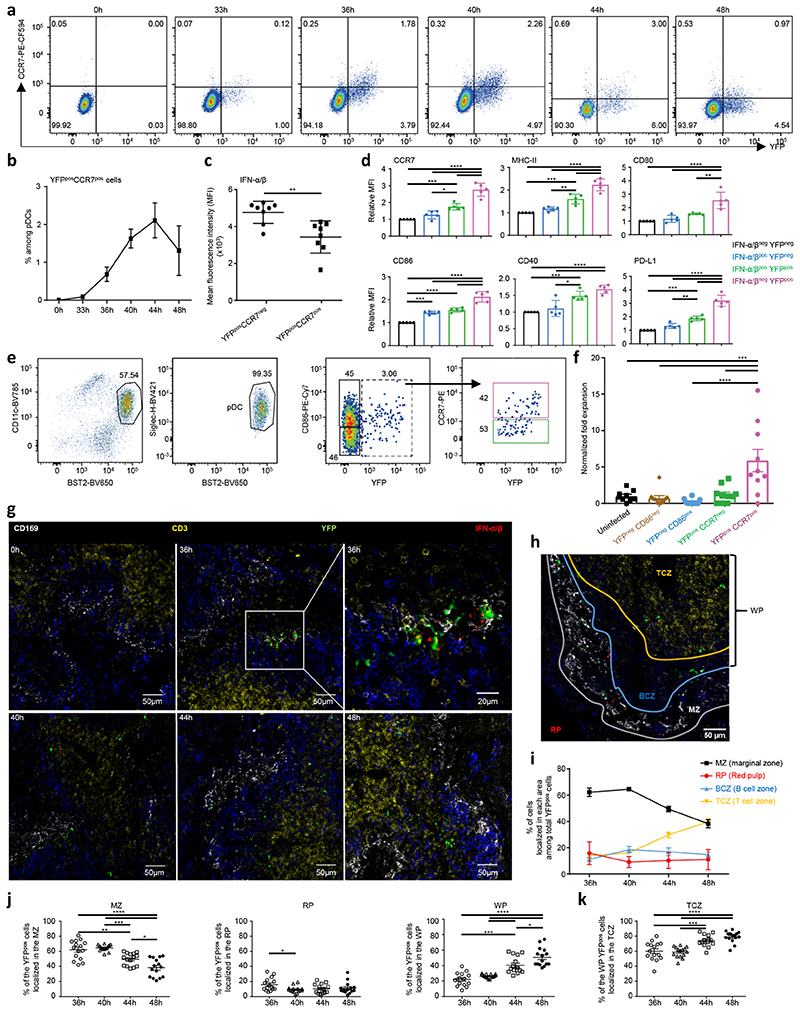
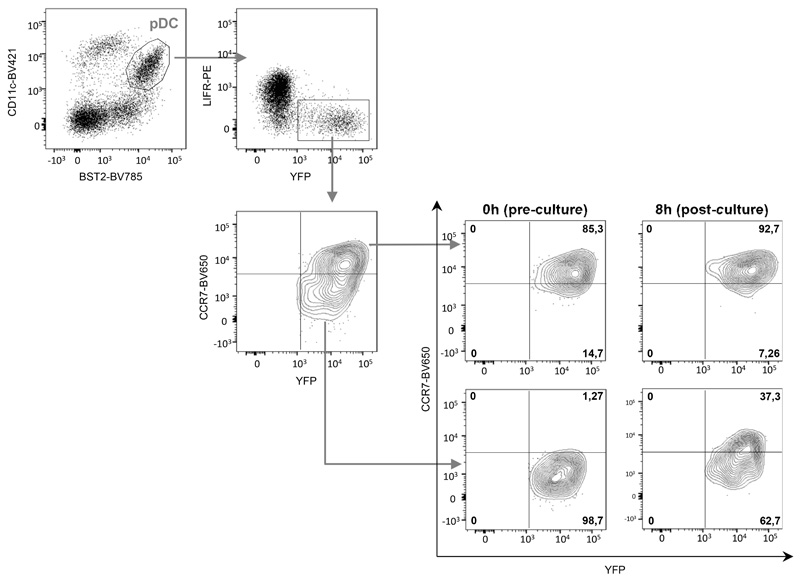
A fraction of YFP+ pDCs transiently upregulated CCR7 between 36h and 44h after MCMV infection (Fig. 8a-b), corresponding mostly to cells that were terminating or had stopped IFN-I production (Fig. 8c). Since CCR7 in DCs promotes their migration to the T cell zones of secondary lymphoid organs for T cell activation, we compared the expression of T cell regulatory signals by steady state pDCs and by the three final activation states of the pDCs engaged in IFN-I production in 36h infected mice (Fig. 8d). CCR7 expression was significantly higher on IFN-I−YFP+ pDCs than on IFN-I−YFP−, IFN-I+YFP− and IFN-I+YFP+ pDCs. We sorted YFP–, YFP+ CCR7–, and YFP+ CCR7+ pDCs from 36h infected Ifnb1Eyfp mice, cultured them for 8h ex vivo in feeder CD45.1 bone marrow FLT3-L cultures and assessed whether their phenotype changed (Extended Data Fig. 6). All of the YFP+ CCR7– pDCs increased their expression of CCR7, with 37% becoming strongly positive, whereas YFP+ CCR7+ pDCs maintained a stable phenotype. A very small proportion of the YFP– pDCs became YFP+. Thus, this experiment confirmed the transition from YFP+ CCR7– to YFP+ CCR7+ pDC activation states, and the lack of reverse transition. The YFP+ CCR7+ pDCs also expressed higher levels of MHC-II, CD80, CD86, CD40 and PD-L1 (Fig. 8d). Hence, after termination of their IFN-I secretion, pDCs likely acquire the ability to engage CD4 T cells in an antigen-specific manner, by up-regulating the three signals required for this function.
Fig. 8. Characterization of the phenotype, function and micro-anatomical location of pDC activation states.
a, YFP vs CCR7 expression in splenic pDCs during MCMV infection. Data from one representative Ifnb1Eyfp mouse is shown for each time points. b, Frequency of YFP+CCR7+ cells within splenic pDCs during MCMV infection. The data represent individual mice with n = 5 at 0h, 7 at 33h, 10 at 36h, 5 at 40h, and 3 at 44h and 48h, from one experiment for 44h and 48h, and pooled from 2 (resp. 3) independent experiments for 33h and 40h (resp. 0h and 36h). c, Mean fluorescence intensity of IFN-α/β on YFP+CCR7+ vs YFP+CCR7− pDCs isolated from 36h MCMV-infected mice. d, Relative median fluorescence intensity (MFI) of indicated markers on pDC subpopulations isolated from 36h MCMV-infected Ifnb1Eyfp mice. The data in c and d are from n = 10 (resp. 5) mice from two independent experiments (c) or one experiment representative of two (d). e, Flow cytometry sorting strategy for splenic pDC subpopulations from uninfected (UN) or 38h MCMV-infected Ifnb1Eyfp mice, starting from live single CD11bneg Linneg cells. f, Expansion of naïve CD4 OT-II cells upon co-culture with the indicated OVA peptide-pulsed pDC subpopulations. The graph shows individual data points pooled from 3 independent experiments, each with 2-4 replicate co-cultures for each pDC subpopulation. g, Immunohistological analysis of spleen sections from uninfected (UN) or MCMV-infected Ifnb1Eyfp mice harvested at the indicated time points. Top right image, 5x zoom of the region delimited in the previous image. h, Definition of spleen zones for cell quantification (see online methods). i, Distribution of YFP+ cells across the different spleen zones during the course of MCMV infection. j, Detail of the individual data collected and used for generating the graph of panel I. k, A similar analysis was performed as in panel (j) for the percentages of WP YFP+ pDCs residing in the TCZ. For g-k, data were analyzed from 3 different mice, with 5 different whole splenic sections per mouse (i.e. 15 images per time point). In b-d,f,i-k, data are shown as mean±s.e.m. and P values are from One-way ANOVA with Tukey’s post hoc test, with *p<0.05, **p<0.01, ***p<0.001, ***p<0.0001.
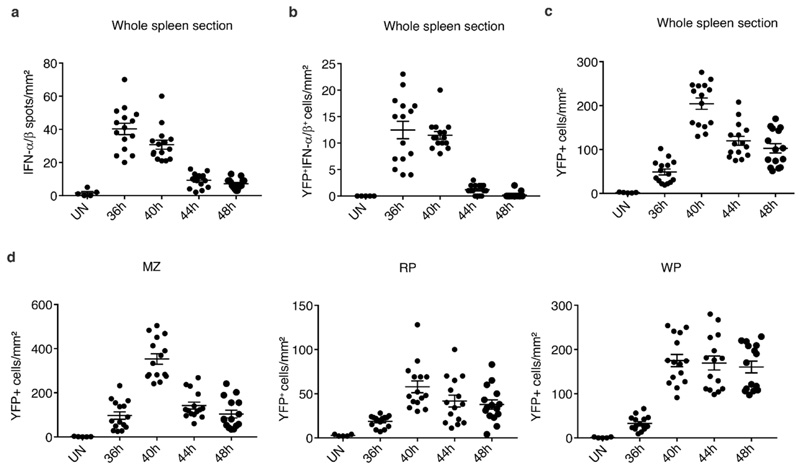
We assessed the ability of different pDC activation states to induce the proliferation of CD4 T cells in an antigen-specific manner, as compared to pDCs from uninfected mice that are quite limited in this function. As CCR7 was upregulated preferentially on IFN-I−YFP+ pDCs (Fig. 8c), as a surrogate purification strategy for this activation state we sorted YFP+CCR7+ pDCs from 38h MCMV-infected mice. We sorted in parallel YFP−CD86−, YFP−CD86+ and YFP+CCR7− pDCs (Fig. 8e). YFP+CCR7+ pDCs were the only population harboring a significant higher ability for CD4 T cell activation than pDCs from uninfected mice (Fig. 8f). We evaluated by confocal microscopy whether and when pDCs migrated in the T cell area of the spleen of MCMV-infected mice. At 36h post-infection, splenic YFP+ cells were in a large part IFN-I+ (Fig. 8g and Extended Data Fig. 7a-c), and mainly located in the marginal zone (Fig. 8g-j and Extended Data Fig. 7d) as previously published3, 22. In contrast, at 48h, splenic YFP+ cells were mostly IFN− and located in the T cell zone (Fig. 8g-k and Extended Data Fig. 7d). Hence, our scRNASeq, flow cytometry, functional and microscopy data converge towards the conclusion: during MCMV infection, after having produced IFN-I, pDCs undergo further activation promoting their cognate interactions with CD4 T cells. Our study therefore supports a novel model of the molecular and spatiotemporal regulation of pDC functions during viral infections (Extended Data Fig. 8).
Discussion
It has been claimed that pDCs only produce IFN-I, because the pDC-like cells or tDCs that can contaminate them fully accounted for their antigen presentation8–15. However, under proper stimulation conditions, bona fide pDCs can exert both functions16, 17. Different models have attempted to explain how. First, pDC functional plasticity could be developmental, with prominent IFN-I production by bone marrow pDC precursors, before their terminal differentiation inducing their egress to the periphery and switch to antigen presentation18. Alternately, pDC functional plasticity could be instructed by stimulation. IFN-I production versus antigen presentation could be induced in pDCs by distinct, eventually antagonist, stimuli44, or reflect the induction of a division of labor by a single stimulus. Indeed, in vitro exposure to the influenza virus can instruct initially identical human pDCs to diversify into distinct and non-interconvertible activation states, with some pDCs producing IFN-I and others presenting antigens17. Finally, antigen presentation by pDCs was proposed to result from their cell fate conversion into cDC-like cells/tDCs19, 20, 45, due to an activation-induced inversion of their Tcf4/Id2 expression ratio. However, the studies supporting these models were performed in vitro or upon genetic inactivation of Tcf4, and under conditions unable to assess dynamically the fate of individual pDCs. Rigorously characterizing pDC functional plasticity and cell fate during viral infections in vivo thus remains an important challenge19, 20, which we addressed by combining fate-mapping of individual pDCs for IFN-I production with flow cytometry, scRNAseq, immunohistological imaging and an ex vivo assay for CD4 T cell priming.
We identified different pDC activation states during MCMV infection and deciphered their relationships, showing that the same individual pDCs first produce IFN-I and then activate T cells in the spleen of infected mice, contrary to what was proposed in the previous models of pDC plasticity discussed above.
Steady state pDCs were transcriptionally homogeneous, as previously reported9, 11, 14, 46. Thus, it is unlikely that the minor pDC fraction producing IFN-I upon activation corresponds to a distinct subset already primed for this function at steady state, at least not in a manner detectable transcriptionally.
A recent study reported the gene expression profiles and anatomical locations of YFP+ versus YFP− pDCs from CpG-injected Ifnb1Eyfp mice47. YFP+ pDCs upregulated CCR7, were located in the T cell zone and strongly expressed genes coding for T cell-activating cytokines. Hence, professional IFN-I-producing cells were proposed to be a distinct and polyfunctional pDC subset, specialized in simultaneously producing many cytokines, in lymphoid organ T cell zones, to coordinate innate and adaptive cellular immunity47. However, this study was performed at bulk level and only at one time point, preventing any definite conclusion on gene co-expression in single pDCs and on their ability to simultaneously perform different functions. In contrast, here we show that the YFP− and YFP+ pDC populations are both heterogeneous, encompassing distinct activation states, and that, in vivo during MCMV infection, IFN-I production by pDCs is dissociated in time and space from their acquisition of the ability to interact with T cells in a cognate manner.
We identified LIFR downregulation as a novel phenotypic marker of pDC commitment to IFN-I production. LIFR is specifically expressed by pDCs and can inhibit their IFN-I production48. Hence, the failure of most pDCs to strongly downregulate LIFR during infection may contribute inhibiting their IFN-I production.
Pseudo-time analysis identified gene modules dynamically regulated along the pDC activation trajectory. Genes in the TNF-to-NFKB signaling pathway were induced early during pDC commitment to IFN-I production, consistent with the cell-intrinsic role of Ikbkb in promoting this function22 and suggesting that it occurs in part downstream to TNF stimulation which we proved experimentally. Yet, IFN-I and TNF play antagonistic roles in health and disease43. Autocrine TNF production by human pDCs in vitro does not impede their simultaneous production of IFN-I, whereas exposure to exogenous TNF prior to TLR triggering does43. TNF promotes pDC maturation4, 17, 43, which is tightly associated with IFN-I production shutdown, as reported on bulk pDCs44 and here at the single-cell level. We observed three consecutive waves of TNF responses in pDCs during infection. The last wave correlated with the induction in pDCs of genes associated to antigen processing and presentation. Hence, TNF may play different roles on pDCs depending on its origin, concentration and timing of delivery as compared to that of other signals. We identified transient Egr1 induction, and shutdown of oxidative phosphorylation, as candidate mechanisms for the induction and termination of pDC IFN-I production, respectively. Further studies are warranted to test these hypotheses.
Unexpectedly19, 49, pDCs did not die early after termination of their IFN-I production. They survived for over 12 hours, producing IL-12, upregulating CCR7 and acquiring the ability to activate naïve CD4+ T cells. We identified a novel end-mature state of activated pDCs, resulting from a progressive transcriptional convergence towards tDCs, which started at the state of peak IFN-I production and occurred in parallel to an inversion of the Tcf4/Id2 expression ratio. This physiological observation is reminiscent of the acquisition of cDC features caused in pDCs by their genetic inactivation for Tcf4 50. However, end-matured pDCs maintained a clear imprint of their lineage identity, rather than undergoing the proposed cell fate conversion into tDCs45.
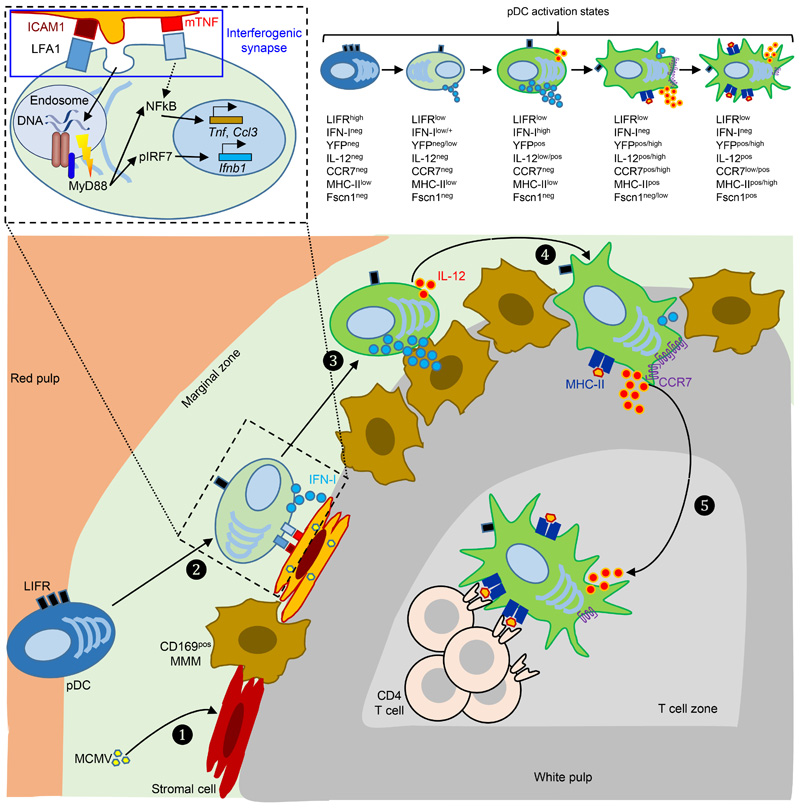
In conclusion, our study uncovered the dynamic activation trajectory of pDCs during MCMV infection in vivo, leading us to propose a novel model of the functional plasticity of pDCs, explaining how individual pDCs exert different functions in a manner tightly orchestrated in time and space. IFN-I production is exerted first, transiently, at the site of virus replication in the marginal zone of the spleen, whereas antigen presentation occurs later, after a further activation of pDCs leading to their transcriptional, phenotypic and functional convergence towards tDCs, including their migration to the splenic T cell zone. Future work will examine whether similar pDC activation trajectories occur during other systemic viral infections, including in primates. Once suitable mouse models have been generated21, it will be possible to assess the importance of antigen presentation by pDCs for shaping antiviral adaptive immunity.
On-line methods
Mice
C57BL/6 and BALB/c mice were purchased from Janvier, France. Congenic CD45.1 C57BL/6 mice were purchased from Charles River, Italy. All other mouse strains were bred at the Centre d’ImmunoPhénomique (CIPHE) or the Centre d’Immunologie de Marseille-Luminy (CIML), Marseille, France, under specific pathogen free-conditions and in accordance with animal care and use regulations. Ifnb1 Eyfp (B6.129-Ifnb1tm1Lky) mice25 were purchased from Jackson Laboratories, USA. Tnfr1 –/– Tnfr2 −/− (B6.129S-Tnfrsf1atm1Imx;Tnfrsf1btm1Imx/J, TNFRDKO) were provided by J-.L.D. All animals used were age-matched females (8 to 12 weeks old unless specified otherwise). The animal care and use protocols were designed in accordance with national and international laws for laboratory animal welfare and experimentation (EEC Council Directive 2010/63/EU, September 2010). They were approved by the Marseille Ethical Committee for Animal Experimentation (registered by the Comité National de Réflexion Ethique sur l’Expérimentation Animale under no. 14; authorization #11–09/09/2011 and APAFIS#1212-2015072117438525 v5).
Virus
Virus stocks were prepared from salivary gland extracts of 3-weeks old MCMV-infected BALB/c mice. All mice used in the experiments were infected i.p. with 105 pfu Smith MCMV and sacrificed at indicated time points.
In vivo treatment with blocking antibodies
To block TNFR2, mice were injected i.p. 24 hrs before sacrifice with 0.5 mg of Armenian Hamster IgG (isotype control) or of anti-TNFR2 mAbs (both from BioXCell).
Generation of Mixed Bone Marrow Chimera (MBMC) mice
Congenic CD45.1 mice were 7 Gy irradiated, then reconstituted with equal proportions of BM cells derived from CD45.1 animals and from CD45.2 mice either wild type (WT) or deficient for the indicated genes. Mice were used at least 8 weeks after BM reconstitution.
Cell preparation, flow cytometry analysis and cell sorting
Spleens were harvested and submitted to enzymatic digestion for 25 minutes at 37°C with Collagenase IV (Wortington biochemicals) and DNAse I (Roche Diagnostics), in the presence of Brefeldin A (10 μg/ml, Sigma-Aldrich) when intracellular cytokine staining was required. Red blood cells were then lysed by using RBC lysis buffer (Life Technologies), and pDCs were enriched with the mouse plasmacytoid dendritic cell isolation kit (Miltenyi Biotech, France). Extracellular staining with BV650 anti-BST2 (or alternatively with PerCP-eF710 anti-BST2), Alexa700 anti-CD3e, APC-Cy7 anti-CD11b, Alexa700 anti-Ly-6G, Alexa700 anti-NK1.1, Alexa700 anti-CD19 and BV421 anti-CD11c (or alternatively with BV785 anti-CD11c) was performed in PBS 1X supplemented with 2 mM EDTA (Sigma-Aldrich) and 0.5% bovine serum albumin (BSA, H2B, Limoges, France). A complete list of the antibodies with clones and dilutions used for flow cytometry is provided in the Nature Research Reporting Summary. All extracellular stainings were performed for 20 min, at 4°C with the exception of anti-mouse CCR7 mAb which was performed at 37°C. Dead cell staining (LIVE/DEAD™ Fixable Aqua Dead Cell Stain, Life Technologies) was performed in PBS 1X as per the manufacturer’s recommendations. For preservation of the YFP signal in pDC from Ifnb1Eyfp mice treated for intracellular staining, cells were first fixed with PBS 1x containing 2% of formaldehyde solution (Sigma-Aldrich) for 40 min, followed by incubation with Cytofix/Cytoperm (BD Biosciences) for 20 min. Cells were then stained with specific anti-cytokine mAbs diluted in 1x Perm/Wash (BD Biosciences) following the manufacturer’s recommendations. Purified anti-mouse IFN-α (RMMA1) and IFN-β (RMMB1) were purchased from PBL Interferon Source; purified rat IgG was used as isotype control (Jackson Immuno Research); these mAbs were coupled to Alexa647 by using a monoclonal labelling kit (Southern Biotech)22. Samples were acquired on a LSR Fortessa X-20 (BD Biosciences, France) and analyzed with FlowJo software (FlowJo, LLC). For microarray studies, pDCs were sorted to high purity by flow cytometry on a FACS Aria II cell sorter (BD Biosciences, France) and directly collected in RLT buffer (Qiagen) supplemented with 10% β-mercaptoethanol. For SS2 scRNAseq, cells were index sorted on a BD FACS Aria III in 96-well plates, with each well filled with 10μL of lysis buffer (TCL buffer, Qiagen, supplemented with 1% β-mercaptoethanol). For FB5P single-cell RNA sequencing, cells were index sorted on a BD FACS Influx in 96-well plates, with each well filled with 2μl FB5P lysis buffer, as described41.
Generation of FLT3-L bone marrow cultures
Bone marrow cells were isolated from CD45.1 C57BL/6 mice and cultured for 6-7 days at 2 106 cells/ml in 24-well plates in RPMI supplemented with 10% FCS, 1% glutamine (Gibco), 100U/mL Penicillin streptomycin, 1% non-essential amino acids, 1% sodium pyruvate and 0.05 mM β-mercaptoethanol, with a 1/10 dilution of B16-FLT3-L culture supernatant.
Immunohistological analysis
Spleen fragments isolated from uninfected or MCMV-infected Ifnb1EyfP reporter mice were fixed for 2 hours at 4°C with Antigenfix (DiaPath), then washed in phosphate buffer (PB1X: 0.025 M NaH2PO4 and 0.1 M Na2HPO4) for 1 hour, dehydrated in 30% sucrose overnight at 4°C, and embedded in OCT freezing media (Sakura Fineteck). 20μm-thick tissue sections were blocked in PB1X containing 0.5 % saponin, 2% BSA, 2% 2.4G2 supernatant and streptavidin/biotin blocking kit (Vector Laboratories), and first stained in PB1X, 0.5% saponin, containing the following antibodies: rat anti-mouse B220 (BD Bioscience) followed by Alexa546-conjugated goat anti-rat mAb (Molecular probes) and hamster anti-mouse CD3 (BD Bioscience) followed by Alexa594-conjugated goat anti-hamster mAb (Jackson Immunoresearch). Tissue sections were then blocked with 5% rat serum (Jackson Immunoresearch) in PB1X and stained in PB1X, rat serum 5%, 0.5% saponin with the following antibodies: Alexa488-conjugated rabbit anti-GFP/YFP (Thermofisher), biotin rat anti-mouse CD169 (MOMA1, AbCam) followed by eFluor450-conjugated streptavidin (Thermofisher), and Alexa647-conjugated rat anti-mouse IFNα/β (Thermofisher)22. Stained sections were mounted in ProLong Gold antifade reagent (Thermofisher) mixed with SYTOX Blue nucleic acid stain (Thermofisher), acquired on a LSM 880 confocal microscope (Zeiss) and analyzed with ImageJ software. The red pulp (RP) was identified as the zone outside of the external boundary of CD169 staining. The marginal zone (MZ) was delimited between the external boundary of CD169 staining and the external boundary of B220 staining. The white pulp (WP) was identified as the zone included within the external boundary of B220 staining. The T cell zone (TCZ) corresponds to the WP area encompassing CD3 staining, whereas the B cell zone (BCZ) was identified within WP as selectively including B220 staining.
Microarray data generation and analysis
Pooled spleens of uninfected or MCMV-infected mice were used in order to obtain 10,000 cells for each pDC subpopulation, with two independent duplicate samples generated per condition. Total RNA was prepared as described22 and converted to biotinylated double-stranded cDNA targets which were hybridized on GeneChip Mouse Gene 1.0 ST arrays (Affymetrix) that were scanned to extract raw data (.CEL Intensity files). Bioinformatics analyses were performed as previously described51, 52 and specified in Figure legends. Heatmaps were generated using Gene-E (http://www.broadinstitute.org/cancer/software/GENE-E/).
Single-cell RNA sequencing
For SS2 scRNASeq, single cells were sorted into 96-well full-skirted Eppendorf plates chilled to 4°C, prepared with lysis buffer. Single-cell lysates were sealed, vortexed, spun down at 300g at 4°C for 1 min, immediately placed on dry ice and transferred for storage at −80°C. The SS2 protocol31 was performed on single-cells as previously described53. Briefly, plates containing cell lysates were thawed on ice, followed by RNA purification and first strand synthesis. cDNA was then amplified by PCR for 22 cycles and libraries were generated using ¼ of Nextera XT library preparation kit (Illumina) with custom barcodes as described14. Libraries were then pooled equimolarly and sequenced on an Illumina HiSeq 4000 sequencer (paired-end, 50-bp reads). FACS-based 5-prime end single-cell RNAseq (FB5P-seq) was performed as described41.
Single-cell RNA sequencing data analysis
For SS2 scRNAseq, raw FASTQ files were aligned with STAR54 against the GRCM38.94 genome to which the sequence of Eyfp was added as an extra chromosome (see Supplementary text for the Eyfp sequence). Gene-specific read counts were calculated using HTSeq-count55. FB5P sequencing data were processed to generate single-cell UMI counts matrices as described41. The counts matrix was loaded to R, and Seurat56 was used for downstream analyses such as normalization (LogNormalize), shared nearest neighbor graph-based clustering, differential expression analysis and visualization, eventually followed by Monocle57, 58 or Velocyto38 for the inference of the pDC activation trajectory, as summarized in Supplementary Data 1 and described below. Unless specified otherwise, gene expression is shown as log-normalized values and protein expression as inverse hyperbolic arcsine (asinh) of fluorescence intensity raw or scaled values, namely asinh(fluorescence) for SS2 dataset#1, asinh(fluorescence/100) for SS2 dataset#2, and asinh(fluorescence/10) for FB5P datasets. For dimensionality reduction, we performed a uniform manifold approximation and projection (UMAP), using the RunUMAP function. The different clusters were projected on the UMAP plot for visualization. The differentially expressed genes were determined using the FindAllMarkers function. The heatmaps were plotted using the Gene-E program. For some of the datasets, a first analysis was performed to identify and exclude contaminating cells, as summarized in the corresponding Figure legends and in Supplementary Data 1.
Alignment of clusters from the SS2 dataset#2 and the FB5P kinetic dataset
In order to compare the clusters obtained in the SS2 dataset#2 and the FB5P kinetic dataset, we first extracted the marker genes of each cluster for each dataset separately, using the FindMarker function of Seurat, using the “bimod” statistical test and an adjusted p-value cut-off of 0.25. We then computed the Jaccard Indexes (JI) between each cluster of one dataset with any other cluster of the other dataset. The JI measures similarity between finite sample sets, and is defined as the size of the intersection divided by the size of the union of the sample sets: J(A,B) = |A ⋂ B| / |A ⋃ B|. The JI matrix was then used to generate a heatmap with hierarchical clustering, using Gene-E.
Monocle analysis
We used Monocle3 to investigate cell trajectories and the dynamics of gene expression within these trajectories. The cells from the uninfected mouse were set as the root of the trajectory and the input genes were selected using Seurat. We first clustered and projected the cells onto a low-dimensional space (UMAP) calculated either by Monocle or by Seurat. Monocle then resolved the activation trajectories and calculated along them the pseudo-time for each cell. In some cases where several trajectories were found, we exported the branches identified, using the centroid-based principal graph generated by Monocle (https://gist.github.com/mochar/70e67bfba87ceedbd1435b83e6464ba2). Each individual path from the starting point (cells from non-infected mice) to each of the end points of the constructed graphs were retrieved. The expression profile of genes of interest were then projected on the cells of chosen branches. For certain gene modules or gene sets, a meta-gene was defined as the average of log-normalized values of all of its member genes that were included in the Leading Edge of at least one of the GSEA results illustrated in Fig. 6a. The expression of this meta-gene was then plotted, with each cell shown as a dot and a polynomial curve computed to illustrate the trend in dynamical expression change of the gene set along the pseudo-time. When specified, the expression levels of each meta-gene or gene was normalized, to its maximal value, to ease comparison of the temporal evolution of their expression pattern.
RNA velocity analysis
RNA velocity was performed using the Velocyto software. Velocyto predicts the future direction in which cells are moving in the transcriptional space by estimating, for each cell, the time derivative of RNA abundance38. Specifically, it computes the predicted fate of each single cell based on the integration of its precise transcriptional state for hundreds of intron-bearing genes, as assessed by their ratio of unspliced to spliced RNA, in comparison with the other cells. The directionality of the transitions is represented as vectors, whose length is proportional to the velocity of these transitions (longer vectors meaning faster transitions). Annotation of the spliced and unspliced reads was performed using velocyto.py on the SS2 dataset#2 and using DropEst on the FB5P datasets. Only the cells and genes that had been kept in the previous analysis using the Seurat R package were considered in the Velocyto analysis. PCA was performed with pagoda2 (https://github.com/hms-dbmi/pagoda2), with spliced expression matrix as input, and the cell-to-cell distance matrix was calculated using Euclidean distance. RNA velocity was estimated using gene-relative model with k-nearest neighbor cell pooling. The overall pattern generated by projecting the RNA velocities of each individual cell onto the UMAP space enables visualizing the corresponding model of the trajectory.
BubbleGUM analysis
BubbleGUM, a high throughput gene set enrichment analysis (GSEA) software42 was used to assess the enrichment of selected transcriptomic signatures across populations of the microarray data or clusters of the scRNAseq data. BubbleGUM is composed of two modules; i) GeneSign, which generates statistically significant gene signatures and ii) BubbleMap, which automatically assesses the enrichment of input gene signatures between all possible pairs of conditions from independent datasets, based on gene set enrichment analysis (GSEA) methodology59, and which generates an integrated graphical display. To run the final BubbleMap analysis, we used a total of 24 selected gene sets (Supplementary Data 2). These gene sets had been selected from an initial pool of 27 homemade GeneSets and of all of the 17,810 gene sets from the MSigDB (msigdb.v6.2.symbols.gmt), upon iterative runs of GSEA and BubbleGUM analyses to focus the final analysis on the gene sets that yielded significant and meaningful enrichments and were not too redundant with one another. BubbleMap was used with 1,000 gene set permutations, and with “difference of classes” as a metric for ranking the genes since the data were expressed in log scale. The results are displayed as a BubbleMap, where each bubble is a GSEA result and summarizes the information from the corresponding enrichment plot. The color of the Bubble corresponds to the condition from the pairwise comparison in which the signature is enriched. The bubble area is proportional to the GSEA normalized enrichment score (NES). The intensity of the color corresponds to the statistical significance of the enrichment, derived by computing the multiple testing-adjusted permutation-based p-value using the Benjamini–Yekutieli correction.
In vitro T cell activation assay
For each experiment, spleens were isolated from 10 Ifnb1Eyfp mice infected with MCMV 38h before sacrifice. Splenocytes were pooled and submitted to magnetic depletion of Lineage+ cells. pDCs in the negative fraction were identified as live single-cells, CD11b– Lin(CD3,CD19,Ly6G,NK1.1)– CD11cint SiglecH+ BST2hi cells, and sorted as YFP–CD86+, YFP–CD86–, YFP+CCR7– or YFP+CCR7+. Cells were collected into complete RPMI supplemented with 10% FCS, 1% glutamine (Gibco), 100U/mL Penicillin streptomycin, 1% non-essential amino acids, 1% sodium pyruvate and 0.05 mM β-mercaptoethanol. pDCs sorted from uninfected mice were used as controls. Cells were spun down, resuspended in complete RPMI with 5 μg/mL OVA peptide (323-339; H-Ile-Ser-Gln-Ala-Val-His-Ala-Ala-His-Ala-Glu-Ile-Asn-Glu-Ala-Gly-Arg-OH) (Sigma-Aldrich) and plated at 2,000 cells in 100 μL per well in a V-bottom plate for 20 min at 37°C. Naïve CD4+ T cells from Rag2KO x Tg OT-II x B6.Ly5.1 mice were isolated using a naïve CD4+ T cell enrichment kit (Miltenyi Biotec), labeled with 2.5 μM of carboxyfluorescein diacetate succinimidyl ester (CFSE) for 10 min, and blocked for 5 min at RT with 5x volumes of complete RPMI. Cells were spun down and washed once again. 10,000 T cells/50 μL were added to each well containing sorted pDCs. Wells without pDCs were used as negative controls. After 4 days of co-culture, cells were washed in PBS, stained with Live Dead Aqua, APC-Cy7 anti-CD4 and Alexa700 anti-CD3e mAbs. Cells were then resuspended in 75 μL of PBS supplemented with 1 mM EDTA (Sigma-Aldrich) and 0.5 % Bovine Serum Albumin (BSA, H2B). 25 μL of absolute counting beads (Beckman Coulter) were added to each well before acquisition by FACS. The proliferation in the negative control wells (background) was substracted from each condition. For each experiment, the fold expansion was calculated as the number of proliferating cells in each condition divided by the mean number of proliferating cells (3 replicates per experiment) in the wells with pDCs isolated from uninfected mice.
Statistical analyses
All quantifications were performed unblinded. Statistical parameters including the definitions and exact value of n (number of biological replicates and total number of experiments), and the types of the statistical tests are reported in the figures and corresponding figure legends. Statistical analyses were performed using Prism (GraphPad Software) or R statistical programming language. Statistical analysis was conducted on data with at least three biological replicates. Comparisons between groups were planned before statistical testing and target effect sizes were not predetermined. Error bars displayed on graphs represent the mean ± SEM. Statistical significance was defined as *, P<0.05; **, P<0.01; ***, P<0.001; ****, P<0.0001.
Extended Data
Extended Data Fig. 1. Validation of the Ifnb1Eyfp reporter mice to track IFN-I-producing pDCs during MCMV infection.
a, IFN-α/β production by pDCs (blue), pDC-like cells (red) and cDCs (black) at 36h after MCMV infection of Zbtb46GFP reporter mice. Overlaid histograms (bottom right) show CD11c and CD11b expression for the three cell types. The data shown are from one mouse representative of 3 animals from 2 independent experiments. b, YFP expression in pDCs is stable during the biological process examined. Ifnb1 EYFP CD45.2+ mice were infected by MCMV. 36h later, LIFRlo EYFP- or LIFRlo EYFP+ pDCs were sorted by flow cytometry and cultured in vitro for 8h in CD45.1+ feeder FLT3-L bone marrow cultures. YFP expression was monitored by flow cytometry before and after the culture as indicated. The data shown are from one experiment representative of two independent ones. c-g Around 80% of splenic YFP+ cells are bona fide pDCs at all time points examined during MCMV infection. c, cDCs and pDCs were identified following the gating strategy shown. The analysis was performed after selection of live cells and exclusion of Lin+ cells. d, YFP expression was analyzed in indicated splenic DC populations, isolated from 44h MCMV-infected Ifnb1Eyfp mice. e, Ccr9 expression was analyzed in splenic cDC1s (red), cDC2s (green) and pDCs (blue) isolated from 36h (left), 44h (middle) or 48h (right) MCMV-infected Ifnb1Eyfp mice. f, Autofluorescence-YFP+ cells were gated in live splenocytes isolated from 44h MCMV-infected Ifnb1Eyfp mice. The proportions of DCs vs non-DCs (others, grey) in YFP+ cells were analyzed according to the gating strategy shown in (c). g, Summary of the results obtained following the strategy shown in (e) at 36h (left), 44h (middle) and 48h (right) post-infection. For each time point, data (mean ± s.e.m.) are shown for 5 mice from one experiment.
Extended Data Fig. 2. Design and quality control of the SS2 dataset#2.
a, Flow cytometry gating and overall strategy for index sorting of pDCs from one uninfected (UN, top panel) and one 36h MCMV-infected (bottom panel) Ifnb1Eyfp mice, using LIFR and BST2 expression levels to enrich IFN-I− Eyfp + pDCs, for scRNAseq. Numbers in parentheses indicate the total number of cells sorted in each gate. b, t-SNE and cell clustering analysis for the 323 cells that passed quality controls. c, Sorting phenotype projection on the t-SNE space. d, LIFR expression projection on the t-SNE space. Data are expressed as inverse hyperbolic arcsine (asinh) of fluorescence intensity. e, BubbleMap illustrating GSEA results for 8 selected gene sets (columns) in pairwise comparisons between the cell clusters (rows) identified in (b). ND, not determined. f, Heatmap (left) showing mRNA expression levels of representative genes (rows) across the cell clusters (columns) identified in (b). Most of the genes shown were selected due to their contribution to the GSEA results from (e), as informed by the grid on the right of the heatmap where filled cells mean belonging of the gene (row) to a gene set (column). The gene set order and color code on the top of the grid is the same as in panel e. The far right column of the grid (*) corresponds to genes selectively expressed to high levels in plasmocytes. g, Normalized expression of Ccl3 vs the IFN-I meta-gene along pseudo-time. h, Projection on the UMAP space of the predicted induction (red) vs termination (blue) of Ccl3 transcription.
Extended Data Fig. 3. Kinetics of IL-12 production by pDCs during MCMV infection.
a, Frequency (mean ± s.e.m.) of YFP+, IFN+ and IL-12+ pDCs isolated from Ifnb1Eyfp mice at indicated time points after MCMV infection. b, Data from individual animals for the frequencies of IL-12+ and YFP+ cells in pDCs isolated from Ifnb1Eyfp mice at indicated time points, with overlay of mean ± s.e.m. c, Flow cytometry dot plots showing IL-12 vs YFP expression in pDCs isolated from one representative Ifnb1Eyfp mouse for each time point. The data from all panels were analyzed from the same experiments, with 5 mice at 0h, 7 at 33h, 10 at 36h, 5 at 40h, 3 at 44h and 3 at 48h, from one experiment for 44h and 48h, or pooled from 2 (resp. 3) independent experiments for 33h and 44h (resp. 36h).
Extended Data Fig. 4. LIFR downregulation enables enrichment from WT C57BL/6 mice of the pDCs engaged in IFN-I.
pDCs were sorted from 36h MCMV-infected WT C57BL/6 mice, with a protocol including an enrichment of LIFRlo cells to increase the capture efficiency for pDCs engaged in IFN-I production. a, Monocle pseudo-temporal analysis showing bifurcation of the inferred pDC activation trajectory in two major branches, Y53 and Y50. b, Expression of the IFN-I meta-gene along pseudo-time for the Y53 (top) and Y50 (bottom) branches of the pDC activation trajectory. c, LIFR expression along pseudo-time on the pDCs from the common root (empty thin orange circles), Y53 branch (filled orange triangles) and Y50 branch (empty thick dark red circles) of the pDC activation trajectory. d, Expression of individual genes along pseudo-time for the cells from the common root (empty thin orange circles), Y53 branch (filled orange triangles) and Y50 branch (empty thick dark red circles) of the pDC activation trajectory. A polynomial curve was fit to the data for each of the three segments of the trajectory.
Extended Data Fig. 5. Design, quality controls and RNA velocity analysis of the FB5P kinetics dataset.
a, Experimental design. For each time point, splenocytes were isolated from one Ifnb1 Eyfp mouse, depleted of Lin+ cells by magnetic sorting and used for index sorting of pDCs using three sorting gates: i) total (bulk) pDCs, ii) LIFRlo pDCs irrespective of their YFP expression, and iii) YFP+ pDCs. FB5P-seq scRNAseq libraries were then prepared. b, Table indicating the total numbers of cells sorted for each time point and sorting gate, the numbers of cells that passed quality control upon data analysis, and the number of bona fide pDC ultimately kept after identification and removal of contaminating cell types. c,d, Identification and removal of contaminating B and pDC-like cells. c, UMAP and clustering analysis. The analysis of the genes differentially expressed across clusters combined with their mining for expression across immune cell types by using the MyGeneSet tool of Immgen enabled identification of contaminating B cells (cluster 7, highlighted in orange). A GSEA analysis performed by using BubbleGUM (not shown) enabled identification of contaminating pDC-like cells (cluster 11, highlighted in red). d, Projection on the UMAP space of the expression of two B cell-specific genes, Jchain and Iglv1, two pDC-like cell-specific genes, Ms4a6b and Vim, and 2 genes selectively expressed at high levels in pDCs, Klk1 and Ly6d. e, Projections of the velocity vector of each pDC in the UMAP space obtained after contaminant removal.
Extended Data Fig. 6. Ex vivo unidirectional transition of pDCs isolated from MCMV-infected mice from a YFP+CCR7- to a YFP+CCR7+ activation state.
Ifnb1 Eyfp CD45.2+ mice were infected by MCMV. 36h later, LIFRlo YFP+ CCR7- pDCs and LIFRlo YFP+ CCR7+ pDCs were sorted and cultured in vitro for 8h in CD45.1+ feeder FLT3-L bone marrow cultures. CCR7 expression was monitored by flow cytometry before and after the culture, as depicted in the right panel. The data shown are from one experiment representative of two independent ones.
Extended Data Fig. 7. Micro-anatomical locations of splenic YFP+ cells during MCMV infection of Ifnb1Eyfp mice.
(a, b, c) Number of IFN-α/β spots per mm2 (a), of YFP+IFN-α/β+ cells/mm2 (b), and of YFP+ cells per mm2 (c), in whole spleen sections from Ifnb1Eyfp mice at indicated time points after MCMV infection. (d) Number of YFP+ cells per mm2 residing in the different spleen zones. MZ, marginal zone; RP, red pulp; WP, white pulp. Fifteen individual data points are shown on each graph for each time point, corresponding to quantitation of 5 different whole spleen sections per mouse, from 3 different mice, with overlay of mean±s.e.m.
Extended Data Fig. 8. Proposed model of the spatiotemporal dynamics of splenic pDC activation and functions during MCMV infection.
MCMV initially targets and replicates in stromal cells and/or metallophilic macrophages in the marginal zone (❶). These infected cells may then upregulate their expression of ICAM-1 and express mTNF, leading to their specific recognition by, and interactions with, quiescent pDCs. This interaction is proposed to downregulate LIFR expression on pDCs, to induce low levels of Tnf and Ccl3 in pDCs. It may also lead to the generation of an interferogenic synapse (❷) promoting local targeted delivery of viral material from the infected cell to pDCs, as illustrated on the upper left detailed drawing enlarged from the corresponding delimited area in the main drawing. This viral material is engulfed in pDCs and routed into dedicated endosomes, allowing TLR9 triggering, with the downstream enforcement of Tnf and Ccl3 expression and the induction of IFN-I genes. At this early activation state, pDCs from Ifnb1Eyfp reporter mice already start to express IFN-I but not yet clearly detectable levels of YFP. Then, pDCs further enhance their expression of IFN-I, leading to their expression of high levels of YFP in Ifnb1Eyfp reporter mice, and they simultaneously start to express IL-12 (❸). After termination of their IFN-I production, pDCs further enhance their IL-12 production, acquire CCR7 expression and migrate from the marginal zone to the white pulp through bridging channels (❹). Ultimately, pDCs relocate to the T cell zone where they harbor clear features of mature DCs, with a transcriptional, morphologic and functional convergence with tDCs, presumably including the acquisition of a dendritic morphology upon expression of Fscn1 and other genes involved into cytoskeleton remodeling, and acquisition of the ability to prime naïve CD4+ T cells (❺). CD169+ MMM, marginal zone metallophilic macrophages; mTNF, plasma membrane-bound TNF; pIRF7, phosphorylated IRF7.
Supplementary Material
Acknowledgements
We thank for their assistance all the staff of the CIML and CIPHE mouse houses, and of the CIML flow cytometry, imaging (ImagImm) core facilities. We thank Lionel Spinelli for fruitful discussions on single-cell data analysis and the CIML genomics and bioinformatics platform for their technical and methodological help. Microarray experiments and sequencing for the SS2 datasets were performed by Violaine Alunni or Bernard Jost in the GenomEast platform (Strasbourg, France), a member of the “France Génomique” consortium (ANR-10-INBS-0009), managed by Christelle Thibault-Carpentier. FB5P-seq libraries sequencing was performed by HalioDx testing laboratory, Marseille, France. We acknowledge Dr. Sandrine Henri (CIML) for generous gift of OT II mice, and Dr. Hervé Luche for advice on cell and tissue fixation to preserve YFP signal. This research was funded by grants from the European Research Council under the European Community’s Seventh Framework Programme (FP7/2007-2013 Grant Agreement 281225, “SystemsDendritic”, to M.D.), the Agence Nationale de la Recherche (ANR) (SCAPIN, ANR-15-CE15-0006-01, to M.D.), and the Fondation pour la Recherche Médicale (DEQ20180339172, Equipe Labellisée to M.D.). We also acknowledge support from the DCBIOL Labex (ANR-11-LABEX-0043, grant ANR-10-IDEX-0001-02 PSL*), the A*MIDEX project (ANR-11-IDEX-0001-02) funded by the French Government’s “Investissements d’Avenir” program managed by the ANR, and institutional support from CNRS, Inserm, Aix Marseille Université and Marseille Immunopole. This work was supported by the French National Research Agency through the “Investments for the Future” program (France-BioImaging, ANR-10-INBS-04). A.A. and R.C. were supported by the DCBIOL Labex. G.Br. apprenticeship was supported by Inserm.
Footnotes
Author contributions
Studies were designed by E.T., M.D., A.A. and T.-P.V.M., with help from A-C.V and P.M. Experiments were performed by A.A., E.T., M.V., N.C. and N.A., with help from K.N. and G.Be. Data were analyzed by A.A., T.-P.V.M., M.V., N.C., M.D. and E.T., with help from C.D., R.C., G.Br., I.C.-M., M.T.-C., and D.T. Critical reagents and advice were provided by B.R. and J.-L.D. The manuscript was written by A.A., T.-P.V.-M., M.D. and E.T. All authors contributed to discussions and manuscript edition.
Competing interests
The authors declare no competing interests.
Online content
Any methods, additional references, Nature Research reporting summaries, source data, extended data, supplementary information, acknowledgements, peer review information; details of author contributions and competing interests; and statements of data and code availability are available at XXX.
Peer review information
Ioana Visan was the primary editor on this article and managed its editorial process and peer review in collaboration with the rest of the editorial team.
Reprints and permissions information is available at www.nature.com/reprints.
Data availability
Microarray and scRNAseq data have been deposited in the GEO repository under accession codes GSE150664 and GSE151248, respectively. All the other data that support the findings of this study will be available from the corresponding authors upon reasonable request.
References
- 1.Tomasello E, Pollet E, Vu Manh TP, Uze G, Dalod M. Harnessing Mechanistic Knowledge on Beneficial Versus Deleterious IFN-I Effects to Design Innovative Immunotherapies Targeting Cytokine Activity to Specific Cell Types. Front Immunol. 2014;5:526. doi: 10.3389/fimmu.2014.00526. [DOI] [PMC free article] [PubMed] [Google Scholar]
- 2.Asselin-Paturel C, et al. Mouse type I IFN-producing cells are immature APCs with plasmacytoid morphology. Nature immunology. 2001;2:1144–1150. doi: 10.1038/ni736. [DOI] [PubMed] [Google Scholar]
- 3.Dalod M, et al. Interferon alpha/beta and interleukin 12 responses to viral infections: pathways regulating dendritic cell cytokine expression in vivo. J Exp Med. 2002;195:517–528. doi: 10.1084/jem.20011672. [DOI] [PMC free article] [PubMed] [Google Scholar]
- 4.Kadowaki N, Antonenko S, Lau JY, Liu YJ. Natural interferon alpha/beta-producing cells link innate and adaptive immunity. J Exp Med. 2000;192:219–226. doi: 10.1084/jem.192.2.219. [DOI] [PMC free article] [PubMed] [Google Scholar]
- 5.Grouard G, et al. The enigmatic plasmacytoid T cells develop into dendritic cells with interleukin (IL)-3 and CD40-ligand. J Exp Med. 1997;185:1101–1111. doi: 10.1084/jem.185.6.1101. [DOI] [PMC free article] [PubMed] [Google Scholar]
- 6.Dalod M, et al. Dendritic cell responses to early murine cytomegalovirus infection: subset functional specialization and differential regulation by interferon alpha/beta. J Exp Med. 2003;197:885–898. doi: 10.1084/jem.20021522. [DOI] [PMC free article] [PubMed] [Google Scholar]
- 7.O’Keeffe M, et al. Mouse plasmacytoid cells: long-lived cells, heterogeneous in surface phenotype and function, that differentiate into CD8(+) dendritic cells only after microbial stimulus. J Exp Med. 2002;196:1307–1319. doi: 10.1084/jem.20021031. [DOI] [PMC free article] [PubMed] [Google Scholar]
- 8.Segura E, Wong J, Villadangos JA. Cutting edge: B220+CCR9-dendritic cells are not plasmacytoid dendritic cells but are precursors of conventional dendritic cells. J Immunol. 2009;183:1514–1517. doi: 10.4049/jimmunol.0901524. [DOI] [PubMed] [Google Scholar]
- 9.See P, et al. Mapping the human DC lineage through the integration of high-dimensional techniques. Science. 2017;356 doi: 10.1126/science.aag3009. [DOI] [PMC free article] [PubMed] [Google Scholar]
- 10.Dress RJ, et al. Plasmacytoid dendritic cells develop from Ly6D(+) lymphoid progenitors distinct from the myeloid lineage. Nature immunology. 2019;20:852–864. doi: 10.1038/s41590-019-0420-3. [DOI] [PubMed] [Google Scholar]
- 11.Rodrigues PF, et al. Distinct progenitor lineages contribute to the heterogeneity of plasmacytoid dendritic cells. Nature immunology. 2018;19:711–722. doi: 10.1038/s41590-018-0136-9. [DOI] [PMC free article] [PubMed] [Google Scholar]
- 12.Bar-On L, et al. CX3CR1+ CD8alpha+ dendritic cells are a steady-state population related to plasmacytoid dendritic cells. Proc Natl Acad Sci U S A. 2010;107:14745–14750. doi: 10.1073/pnas.1001562107. [DOI] [PMC free article] [PubMed] [Google Scholar]
- 13.Lau CM, et al. Leukemia-associated activating mutation of Flt3 expands dendritic cells and alters T cell responses. J Exp Med. 2016;213:415–431. doi: 10.1084/jem.20150642. [DOI] [PMC free article] [PubMed] [Google Scholar]
- 14.Villani AC, et al. Single-cell RNA-seq reveals new types of human blood dendritic cells, monocytes, and progenitors. Science. 2017;356 doi: 10.1126/science.aah4573. [DOI] [PMC free article] [PubMed] [Google Scholar]
- 15.Leylek R, et al. Integrated Cross-Species Analysis Identifies a Conserved Transitional Dendritic Cell Population. Cell Rep. 2019;29:3736–3750 e3738. doi: 10.1016/j.celrep.2019.11.042. [DOI] [PMC free article] [PubMed] [Google Scholar]
- 16.Alcantara-Hernandez M, et al. High-Dimensional Phenotypic Mapping of Human Dendritic Cells Reveals Interindividual Variation and Tissue Specialization. Immunity. 2017;47:1037–1050 e1036. doi: 10.1016/j.immuni.2017.11.001. [DOI] [PMC free article] [PubMed] [Google Scholar]
- 17.Alculumbre SG, et al. Diversification of human plasmacytoid predendritic cells in response to a single stimulus. Nature immunology. 2018;19:63–75. doi: 10.1038/s41590-017-0012-z. [DOI] [PubMed] [Google Scholar]
- 18.Swiecki M, Colonna M. The multifaceted biology of plasmacytoid dendritic cells. Nat Rev Immunol. 2015;15:471–485. doi: 10.1038/nri3865. [DOI] [PMC free article] [PubMed] [Google Scholar]
- 19.Reizis B. Plasmacytoid Dendritic Cells: Development, Regulation, and Function. Immunity. 2019;50:37–50. doi: 10.1016/j.immuni.2018.12.027. [DOI] [PMC free article] [PubMed] [Google Scholar]
- 20.Leylek R, Idoyaga J. The versatile plasmacytoid dendritic cell: Function, heterogeneity, and plasticity. Int Rev Cell Mol Biol. 2019;349:177–211. doi: 10.1016/bs.ircmb.2019.10.002. [DOI] [PubMed] [Google Scholar]
- 21.Anderson DA, 3rd, Murphy KM. Models of dendritic cell development correlate ontogeny with function. Adv Immunol. 2019;143:99–119. doi: 10.1016/bs.ai.2019.09.001. [DOI] [PMC free article] [PubMed] [Google Scholar]
- 22.Tomasello E, et al. Molecular dissection of plasmacytoid dendritic cell activation in vivo during a viral infection. EMBO J. 2018;37 doi: 10.15252/embj.201798836. [DOI] [PMC free article] [PubMed] [Google Scholar]
- 23.Assil S, et al. Plasmacytoid Dendritic Cells and Infected Cells Form an Interferogenic Synapse Required for Antiviral Responses. Cell Host Microbe. 2019;25:730–745 e736. doi: 10.1016/j.chom.2019.03.005. [DOI] [PubMed] [Google Scholar]
- 24.Frenz T, et al. Independent of plasmacytoid dendritic cell (pDC) infection, pDC triggered by virus-infected cells mount enhanced type I IFN responses of different composition as opposed to pDC stimulated with free virus. J Immunol. 2014;193:2496–2503. doi: 10.4049/jimmunol.1400215. [DOI] [PubMed] [Google Scholar]
- 25.Scheu S, Dresing P, Locksley RM. Visualization of IFNbeta production by plasmacytoid versus conventional dendritic cells under specific stimulation conditions in vivo. Proc Natl Acad Sci U S A. 2008;105:20416–20421. doi: 10.1073/pnas.0808537105. [DOI] [PMC free article] [PubMed] [Google Scholar]
- 26.O’Keeffe M, et al. Nonplasmacytoid, high IFN-alpha-producing, bone marrow dendritic cells. J Immunol. 2012;188:3774–3783. doi: 10.4049/jimmunol.1101365. [DOI] [PubMed] [Google Scholar]
- 27.Zucchini N, et al. Individual plasmacytoid dendritic cells are major contributors to the production of multiple innate cytokines in an organ-specific manner during viral infection. International immunology. 2008;20:45–56. doi: 10.1093/intimm/dxm119. [DOI] [PMC free article] [PubMed] [Google Scholar]
- 28.Hentschel E, et al. Destabilized eYFP variants for dynamic gene expression studies in Corynebacterium glutamicum. Microb Biotechnol. 2013;6:196–201. doi: 10.1111/j.1751-7915.2012.00360.x. [DOI] [PMC free article] [PubMed] [Google Scholar]
- 29.Tombolini R, Unge A, Davey ME, deBruijn FJ, Jansson JK. Flow cytometric and microscopic analysis of GFP-tagged Pseudomonas fluorescens bacteria. FEMS Microbiol Ecol. 1997;22:17–28. [Google Scholar]
- 30.Bagadia P, et al. An Nfil3-Zeb2-Id2 pathway imposes Irf8 enhancer switching during cDC1 development. Nature immunology. 2019;20:1174–1185. doi: 10.1038/s41590-019-0449-3. [DOI] [PMC free article] [PubMed] [Google Scholar]
- 31.Picelli S, et al. Full-length RNA-seq from single cells using Smart-seq2. Nat Protoc. 2014;9:171–181. doi: 10.1038/nprot.2014.006. [DOI] [PubMed] [Google Scholar]
- 32.Ito T, Kanzler H, Duramad O, Cao W, Liu YJ. Specialization, kinetics, and repertoire of type 1 interferon responses by human plasmacytoid predendritic cells. Blood. 2006;107:2423–2431. doi: 10.1182/blood-2005-07-2709. [DOI] [PubMed] [Google Scholar]
- 33.Ciancanelli MJ, et al. Infectious disease. Life-threatening influenza and impaired interferon amplification in human IRF7 deficiency. Science. 2015;348:448–453. doi: 10.1126/science.aaa1578. [DOI] [PMC free article] [PubMed] [Google Scholar]
- 34.Honda K, et al. IRF-7 is the master regulator of type-I interferon-dependent immune responses. Nature. 2005;434:772–777. doi: 10.1038/nature03464. [DOI] [PubMed] [Google Scholar]
- 35.Levy DE. Whence interferon? Variety in the production of interferon in response to viral infection. J Exp Med. 2002;195:F15–18. doi: 10.1084/jem.20020075. [DOI] [PMC free article] [PubMed] [Google Scholar]
- 36.Robbins SH, et al. Novel insights into the relationships between dendritic cell subsets in human and mouse revealed by genome-wide expression profiling. Genome Biol. 2008;9:R17. doi: 10.1186/gb-2008-9-1-r17. [DOI] [PMC free article] [PubMed] [Google Scholar]
- 37.Shi W, et al. Transcriptional profiling of mouse B cell terminal differentiation defines a signature for antibody-secreting plasma cells. Nature immunology. 2015;16:663–673. doi: 10.1038/ni.3154. [DOI] [PubMed] [Google Scholar]
- 38.La Manno G, et al. RNA velocity of single cells. Nature. 2018;560:494–498. doi: 10.1038/s41586-018-0414-6. [DOI] [PMC free article] [PubMed] [Google Scholar]
- 39.Zhang J, et al. A newly identified microRNA, mmu-miR-7578, functions as a negative regulator on inflammatory cytokines tumor necrosis factor-alpha and interleukin-6 via targeting Egr1 in vivo. J Biol Chem. 2013;288:4310–4320. doi: 10.1074/jbc.M112.351197. [DOI] [PMC free article] [PubMed] [Google Scholar]
- 40.Guha M, et al. Lipopolysaccharide activation of the MEK-ERK1/2 pathway in human monocytic cells mediates tissue factor and tumor necrosis factor alpha expression by inducing Elk-1 phosphorylation and Egr-1 expression. Blood. 2001;98:1429–1439. doi: 10.1182/blood.v98.5.1429. [DOI] [PubMed] [Google Scholar]
- 41.Attaf N, et al. FB5P-seq: FACS-Based 5-Prime End Single-Cell RNA-seq for Integrative Analysis of Transcriptome and Antigen Receptor Repertoire in B and T Cells. Front Immunol. 2020;11:216. doi: 10.3389/fimmu.2020.00216. [DOI] [PMC free article] [PubMed] [Google Scholar]
- 42.Spinelli L, Carpentier S, Montanana Sanchis F, Dalod M, Vu Manh TP. BubbleGUM: automatic extraction of phenotype molecular signatures and comprehensive visualization of multiple Gene Set Enrichment Analyses. BMC Genomics. 2015;16:814. doi: 10.1186/s12864-015-2012-4. [DOI] [PMC free article] [PubMed] [Google Scholar]
- 43.Palucka AK, Blanck JP, Bennett L, Pascual V, Banchereau J. Cross-regulation of TNF and IFN-alpha in autoimmune diseases. Proc Natl Acad Sci U S A. 2005;102:3372–3377. doi: 10.1073/pnas.0408506102. [DOI] [PMC free article] [PubMed] [Google Scholar]
- 44.Jaehn PS, Zaenker KS, Schmitz J, Dzionek A. Functional dichotomy of plasmacytoid dendritic cells: antigen-specific activation of T cells versus production of type I interferon. Eur J Immunol. 2008;38:1822–1832. doi: 10.1002/eji.200737552. [DOI] [PubMed] [Google Scholar]
- 45.Reizis B, Bunin A, Ghosh HS, Lewis KL, Sisirak V. Plasmacytoid dendritic cells: recent progress and open questions. Annu Rev Immunol. 2011;29:163–183. doi: 10.1146/annurev-immunol-031210-101345. [DOI] [PMC free article] [PubMed] [Google Scholar]
- 46.Wimmers F, et al. Single-cell analysis reveals that stochasticity and paracrine signaling control interferon-alpha production by plasmacytoid dendritic cells. Nat Commun. 2018;9:3317. doi: 10.1038/s41467-018-05784-3. [DOI] [PMC free article] [PubMed] [Google Scholar]
- 47.Bauer J, et al. Cutting Edge: IFN-beta Expression in the Spleen Is Restricted to a Subpopulation of Plasmacytoid Dendritic Cells Exhibiting a Specific Immune Modulatory Transcriptome Signature. J Immunol. 2016;196:4447–4451. doi: 10.4049/jimmunol.1500383. [DOI] [PubMed] [Google Scholar]
- 48.Sesti-Costa R, et al. Leukemia Inhibitory Factor Inhibits Plasmacytoid Dendritic Cell Function and Development. J Immunol. 2020 doi: 10.4049/jimmunol.1900604. [DOI] [PMC free article] [PubMed] [Google Scholar]
- 49.Swiecki M, et al. Type I interferon negatively controls plasmacytoid dendritic cell numbers in vivo. J Exp Med. 2011;208:2367–2374. doi: 10.1084/jem.20110654. [DOI] [PMC free article] [PubMed] [Google Scholar]
- 50.Ghosh HS, Cisse B, Bunin A, Lewis KL, Reizis B. Continuous expression of the transcription factor e2-2 maintains the cell fate of mature plasmacytoid dendritic cells. Immunity. 2010;33:905–916. doi: 10.1016/j.immuni.2010.11.023. [DOI] [PMC free article] [PubMed] [Google Scholar]
- 51.Ardouin L, et al. Broad and Largely Concordant Molecular Changes Characterize Tolerogenic and Immunogenic Dendritic Cell Maturation in Thymus and Periphery. Immunity. 2016;45:305–318. doi: 10.1016/j.immuni.2016.07.019. [DOI] [PubMed] [Google Scholar]
- 52.Baranek T, et al. Differential responses of immune cells to type I interferon contribute to host resistance to viral infection. Cell Host Microbe. 2012;12:571–584. doi: 10.1016/j.chom.2012.09.002. [DOI] [PubMed] [Google Scholar]
- 53.Villani AC, Shekhar K. Single-Cell RNA Sequencing of Human T Cells. Methods Mol Biol. 2017;1514:203–239. doi: 10.1007/978-1-4939-6548-9_16. [DOI] [PubMed] [Google Scholar]
- 54.Dobin A, et al. STAR: ultrafast universal RNA-seq aligner. Bioinformatics. 2013;29:15–21. doi: 10.1093/bioinformatics/bts635. [DOI] [PMC free article] [PubMed] [Google Scholar]
- 55.Anders S, Pyl PT, Huber W. HTSeq--a Python framework to work with high-throughput sequencing data. Bioinformatics. 2015;31:166–169. doi: 10.1093/bioinformatics/btu638. [DOI] [PMC free article] [PubMed] [Google Scholar]
- 56.Butler A, Hoffman P, Smibert P, Papalexi E, Satija R. Integrating single-cell transcriptomic data across different conditions, technologies, and species. Nat Biotechnol. 2018;36:411–420. doi: 10.1038/nbt.4096. [DOI] [PMC free article] [PubMed] [Google Scholar]
- 57.Trapnell C, et al. The dynamics and regulators of cell fate decisions are revealed by pseudotemporal ordering of single cells. Nat Biotechnol. 2014;32:381–386. doi: 10.1038/nbt.2859. [DOI] [PMC free article] [PubMed] [Google Scholar]
- 58.Cao J, et al. The single-cell transcriptional landscape of mammalian organogenesis. Nature. 2019;566:496–502. doi: 10.1038/s41586-019-0969-x. [DOI] [PMC free article] [PubMed] [Google Scholar]
- 59.Subramanian A, Kuehn H, Gould J, Tamayo P, Mesirov JP. GSEA-P: a desktop application for Gene Set Enrichment Analysis. Bioinformatics. 2007;23:3251–3253. doi: 10.1093/bioinformatics/btm369. [DOI] [PubMed] [Google Scholar]
Associated Data
This section collects any data citations, data availability statements, or supplementary materials included in this article.
Supplementary Materials
Data Availability Statement
Microarray and scRNAseq data have been deposited in the GEO repository under accession codes GSE150664 and GSE151248, respectively. All the other data that support the findings of this study will be available from the corresponding authors upon reasonable request.


