Abstract
The mechanistic target of rapamycin complex 1 (mTORC1) is a key metabolic hub that controls the cellular response to environmental cues by exerting its kinase activity on multiple substrates1–3. However, whether mTORC1 responds to diverse stimuli by differentially phosphorylating specific substrates is poorly understood. Here we show that Transcription Factor EB (TFEB), a master regulator of lysosomal biogenesis and autophagy4,5, is phosphorylated by mTORC1 via a substrate-specific mechanism mediated by RagGTPases. Thus, TFEB phosphorylation is strictly dependent on amino acid-mediated activation of RagC/D GTPase but, unlike other mTORC1 substrates such as S6K and 4E-BP1, insensitive to growth factor-induced Rheb activity. This mechanism plays a crucial role in Birt-Hogg-Dubé (BHD) syndrome, a disorder caused by mutations of the RagC/D activator folliculin (FLCN) and characterized by benign skin tumors, lung and kidney cysts and renal cell carcinoma6,7. We found that constitutive activation of TFEB is the main driver of the kidney abnormalities and paradoxical mTORC1 hyperactivity observed in BHD syndrome. Remarkably, depletion of TFEB in a kidney-specific mouse model of BHD syndrome fully rescued the disease phenotype and associated lethality and normalized mTORC1 activity. Together, these findings identify a substrate-specific control mechanism of mTORC1, whose dysregulation leads to kidney cysts and cancer.
Activation of mTORC1 occurs at the lysosomal membrane and is known to be mediated by Rheb, a small GTPase whose activity is induced by growth factors and inhibited by the tuberous sclerosis complex (TSC)8–11. mTORC1 is recruited to the lysosomal membrane when Rag GTPase RagA/B-RagC/D heterodimers, are in the active configuration (i.e. GTP-bound RagA/B and GDP-bound RagC/D)12–14 Rag activation is mediated by nutrient-activated GTPase Activating Proteins (GAPs) GATOR1 and folliculin (FLCN), which modify the nucleotide state of RagA/B and RagC/D, respectively15–18.
Transcription factor EB (TFEB) is a transcriptional controller of cell metabolism4,5 and its activity is negatively regulated by mTORC1-mediated phosphorylation, which promotes TFEB cytoplasmic localization, while inhibiting its nuclear translocation19-24. We previously reported that mTORC1 and TFEB are part of a feedback loop in which mTORC1 negatively regulates TFEB, whereas TFEB, in turn, is able to positively regulate mTORC1 activity through transcriptional induction of RagC/D25. Here we describe an “unconventional” mTORC1 substrate recruitment mechanism that makes TFEB phosphorylation highly sensitive to amino acid availability but insensitive to growth factors, thus allowing a selective downstream response of mTORC1 to specific nutritional inputs. Dysfunction of this mechanism is a crucial determinant of Birt-Hogg-Dubé (BHD) syndrome, a disease caused by loss-of-function mutations of the mTORC1 regulator FLCN.
TFEB phosphorylation does not require Rheb
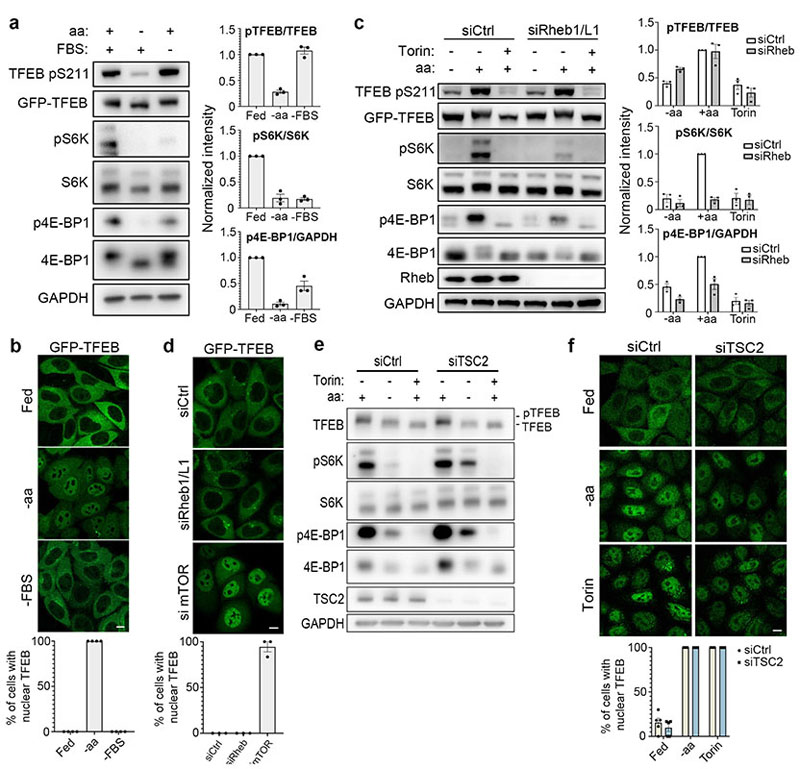
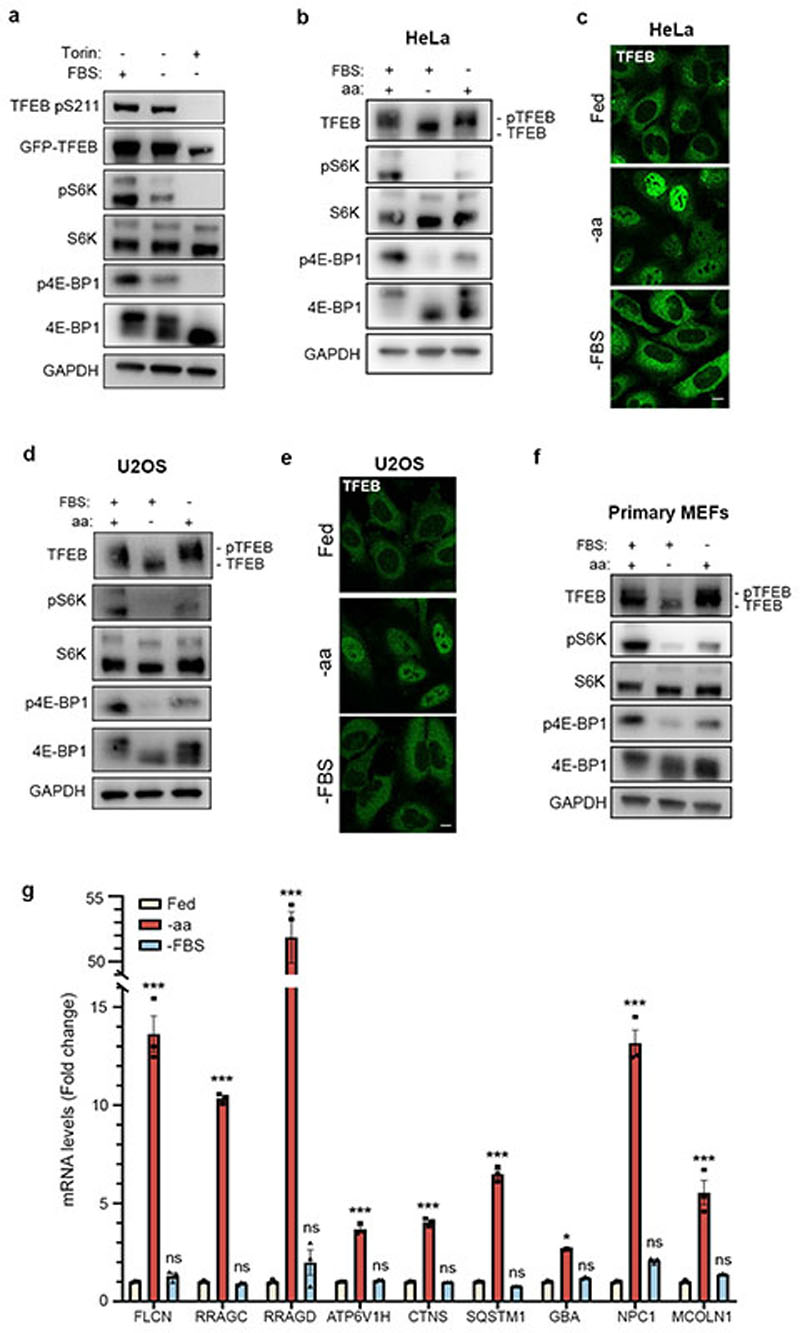
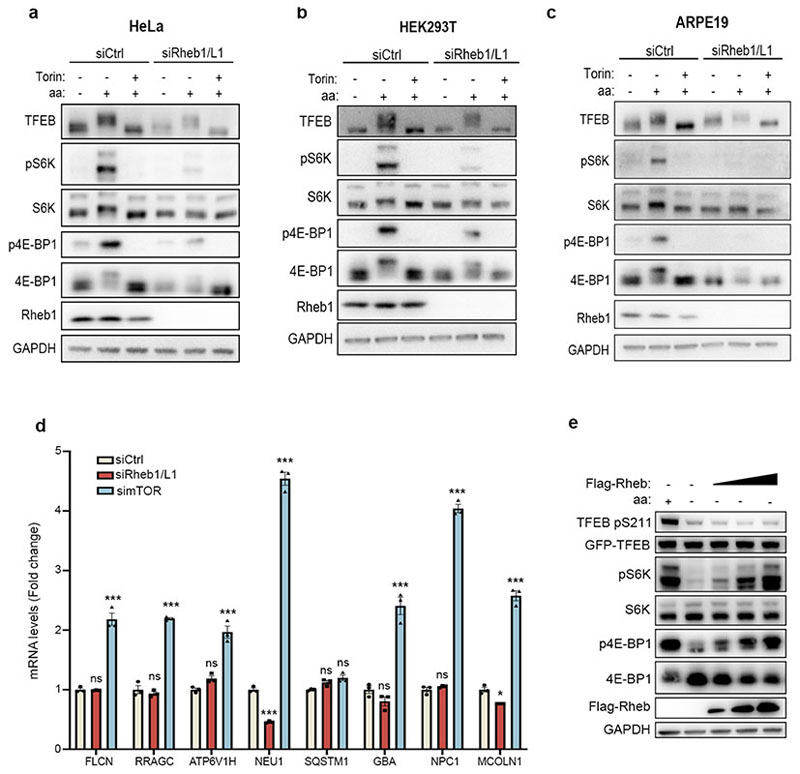
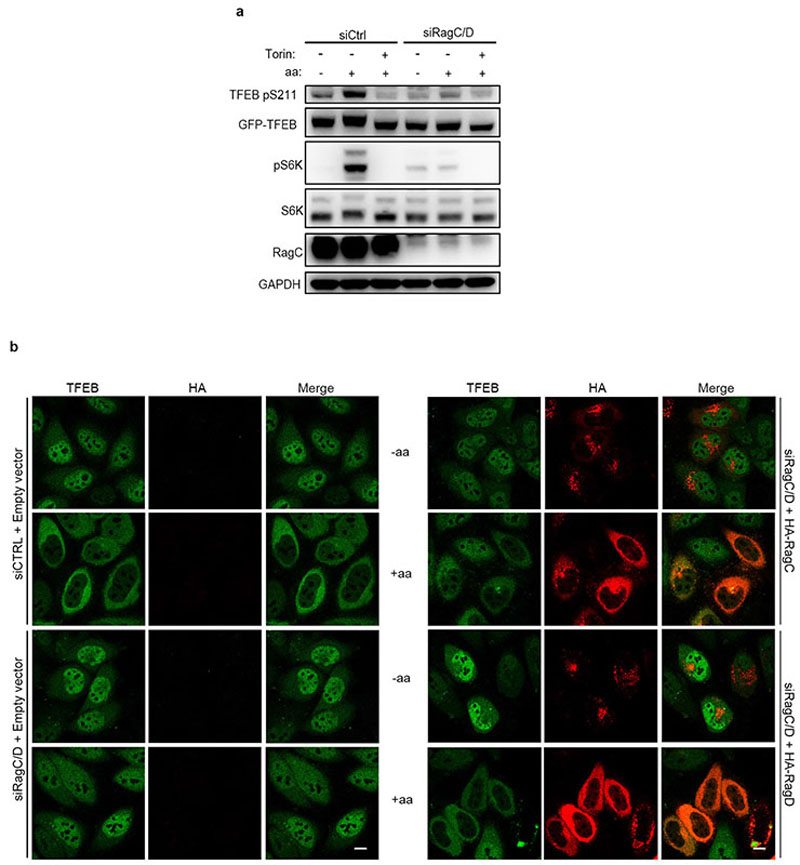
We sought to investigate whether the phosphorylation of TFEB behaved differently from other mTORC1 substrates. While both amino acid and serum deprivation inhibited phosphorylation of mTORC1 substrates S6K and 4E-BP1, only amino acid deprivation was able to suppress TFEB phosphorylation (Fig. 1a and Extended Data Fig. 1a,b,d,f). Consistently, TFEB subcellular localization and activity were only affected by amino acid deprivation, whereas serum starvation had no effect (Fig. 1b and Extended Data Fig. 1c,e,g). In line with these observations, siRNA-mediated silencing of Rheb1 and its homologue RhebL1 did not affect TFEB phosphorylation, subcellular localization or activity, while significantly impairing phosphorylation of S6K and 4E-BP1 (Fig. 1c-d and Extended Data Fig. 2a-d). Consistently, Rheb overexpression had no effect on TFEB phosphorylation while strongly inducing phosphorylation of S6K and 4E-BP1 in starved cells (Extended Data Fig. 2e). Furthermore, siRNA-mediated depletion of TSC2, a negative regulator of Rheb, did not affect TFEB phosphorylation or subcellular localization, which remained sensitive to amino acid deprivation (Fig. 1e-f). Conversely, knockdown of RagC/D significantly impaired both TFEB phosphorylation and cytosolic localization (Extended Data Fig. 3a,b), which was equally rescued by re-expression of either RagC or RagD (Extended data Fig. 3b). Thus, the phosphorylation of TFEB by mTORC1 is insensitive to perturbations of the growth factor-activated TSC-Rheb axis but highly sensitive to the amino acid-dependent activation of Rag GTPases.
Fig. 1. TFEB phosphorylation is insensitive to the Rheb/TSC axis.
a, Representative immunoblotting and quantification (mean ± SEM; n=3) of HeLa cells stably expressing GFP-TFEB either starved of amino acids (aa) or serum (FBS) for 2h. b, Cells as in a were analyzed by immunofluorescence (replicated three times) and quantified to calculate the percentage of cells showing TFEB nuclear localization. Scale bar, 10 μm. n=4 independent fields per condition. c, Representative immunoblotting and quantification (mean ± SEM; n=3) of HeLa cells stably expressing GFP-TFEB, transfected with the indicated siRNAs and subjected to amino acid (aa) starvation/re-feeding (see Methods) in the presence or absence of 250 nM Torin. d, Confocal microscopy analysis (replicated twice) of HeLa cells depleted for either Rheb1/RhebL1 (siRheb1/Ll) or mTOR (simTOR) and in control cells (siCtrl). Scale bar, 10 μm. The graph shows the percentage of cells showing TFEB nuclear localization. n=3 independent fields per condition. e, HeLa cells transfected for 48h with either TSC2-targeting (siTSC2) or control siRNA (siCtrl) were either left untreated, starved of amino acids (aa) for 60 min or treated with 250 nM Torin for 60 min prior to immunoblotting analysis (replicated three times). f, Cells described in e were stained with TFEB antibodies, analyzed by confocal microscopy (replicated three times) and quantified to calculate the percentage of cells showing TFEB nuclear localization. Scale bar, 10 μm. Results are mean β SEM. n=5 independent fields per condition.
Rags mediate mTORC1-TFEB interaction
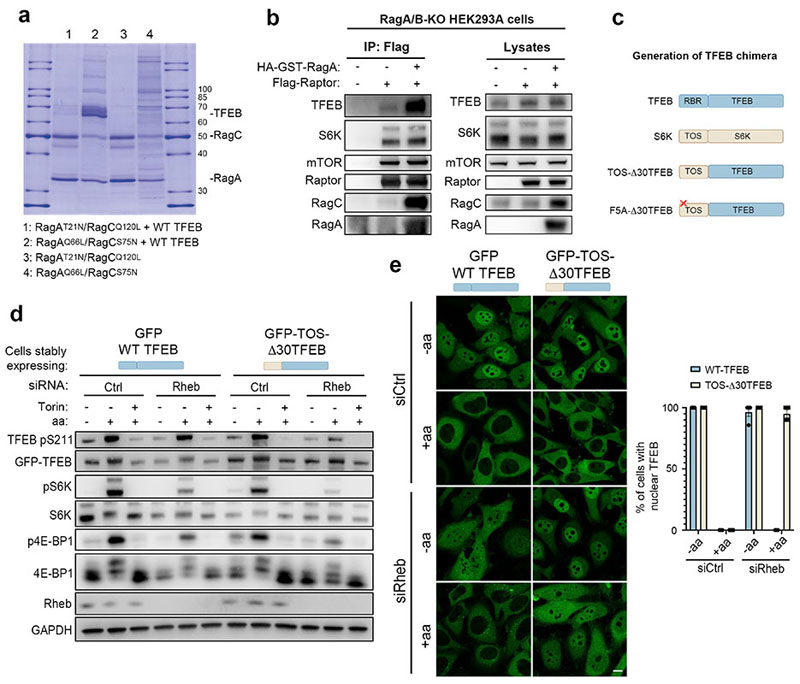
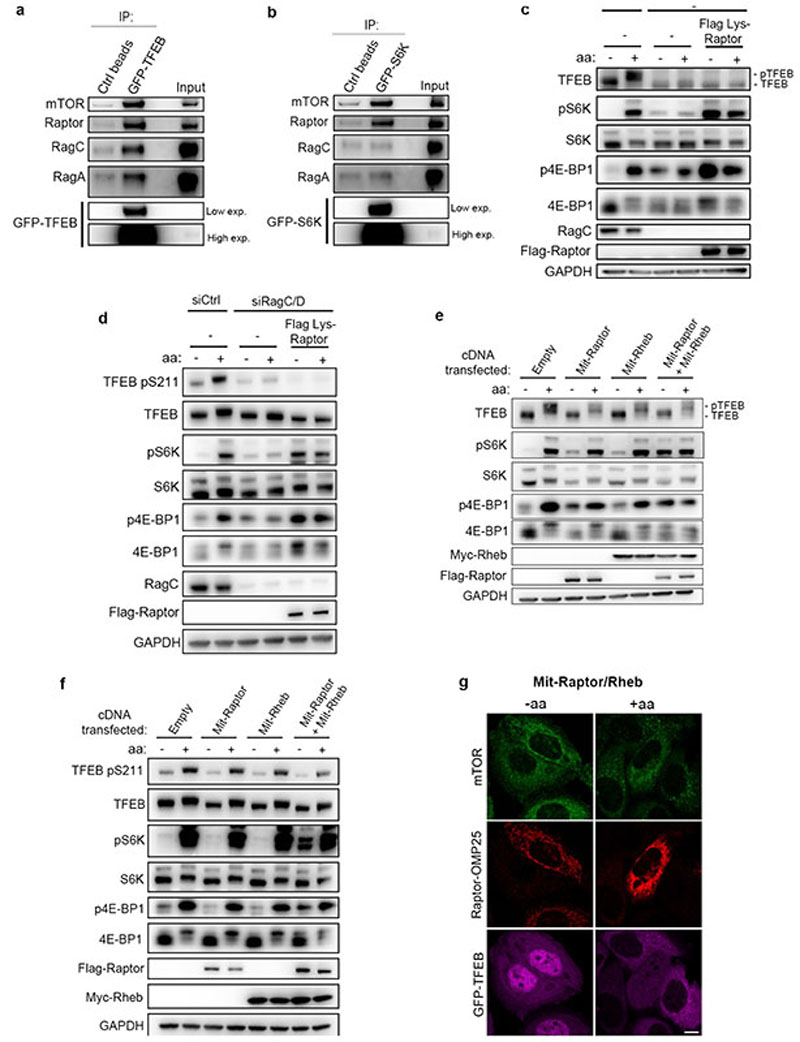
Next, we sought to identify the mechanism underlying the different responses of TFEB and S6K/4E-BP1 to mTORC1 activating stimuli. TFEB is known to interact with Rag GTPases and such interaction is important for mTORC1-mediated TFEB phosphorylation26. However, why mTORC1-mediated phosphorylation of TFEB requires its interaction with the Rag GTPases remains unclear, considering that none of the other mTORC1 substrates has been shown to interact with the Rags. Furthermore, analysis of TFEB protein sequence failed to identify a TOS motif, a region that is known to mediate mTORC1 substrate recruitment through direct binding with Raptor27,28. Thus, we reasoned that the unconventional behavior of TFEB phosphorylation by mTORC1 may be due to an alternative substrate recruitment mechanism mediated by Rag GTPases. In vitro co-purification revealed a direct interaction between recombinant TFEB and a Rag GTPase dimer composed of active RagA and RagC (RagAQ66L and RagCS75N, Fig. 2a). Furthermore, co-immunoprecipitation experiments in HeLa cells revealed that TFEB interacts with Rag GTPases, Raptor and mTOR (Extended Data Fig. 4a), whereas no interaction of S6K with Rag GTPases was observed despite binding to both mTOR and Raptor (Extended Data Fig. 4b). Notably, we found that mTORC1 interaction with TFEB was significantly impaired in RagA/B KO cells and restored upon reconstitution of these cells with wild type RagA, whereas the absence of RagA/B did not affect mTORC1-S6K interaction (Fig. 2b). These data suggest that Rag GTPases are required for the interaction of mTORC1 with TFEB, whereas they are dispensable for its interaction with S6K and 4E-BP1.
Fig. 2. An “unconventional” mTORC1 substrate-recruitment mechanism.
a, Coomassie stained gel of eluted SEC fractions containing the different combinations of active/inactive Rag GTPases, in the presence or absence of TFEB. b, RagA/B-deficient HEK293A cells transfected with the indicated constructs were lysed, incubated with Flag-beads and analyzed by immunoblotting (replicated three times). c, Schematic representation of TFEB chimeric constructs (see Methods for details). RBR: Rag-binding region; TOS: TOR signaling motif. d, HeLa cells stably expressing GFP-WT-TFEB or the GFP-TOS-Δ30TFEB chimeric construct described in c were transfected with either Rheb-targeting or control (Ctrl) siRNA, subjected to amino acid (aa) starvation/refeeding (see Methods) in the presence or absence of 250 nM Torin, and analyzed by immunoblotting (replicated three times). e, Cells as in (d) were analyzed by immunofluorescence (replicated three times) and quantified to calculate the percentage of cells showing TFEB nuclear localization. Scale bar, 10 μm. Results are mean ± SEM. n–4 independent fields per condition.
Next, expression of a previously described construct (Lys-Raptor), which promotes constitutive lysosomal recruitment and Rag-independent activation of mTORC113, in RagC/D-silenced cells rescued the phosphorylation of S6K and 4E-BP1 but was unable to rescue TFEB phosphorylation (Extended Data Fig. 4c,d), indicating that mTORC1-mediated phosphorylation of TFEB requires Rag GTPases even in conditions leading to constitutive lysosomal localization of mTORC1. Similar results were obtained by co-targeting both Raptor and Rheb to mitochondria (Mit-Raptor/Rheb) using a previously described approach29, which resulted in constitutive phosphorylation of S6K and 4E-BP1, whereas TFEB phosphorylation and subcellular localization were still sensitive to nutrient availability (Extended Data Fig. 4e-g). These data suggest that, different from S6K and 4E-BP1, TFEB phosphorylation requires active Rag GTPases regardless of lysosomal localization and Rheb-induced activation of mTORC1.
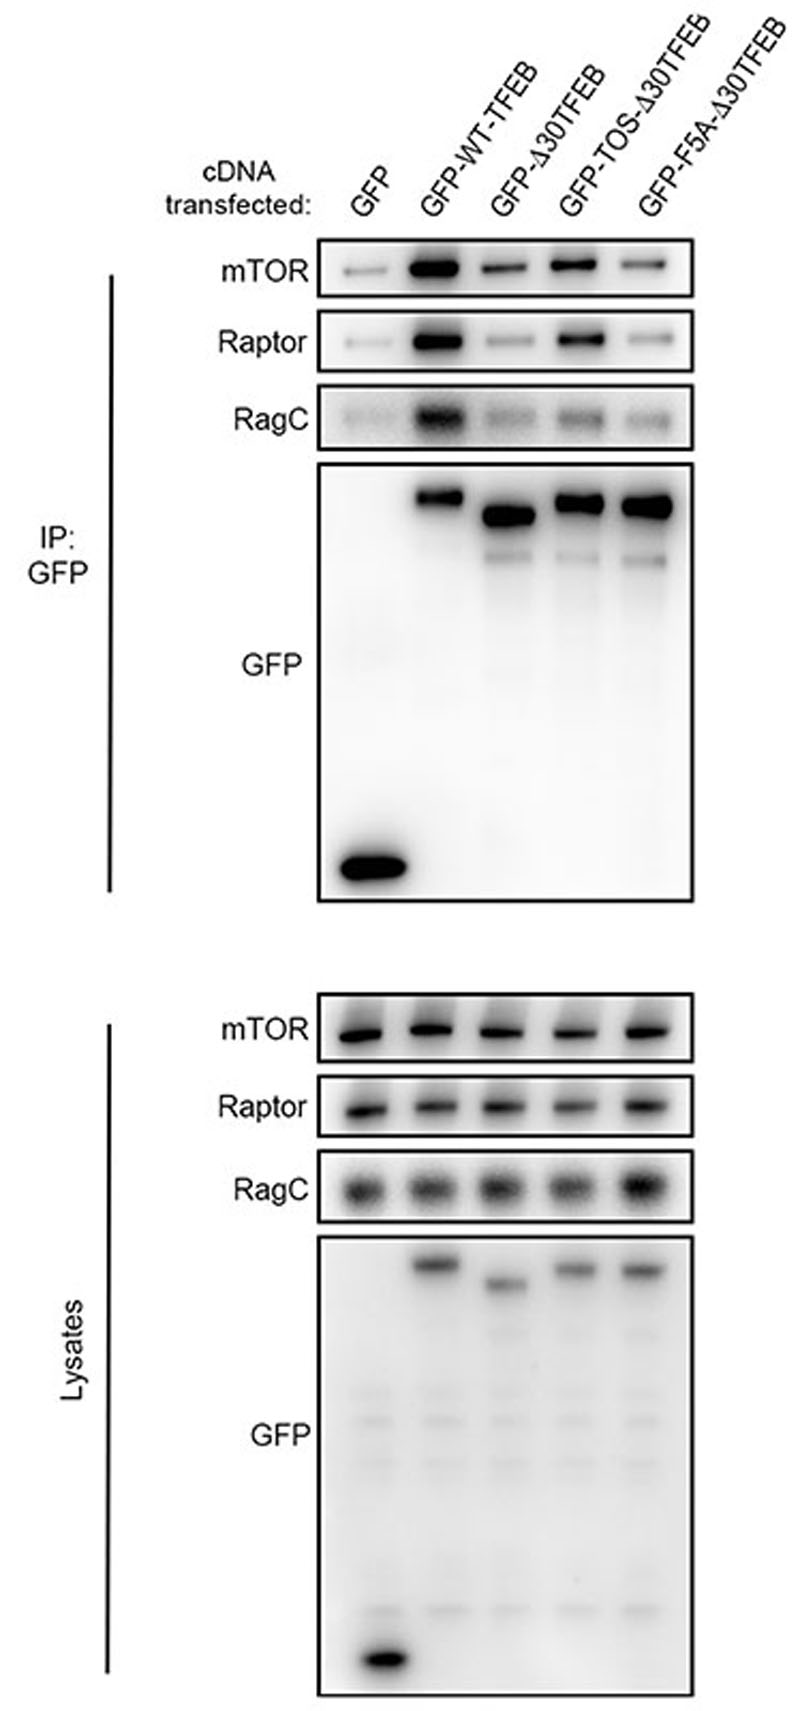
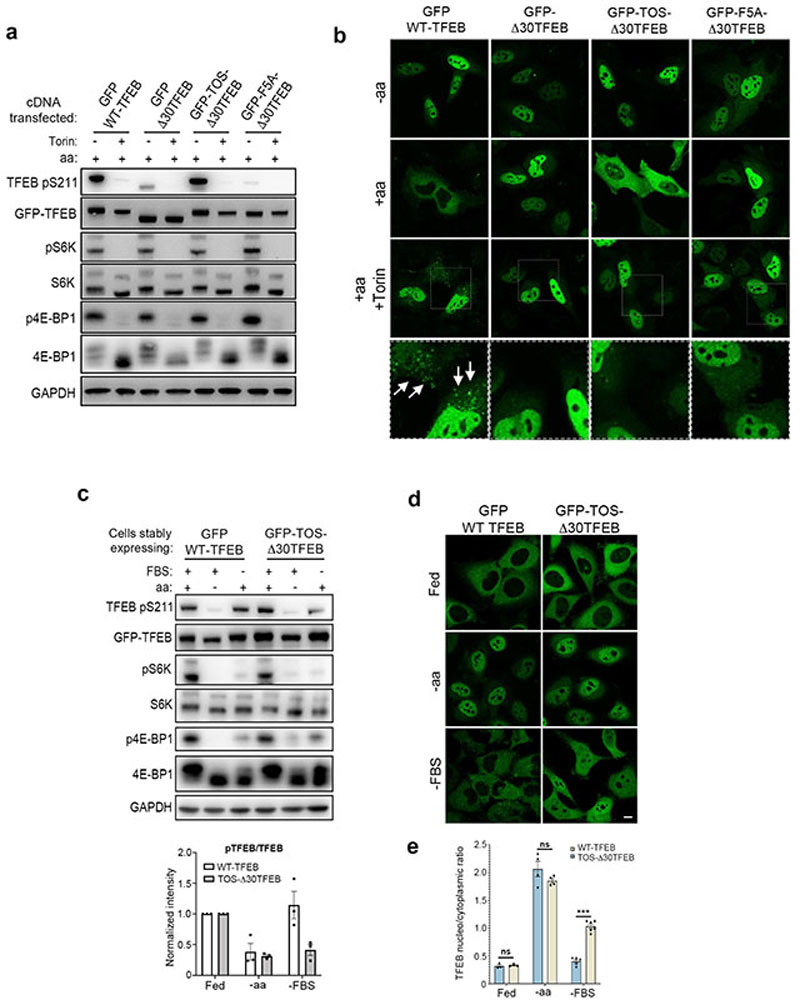
Next, we reasoned that substituting the first 30 amino acids of TFEB, which are required for its interaction with Rag GTPases and mTORC1-mediated phosphorylation (Ref26, Extended Data Fig. 5 and 6a,b), with the first 30 amino acids of S6K, which contain the TOS motif and mediate the interaction with mTORC1 subunit Raptor27,28 (Fig. 2c), would change the phosphorylation behaviour of TFEB, by making it similar to that of S6K. Consistent with our hypothesis, the TOS-Δ30TFEB chimera was able to interact with both mTOR and Raptor but not with Rag GTPases (Extended Data Fig. 5) and its phosphorylation and subcellular localization became sensitive to serum starvation (Extended Data Fig. 6c-e) and Rheb depletion (Fig. 2d-e), in addition to amino acid deprivation (Extended Data Fig. 6a,b). Furthermore, differently from wild type TFEB, the TOS-Δ30TFEB chimera failed to localize to lysosomes in Torin-treated cells (Extended Data Fig. 6b), supporting the idea that TFEB lysosomal localization is mediated by its interaction with Rag GTPases and not with Raptor. Together, these data indicate that the differences in the phosphorylation behaviour between TFEB and S6K are not due to the intrinsic properties of the analyzed phosphosites but are caused by different substrate recruitment mechanisms, which define the specificity of mTORC1-mediated metabolic responses to diverse nutritional cues.
TFEB phosphorylation requires active RagC/D
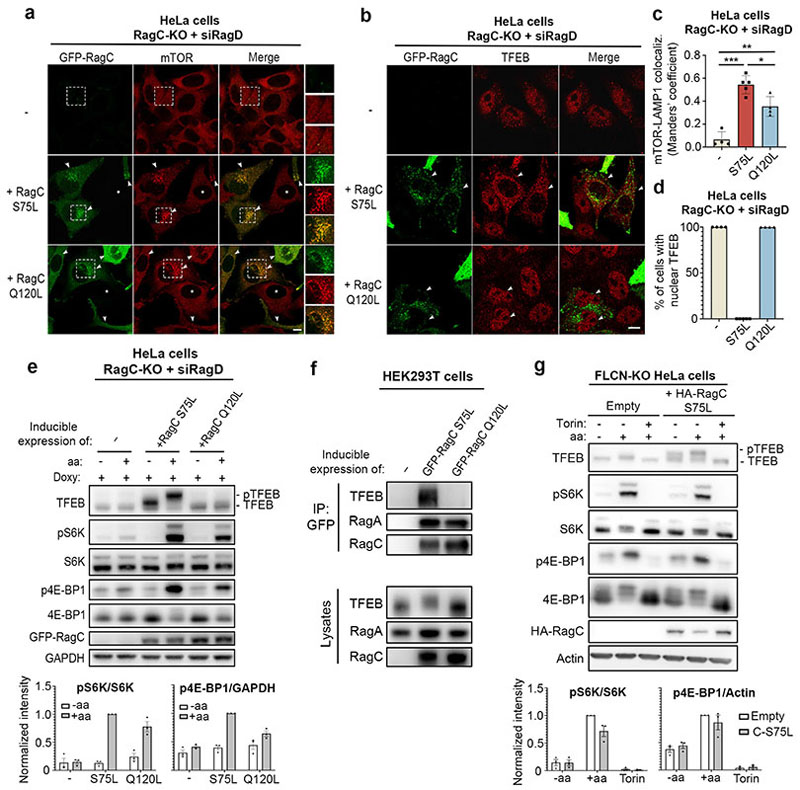
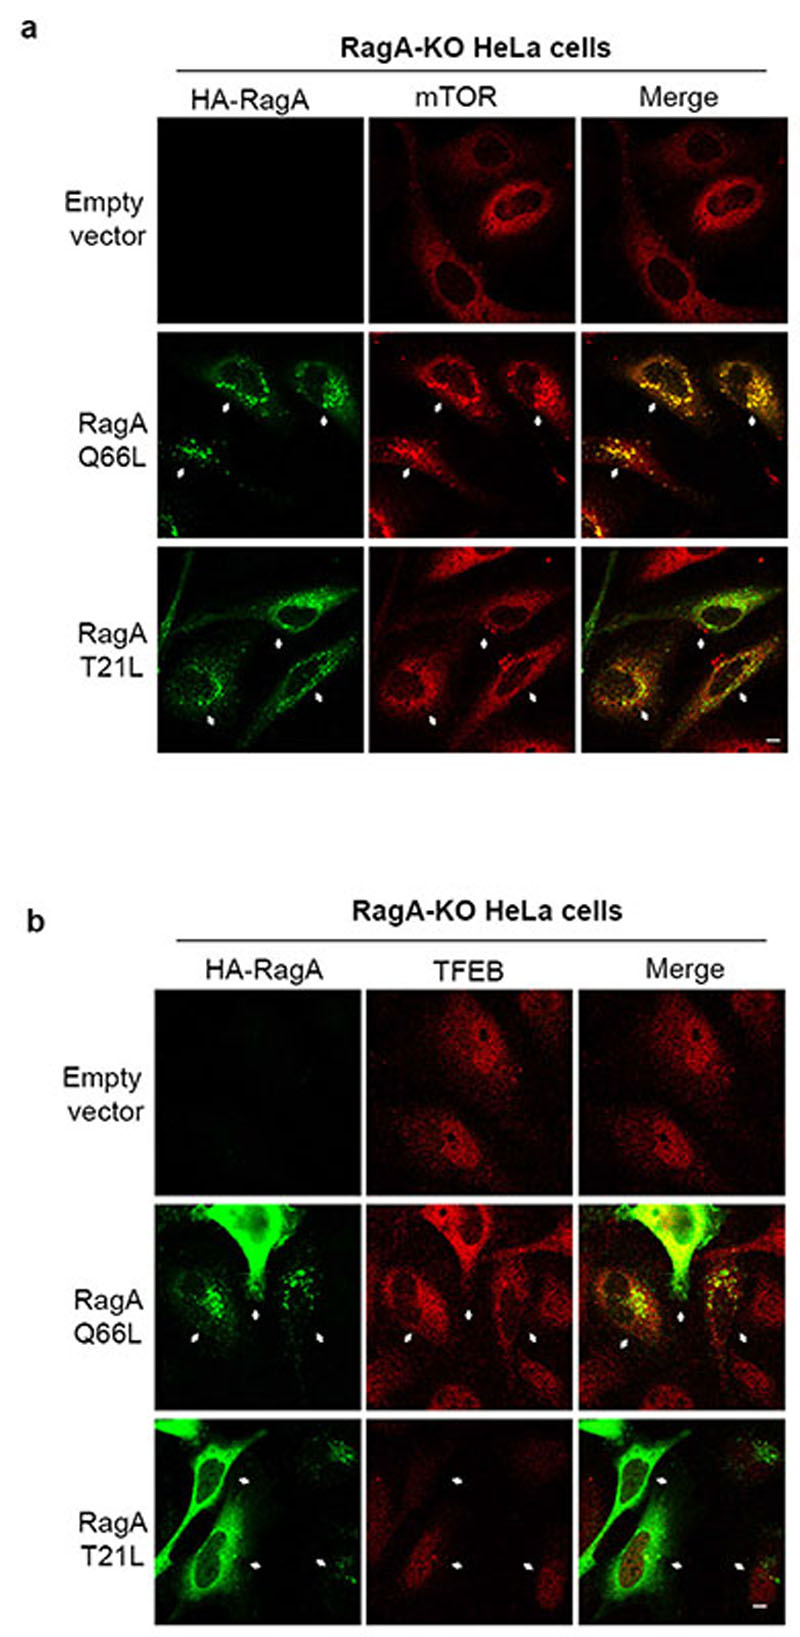
Considering the absolute dependence of TFEB phosphorylation on Rag GTPases, we evaluated whether Rag GTPase activation played a differential role in the phosphorylation of TFEB vs S6K and 4E-BP1. As expected, expression of an active (i.e. GTP-bound) RagAQ66L mutant in RagA KO cells restored mTORC1 lysosomal recruitment and promoted TFEB cytoplasmic localization, whereas inactive (i.e. GDP-bound) RagAT21L had no effect on either of them (Extended Data Fig. 7). However, activation of RagC had a differential effect on the localization of mTORC1 and TFEB. While only active (i.e. GDP-bound) RagCS75L induced TFEB cytoplasmic localization in RagC KO cells, both active RagCS75L and inactive (i.e. GTP-bound) RagCQ120L were able to significantly promote mTORC1 lysosomal localization (Fig. 3a-d and Extended Data Fig. 8a). Consistently, expression of active RagCS75L in RagC KO HeLa cells restored phosphorylation of both TFEB and S6K/4E-BP1 (Fig. 3e), whereas expression of inactive RagCQ120L was unable to rescue TFEB phosphorylation but was still able to promote significant phosphorylation of S6K and 4E-BP1 (Fig. 3e). Furthermore, co-immunoprecipitation experiments in HEK293T cells showed that TFEB was able to co-immunoprecipitate with active RagCS75L but unable to interact with inactive RagCQ120L (Fig. 3f).
Fig. 3. Activation of RagC has a differential effect on mTORC1 substrates.
a,b RagC KO HeLa cells were transfected for 24h with siRNA targeting RagD, treated with doxycycline for additional 48h to allow the inducible expression of either active (S75L) or inactive (Q120L) GFP-RagC and stained with mTOR (a) or TFEB (b) antibodies (replicated three times). Scale bar, 10 μm. c, Cells described in a were analyzed for mTOR-LAMP1 co-localization by calculating Manders’ co-localization coefficient. Results are mean ± SD. n=4 independent fields per condition. *P=0.0119; **P=0.001; ***P<0.0001. Tukey’s multiple comparisons test. d, Cells in (b) were quantified to calculate the percentage of cells showing TFEB nuclear localization. n=4 independent fields per condition. e, Cells as in a were subjected to amino acid (aa) starvation/refeeding (see Methods), analyzed by immunoblotting and quantified (mean ± SEM; n=3). f, Cell lysates from HEK293T cells with inducible expression of either active (S75L) or inactive (Q120L) GFP-RagC were incubated with GFP-beads and analyzed by immunoblotting (replicated three times). g, Representative immunoblotting and quantification (mean ± SEM; n=3) of FLCN KO HeLa cells transfected with control vector (empty) or RagCS75L and subjected to amino acid (aa) starvation/refeeding, in the presence or absence of 250 nM Torin.
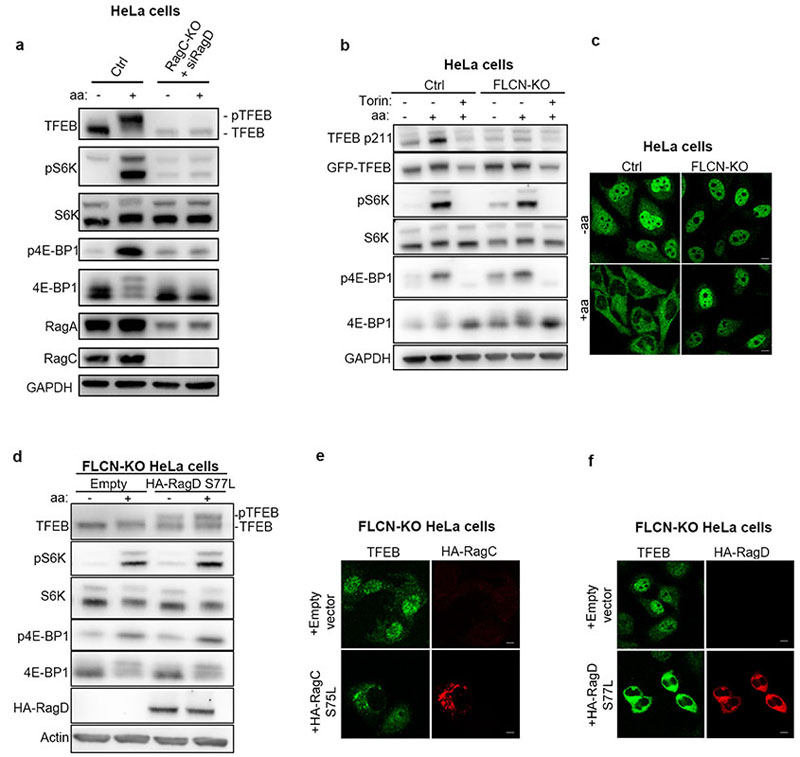
In line with these data, cells lacking FLCN, a specific GAP for RagC/D16–18, still showed phosphorylation of S6K and 4E-BP1 (Extended Data Fig. 8b), whereas TFEB was dephosphorylated and localized in the nucleus (Extended Data Fig. 8b,c). Importantly, expression of active RagCS75L or RagDS77L mutants in FLCN KO cells rescued TFEB phosphorylation (Fig. 3g and Extended Data Fig. 8d) and subcellular localization (Extended Data Fig. 8e,f). Together, these data suggest that an active RagA/inactive RagC dimer is unable to promote mTORC1 activity towards TFEB, whereas it retains, to a large extent, its ability to promote mTORC1 lysosomal recruitment and consequent phosphorylation of S6K and 4E-BP1.
TFEB drives the kidney phenotype of Flcn KO mice
Based on the previously described role of FLCN as a repressor of TFEB activity we postulated that the kidney phenotype of BHD syndrome, a disease caused by loss-of-function mutations of FLCN6,7, was due to TFEB activation. To test this hypothesis, we generated kidney-specific Flcn/Tfeb double KO mice (Flcnflox/flox; Tfebflox/flox; Ksp-Cre+) (Extended Data Fig. 9) and compared their phenotype to previously described kidney-specific Flcn-KO mice30,31.
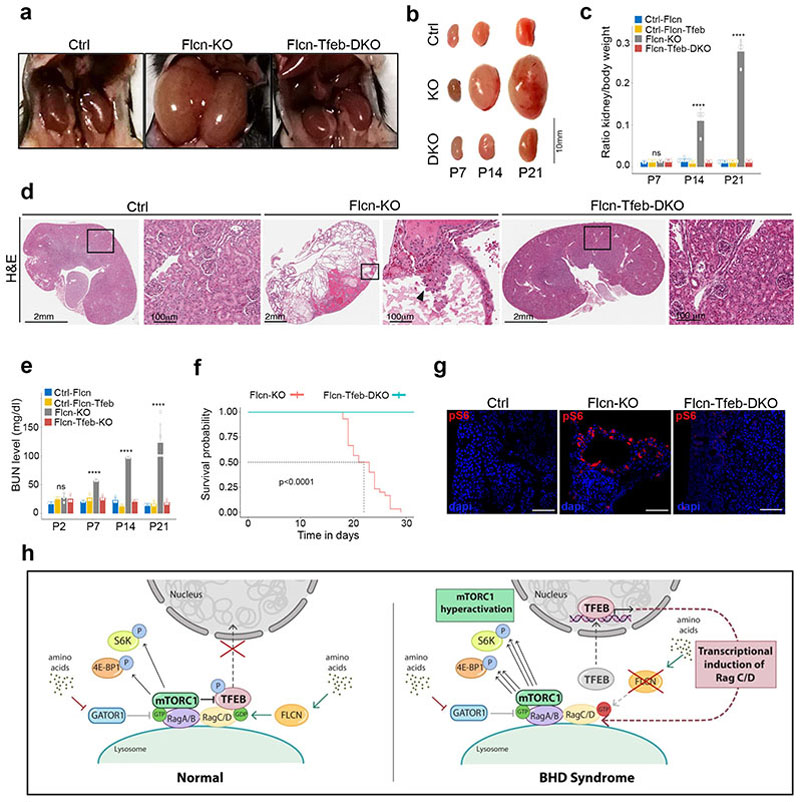
TFEBflox/flox;Ksp-Cre+ mice were viable and fertile and showed no apparent phenotypic abnormalities. As shown in previous reports, Flcnflox/flox;Ksp-Cre+ mice presented enlarged kidneys, which completely filled the abdominal cavity and were over twentyfold heavier than kidneys from control mice at p21 (Fig. 4a-c). Histological analysis revealed severe polycystic disease, associated with intracystic accumulation of colloid-like material and pre-neoplastic lesions (Fig 4d, Extended Data Fig. 10a). This phenotype was associated to a progressive increase in the levels of blood urea nitrogen (BUN) and premature death before 30 days of life in all mice (Fig. 4e,f). Kidney samples from these mice also showed increased nuclear localization of TFEB (Extended Data Fig. 10b,c) and highly enhanced mTORC1 signaling, as measured by both immunofluorescence and immunoblotting, whereas AMPK signaling was not affected (Fig. 4g, Extended Data Fig. 10d). Finally, the levels of RagC and RagD were increased, as well as the levels of other previously described TFEB targets (Extended Data Fig. 10d-f). Strikingly, the phenotype and associated signaling abnormalities of Flcn-KO mice were completely reverted in Flcn/Tfeb double KO mice, which were all indistinguishable from littermate controls without any instance of premature lethality up to 10 months of observation (Fig. 4f). These mice showed normal kidney size, morphology and histology, as well as normal BUN values and mTORC1 activity (Fig 4 a-e, g and Extended Data Fig. 10d). These results indicate that TFEB constitutive activation, as a result of FLCN loss of function, is a crucial determinant of the kidney phenotype associated to BHD syndrome.
Fig. 4. TFEB depletion rescues renal pathology and lethality in Flcn KO mice.
a, Abdominal cavities of Flcnflox/flox(Ctrl), Flcnflox/flox;Ksp-Cre+(Flcn-KO), and Flenllox/flox ; Tfebfox/nox; Ksp-Cre+(Flcn-Tfeb-DKO) mice at 21 days of age. b, Pictures of kidneys from the indicated mice at postnatal (p) day 7, 14, 21. c, Ratio of kidney to body weight for Flcn-KO, Flcn-Tfeb-DKO, Ficnflox/flox mice (Ctrl-Flcn) and Flcnflox/flox;Tfebflox/flox mice (Ctrl-Flcn-Tfeb) at the indicated time-points. One-Way ANOVA was applied for each time point (p=0.14 at p7, p=3.4e-07 at p14, p=9.3e- 14 at p21). For p-value < 0.05, a post-hoc Tukey was applied (significance for each comparison is provided in Methods section). At p7 n=3 for Ctrl-Flcn, Flcn-KO and Flcn-Tfeb-DKO, n=4 for Ctrl-Flcn-Tfeb; at p14 n=7 for Ctrl-Flcn, n=4 for Flcn-KO, n=3 for Ctrl-Flcn-Tfeb and Flcn-Tfeb-DKO; at p21 n=6 for Ctr-Flcn, n=4 for Flcn-KO, n=5 Ctrl-Flcn-Tfeb, n=3 for Flcn-Tfeb-DKO. Error bars represent s.d. d, Hematoxylin/eosin (H&E) of kidneys from Flcn-KO, Flcn-Tfeb-DKO and control mice at p21 (replicated three times). Scale bars, 2mm. Boxed areas are magnified on the right. Arrowhead indicates tubular papillary atypical hyperplasia. Scale bars, 100 μm. e, Blood urea nitrogen (BUN) levels of mice of the indicated genotypes/timepoints. Statistics was applied as in (c)(p=0.23 at p2, p=1.2e-05 at p7, p=1.9e-09 at p14, p=6.4e-04 at p21), N=3 mice for each genotype/timepoint. Error bars represent s.d. f, Kaplan-Meyer survival analysis of Flcn KO (N=30) and Flcn-Tfeb-DKO (N=29) mice. Two-sided log-rank test, p < 0.0001. Median survival time (dashed line) of Flcn-KO group is 22 days, g, Immunofluorescence of p-S6 in kidney sections from the indicated genotypes (replicated three times). Scale bars, 100 pm. h, model illustrating differential regulation of mTORC1 substrates in normal and BHD condition. Activation of Rag GTPases by amino acids leads to phosphorylation of S6K and 4E-BP1 and of TFEB, which is retained in the cytoplasm. In BHD syndrome loss of function of FLCN leads to TFEB nuclear translocation and mTORC1 hyperactivation.
Discussion
In this study, we show that diversity in mTORC1 substrate-recruitment mechanisms between TFEB and S6K/4E-BP1 results in different responses to specific nutritional inputs, such as amino acids and growth factors, hence enabling selective metabolic responses. The insensitivity of mTORC1-mediated TFEB phosphorylation to the growth factor-driven TSC/Rheb axis raises the question of how would mTORC1 be activated in the absence of Rheb. It is possible that the conformational change induced by Rheb, which acts as an allosteric activator of mTORC111, may favor accessibility and catalysis of some specific mTOR substrates, such as S6K and 4E-BP1, and may not be needed for others, such as TFEB.
Our data also indicate that the activity of FLCN, a RagC/D activator, is crucial for mTORC1-mediated phosphorylation of TFEB, whereas it is largely dispensable for the phosphorylation of S6K and 4E-BP1, consistent with previous studies17,32. The evidence shown here that inactive RagC is uncapable of binding TFEB but still able to promote lysosomal recruitment of mTORC1 (Fig. 3) provides a mechanistic explanation to these findings. This is also in line with recent structural data showing that mTORC1 interaction with the RagA/C dimer is largely mediated by Raptor-RagA interaction, whereas the nucleotide binding state of RagC has a lesser contribution towards Raptor recruitment33,34.
Overexpression of MiT-TFE genes, such as TFEB, leads to kidney cysts and renal cell carcinoma both in humans and mice35,36, a phenotype that is strikingly similar to that caused by loss of FLCN6. This prompted us to investigate whether TFEB loss-of-function rescued the phenotype of kidney-specific FLCN KO mice. Genetic depletion of TFEB resulted in a complete rescue of renal cyst formation and precancerous lesions, restoring normal kidney function and viability of kidney-specific FLCN KO mice (Fig. 4), indicating that TFEB activation is a key driver of the kidney phenotype of BHD syndrome. Whether or not TFEB also plays a role in other clinical manifestations of BHD syndrome, which affect different tissues, will be the subject of future studies.
BHD syndrome is associated to hyperactivation of mTORC130,31,37. This raises the question of how loss of function of FLCN, a positive regulator of mTORC116,38, can lead to mTORC1 hyperactivity. We found no major changes in the activity of AMPK, a negative regulator of mTORC1 and an interactor of the FLCN-FNIP complex37, in the kidneys from FLCN KO mice compared to controls (Extended Data Fig. 10d). We previously reported that TFEB promotes mTORC1 activity by transcriptionally regulating the levels of RagC/D GTPases25. Here we show that constitutive activation of TFEB in FLCN KO mice results in increased expression of Rag/CD GTPases (Extended Data Fig. 10d), which, albeit inactive in the absence of FLCN, are able to promote mTORC1 activity on S6K and 4E-BP1 but not on TFEB (Fig. 3), thus explaining the mTORC1 hyperactivity paradox of BHD syndrome. Although our data suggest that TFEB-induced mTORC1 hyperactivity is a key step in kidney cystogenesis and tumorigenesis, we cannot rule out the possibility that upregulation of other TFEB-induced pathways may also contribute to the phenotype of BHD syndrome. We previously reported significantly increased glycogenesis in muscle-specific TFEB overexpressing mice39 and similar findings were also reported in kidney-specific FLCN conditional KO mice40,41, suggesting that this pathway, which is downstream of FLCN and TFEB, may be an additional mechanism that contributes to BHD syndrome.
In summary, our study identifies a novel, substrate-specific, mTORC1 pathway that promotes kidney cystogenesis and tumorigenesis in BHD syndrome (Fig. 4h). Recently, we showed that other types of malignancies that are driven by MiT-TFE factors are associated with high levels of RagC/D expression and with mTORC1 hyperactivation25, suggesting that targeting this regulatory pathway may represent a promising therapeutic strategy for a variety of cancers.
Methods
Materials
Reagents used in this study were obtained from the following sources: Antibodies to RagC (Cat# 3360 - 1:1000 WB), RagA (Cat# 4357 - 1:1000 WB), RagD (# 4470 - 1:1000 WB) mTOR (Cat# 2983 - 1:1000 WB/ 1:100 IF) Phospho-p70 S6 Kinase (Thr389) (1A5) (Cat# 9206 - 1:1000 WB), p70 S6 Kinase (Cat# 9202 - 1:1000 WB), Rheb1 (Cat# 13879 - 1:1000 WB), 4E-BP1 (Cat# 9644 - 1:1000 WB), Phospho-4E-BPl (Ser65) (Cat# 9456 - 1:1000 WB), Raptor (24C12) (# 2280 - 1:1000 WB), human TFEB (Cat# 4240 - 1:1000 WB/ 1:100 IF), Tuberin/TSC2 (Cat# 4308 - 1:1000 WB), FLCN (# 3697 - 1:1000 WB), Phospho -ULK1 (# 6888 - 1:1000 WB), pan-ULK1 (# 8054 - 1:1000 WB), Phospho -AMPK (T172) (# 2535 - 1:1000 WB), anti-AMPK (# 2532 - 1:1000 WB), Phospho-S6 (# 5364 - 1:100 IF) and Myc-Tag (# 2276 - 1:1000 WB) were from Cell Signaling Technology; antibody to GFP (Cat# abl3970 1:2000 WB) was from Abeam; antibodies to GAPDH (6C5) (Cat# sc-32233 - 1:15000 WB), LAMP-1 (H4A3) (Cat# sc-20011 - 1:500 IF), LAMP-1 (1D4B) (Cat# sc-19992 - 1:200 IHC), Lamin B (Cat# sc-6216 -1:1000 WB) were from Santa Cruz; antibodies to FLAG M2 (Cat# F1804 - 1:1000 WB) and Actin (#A2228 - 1:5000 WB) were from Sigma Aldrich; antibody to HA.ll Epitope Tag (Cat# 901513 - 1:1000 WB) was from Biolegend; antibody to mouse TFEB (Cat# A303-673A - 1:1000 WB/ 1:200 IF) and RagD (A304-301A - 1:1000 WB) was from Bethyl laboratories; HRP-conjugated secondary antibodies to Mouse (Cat# 401215 - 1:5000 dilution) and Rabbit (Cat# 401315 - 1:5000 dilution) IgGs were form Calbiochem; Donkey anti-Rabbit IgG (H#+L) Alexa Fluor 488 (Cat# A-21206 - 1:500 dilution), Alexa Fluor 568 (Cat# A-10042 -1:500 dilution), Donkey anti-mouse IgG (H+L) Alexa Fluor 568 (Cat# A- 10037 - 1:500 dilution), Alexa Fluor 647 (Cat# A-31571 - 1:500 dilution), Alexa Fluor 594 (Cat# A-21203 - 1:500 dilution), Donkey anti-goat IgG (H+L) Alexa Fluor 647 (Cat# A-21447 - 1:500 dilution) were from Thermo Fisher Scientific; antibodies to TFEB-pS211 (used at 1:1000 WB) were custom generated in collaboration with Bethyl Laboratories.
Chemicals: Torin 1 (Cat# 4247) was from Tocris; Protease Inhibitor Cocktail (Cat# P8340) and puromycin (Cat# P9620) were from Sigma Aldrich; PhosSTOP phosphatase inhibitor cocktail tablets (Cat# 04906837001) were from Roche.
Cell cultures
Cells were cultured in the following media: HeLa in MEM (Cat# ECB2071L, Euroclone); HEK 293T, HEK293A and MEFs in DMEM high glucose (Cat# ECM0728L, Euroclone); U2OS in McCoy (Cat# 26600, Gibco); ARPE19 in DMEM-F12 (Cat# 11320033, Thermo Fisher Scientific). All media were supplemented with 10% inactivated FBS (Cat# ECS0180L, Euroclone), 2 mM glutamine (Cat# ECB3000D, Euroclone), penicillin (100 IU/mL) and streptomycin (100 μg/mL) (Cat# ECB3001D, Euroclone) and maintained at 37°C and 5% CO2. Control and RagA/B KO HEK293A cells were kindly provided by Kun-Liang Guan (University of California, San Diego). FLCN-KO HeLa cells were a kind gift of Zoltán Pierre Arany (University of Pennsylvania, Philadelphia, PA). HeLa cells stably expressing TFEB-GFP were previously described19. Cell lines stably expressing WT-TFEB-GFP, TOS-Δ30TFEB-GFP and S6K-GFP were generated using the Tol2 system as previously described42.
All cell lines were validated by morphological analysis and routinely tested for absence of mycoplasma.
Derivation of primary MEFs
Primary MEFs were derived from E13.5 pregnant mice. Embryos were washed in phosphate-buffered saline (PBS) and dissected by removing their placenta, head, limbs and gonads, tail and other visceral mass. Cells were then isolated by mechanical activity (chopping the tissue into fine pieces) and cultured in DMEM supplemented with 10% inactivated FBS, glutamine and antibiotics.
Generation of RRAGA and RRAGC KO in HeLa cell lines
HeLa full KO of the RRAGA and RRAGC genes were generate by using the CRISPr/Cas9 system. The gRNA sequences for each gene with low off-target score were selected by using the http://crispor.tefor.net/crispor.pv online tool. One gRNA was selected for each gene: CTCCCACGTCCGATTCCTA for the RRAGA gene and TCATGGGACTCCGGCGCAG for the RRAGC gene. The “ALL in One” vector containing each gRNA was obtained from SIGMA (CAS9GFPP). HeLa cells were electroporated by using the Amaxa system with the nucleofection kit (Cat No VCA-1003 from Lonza). GFP-positive cells were FACS sorted into 96 well plates to obtain single-cell derived colonies carrying the INDEL mutations. Upon genomic DNA extraction, the genomic sequence containing the targeted region were amplified by PCR reaction with the specific primers: hRAGAKOup TGCTGCTGATGGGGAAGAG, hRAGAKOlow TTTGGCGTCAGGAGAGTTCT, hRAGCKOup GCCGATTCGTTTCCAAAGGA, hRAGClow AGTGGAAGAGAAAGTGCGGA. PCR products were analyzed by DNA Sanger sequencing and cell clones carrying homozygous mutations introducing a premature stop codon (C.156DELC and c,196DELtcatgggactccggcgc for the RRAGA and RRAGC genes, respectively) were selected and expanded.
Plasmids
The plasmid encoding full–length TFEB-GFP was previously described (Settembre et al., 2011). pLJMl-Flag-Raptor wt (# 26633), pLJMl-Flag-Raptor-Rheb15 (# 26634), pRK5-HA GST RagA-Q66L (#19300), pRK5-HA GST RagA-T21L (#19299), pRK5-HA GST RagC-S75L (#19305) and pRK5-HA GST RagC-Q120L (# 19306) were a kind gift from David Sabatini (Addgene plasmids). pcDNA3-Flag-Rheb (# 19996) was a gift from Fuyuhiko Tamanoi (Addgene plasmid). pEGFP-Nl-delta30-TFEB was a gift from Shawn Ferguson (Addgene plasmid # 44445). pLVX-TETONE-GFP-RagC-S75L and pLVX-TETONE-GFP-RagC-Q120L inducible lentiviral plasmids were generated by standard cloning using the In-fusion HD cloning kit (#638920, Takara). pRK5-Flag-Raptor-OMP25 (Mit-Raptor) and pRK5-Myc-Rheb-OMP25 plasmids were a kind gift from Roberto Zoncu (University of California, Berkley). Tol2 plasmids for expression of TFEB-GFP, TOS-Δ30TFEB-GFP and S6K-GFP were generated by standard cloning. F5A-Δ30TFEB-GFP was generated by using QuikChange II-E Site-Directed Mutagenesis Kit (#200555, Agilent Technologies).
Cell treatments and protein knockdown
For experiments involving amino acid starvation, cells were rinsed twice with PBS and incubated for 60 min (unless stated otherwise) in amino acid-free RPMI (Cat# R9010-01, USBiological) or DMEM (Cat# MBS6120661) supplemented with 10% dialyzed FBS. Serum was dialyzed against lx PBS through 3500 MWCO dialysis tubing to ensure absence of contaminating amino acids. For amino acid re-feeding, cells were re-stimulated for 30 min with 1× water-solubilized mix of essential (Cat#l 1130036, Thermo Fisher Scientific) and non-essential (Cat# 11140035, Thermo Fisher Scientific) amino acids re-suspended in amino acid-free RPMI or DMEM supplemented with 10% dialyzed FBS, plus glutamine. For serum starvation, cells were washed twice with PBS, incubated with culture medium containing 10% dialyzed FBS for 16h, then washed twice with PBS and incubated with FBS-free culture medium for the indicated time points. Where reported, cells were incubated with 250 nM Torinl during either starvation or re-stimulation.
For siRNA-based experiments, cells were transfected using Lipofectamine® RNAiMAX Transfection Reagent (#13778, Invitrogen) with the indicated siRNAs and analyzed after 72 hours unless stated otherwise.
The following siRNAs were used: siRNA Rheb1 I (#14267), siRNA mTOR I (#6381), siRNA mTOR II (#6556) were from Cell Signaling; Human RRAGD siRNA (L-016120-00) and non-targeting siRNA Pool (D-001810-10-05) were from Dharmacon. Other siRNA: RhebL1 siRNA: GAUAGUGACUCUUGGCAAATSC2 siRNA: GCUGUUACCUCGACGAGUARRAGC siRNA:GUCUGAUGAUCACAAAAUA; GGAGCAUUGAUAUACGUCA; CAACUUCCACUGUUUCCGA were synthesized form Sigma Aldrich.
Mammalian lentiviral production and transduction
Lentiviruses were produced by transfection of HEK293T cells with pLJM1 Flag-Raptor-Rheb15, pLVX-TETONE-RagC-S75L or pLVX-TETONE-RagC-Q120L constructs in combination with the pCMV-VSV-G and pCMV-ΔR8.2 packaging plasmids using Lipofectamine 2000 transfection reagent (Invitrogen). Five hours post transfection, medium was changed to DMEM supplemented with 10% FBS. Forty-eight hours later, virus-containing supernatants were collected, passed through a 0.45 μm filter to eliminate cell debris and used for infection in the presence of 5 μg/ml polybrene (Cat# tr-1003-G, EMD Millipore). 24 hours later, cells were selected with puromycin.
Cell lysis, western blotting and immunoprecipitation
Cells were rinsed once with PBS and lysed in ice-cold lysis buffer (250 mM NaCl, 1% Triton, 25mM Hepes pH 7.4) supplemented with protease and phosphatase inhibitors. Total lysates were passed 10 times through a 25-gauge needle with syringe, kept at 4°C for 10 min and then cleared by centrifugation in a microcentrifuge (14,000 rpm at 4°C for 10 min). Protein concentration was measured by Bradford assay.
For immunoprecipitations, cells grown in 10cm culture dishes were washed twice with cold PBS and then incubated with 1mg/mL DSP (dithiobis(succinimidyl propionate)) (Cat#22586, Thermo Fischer Scientific) crosslinker for 7 minutes at room temperature. The cross-linking reaction was quenched by adding Tris-HCl (pH 8.5) to a final concentration of 100 mM. Cells were rinsed twice with ice cold PBS and lysed with RIPA lysis buffer (40 mM Hepes pH 7.4, 2mM EDTA, 1% NP-40, 1% sodium deoxycholate and 0.1% SDS) supplemented with protease and phosphatase inhibitors. Cell lysates were then incubated with anti-GFP trap agarose beads (Cat# gta-20, Chromotek) or M2-Flag beads (Sigma) at 4°C, washed six times, resolved by SDS-polyacrylamide gel electrophoresis on 4%-12% Bis-Tris gradient gels (Cat# NP0323PK2 NuPage, Thermo Fischer Scientific) and analyzed by immunoblotting with the indicated primary antibodies.
Quantification of western blotting was performed by calculating the intensity of phosphorylated and total proteins by densitometry analysis using the Fiji software. The ratios between the values of phosphorylated and total proteins were normalized to a control condition for each experiment.
Generation of constructs for recombinant expression of RagA-RagC-TFEB and derived mutants
Secondary structure prediction highlighted that TFEB is predominantly disordered, with the exceptions of the N-terminal region, the helix-loop-helix and the leucine zipper domains present in the center of the protein. In order to stabilize full length TFEB during expression and purification, we have developed a strategy where TFEB and the Rag GTPases are simultaneously expressed. We have used the LAMTOR-RagA-RagC baculoviral construct previously described43 and subcloned the codon optimized RagA (Q7L523.1), and RagC (Q9HB90.1) open reading frames (ORFs) flanked by individual promoter and terminator signals into pACEBacl. An N-terminal 6x-histidine-tag was subsequently introduced upstream of the RagA ORF. We designed a synthetic gene corresponding to the TFEB ORF (PI9484) tagged C-terminally with tandem STREP, codon optimized for expression in Spodoptera frugiperda and flanked by unique restriction sites. The TFEB insert was chemically synthesized by GeneArt AG, Life Technologies and was then subcloned into the multiple cloning site of the pACEBacl acceptor vector containing RagA-RagC.
The RagAQ66L-RagCS75N-TFEB and RagAT21N-RagCQ120L-TFEB were generated by site directed mutagenesis using the above-described construct as template.
Protein expression and purification
The initial recombinant baculoviruses were amplified and used for induction of protein expression by infecting cells at a density of 0.5–1.0×l06 cells/mL. Infection was performed with amplified virus stock at a multiplicity of infection (MOI) >1. 72 to 96 hours after infection, cells were collected by centrifugation, washed in PBS and drained pellets were frozen in liquid nitrogen and stored at -80°C until use. In brief, complexes were purified by metal chelate affinity purification followed by size exclusion chromatography (SEC). The cell pellet was resuspended in lysis buffer containing 50mM Tris pH 8.0, 300mM NaCl, 2mM MgCl2, 0.5mM TCEP, 0.05% triton X-100 and 20mM imidazole and flash frozen in liquid nitrogen. After thawing the cells, the lysate was supplemented with protease inhibitors and cleared by centrifugation at 16,000×g and 4°C for 30min. For the control samples, the obtained lysates were bound to a STREP-TRAP column to remove all TFEB and any associated Rags prior to the subsequent steps. The flow-through of these samples was then added to equilibrated Ni-NTA beads and incubated at 4°C for 2:30h on a rotating wheel. Beads were washed with 30 times the beads volume of lysis buffer and eluted in 50mM Tris pH 8.0, 300mM NaCl, 2mM MgCl2, 0.5mM TCEP, 0.05% triton X-100 and 250mM imidazole. The sample was immediately loaded on a Superdex 200 prep column equilibrated in 50mM Tris pH 8.0, 300mM NaCl, 2mM MgCl2, 0.5mM TCEP, 0.05% triton X-100. The fractions containing the Rag GTPases-TFEB complex were pooled, concentrated, analyzed by SDS-PAGE and visualized by Coomassie.
Kidney nuclear/cytosolic fractionation
Kidneys were homogenized by using a tissue grind pestle in in cytosol isolation buffer (250 mM sucrose, 20 mM HEPES, 10 mM KCl, 1.5 mM MgC12, 1 mM EDTA, 1 mM EGTA) supplemented with protease and phosphatase inhibitor cocktails (Complete and PhosSTOP Roche, Roche Diagnostics, Basel, Switzerland). Then samples were centrifuged at 1,000 g for 10 min at 4°C to pellet the nuclei and the supernatant (cytosolic fraction) re-centrifuged twice at 16,000 g for 20 min at 4°C to pellet the mitochondria and debris. Nuclei pellets were washed with PBS and centrifuged at 800g for 10 minutes for three times, then re-suspended in nuclear lysis buffer (1.5 mM MgC12, 0.2 mM EDTA, 20 mM HEPES, 0.5 M NaCl, 20% glycerol, 1% Triton X-100) supplemented with protease and phosphatase inhibitor cocktails and incubated on ice for 30 min (vortexed every 10 minutes) and then sonicated 5 frequency ~ 10 s (for 3 times). Finally, samples were centrifuged for 15 min at 16,000 g and the supernatant containing the enriched nuclear fraction collected.
Confocal microscopy
Immunofluorescence experiments were performed as previously described44 Cells were grown on 8-well Lab-Tek II - Chamber Slides, treated as indicated, and fixed with 4% parafolmaldehyde (PFA) for 10 minutes at RT. Blocking was performed with 3% bovine serum albumin in PBS + 0.02% saponin for 1 hour at RT. For endogenous TFEB staining, cells were also permeabilized with 0.1% Triton X-100 for 5 minutes after PFA fixation and prior to blocking solution incubation to allow visualization of the nuclear signal. Immunostainings were performed upon dilution of primary antibodies in blocking solution and overnight incubation at 4C, followed by three washes and secondary antibody incubation in blocking solution for 1 hour at RT. After additional three washes, coverslips were finally mounted in VECTASHIELD® mounting medium with DAPI and analyzed using LSM 800 or LSM 880 + Airyscan systems (Carl Zeiss), with a Plan-Apochromat 63×/1.4NA M27 oil immersion objective using immersion oil (#518F, Carl Zeiss) at room temperature. The microscopes were operated on the ZEN 2013 software platform (Carl Zeiss). After calculation of processing for the airyscan, images were processed in the ImageJ 1.47v. Mander‘s Colocalization Coefficients (MCC) was calculated using JACoP Imagej Plugin.
For analysis of nuclear/cytosolic TFEB ratios, a dedicated script was developed using the Columbus software; Perkin-Elmer. The script calculates the ratio value resulting from the average intensity of nuclear TFEB–GFP fluorescence divided by the average of the cytosolic intensity of TFEB–GFP fluorescence, p-values were calculated on the basis of mean values from independent fields.
RNA extraction, reverse transcription and quantitative PCR
RNA samples from cells were obtained using the RNeasy kit (Qiagen) and RNA samples from mouse kidneys were extracted using RNeasy plus Mini kit (Qiagen) according to the manufacturer’s instructions. cDNA was synthesized using QuantiTect Reverse Transcription kit (Qiagen). Real-time quantitative RT-PCR on cDNAs was carried out with the LightCycler 480 SYBR Green I mix (Roche) using the Light Cycler 480 II detection system (Roche) with the following conditions: 95°C, 5 min; (95°C, 10 s; 60°C, 10 s; 72°C, 15 s) x 40. Fold change values were calculated using the DDCt method. Briefly, internal controls (HPRT1 or B2M for cell samples and Cyclophilin or S16 for mouse samples) were used as ‘normalizer’ genes to calculate the DCt value. Next, the DDCt value was calculated between the ‘control’ group and the ‘experimental’ group. Lastly, the fold change was calculated using 2(-DDCt). Biological replicates were grouped in the calculation of the fold change values.
Mouse models
All mice used were maintained in a C57BL/6 strain background.
The mouse line for conditional deletion of Tfeb (Tfeb flox/flox) was previously described19. The mouse line for conditional deletion of Flcn (Flcnflox/flox) and Cadherin 16-Cre (Ksp-Cre) were previously described31,45 and acquired from Jackson Laboratories.
Survival curves were calculated for a period of 30 days (lethality time-frame for kidney-specific Flcn-KO mice) on 30 Flcn flox/flox ; Ksp-Cre mice and 15 Flcn flox/flox ;Tfeb flox/flox ; Ksp-Cre grown in the same animal facility, all in same background (C57BL/6). Values were plotted by the product-limit method of Kaplan and Meier; statistical analyses were carried out applying the Log Rank test.
To anayze serum blood urea nitrogen, blood was collected from mice at p2 from submandibular plexus, and from mice at p7, p 14 and p21 from retro orbital plexus. Serum blood urea nitrogen content was measured by an ammonia colorimetric assay (BioVision Incorporated; Cat# K370-100) according to the manufacturer‘s instructions.
Histopathological analysis was conducted on formalin-fixed, paraffin-embedded kidney sections (3um) stained with hematoxylin and eosin (HE) and images captured by using ImageScope (Leica-Biosystems Nussloch GmbH).
For immunohistochemical analysis of LAMP-1, formalin-fixed, paraffin-embedded kidney sections (6μm) were analyzed by using the Vectastain ABC kit (Vector Labs) following the manufacturer‘s instructions. Signal was developed using 0.05% 3,3-diaminobenzidine tetrahydrochloride in 0.02% H202.
For staining of P-S6 and of Tfeb on kidney sections, OCT-embedded sections were cut at 7 urn, blocked and permeabilized in 3% (wt/vol) BSA, 5% goat serum in PBS + 0.3% Triton X-100 for 3 h and then were incubated with the primary antibody overnight. Finally sections were washed three times with 3% BSA in PBS + 0.3% Triton X-100 and then incubated for 1 h with secondary antibodies Alexa Fluor-conjugated. Sections were mounted in VECTASHIELD® mounting medium with DAPI and analyzed using LSM 800 (Carl Zeiss).
To minimize variability, mice belonging to the same litter were grouped based on their genotype. All procedures on mice were approved by Italian Ministry of Health with the authorization code 240/2019. Mice were housed at the TIGEM animal house (Pozzuoli (NA), Italy).
Statistical analysis
One-way ANOVA and Tukey‘s post-hoc tests were performed when comparing more than two groups relative to a single factor.
Tukey multiple pairwise-comparisons for Relative ratio of kidney to body weight: at p14, Flcn-KO vs Ctrl-Flcn p=4.9e-07, Flcn-KO vs Ctrl-Flcn-Tfeb p=3.04e-06, Flcn-KO vs Flcn-Tfeb-DKO p=3.6e-06, Flcn-Tfeb-DKO vs Ctrl-Flcn-Tfeb p=0.99; at p21, Flcn-KO vs Ctrl-Flcn p=1.08e-13, Flcn-KO vs Ctrl-Flcn-Tfeb p=1.09e-13, Flcn-KO vs Flcn-Tfeb-DKO p=1.8e-12, Flcn-Tfeb-DKO vs Ctrl-Flcn-Tfeb p=0.99.
Tukey multiple pairwise-comparisons for Blood urea nitrogen (BUN): at p7, Flcn-KO vs Ctrl-Flcn p= l,2e-05, Flcn-KO vs Ctrl-Flcn-Tfeb p=6.5e-05, Flcn-KO vs Flcn-Tfeb-DKO p=6.5e-05, Flcn-Tfeb-DKO vs Ctrl-Flcn-Tfeb p=0.99; at p14, Flcn-KO vs Ctrl-Flcn p= l,1e-08, Flcn-KO vs Ctrl-Flcn-Tfeb p= 5,4e-09, Flcn-KO vs Flcn-Tfeb-DKO p=9.8e-09, Flcn-Tfeb-DKO vs Ctrl-Flcn-Tfeb p=3.7e-02; at p21, Flcn-KO vs Ctrl-Flcn p=1.3e-03, Flcn-KO vs Ctrl-Flcn-Tfeb p=1.4e-03, Flcn-KO vs Flcn-Tfeb-DKO p=1.7e-03, Flcn-Tfeb-DKO vs Ctrl-Flcn-Tfeb p=0.99.
Two-way ANO VA and Sidak‘s or Dunnett’s post-hoc tests were performed when comparing differences between groups that have been split on two factors. Log Rank test was used for the survival analysis. p<0.05 was considered significant.
Extended Data
Extended Data Fig. 1. TFEB phosphorylation is insensitive to serum starvation.
a, HeLa cells stably expressing GFP-TFEB were starved of serum (FBS) for 2h in the presence or absence of 250nM Torin and analyzed by immunoblotting with the indicated antibodies (replicated twice). b-f HeLa (b,c), U2OS (d,e) or primary mouse embryonic fibroblasts (MEFs, f) were starved of amino acids (aa) or serum (FBS) for 2h and then analyzed by immunoblotting for the indicated proteins (b,d,f) or by immunofluorescence to assess TFEB subcellular localization (c,e) (replicated twice). Scale bars, 10 μm. g, HeLa cells stably expressing GFP-TFEB were either starved of amino acids (-aa) or serum (-FBS) for 8h and subjected to qRT-PCR (replicated twice). Relative mRNA levels of the indicated genes were normalized to HPRT levels and expressed as fold-change relative to control (Fed) samples. Results are mean ± SEM; n=3; *P<0.05 (GBA: -aa p=0.0322); ***P<0.001 (FLCN: -aa p<0.0001; RRAGC: -aa p<0.0001; RRAGD: -aa p<0.0001; ATP6V01H: -aa p=0.0004; CTNS: -aa p<0.0001; SQSTM1: -aa p<0.0001; NPC1: -aa p<0.0001; MCOLN1: -aa p<0.0001); ns, non-significant (FLCN: -FBS p=0.8619; RRAGC: -FBS p=0.99; RRAGD: -FBS p=0.2558; ATP6V01H: -FBS p=0.9890; CTNS: -FBS p>0.9999; SQSTM1: -FBS p=0.9270; GBA: -FBS p=0.9359; NPC1: -FBS p=0.1933; MCOLN1: -FBS p=0.7916). Dunnett’s multiple comparisons test.
Extended Data Fig. 2. TFEB phosphorylation is insensitive to the Rheb/TSC axis.
a-c, HeLa (a), HEK293T (b) or ARPE19 (c) cells were transfected with either siRNA targeting both Rheb1 and RhebL1 or with scramble siRNA. 72h after transfection cells were either starved of amino acids (aa) for 60 min or starved and re-stimulated with amino acids for 30 min, in the presence or absence of 250 nM Torin, and analyzed by immunoblotting with the indicated antibodies (replicated twice). d, HeLa cells stably expressing GFP-TFEB were transfected with siRNA targeting either Rheb1/RhebL1 (siRheb1/L1), mTOR (simTOR), or control siRNA (siCtrl) for 72h and subjected to qRT-PCR (replicated three times). Relative mRNA levels of the indicated genes were normalized to HPRT levels and expressed as fold-change relative to control (siCtrl) samples. Results are mean ± SEM; n=3; *P<0.05 (MCOLN1: siRheb p=0.0212); ***P<0.001 (FLCN: simTOR p<0.0001; RRAGC: simTOR p<0.0001; ATP6V01H: simTOR p<0.0001; Neu1: siRheb p<0.0001; Neu1: simTOR p<0.0001; GBA: simTOR p<0.0001; NPC1: simTOR p<0.0001; MCOLN1: simTOR p<0.0001); ns, non-significant (FLCN: siRheb p=0.9908; RRAGC: siRheb p=0.6937; ATP6V01H: siRheb p=0.0714; SQSTM1: siRheb p=0.2846; SQSTM1: simTOR p=0.0528; GBA: siRheb p=0.0597; NPC1: siRheb p=0.7753). Dunnett’s multiple comparisons test. e, HEK293A cells stably expressing GFP-TFEB, transfected with either empty vector or with increasing amounts of Flag-Rheb, were either left untreated or starved of amino acids (aa) for 60 min and analyzed by immunoblotting (replicated three times).
Extended Data Fig. 3. Rag GTPases are required for TFEB phosphorylation.
a, HeLa cells stably expressing GFP-TFEB were transfected with siRNAs targeting RagC/D or with a control siRNA (siCtrl). 72h after transfection, cells were either starved for amino acids (aa) for 60 min or starved and re-stimulated with amino acids for 30 min in the presence or absence of Torin and analyzed by immunoblotting using the indicated antibodies (replicated three times). b, Immunofluorescence analysis of TFEB localization in HeLa cells stably expressing GFP-TFEB and transfected with a RagC/D-targeting siRNA or with control siRNA (siCtrl) and after 48 hours with empty vector (left panels), HA-RagC or HA-RagD (right panels). Cells were either starved for amino acids for 60 min (-aa) or starved and then re-stimulated with amino acids for 30 min (+aa) (replicated three times). Scale bar, 10 μm.
Extended Data Fig. 4. mTORC1 constitutive activation requires Rag GTPases for TFEB phosphorylation.
a,b, GFP immunoprecipitates were prepared from HEK293A cells stably expressing GFP-TFEB (a) or GFP-S6K (b) and analyzed by immunoblotting for the indicated proteins (replicated three times). c,d, HEK293T cells (c) or HeLa cells stably expressing GFP-TFEB (d) were transduced with lentiviruses expressing Lys-Raptor or with control lentiviruses and transfected with siRNA targeting both RagC/D (siRagC/D) or with scramble siRNA (siCtrl). 72h after transfection, cells were either starved of amino acids (aa) for 60 min or starved and re-stimulated with amino acids for 30 min and analyzed by immunoblotting using the indicated antibodies (replicated three times). e,f, HEK293T cells (e) or HeLa cells stably expressing GFP-TFEB (f) transiently expressing the indicated combinations of mitochondria-targeted Raptor (Mit-Raptor: Flag-Raptor-OMP25) and Rheb (Mit-Rheb: Myc-Rheb-OMP25) were starved of amino acids (aa) for 60 minutes or starved and restimulated with amino acids for 30 min and analyzed by immunoblotting using the indicated antibodies (replicated three times). g, HeLa cells stably expressing GFP-TFEB were transfected and treated as in f and analyzed by immunofluorescence for the indicated proteins. GFP-TFEB was pseudo-colored to magenta to allow better visualization of mTOR/Raptor-OMP25 staining (replicated three times). Scale bar, 10 μm.
Extended Data Fig. 5. The mTORC1-substrate recruitment mechanism of TFEB is determined by its N-terminal region.
HeLa cells were transiently transfected with plasmids expressing either GFP alone or GFP-tagged versions of the following proteins: WT TFEB (GFP-WT-TFEB), a TFEB deletion mutant lacking the first 30 amino acids (GFP-Δ30-TFEB), a chimeric protein in which the first 30 amino acids of S6K, containing the TOS motif, were fused to the Δ30-TFEB mutant (GFP-TOS-Δ30TFEB), or the TOS-Δ30TFEB chimeric protein in which a key phenylalanine residue (F5) of the TOS motif was mutagenized to alanine (GFP-F5A-Δ30TFEB). 24h after transfection cell lysates were incubated with GFP-beads and subjected to immunoblotting using the indicated antibodies (replicated three times).
Extended Data Fig. 6. Addition of a TOS motif to a Rag-binding deficient TFEB mutant rescues its phosphorylation and subcellular localization.
a,HeLa cells transiently expressing the cDNAs described in Extended Data Fig. 5 were starved of amino acids (aa) for 60 min and re-stimulated with aa for 30 min, in the presence or absence of 250nM Torin, and analyzed by immunoblotting using the indicated antibodies (replicated three times). b, Cells described in a were either starved of amino acids (aa) for 60 min or starved and re-stimulated with amino acids for 30 min, in the presence or absence of Torin, and analyzed for TFEB subcellular localization by immunofluorescence (replicated twice). c, Representative immunoblotting and quantification (mean ± SEM; n=3) of HeLa cells stably expressing GFP-WT-TFEB or a chimeric plasmid in which the first 30 aa of TFEB were substituted with the first 30 aa of S6K containing the TOS motif (GFP-TOS-Δ30TFEB). Cells were either kept fed, starved of amino acids (-aa) or serum (-FBS) for 2h. d, Cells described and treated as in c were analyzed by immunofluorescence to assess TFEB subcellular localization (replicated three times). Scale bar, 10 μm. e, Analysis of TFEB localization performed using a dedicated script (Columbus software; Perkin-Elmer) that calculates the ratio value resulting from the average intensity of nuclear TFEB-GFP fluorescence divided by the average of the cytosolic intensity of TFEB–GFP fluorescence. Results are mean ± SEM. p-values were calculated on the basis of mean values from 3 or 4 independent fields (Sidak's multiple comparisons test). ***P<0.0001; ns: non-significant (Fed: P=0.9989; -aa: P=0.0946).
Extended Data Fig. 7. Activation of RagA is essential for mTOR lysosomal recruitment and TFEB cytosolic localization.
a,b Representative immunofluorescence images of endogenous mTOR (a) and endogenous TFEB (b) upon transfection of a construct encoding active (RagAQ66L) or inactive (RagAT21L) HA-tagged RagA or an empty vector in RagA-KO HeLa cells. Cells were deprived of amino acids for 50 min and then stimulated with amino acids for 15 min. Scale bars, 10 μm.
Extended Data Fig. 8. TFEB phosphorylation and cytosolic retention requires active RagC/D.
a, RagC-KO HeLa cells were transfected with RagD-targeting siRNA (siRagD) for 72h, then either starved of amino acids (aa) for 60 min or starved and re-stimulated with amino acids for 30 min and analyzed by immunoblotting using the indicated antibodies (replicated three times). b, Fien KO and control HeLa cells overexpressing TFEB-GFP construct were either starved of amino acids (aa) for 60 min, or starved and re-stimulated with amino acids for 30 min in the presence or absence of 250nM Torin, and then analysed by immunoblotting with the indicated antibodies (replicated three times). c, Immunofluorescence analysis representative of triplicate experiments of TFEB in FLCN KO and control HeLa cells kept in amino acid deprived medium (-aa) or re-stimulated lx amino acid containing medium (+aa). Scale bars, 10 μm. d FLCN KO HeLa cells transfected with empty vector or with constitutively active RagC (RagDS75L) were either starved of amino acids (aa) for 60 min, or starved and re-stimulated with amino acids for 30 min, and analyzed by immunoblotting with the indicated antibodies (replicated three times). e,f Flcn KO Hela cells transfected with empty vector or constitutively active RagC (RagCS75L) (d) or constitutively active RagD (RagDS77L) (e) and kept in basal medium were immunostained with the indicated antibodies (replicated three times). Scale bars, 10 μm.
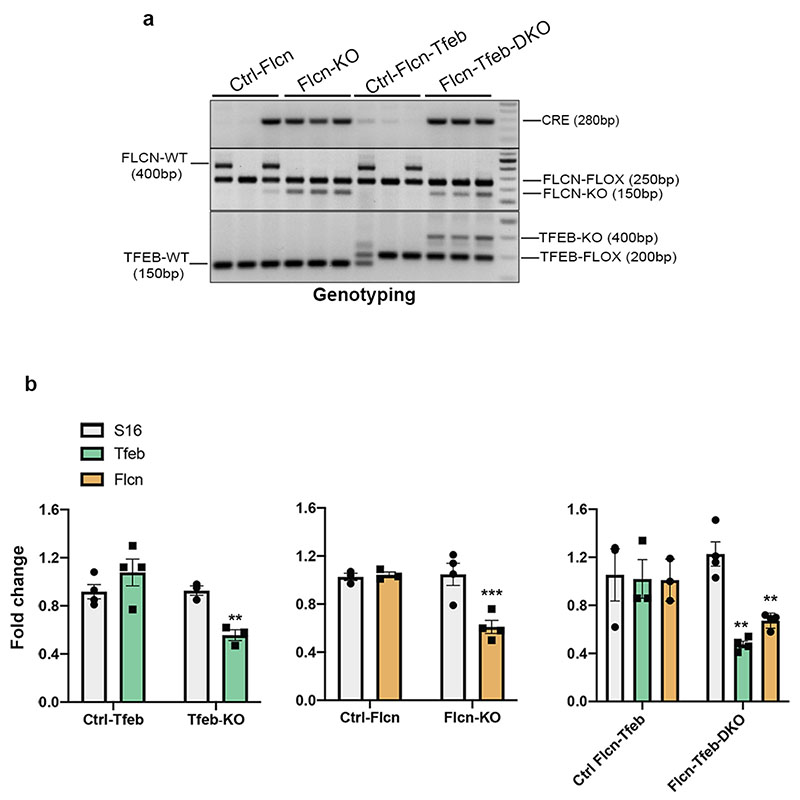
Extended Data Fig. 9. Genomic and mRNA analysis of transgenic mouse lines.
a, PCR analysis of genotypes from kidney samples of mice Flcnflox/flox;Ksp-Cre+ (Flcn-KO) mice and Ficnflox/flox;Tfebflox/flox; Ksp-Cre+ (Flcn-Tfeb-DKO) mice and corresponding controls (replicated three times). In detail, genotypes of Ctrl-Flcn mice were the following: Flcnflox/+-Flcnflox/flox-Flcnflox/+;Ksp-Cre+. Genotypes of Ctrl-Flcn-Tfeb mice were the following: Flcnflox/+; Tfebflox/+-Flcnflox/flox; Tfebflox/flox - Flcnflox/+; Tfebflox/flox. b, mRNA levels of the indicated genes in Tfebflox/flox;Ksp-Cre+ (Tfeb-KO), Flcnflox/flox;Ksp-Cre+ (Flcn-KO), Flcnflox/flox;Tfebflox/flox;Ksp-Cre+(Flcn-Tfeb-DKO) and corrispondent control mice at P2 of age. Bars represent means ± SEM for each group and are expressed as fold change compared with control mice normalized to cyclophilin gene expression (**=p < 0.01, ***p < 0.001 two-sided Student t test). S16 expression was shown as control unrelated gene. (n= Ctrl-Tfeb; n=3 Tfeb-KO; n3 Ctrl-Flcn; n=4 Flcn-KO; n=3 Ctrl-Flcn-Tfeb; n=4 Flcn-Tfeb-DKO).
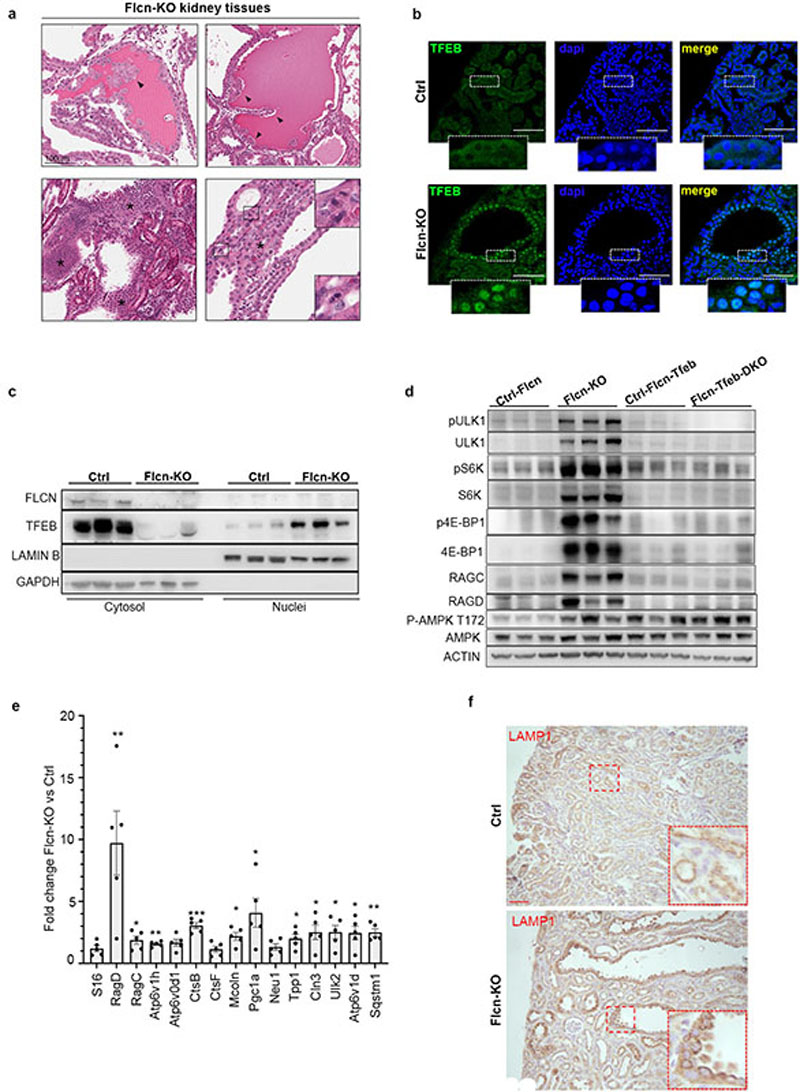
Extended Data Fig. 10. TFEB is constitutively nuclear and active in Flcn-KO kidneys and its depletion rescues mTORC1 hyperactivation.
a, Representative images from three independent histopathological analysis of Flcn-KO kidney tissues showing magnifications of areas with tubular papillary atypical hyperplasia (arrowheads, top panels), hyperplasia with profound alterations of the tubular morphology (marked by asterisks in the bottom left panel) and atypical hyperplasia with multiple mitoses (represented in boxed areas and magnified in indents in bottom right panel). Bar, 100 μm. b, Representative immunofluorescence analysis of triplicate experiments of TFEB in kidney sections from the indicated genotypes. Insets show higher magnification of the boxed area. Scale bars, 100 ;Cm. c, Immunoblotting analysis of the indicated proteins in cytosolic and nuclear fractions of kidneys from Flcnflox/flox (Ctrl) and Flcnflox/flox;Ksp-Cre (Flcn-KO) mice (replicated three times). d, Immunoblotting analysis of the indicated proteins in kidneys from Flcnflox/flox;Ksp-Cre+ (Flcn-KO) mice and Flcnflox/flox;Tfebflox/flox; Ksp-Cre+ (Flcn-Tfeb-DKO) mice and corresponding controls (replicated three times). e, mRNA levels of several TFEB target genes were analyzed in kidney samples from Flcn-KO mice relative to control mice. Bars represent means ± SEM for n=5 mice for each group and are expressed as fold change compared with control mice normalized to cyclophilin gene expression (*=p < 0.05, **=p < 0.01, ***p < 0.001 two-sided Student t test). S16 expression was shown as control unrelated gene. f, Immunohistochemical analysis of LAMP-1 in kidney sections from Flcn-KO mice and control mice (replicated three times). Insets show higher magnification of the boxed area. Scale bars, 50 μm. In (a-f) analysis was performed from mice of 21 days of age.
Acknowledgements
We are grateful to Maria Antonietta De Matteis, Graciana Diez-Roux, Leon Murphy and Carmine Settembre for the critical reading of the manuscript. We also thank Antonella Iuliano for statistical analyisis, Chiara Soldati for software analysis of TFEB subcellular distribution, Luca D‘Orsi and Nicolina Zampelli for technical help and Marianna Mea for help in drawing the model figure. This work was supported by grants from the Italian Telethon Foundation ‘TGM16CB6’ (A.B.); MIUR ‘FIRB RBAP11Z3YA’ (A.B.) and ‘PRIN 2017YF9FBS’ (G.N.); European Research Council H2020 AdG 'LYSOSOMICS 694282' (A.B.); European Union‘s Horizon 2020 MSCA ‘REBuILD 661271’ (G.N.); U.S. National Institutes of Health ‘R01-NS078072’ (A.B.); Huffington Foundation (A.B.); European Regional Development Fund - POR Campania FESR 2014/2020 (A.B); Associazione Italiana per la Ricerca sul Cancro A.I.R.C. ‘IG-17639’, ‘IG-22103’ and ‘5x1000-21051’ (A.B.), ȁMFAG-23538’ (G.N.) and ‘IG-18988’ (P.P.D.F.); University of Naples “Federico II" ‘STAR LI 2018’ (G.N.); MCO 10000 (P.P.D.F.); Italian Ministry of Health ‘RF-2016-02361540’ (P.P.D.F.).
Footnotes
Author Contributions
G.N., C.D.M. and A.B. conceived the study. G.N., C.D.M. and A.E. designed the experiments. G.N. and M.M. performed the majority of co-IPs and the in vitro experiments involving RagC. A.E. performed experiments involving FBS, Rheb/TSC2, TFEB chimera and Lys/Mit-Raptor. C.D.M. and A.Z. performed the experiments on Flcn-KO HeLa cells, generated and characterized the mouse lines described in the study. D.S. was involved in characterization of mouse lines and analysis of RagA-KO-cells. C.V. was involved in some experiments on FLCN-KO cells. E.N. helped with mouse handling. V.B and A.V. performed some of the experiments involving Lys-Raptor. M.C. was involved in virus and cell line preparation. J.M. generated Crispr/Cas9 gene-edited cell lines and performed some microscopy experiments. A.C. was involved in some of the experiments related to Rheb depletion. M.E.G.A., T.S. and L.H. performed and analyzed biochemistry experiments. S.P, G.B. and P.P.D.F. performed and analyzed histology experiments. G.N., C.D.M and A.B. wrote the manuscript. A.B. supervised the study.
Competing interest
A.B. is Co-Founder of CASMA Therapeutics, Inc, Cambridge, MA 02139
Data availability
Full scans for all western blots are as well as raw data for all the graphs are provided with this manuscript. No datasets were generated or analyzed during the current study. All other data are available from the corresponding author on reasonable request.
References
- 1.Liu GY, Sabatini DM. mTOR at the nexus of nutrition, growth, ageing and disease. Nat Rev Mol Cell Biol. 2020 doi: 10.1038/s41580-019-0199-y. [DOI] [PMC free article] [PubMed] [Google Scholar]
- 2.Ben-Sahra I, Manning BD. mTORC1 signaling and the metabolic control of cell growth. Curr Opin Cell Biol. 2017;45:72–82. doi: 10.1016/j.ceb.2017.02.012. [DOI] [PMC free article] [PubMed] [Google Scholar]
- 3.Gonzalez A, Hall MN. Nutrient sensing and TOR signaling in yeast and mammals. EMBO J. 2017;36:397–408. doi: 10.15252/embj.201696010. [DOI] [PMC free article] [PubMed] [Google Scholar]
- 4.Sardiello M, et al. A gene network regulating lysosomal biogenesis and function. Science (New York, N Y) 2009;325:473–477. doi: 10.1126/science.1174447. [DOI] [PubMed] [Google Scholar]
- 5.Settembre C, et al. TFEB links autophagy to lysosomal biogenesis. Science (New York, N. Y.) 2011;332:1429–1433. doi: 10.1126/science.1204592. [DOI] [PMC free article] [PubMed] [Google Scholar]
- 6.Schmidt LS, Linehan WM. FLCN: The causative gene for Birt-Hogg-Dube syndrome. Gene. 2018;640:28–42. doi: 10.1016/j.gene.2017.09.044. [DOI] [PMC free article] [PubMed] [Google Scholar]
- 7.Schmidt LS, Linehan WM. Molecular genetics and clinical features of Birt-Hogg-Dube syndrome. Nat Rev Urol. 2015;12:558–569. doi: 10.1038/nrurol.2015.206. [DOI] [PMC free article] [PubMed] [Google Scholar]
- 8.Inoki K, Li Y, Xu T, Guan KL. Rheb GTPase is a direct target of TSC2 GAP activity and regulates mTOR signaling. Genes Dev. 2003;17:1829–1834. doi: 10.1101/gad.lll0003. [DOI] [PMC free article] [PubMed] [Google Scholar]
- 9.Long X, Lin Y, Ortiz-Vega S, Yonezawa K, Avruch J. Rheb binds and regulates the mTOR kinase. Current biology : CB. 2005;15:702–713. doi: 10.1016/j.cub.2005.02.053. [DOI] [PubMed] [Google Scholar]
- 10.Tee AR, Manning BD, Roux PP, Cantley LC, Blenis J. Tuberous Sclerosis Complex Gene Products, Tuberin and Hamartin, Control mTOR Signaling by Acting as a GTPase-Activating Protein Complex toward Rheb. Current Biology. 2003;13:1259–1268. doi: 10.1016/S0960-9822(03)00506-2. [DOI] [PubMed] [Google Scholar]
- 11.Yang H, et al. Mechanisms of mTORC1 activation by RHEB and inhibition by PRAS40. Nature. 2017;552:368–373. doi: 10.1038/nature25023. [DOI] [PMC free article] [PubMed] [Google Scholar]
- 12.Sancak Y, et al. The Rag GTPases bind raptor and mediate amino acid signaling to mTORC1. Science (New York, N.Y.) 2008;320:1496–1501. doi: 10.1126/science.1157535. [DOI] [PMC free article] [PubMed] [Google Scholar]
- 13.Sancak Y, et al. Ragulator-Rag complex targets mTORC1 to the lysosomal surface and is necessary for its activation by amino acids. Cell. 2010;141:290–303. doi: 10.1016/j.cell.2010.02.024. [DOI] [PMC free article] [PubMed] [Google Scholar]
- 14.Kim E, Goraksha-Hicks P, Li L, Neufeld TP, Guan KL. Regulation of TORCI by Rag GTPases in nutrient response. Nat Cell Biol. 2008;10:935–945. doi: 10.1038/ncbl753. [DOI] [PMC free article] [PubMed] [Google Scholar]
- 15.Bar-Peled L, et al. A Tumor suppressor complex with GAP activity for the Rag GTPases that signal amino acid sufficiency to mTORC1. Science. 2013;340:1100–1106. doi: 10.1126/science.1232044. [DOI] [PMC free article] [PubMed] [Google Scholar]
- 16.Tsun ZY, et al. The folliculin tumor suppressor is a GAP for the RagC/D GTPases that signal amino acid levels to mTORC1. Mol Cell. 2013;52:495–505. doi: 10.1016/j.molcel.2013.09.016. [DOI] [PMC free article] [PubMed] [Google Scholar]
- 17.Lawrence RE, et al. Structural mechanism of a Rag GTPase activation checkpoint by the lysosomal folliculin complex. Science. 2019 doi: 10.1126/science.aax0364. [DOI] [PMC free article] [PubMed] [Google Scholar]
- 18.Shen K, et al. Cryo-EM Structure of the Human FLCN-FNIP2-Rag-Ragulator Complex. Cell. 2019 doi: 10.1016/j.cell.2019.10.036. [DOI] [PMC free article] [PubMed] [Google Scholar]
- 19.Settembre C, et al. A lysosome-to-nucleus signalling mechanism senses and regulates the lysosome via mTOR and TFEB. The EMBO journal. 2012;31:1095–1108. doi: 10.1038/emboj.2012.32. [DOI] [PMC free article] [PubMed] [Google Scholar]
- 20.Martina JA, Chen Y, Gucek M, Puertollano R. mTORC1 functions as a transcriptional regulator of autophagy by preventing nuclear transport of TFEB. Autophagy. 2012;8:903–914. doi: 10.4161/auto.19653. [DOI] [PMC free article] [PubMed] [Google Scholar]
- 21.Roczniak-Ferguson A, et al. The transcription factor TFEB links mTORC1 signaling to transcriptional control of lysosome homeostasis. Science signaling. 2012;5:ra42. doi: 10.1126/scisignal.2002790. [DOI] [PMC free article] [PubMed] [Google Scholar]
- 22.Napolitano G, et al. mTOR-dependent phosphorylation controls TFEB nuclear export. Nat Commun. 2018;9:3312. doi: 10.1038/s41467-018-05862-6. [DOI] [PMC free article] [PubMed] [Google Scholar]
- 23.Medina DL, et al. Lysosomal calcium signalling regulates autophagy through calcineurin and TFEB. Nature cell biology. 2015;17:288–299. doi: 10.1038/ncb3114. [DOI] [PMC free article] [PubMed] [Google Scholar]
- 24.Ballabio A, Bonifacino JS. Lysosomes as dynamic regulators of cell and organismal homeostasis. Nat Rev Mol Cell Biol. 2019 doi: 10.1038/s41580-019-0185-4. [DOI] [PubMed] [Google Scholar]
- 25.Di Malta C, et al. Transcriptional activation of RagD GTPase controls mTORC1 and promotes cancer growth. Science. 2017;356:1188–1192. doi: 10.1126/science.aag2553. [DOI] [PMC free article] [PubMed] [Google Scholar]
- 26.Martina JA, Puertollano R. Rag GTPases mediate amino acid-dependent recruitment of TFEB and MITF to lysosomes. The Journal of cell biology. 2013;200:475–491. doi: 10.1083/jcb.201209135. [DOI] [PMC free article] [PubMed] [Google Scholar]
- 27.Schalm SS, Blenis J. Identification of a conserved motif required for mTOR signaling. Curr Biol. 2002;12:632–639. doi: 10.1016/s0960-9822(02)00762-5. [DOI] [PubMed] [Google Scholar]
- 28.Schalm SS, Fingar DC, Sabatini DM, Blenis J. TOS motif-mediated raptor binding regulates 4E-BP1 multisite phosphorylation and function. Curr Biol. 2003;13:797–806. doi: 10.1016/s0960-9822(03)00329-4. [DOI] [PubMed] [Google Scholar]
- 29.Lawrence RE, et al. A nutrient-induced affinity switch controls mTORC1 activation by its Rag GTPase-Ragulator lysosomal scaffold. Nat Cell Biol. 2018;20:1052–1063. doi: 10.1038/s41556-018-0148-6. [DOI] [PMC free article] [PubMed] [Google Scholar]
- 30.Baba M, et al. Kidney-targeted Birt-Hogg-Dube gene inactivation in a mouse model: Erkl/2 and Akt-mTOR activation, cell hyperproliferation, and polycystic kidneys. J Natl Cancer Inst. 2008;100:140–154. doi: 10.1093/jnci/djm288. [DOI] [PMC free article] [PubMed] [Google Scholar]
- 31.Chen J, et al. Deficiency of FLCN in mouse kidney led to development of polycystic kidneys and renal neoplasia. PLoSOne. 2008;3:e3581. doi: 10.1371/joumal.pone.0003581. [DOI] [PMC free article] [PubMed] [Google Scholar]
- 32.Wada S, et al. The tumor suppressor FLCN mediates an alternate mTOR pathway to regulate browning of adipose tissue. Genes Dev. 2016;30:2551–2564. doi: 10.1101/gad.287953.116. [DOI] [PMC free article] [PubMed] [Google Scholar]
- 33.Anandapadamanaban M, et al. Architecture of human Rag GTPase heterodimers and their complex with mTORC1. Science. 2019;366:203–210. doi: 10.1126/science.aax3939. [DOI] [PMC free article] [PubMed] [Google Scholar]
- 34.Rogala KB, et al. Structural basis for the docking of mTORC1 on the lysosomal surface. Science. 2019;366:468–475. doi: 10.1126/science.aay0166. [DOI] [PMC free article] [PubMed] [Google Scholar]
- 35.Kauffman EC, et al. Molecular genetics and cellular features of TFE3 and TFEB fusion kidney cancers. Nat Rev Urol. 2014;11:465–475. doi: 10.1038/murol.2014.162. [DOI] [PMC free article] [PubMed] [Google Scholar]
- 36.Calcagni A, et al. Modelling TFE renal cell carcinoma in mice reveals a critical role of WNT signaling. eLife. 2016;5 doi: 10.7554/elife.17047. [DOI] [PMC free article] [PubMed] [Google Scholar]
- 37.Baba M, et al. Folliculin encoded by the BHD gene interacts with a binding protein, FNIP1, and AMPK, and is involved in AMPK and mTOR signaling. Proc Natl Acad Sei U SA. 2006;103:15552–15557. doi: 10.1073/pnas.0603781103. [DOI] [PMC free article] [PubMed] [Google Scholar]
- 38.Petit CS, Roczniak-Ferguson A, Ferguson SM. Recruitment of folliculin to lysosomes supports the amino acid-dependent activation of Rag GTPases. J Cell Biol. 2013;202:1107–1122. doi: 10.1083/jcb.201307084. [DOI] [PMC free article] [PubMed] [Google Scholar]
- 39.Mansueto G, et al. Transcription Factor EB Controls Metabolic Flexibility during Exercise. Cell Metab. 2017;25:182–196. doi: 10.1016/j.cmet.2016.11.003. [DOI] [PMC free article] [PubMed] [Google Scholar]
- 40.Endoh M, et al. A FLCN-TFE3 Feedback Loop Prevents Excessive Glycogenesis and Phagocyte Activation by Regulating Lysosome Activity. Cell Rep. 2020;30:1823–1834 e1825. doi: 10.1016/j.celrep.2020.01.042. [DOI] [PMC free article] [PubMed] [Google Scholar]
- 41.Possik E, et al. FLCN and AMPK Confer Resistance to Hyperosmotic Stress via Remodeling of Glycogen Stores. PLoS Genet. 2015;11:e1005520. doi: 10.1371/journal.pgen.1005520. [DOI] [PMC free article] [PubMed] [Google Scholar]
- 42.Kawakami K. Tol2: a versatile gene transfer vector in vertebrates. Genome Biol. 2007;8(Suppl 1):S7. doi: 10.1186/gb-2007-8-sl-s7. [DOI] [PMC free article] [PubMed] [Google Scholar]
- 43.de Araujo MEG, et al. Crystal structure of the human lysosomal mTORC1 scaffold complex and its impact on signaling. Science. 2017;358:377–381. doi: 10.1126/science.aaol583. [DOI] [PubMed] [Google Scholar]
- 44.Napolitano G, et al. Impairment of chaperone-mediated autophagy leads to selective lysosomal degradation defects in the lysosomal storage disease cystinosis. EMBO Mol Med. 2015;7:158–174. doi: 10.15252/emmm.201404223. [DOI] [PMC free article] [PubMed] [Google Scholar]
- 45.Shao X, Johnson JE, Richardson JA, Hiesberger T, Igarashi P. A minimal Ksp-cadherin promoter linked to a green fluorescent protein reporter gene exhibits tissue-specific expression in the developing kidney and genitourinary tract. J Am Soc Nephrol. 2020;13:1824–1836. doi: 10.1097/01.asn.0000016443.50138.cd. [DOI] [PubMed] [Google Scholar]
Associated Data
This section collects any data citations, data availability statements, or supplementary materials included in this article.
Data Availability Statement
Full scans for all western blots are as well as raw data for all the graphs are provided with this manuscript. No datasets were generated or analyzed during the current study. All other data are available from the corresponding author on reasonable request.


