Abstract
Rapid cellular responses to environmental stimuli are fundamental for development and maturation. Immediate early genes (IEGs) can be transcriptionally induced within minutes in response to a variety of signals. How their induction levels are regulated and their untimely activation by spurious signals prevented during development is poorly understood. We found that in developing sensory neurons, prior to perinatal sensory activity-dependent induction, IEGs are embedded into a unique bipartite Polycomb chromatin signature, carrying active H3K27ac on promoters but repressive Ezh2-dependent H3K27me3 on gene bodies. This bipartite signature is widely present in developing cell types, including embryonic stem cells (ESCs). Polycomb marking of gene bodies inhibits mRNA elongation, dampening productive transcription, while still allowing for fast stimulus-dependent mark removal and bipartite gene induction. We reveal a developmental epigenetic mechanism regulating rapidity and amplitude of the transcriptional response to relevant stimuli, while preventing inappropriate activation of stimulus-response genes.
Introduction
During development, cells are exposed to a variety of distinct environmental signals to which they may need to rapidly respond in a spatiotemporally regulated manner, in order to keep their differentiation schedule. Stimulus response genes are essential for rapid cellular responses to extracellular signals1–3. Among them, immediate early genes (IEGs) are induced in multiple cell types within minutes in a stimulus-dependent manner, often encoding for transcription factors (e.g. Fos, Egr1), which in turn regulate the expression of downstream late response genes (LRGs) through activation of enhancers1,4–6. Prior to induction, IEGs share key regulatory properties which poise them for rapid stimulus-dependent activation. In general, these include accessible promoters and enhancers bound by the SRF, NF-kB, CREB (cyclic AMP response element-binding protein) and/or AP-1 transcription factors, that are post-translationally modified upon stimulus response, as well as transcriptionally permissive histone modifications (H3K4me2/3) and paused RNA Polymerase II (RNAPII)2,7. Despite their shared organization, differences in transcription initiation, elongation, or mRNA processing and stability may result in IEG induction differences2,7. Moreover, IEGs are both general, i.e. the same IEGs are induced in most cell types in response to different stimuli, and cell-type specific, responding to specific signals in different cell types3,6,8–12. How spatiotemporal regulation and specificity of the IEG transcriptional response is achieved in developing cells, and how untimely induction of IEGs in response to spurious signals is prevented, are poorly understood.
Here, we asked whether and how chromatin states may also contribute to stimulus-dependent transcriptional regulation of IEGs during development, choosing the mouse developing somatosensory neurons as a suitable model. We then further confirmed the general validity of our findings in developing neural crest, heart, liver, and ESCs. We discovered, and functionally investigated, a unique H3K27ac/H3K27me3 bipartite chromatin signature, which provides an epigenetic mechanism to modulate the rapidity and amplitude of the transcriptional response of inducible IEGs to distinct stimuli during development. Our findings support the involvement of Polycomb (Pc)-dependent H3K27me3 on the gene body in inhibiting the productive elongation of RNAPII on bipartite genes. While strong stimuli allow for the rapid removal of Pc gene body marking and fast transcriptional induction, Pc marking of gene bodies of bipartite stimulus response genes may establish a threshold to prevent rapid transcriptional induction of IEGs in response to sub-optimal and/or non-physiologically relevant levels of environmental stimuli.
Results
Transcriptional and chromatin profiling of activity-regulated genes in developing neurons
During early postnatal sensory neuron development, IEGs and LRGs are transcriptionally induced by sensory experience, which drives neuronal and circuit maturation6,8. In the mouse somatosensory system, topographic representations of the mystacial vibrissae (whiskers) on the face are generated at brainstem, thalamus, and cortical levels13,14. In the brainstem, the whisker-related neuronal modules, or barrelettes, are generated in the ventral principal trigeminal sensory nucleus (vPrV) and sensory neuronal activity is required at perinatal/early postnatal stages for the maturation of barrelette neuron connectivity and map formation13,14.
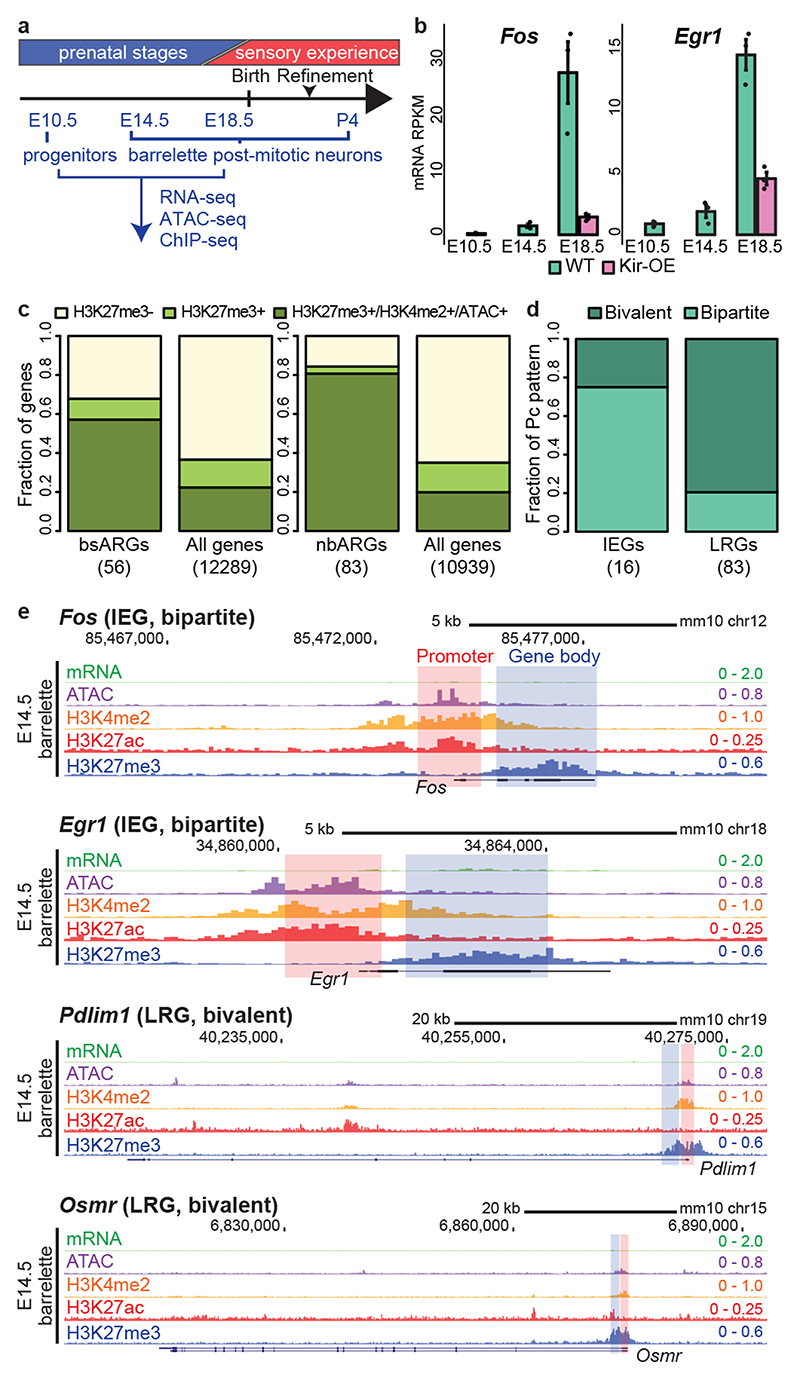
To characterize IEG and LRG activity response genes (ARGs) in developing barrelette neurons, we set out a genetic strategy to isolate E10.5 mitotic progenitors and postmitotic barrelette neurons at E14.5 (early postmitotic), E18.5 (perinatal) and P4 (consolidated barrelette stage) by FACS and we profiled them by mRNA-seq (Smart-seq2), ChIP-seq (ChIPmentation) of the Pc-dependent repressive H3K27me3 and active H3K4me2 and H3K27ac histone modifications, and chromatin accessibility by ATAC-seq (Methods) (Fig. 1a, Extended Data Fig. 1a-e, Supplementary Table 1, Supplementary Figs. 1 and 2, Supplementary Note).
Fig. 1. Immediate early and late response genes carry distinct Polycomb signatures during sensory neuron development.
a, Cell isolation strategy diagram. E10.5 mitotic progenitors and E14.5 (early postmitotic), E18.5 (perinatal) and P4 (consolidated barrelette stage) barrelette neurons were isolated and collected as indicated. b, Fos (left) and Egr1 (right) immediate early gene (IEG) mRNA reads per kilobase per million reads (RPKM) expression bar plots in E10.5 progenitors (K20tdTomato/+), E14.5 and E18.5 postmitotic Drg11vPrV-ZsGreen/+ barrelette (WT, green bars) and activity-depleted Kir2.1-over-expressing E18.5 Drg11vPrV-Kir barrelette neurons (Kir-OE, purple bars) (n = 3 biologically independent littermates). Bar plots represent average values and error bars show standard deviation. c, Bar plots showing fraction of Polycomb (Pc) target gene profiles in E14.5 Drg11vPrV-ZsGreen /+ barrelette neurons. (left) Fraction of Pc target profiles at E14.5 among the 56 barrelette sensory activity response genes (bsARGs, Supplementary Note and Methods) compared to all other n = 12,289 genes (RPKM < 3 at E14.5). (right) Fraction of Pc target profiles at E14.5 among 83 non-barrelette ARGs (nbARGs, Supplementary Note and Methods) compared to all other n = 10,939 genes (RPKM < 3 at E14.5, E18.5 and P4). d, Bar plots showing the fractions of Pc bivalent or bipartite chromatin signatures among the 16 IEGs (bsARGS + nbARGs) (left) and 83 late response genes (LRGs, right) in E14.5 Drg11vPrV-ZsGreen/+ barrelette neurons. e, Genome browser profiles of representative bipartite IEGs (Fos, Egr1) and bivalent LRGs (Pdlim1, Osmr), respectively, in E14.5 Drg11vPrV-ZsGreen/+ barrelette neurons.
To identify ARGs induced in barrelette neurons at the beginning of the sensory-dependent maturation period (E18.5-P2/3)15, we collected E18.5 Kir2.1-overexpressing, activity-deprived, vPrV postmitotic barrelette neurons by FACS sorting (Extended Data Fig. 1e-p; Supplementary Table 1; Supplementary Fig. 2; Supplementary Note; Methods), profiled them by mRNA-seq (Smart-seq2), and compared to E14.5 and E18.5 vPrV wild-type barrelette neurons. Among the genes with undetectable or low basal expression level (reads per kilobase per million mapped reads, RPKM < 3) in E14.5 barrelette neurons, we identified 56 genes, referred to as barrelette sensory ARGs (bsARGs) (Supplementary Table 2), that were up-regulated at E18.5 in a neuronal activity-dependent manner (Extended Data Fig. 1q-s; Supplementary Note; Methods). bsARGs comprised 4 IEGs, namely Fos, Egr1, Junb, and Zfp36 (Fig. 1b, Supplementary Table 2), and at least 23 putative LRGs (e.g. Cd38, Osmr) (Supplementary Table 3). We next identified additional ARGs referred to as non-barrelette ARGs (nbARGs) (n = 83) (Methods, Supplementary Note) that included both LRGs and 12 IEGs which were transcriptionally induced by distinct activity-dependent stimuli in neuronal types other than barrelette neurons16–18, but that displayed undetectable or low basal expression level (RPKM < 3) in E14.5, E18.5 and P4 barrelette neurons.
Pc group proteins regulate dynamics and plasticity of gene expression during development19–23. We found that in E14.5 barrelette neurons 32/56 (57%) and 67/83 (84%) of bsARGs and nbARGs, respectively, were embedded in H3K27me3+ domains of Pc-repressive chromatin (Methods) with, however, H3K4me2+/ATAC+ promoters (Fig. 1c; Extended Data Fig. 1t,u).
IEGs carry a unique Polycomb bipartite signature during development
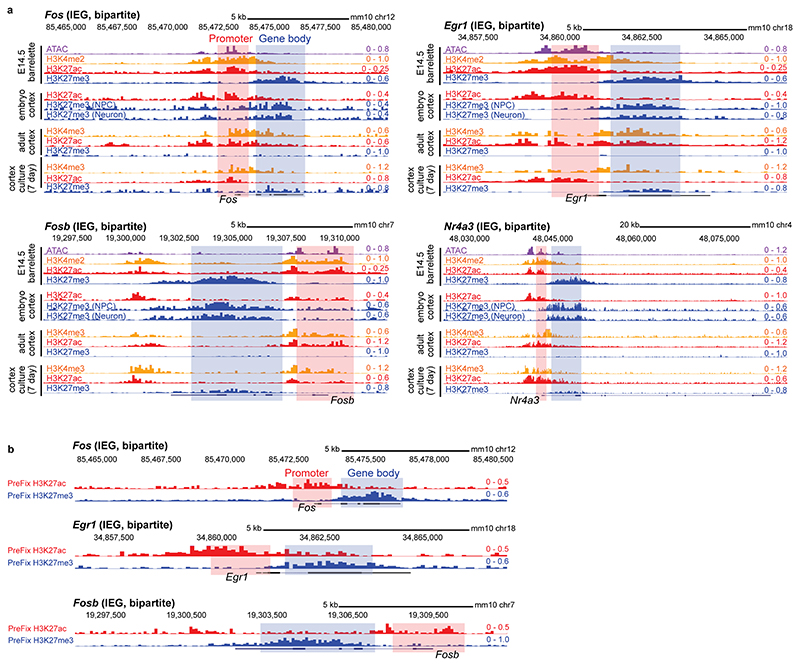
The bsARGs and nbARGs with H3K27me3+/H3K4me2+/ATAC+ Pc chromatin profile at E14.5 included all the 16 IEGs, namely Fos, Egr1, Egr3, Egr4, Fosb, Fosl2, Junb, Zfp36, Klf4, Maff, Npas4, Nr4a3, Apold1, Arc, Atf3, and Dusp5 16–18. When analyzing their chromatin profile, only 4 of 16 (25%) IEGs (Junb, Egr3, Egr4, and Atf3) displayed a conventional Pc bivalent24–26 signature (Fig. 1d, left bar), i.e. with promoters marked by both active H3K4me2 and repressive H3K27me3 histone modifications. Interestingly, 12 of 16 (75%) IEGs displayed a unique distinct ‘bipartite’ Pc signature (Fig. 1d left bar, see genome browser snapshots at Fos, Egr1, Fosb and Nr4a3 in Fig. 1e, Extended Data Fig. 2a). Namely, H3K27me3 deposition was restricted to their gene bodies, whereas the accessible H3K4me2+ promoters were devoid of H3K27me3 and decorated instead with the active mark H3K27ac, notably with no or only low basal levels of detected mRNA. H3K27me3 on gene bodies did not stretch further than 2-3 kb downstream of the transcription start site (TSS), even when the gene was longer (e.g. Nr4a3, Extended Data Fig. 2a). H3K27ac deposition at promoters of bipartite IEGs was not induced by the dissociation procedure (Extended Data Fig. 2b, Methods). Conversely, we found that among the remaining 83/99 H3K4me2+/H3K27me3+/ATAC+ ARGs, which included putative barrelette neuron LRGs and non-barrelette neuron LRGs16–18 (e.g. Osmr and Pdlim1, respectively, Fig. 1e), 66/83 (80%) were in a bivalent state whereas only 17 of 83 (20%) carried the bipartite Pc signature (Fig. 1d, right bar, Methods).
In summary, at prenatal stages, the rapidly inducible IEGs are preferentially in a Pc bipartite state, whereas the LRGs are preferentially enriched with a Pc bivalent signature (Fig. 1d, e). Similar to developing barrelette neurons, the Pc bipartite signature was also present at IEGs in prenatal cortical progenitors and postmitotic neurons, though neither in adult excitatory neurons nor in 7-day cultured embryonic cortical neurons (Extended Data Fig. 2a). Thus, the bipartite chromatin organization is specifically established at IEGs during prenatal neuronal development.
The bipartite signature is found on stimulus response genes during development and is not restricted to neurons
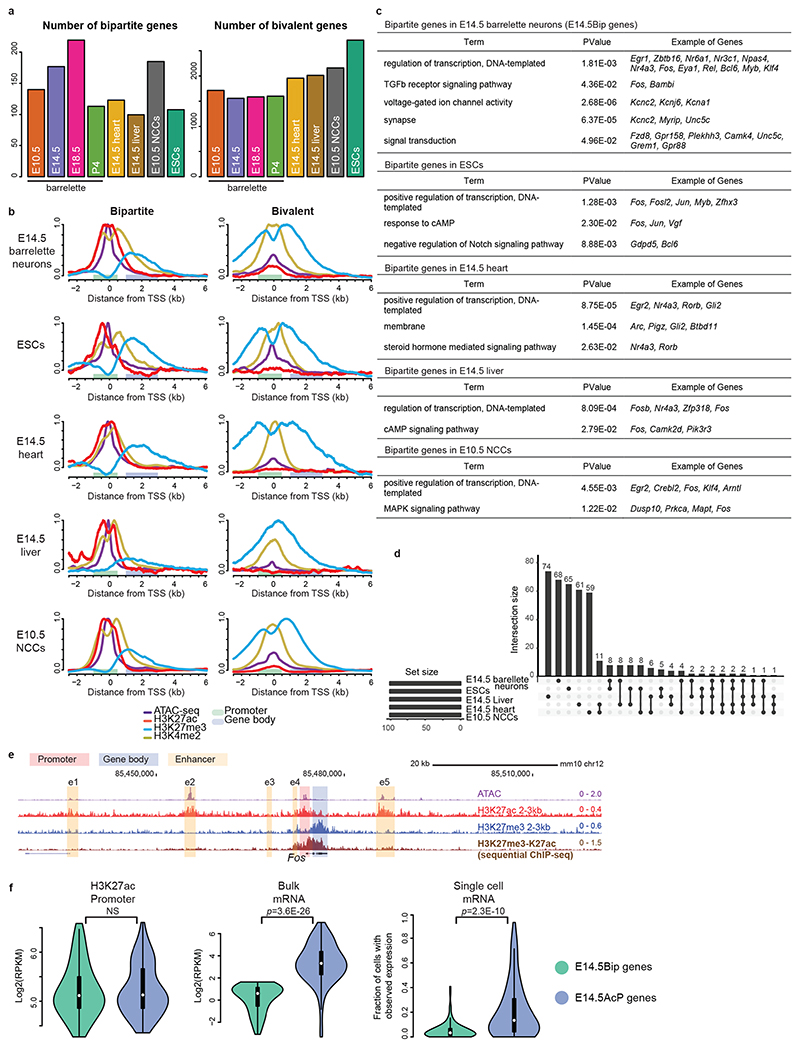
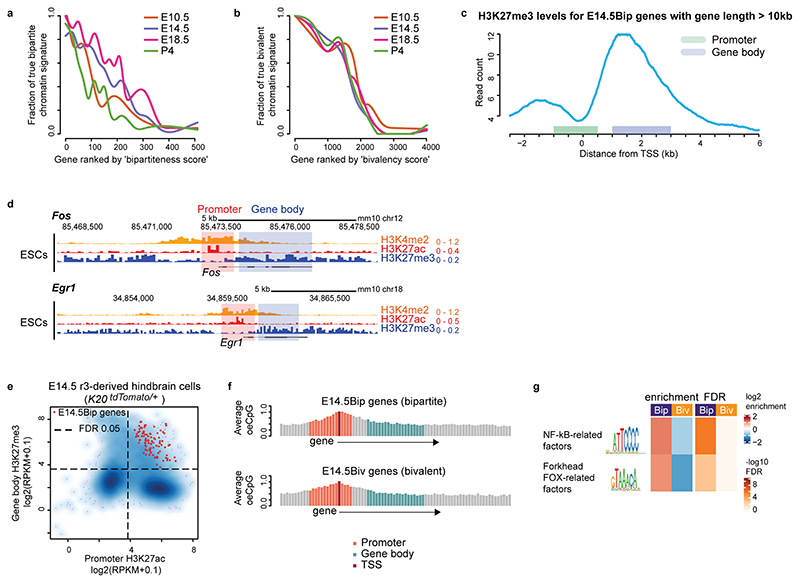
We next investigated the genome-wide distribution of the Pc bipartite chromatin signature. We assigned each gene with a ‘bipartiteness’ score related to their promoter H3K27ac and gene body H3K27me3 levels and a ‘bivalency’ score related to H3K27me3 and H3K4me2 at promoters (Methods; Extended Data Fig. 3a, b). Considering the estimated false positive rates of this scoring approach, we conservatively evaluated the total numbers of true bipartite genes from at least 140 at E10.5, to 177 at E14.5, to 219 at E18.5, and decreasing to 113 at P4 in barrelette neurons (Fig. 2a, left, Methods). At all stages, approximately 1,500 genes were instead in a bivalent state (Fig. 2a, right, see Methods). Aggregate profile plots of chromatin marks of the top 100 E14.5 barrelette neuron bipartiteness (E14.5Bip) or bivalency (E14.5Biv) scored genes (Methods) further confirmed their clearly distinct chromatin signatures (Fig. 2b, Extended Data Fig. 3c).
Fig. 2. Developmental cellular representation and genome-wide distribution of bipartite chromatin, and promoter H3K27ac and gene body H3K27me3 coexistence at bipartite genes.
a, Estimated numbers of bipartite (left) and bivalent (right) genes in E10.5 K20tdTomato/+ progenitors, E14.5, E18.5 and P4 Drg11vPrV-ZsGreen/+ barrelette neurons, E14.5 mouse heart tissue, E14.5 mouse liver tissue, E10.5 neural crest-derived cells (NCCs), and mouse embryonic stem cells (ESCs). b, Aggregate plots of chromatin features (ATAC-seq, ChIP-seq, as indicated) around the transcription start site (TSS) of bipartite (left) and bivalent genes (right) in the distinct developing cell types, as indicated. Promoters and gene bodies are highlighted; Y axes of bipartite and bivalent plots are scaled so that the two plots can be directly compared with each other for the same mark (Methods). c, Gene Ontology of bipartite genes identified in the different developing cell types. d, Upset plot showing intersections among bipartite genes in different developing cell types. Bipartite genes are mostly tissue- and stage-specific with only a few shared. In b-d, top 100 bipartiteness scored genes are used, as a conservative definition of bipartite genes. e, Genome browser of bipartite Fos displaying accessibility (ATAC-seq), 2-3-kb fragment H3K27ac and H3K27me3 single ChIP-seq, and H3K27me3/H3K27ac sequential ChIP-seq from E14.5 hindbrain. H3K27me3 and H3K27ac coexist on gene body and promoter, respectively (Supplementary Note). f, Violin plots displaying promoter H3K27ac (left), bulk mRNA-seq levels (middle, Smart-seq2), and single-cell fractions with detected mRNA transcripts (right, 10X Genomics) in E14.5 barrelette neurons; E14.5 bipartite genes (E14.5Bip, green, n = 97) and E14.5 non-bipartite genes with Bip-matching promoter H3K27ac levels (E14.5AcP genes, blue, n = 97) are compared (Supplementary Note; Methods). Plots extend from the data minima to the maxima with the white dot indicating median, the box showing the interquartile range and whiskers extending to the most extreme data point within 1.5× the interquartile range. P values are from two-sided Wilcoxon’s tests. NS: not significant (P > 0.05).
In addition to IEGs, Gene Ontology (GO) analysis of E14.5 bipartite (Bip) genes identified genes encoding for transcriptional regulators and transmembrane domain receptors responding to distinct signaling pathways including BMP and TGF-beta signaling, voltage-gated ion channels, and dendritic, axonal, and synaptic genes (Fig. 2c, Supplementary Table 4).
Furthermore, by our ranking method, we additionally found 124, 99, 185 and 107 genes carrying the bipartite chromatin signature in mouse E14.5 heart tissue, E14.5 liver tissue, E10.5 neural crest-derived cells (NCCs) and ESCs, respectively (Fig. 2a-c, Extended Data Fig. 3d, Supplementary Table 4). Bipartite genes are tissue- and stage-specific as only a few bipartite genes are shared among the different cell types (Fig. 2d), and these include typical IEGs (e.g. Fos, Jun, Fosl2, Myb, Egr2, Arc) (Fig. 2c). Nonetheless, bipartite genes appear to be consistently 5-15% of the bivalent genes at all times and in all the distinct cell types analyzed (Fig. 2a).
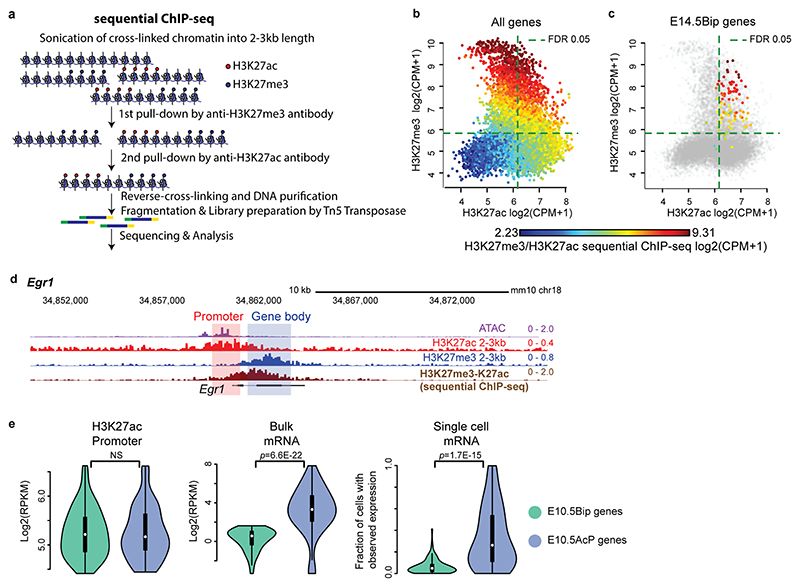
Lastly, sequential ChIP-seq on E14.5 bulk hindbrain tissue and single-cell mRNA-seq (scRNA-seq, 10X Genomics) analysis of FACS-isolated E14.5 postmitotic barrelette neurons and E10.5 progenitors demonstrated that the H3K27ac and H3K27me3 histone marks coexist at the promoter and gene body of bipartite genes, correlating with low or undetectable mRNA transcription (Supplementary Note, Fig. 2e,f, Extended Data Figs. 3e and 4a-e).
These results show that the bipartite signature is not an exclusive feature of developing neurons but is widely used during development, raising the intriguing possibility that it could regulate rapid IEG transcriptional inducibility.
The bipartite signature originates from bivalent chromatin and is dynamic during development
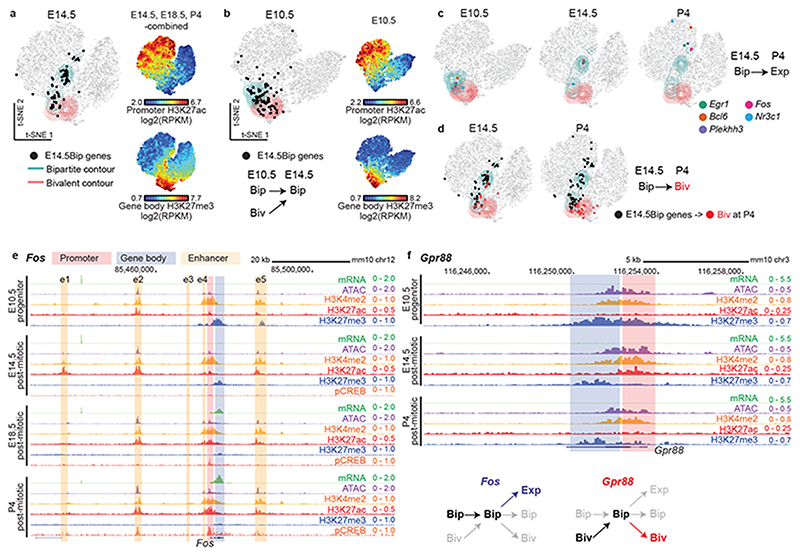
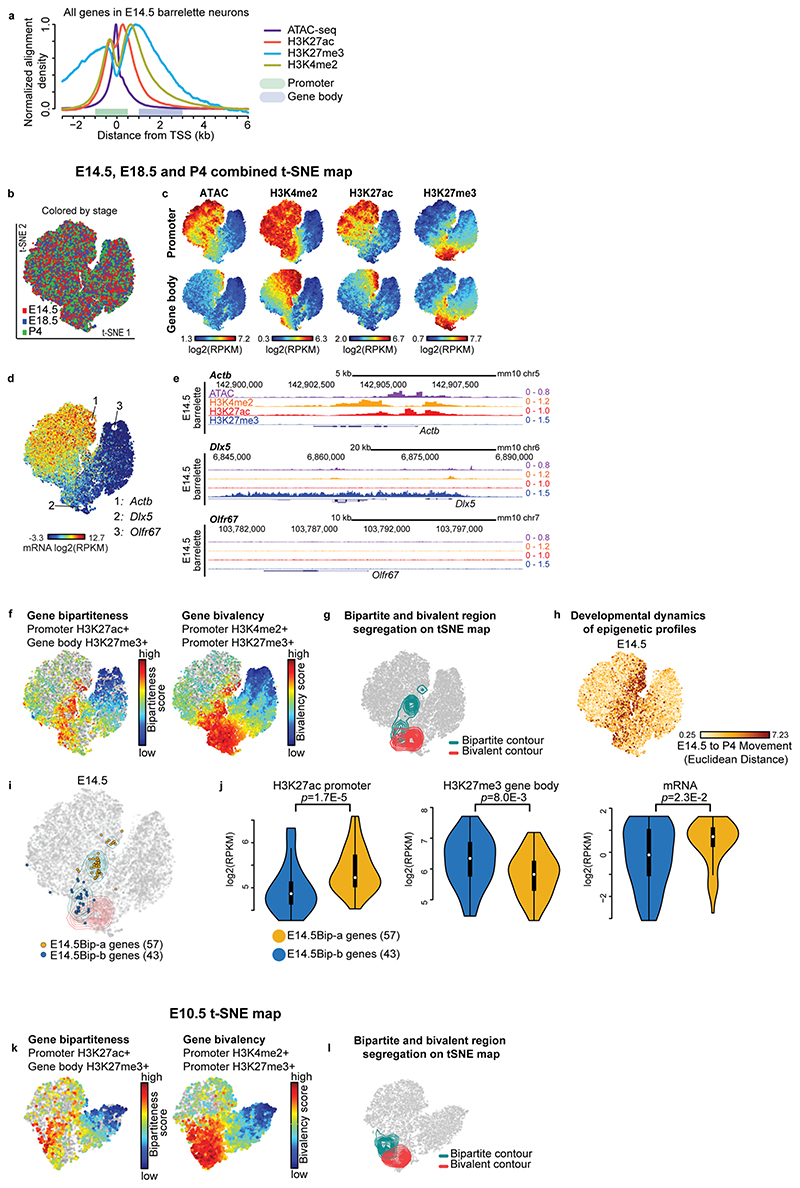
To investigate how the bipartite signature is established, maintained, and resolved during development, we created a two-dimensional (2D) projection of autosomal genes according to chromatin accessibility, H3K27me3, H3K4me2, and H3K27ac levels at promoters and gene bodies (Extended Data Fig. 5a) using t-distributed Stochastic Neighbor Embedding (t-SNE) (Fig. 3a-d, Extended Data Fig. 5b-l, Supplementary Note, Methods). We generated a single map for E10.5 progenitors and a combined E14.5, E18.5 and P4 t-SNE map of chromatin states for postmitotic barrelette neurons (Fig. 3a, b, Extended Data Fig. 5b, c; Methods). Genes (i.e. dots on t-SNE plots) with similar chromatin patterns were grouped together, which also correlated with mRNA-seq data (Extended Data Fig. 5c-e).
Fig. 3. Bipartite chromatin dynamics during barrelette neuron development.
a, Two dimensional (2D) projection of all autosomal genes (dots) visualized in E14.5/E18.5/P4-combined t-SNE maps, according to the chromatin profiles of Drg11vPrV-ZsGreen/+ barrelette neurons at E14.5 (Extended Data Fig. 5b, c; Methods; Supplementary Note). Contour lines: t-SNE regions enriched for bipartite (green) or bivalent genes (red). E14.5Bip genes are mapped as black dots. Color-coded t-SNE plots (right): each gene is labelled according to promoter H3K27ac and gene body H3K27me3 signal levels. b, t-SNE of E10.5 K20tdTomato/+ progenitor gene chromatin profiles. Black dots: distribution at E10.5 of E14.5Bip genes (summary diagram, bottom). c and d, Stage-specific developmental dynamics of E14.5Bip gene chromatin profiles on single (E10.5) and E14.5/E18.5/P4-combined (E14.5 and P4) t-SNE maps (Extended Data Fig. 6a). In c, five representative E14.5Bip genes, Egr1, Fos, Bcl6, Nr3c1, and Plekhh3, becoming expressed (Exp, mRNA RPKM ≥ 3) at P4, show their dynamic ‘movement’ (change of chromatin state) between E10.5 progenitors (left), and E14.5 (middle) and P4 (right) postmitotic neurons. d, change of spatial distribution on t-SNE between E14.5 (left) and P4 (right) of E14.5Bip genes (black dots). (red dots), E14.5 and P4 distributions of E14.5Bip genes switching to bivalent (Biv) at P4. e and f, Chromatin and transcriptional states of Fos and Gpr88 on genome browser in E10.5 K20tdTomato/+ progenitors and E14.5, E18.5 and P4 Drg11vPrV-ZsGreen/+ barrelette neurons. (Bottom right) Summary diagram of chromatin state developmental transitions at Fos and Gpr88. e1-e5: activity-dependent Fos enhancers.
Top-scoring bipartite and bivalent genes at E10.5 and postmitotic stages mapped to distinct, largely non-overlapping, regions on the respective t-SNE maps (green and red contour lines, respectively, depicting gene densities; Fig. 3a-d; Extended Data Fig. 5f,g,i-l; Supplementary Note; Methods). Furthermore, genes mapping to the same region of the combined E14.5-E18.5-P4 t-SNE map would reveal a stable chromatin state, unlike genes changing their localization between developmental stages (Fig. 3a-d; also see Extended Data Fig. 5h and Supplementary Note).
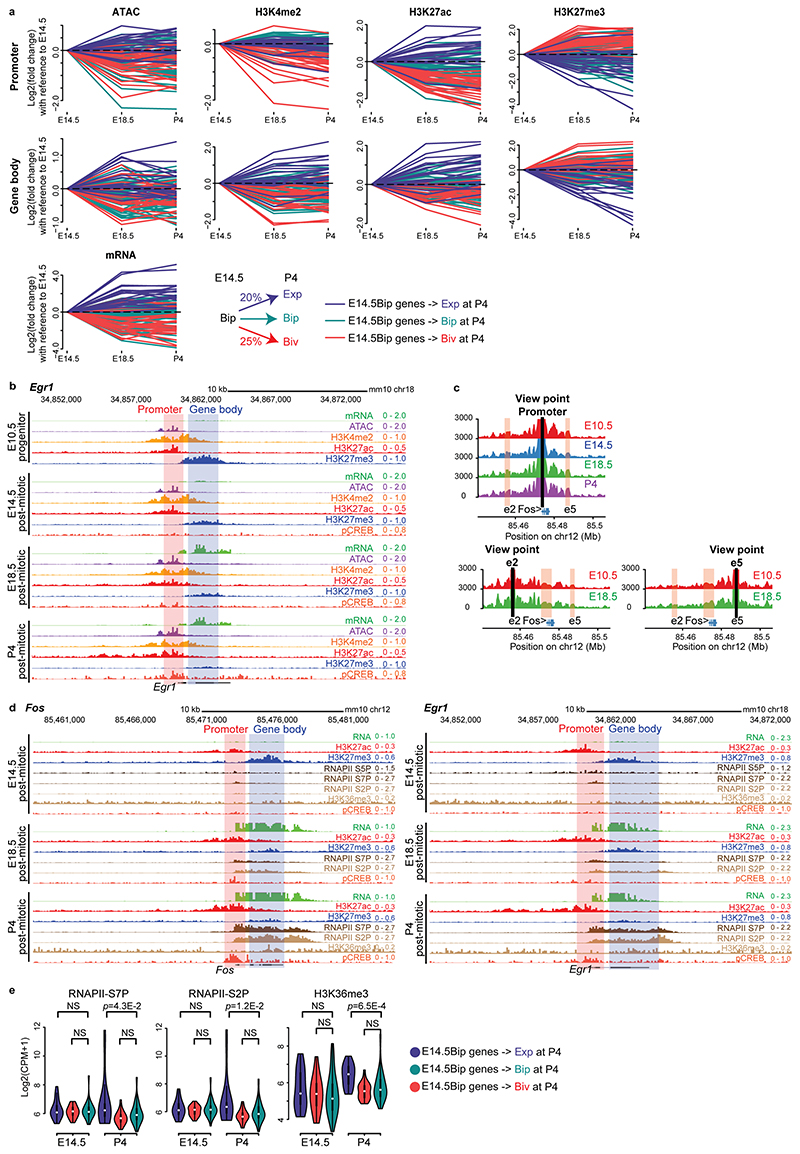
At P4, distinct fractions of the E14.5Bip genes had transitioned into productive transcription (Bip → Exp; RPKM > 3), bivalency (Bip → Biv), or remained bipartite (Bip → Bip) (Extended Data Fig. 6a). As compared to E14.5, Bip → Exp genes displayed higher levels of H3K27ac, increased accessibility (ATAC-seq) and mRNA levels, and decreased H3K27me3, in contrast to genes that remained bipartite (Bip → Bip) or became bivalent (Bip → Biv) (line plots, Extended Data Fig. 6a). The developmental progression through distinct bipartite patterns and into active chromatin state of E14.5Bip genes could also be readily visualized as relocation of their position on the E10.5, E14.5, and P4 t-SNE plots, respectively (Fig. 3c); representative examples include Fos, Egr1, Bcl6 (involved in postmitotic neuronal fate through repression of Wnt/Notch/Fgf/Shh27), Nr3c1 (glucocorticoid receptor) and Plekhh3 (signal transduction in axon growth) (Fig. 2c), while Figure 3d shows the fraction of E14.5Bip genes that switch to bivalency at P4 (Bip → Biv, red dots). Genome browser views of Fos and Egr1 (Bip → Exp), and Gpr88 (Bip → Biv), confirmed the transcriptional and epigenetic changes (Fig. 3e, f, Extended Data Fig. 6b). Moreover, by 4C-seq, we found that the bipartite signature at the Fos locus allows for reciprocal physical contacts between its active enhancers and promoter, irrespective of productive transcription (Supplementary Note; Fig. 3e, Extended Data Fig. 6c).
Next, we investigated the developmental origin of the bipartite signature. At E10.5, about 50% of E14.5Bip genes were already in a bipartite state, as they mapped within the green contour region of the E10.5 t-SNE plot; however, as many as 40% of E14.5Bip genes were in a bivalent state in E10.5 progenitors, as they were contained within the bivalent red contour region (black dots in Fig. 3b; Fig. 3f, genome browser view of the representative example Gpr88). While bipartite and bivalent genes had similar CpG content and distribution (Extended Data Fig. 3f), the E14.5Bip promoters were enriched in NF-kB-related and forkhead FOX-related factor binding motifs (Extended Data Fig. 3g, Methods).
Thus, the bipartite state originates from bivalent chromatin in early progenitors and during postmitotic neuron development displays bidirectional dynamics, reverting, for a subset of genes, back into a bivalent state, or resolving into productive transcription.
RNA PolII transcripts of bipartite genes are not efficiently processed to productive mRNA
We next investigated additional chromatin features of bipartite genes (Fig. 4a, Supplementary Note).
Fig. 4. RNA PolII transcripts of bipartite genes are not efficiently processed to productive mRNA.
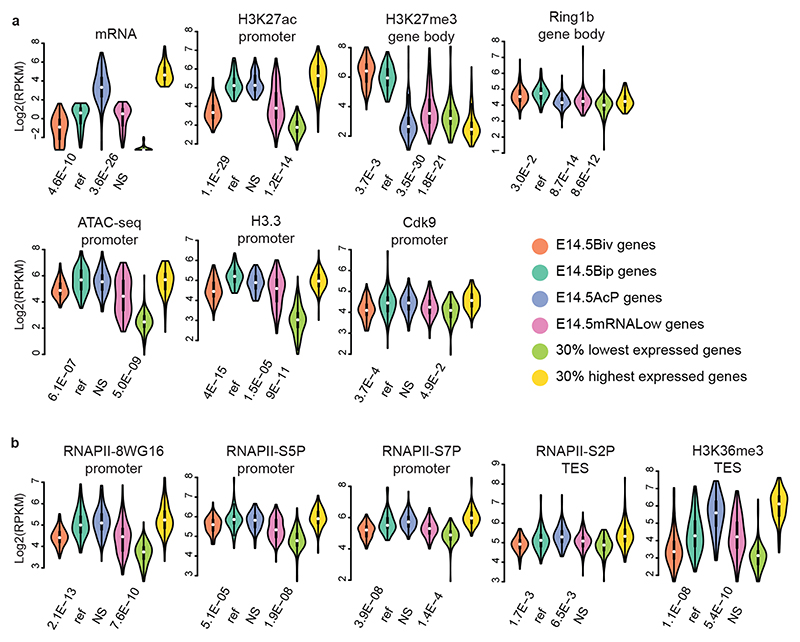
a and b, Violin plots of RNA expression (RNA-seq) and chromatin features (ATAC-seq and ChIP-seq) of bivalent, bipartite, and control gene sets, as indicated. Comparison of Drg11vPrV-ZsGreen/+ barrelette neuron E14.5 bivalent genes (E14.5Biv, orange), E14.5 bipartite genes (E14.5Bip, green), E14.5 non-Bip genes with Bip-matching promoter H3K27ac levels (E14.5AcP, blue), E14.5 non-Bip genes with E14.5Bip-matching mRNA levels (E14.5mRNALow, magenta), 30% lowest (light green) and 30% highest (yellow) expressed genes illustrating the maximal signal range (Methods). Each gene set contains n = 97 genes (Methods). Plots extend from the data minima to the maxima with the white dot indicating median, the box showing the interquartile range and whiskers extending to the most extreme data point within 1.5× the interquartile range from the box. P values are from a two-sided Wilcoxon’s tests between each gene set and the E14.5Bip gene set, labeled as ‘ref’ for reference. NS: not significant (P > 0.05).
Moreover, E14.5Bip genes displayed dramatically lower productive mRNA levels than E14.5 non-bipartite genes with Bip-matching promoter H3K27ac levels (E14.5AcP, Fig. 4a, mRNA). To investigate why active bipartite promoters did not drive higher levels of productive transcription, we determined ChIP enrichment for distinct phosphorylated forms of the main subunit of RNAPII. The RNAPII C-terminal domain changes its serine phosphorylation pattern as RNAPII progresses from initiation (S5P) through productive transcription and elongation (S7P and S2P)28–30. Transcriptionally productive and elongating RNAPII-S5P+S7P+S2P+ is detected at active genes, whereas not productively elongating RNAPII-S5P+S7P-S2P-, also little or not recognized by the 8WG16 antibody, is detected at Pc-repressed bivalent genes29,31,32.
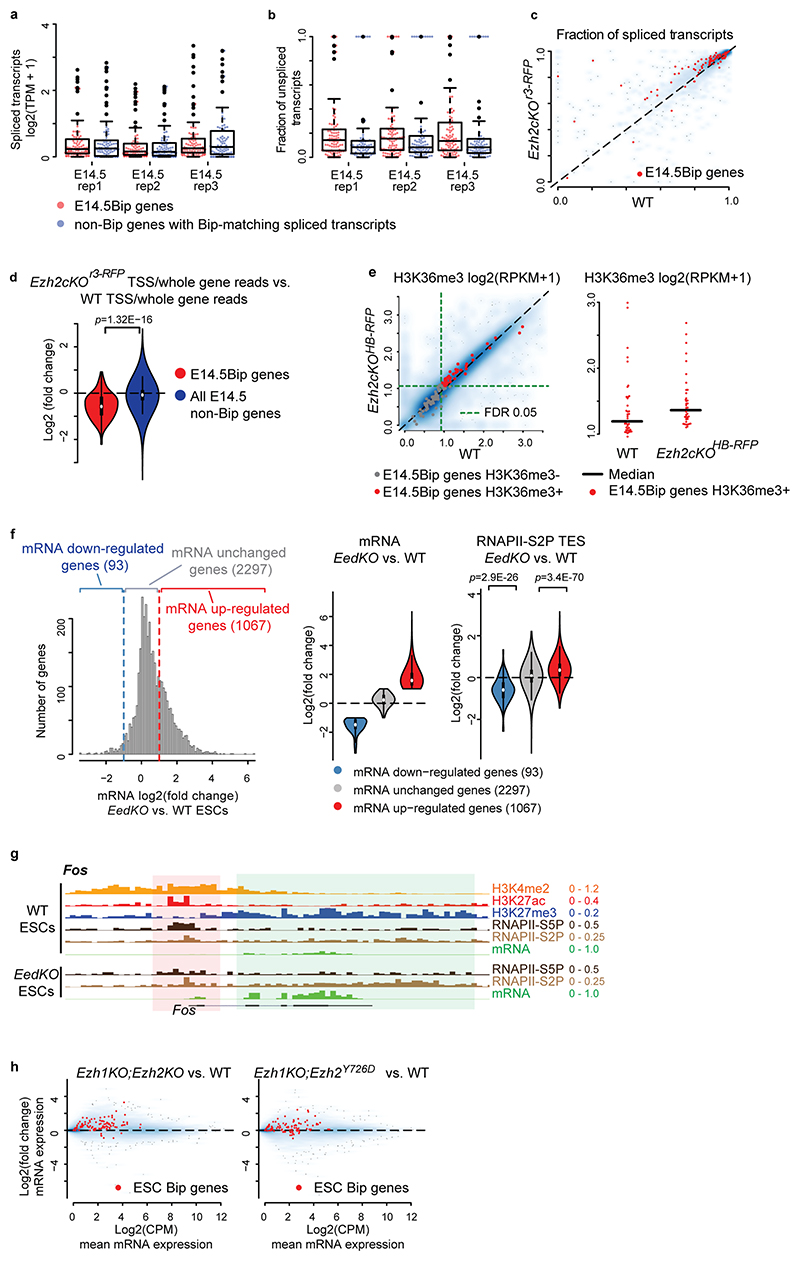
We found a unique pattern of RNAPII at E14.5Bip genes. Namely, 8WG16, RNAPII-S5P and -S7P levels at E14.5Bip promoters were similar to E14.5AcP promoters, and higher than non-Bip genes with low, Bip-matching, levels of productive mRNA transcription (E14.5mRNALow; Methods) and E14.5Biv promoters (Fig. 4a,b). In contrast, around the E14.5Bip transcription end sites (TESs, Methods), the levels of RNAPII-S2P and H3K36me3, a mark of productive mRNA elongation into gene bodies28, were significantly lower than in E14.5AcP genes, though higher than in E14.5Biv genes and comparable to E14.5mRNALow genes (Fig. 4b). Genome browser views of E14.5 bipartite Fos and Egr1 loci confirmed that both RNAPII-S5P and -S7P pause at the promoter-proximal first exon regions, while RNAPII-S7P and -S2P levels are barely detectable in the H3K27me3+ gene body regions (Extended Data Fig. 6d). This distribution is generally shared by E14.5Bip genes (Fig. 4). In addition, total RNA analysis (Ovation SoLo RNA-Seq; Methods) showed that E14.5Bip nascent RNA transcripts are not efficiently processed to productive mRNA (Extended Data Fig. 7a, b).
In summary, mRNA processivity of E14.5Bip genes is intermediate between bivalent (E14.5Biv) genes and genes with comparable H3K27ac promoter levels (E14.5AcP). We also demonstrate that mRNA elongation through the gene bodies of E14.5Bip genes is maintained at a low rate, matching with E14.5RNALow genes (Fig. 4a, b), despite similar promoter H3K27ac and RNAPII-S5P levels to E14.5AcP genes.
Polycomb marking of bipartite genes on gene bodies inhibits productive mRNA processing
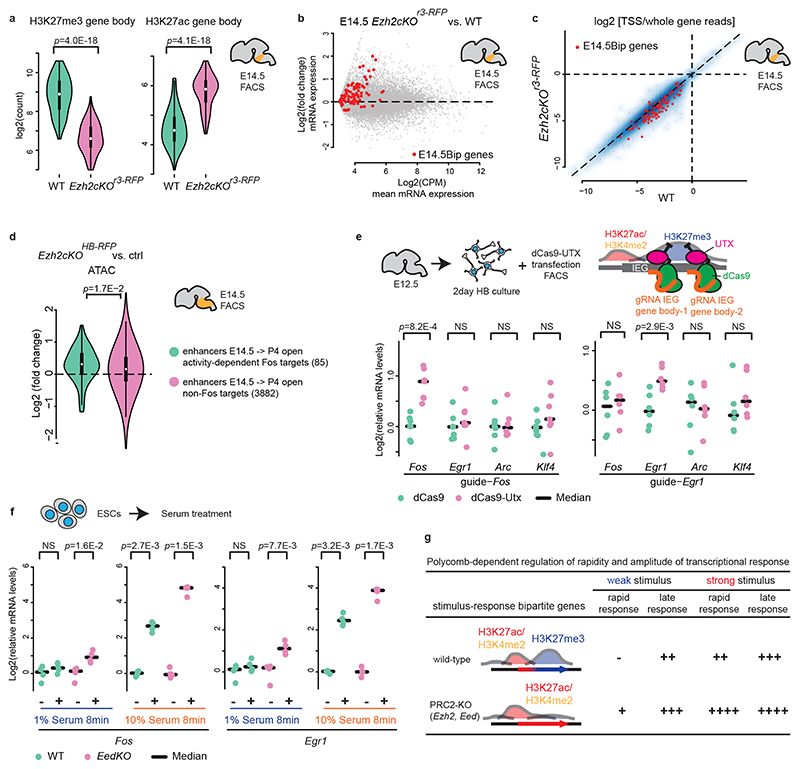
Little is known about a potential role of Pc on gene bodies22,23,33,34. We conditionally inactivated Ezh235, which catalyzes H3K27me3 deposition, in mouse rhombomere 3 (r3) hindbrain derivatives, enriched in vPrV barrelette progenitors and postmitotic neurons (Ezh2cKOr3-RFP, Supplementary Table 1, Supplementary Figs. 1 and 3). In control FACS-isolated E14.5 r3-derivatives, E14.5Bip barrelette neuron genes were in bipartite state (Extended Data Fig. 3e, Supplementary Note), whereas in Ezh2cKOr3-RFP homozygous mutant cells the H3K27me3 mark on E14.5Bip gene bodies was strongly reduced and replaced by the H3K27ac mark (Fig. 5a; see below). Productive mRNA transcription of E14.5Bip genes was significantly increased in Ezh2cKOr3-RFP mutant cells (Fig. 5b). Total RNA-seq analysis indicated that nascent E14.5Bip transcripts were more efficiently processed to productive spliced mRNA in Ezh2cKOr3-RFP mutant cells than controls (Extended Data Fig. 7c). Moreover, accumulation of reads at gene beginning (TSS proximal region) was reduced in mutant compared to wild-type cells (Fig. 5c, Extended Data Fig. 7d). Moreover, likely as a direct result of ectopic Fos induction, 85 activity-regulated Fos-binding enhancers4 (Methods), that normally became open only in postnatal barrelette neurons, gained precocious accessibility in E14.5 FACS-isolated Ezh2 homozygous mutant neurons from bulk hindbrain (Ezh2cKOHB-RFP; Supplementary Fig. 3; Supplementary Table 1, Methods), suggesting incorrect precocious activation of early postnatal Fos-driven enhancer program (Fig. 5d, Extended Data Fig. 8a,b, Supplementary Note).
Fig. 5. Polycomb marking of gene bodies inhibits productive mRNA processing and regulates rapidity and amplitude of transcriptional response to stimuli.
a, Violin plots of gene body H3K27me3 (left) and H3K27ac (right) levels of bipartite (E14.5Bip, n = 100, Methods) genes in control K20tdTomato/+ (WT, green) and Ezh2cKOr3-RFP (purple) conditional knockout E14.5 hindbrain cells. b, MA-plot comparing productive Smart-seq2 mRNA levels of E14.5Bip genes (red dots, n = 100) between E14.5 Ezh2cKOr3-RFP and wild type (WT) hindbrain cells. c, Fractions of total RNA-seq reads at gene transcription start site (TSS) proximal regions (Methods) in E14.5 WT compared to Ezh2cKOr3-RFP hindbrain cells. A blue smooth scatter represents the density of all genes. The E14.5Bip genes, (red dots, n = 82 genes; genes with CPM ≤ 1 are not shown), show improved elongation in Ezh2cKOr3-RFP versus WT (Extended Data Fig. 7d). d, Violin plots, log2 fold changes of enhancer chromatin accessibilities in E14.5 Ezh2cKO (Ezh2cKOHB-RFP) homozygous mutant as compared to heterozygous control neurons; activity-dependent Fos-binding enhancers, normally open only at P4 (green, n = 85 enhancers), gain precocious accessibility when compared to all the remaining enhancers only open at P4 (purple, n = 3,882) (Methods). e, Fos, Egr1, Arc and Klf4 mRNA levels by RT-qPCR in short-term cultured E12.5 hindbrain neurons over-expressing control dCas9 (green) or dCas9-UTX (purple) targeted to Fos (left, n = 7 biologically independent neuron cultures) or Egr1 (right, n = 6 biologically independent neuron cultures) gene bodies. f, Fos (left) and Egr1 (right) mRNA levels by RT-qPCR in serum-starved WT (green) and EedKO (purple) mouse ESCs treated with low (1%) or high (10%) concentration of fetal calf serum (FCS) for 8 minutes (n = 4, biologically independent cultured cells). 1% FCS is not sufficient to induce rapid transcriptional responses in WT, unlike in EedKO, ESCs. 10% FCS induces rapid transcriptional responses in both WT and mutant, though levels are higher in EedKO ESCs. g, Summary of Polycomb-dependent regulation of rapidity and amplitude of bipartite gene transcriptional response to environmental stimuli with distinct strengths. In a and d, plots extend from the data minima to the maxima with the white dot indicating median, the box showing the interquartile range and whiskers extending to the most extreme data point within 1.5× the interquartile range. P values are from paired two-sided Wilcoxon’s tests. In e and f, the median expression is indicated by bars. P values are from Welch’s two-sample two-sided t-tests. NS: not significant (P > 0.05).
Next, we investigated the levels and distribution of elongation marks in Ezh2 mutants. H3K36me3 levels were increased at E14.5Bip genes in Ezh2cKOHB-RFP mutant, as compared to wild-type cells (Extended Data Fig. 7e). To overcome the unfeasibility of obtaining large amounts of cells from Ezh2cKO embryos, we used EedKO mouse ESCs in which the H3K27me3 mark is removed genome-wide36. We carried out RNAPII-S2P ChIP-seq and mRNA-seq in wild-type and EedKO ESCs. For genes carrying H3K27me3 in gene bodies, up-regulation of mRNA levels in EedKO correlated with modest but significant increase of RNAPII-S2P signals in the TES region, compared with wild-type ESCs (Extended Data Fig. 7f,g, Supplementary Note). We then analyzed the transcriptional up-regulation of bipartite genes in full Ezh1KO;Ezh2KO and Ezh2 catalytically inactive Ezh1KO;Ezh2Y726D mutant ESCs37 and found that it is the H3K27me3 mark itself on the gene body, rather than recruitment of Pc proteins, that is required for the inhibition of bipartite gene productive transcription (Supplementary Note; Extended Data Fig. 7h). Taken together, these results indicate that the Pc-dependent H3K27me3 marking of the gene bodies of bipartite genes inhibits productive mRNA elongation.
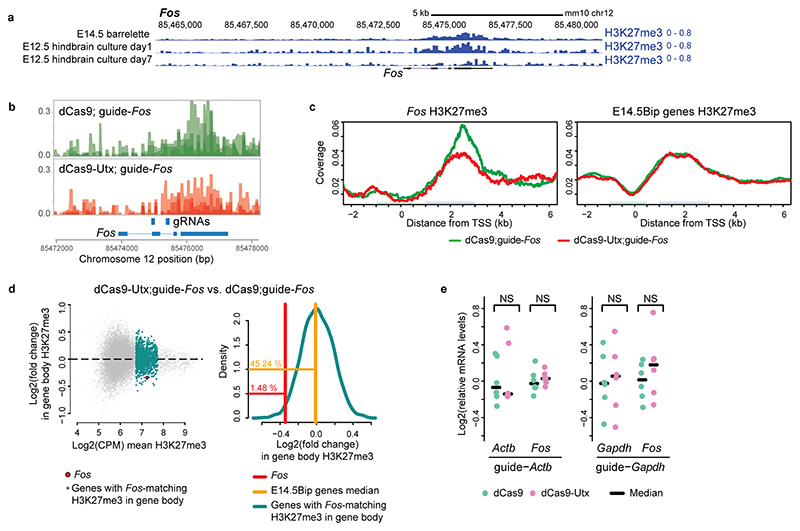
To further support these findings, we selectively depleted the H3K27me3 mark from specific bipartite gene bodies and analyzed its acute effect on productive mRNA transcription. We developed an ex vivo short-term culture of E12.5 neurons from bulk hindbrain tissue; in this system, we observed no H3K27me3 depletion from bipartite gene bodies normally observed in long-term (1 week) hindbrain and cortical neuron embryonic cultures38 (Extended Data Figs. 2a and 9a). Overexpression of the catalytically “dead” Cas9 (dCas9) fused to the H3K27me3-demethylase UTX (Kdm6a) (dCas9-UTX) resulted in the selective decrease of H3K27me3 from the bipartite gene body (i.e. Fos) (Extended Data Fig. 9b-d). Quantification of mRNA levels confirmed that dCas9-UTX targeted to gene bodies of bipartite genes (Fos, Egr1) caused significant transcriptional up-regulation of these genes (Fig. 5e), whereas dCas9-UTX targeted to non-bipartite gene bodies (Actb, Gapdh) did not affect gene expression (Extended Data Fig. 9e).
Together, these results indicate that the H3K27me3 histone mark on gene bodies of bipartite genes interferes with the production and accumulation of mature mRNA from the bipartite active promoters.
The bipartite signature regulates the rapidity and amplitude of transcriptional response to stimuli
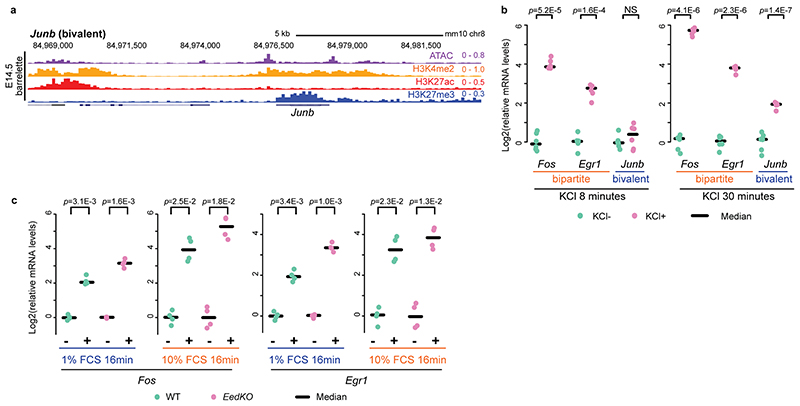
Next, we asked whether the bipartite state may still allow rapid stimulus-dependent inducibility of IEGs, and whether bipartite or bivalent IEGs would display distinct transcriptional responses. We FACS-isolated cells from E14.5 hindbrain bulk tissue and treated them with 55 mM KCl for 8 or 30 minutes. KCl-mediated depolarization of cultured neurons results in increase of intracellular calcium signaling and phosphorylation of CREB, a readout of stimulus-dependent transcription, at IEG promoters and is widely used to mimic the transcriptional response to a wide range of sensory stimuli2,4,17,38. While an 8-minute KCl treatment caused rapid induction of the bipartite Fos and Egr1 IEGs, the bivalent Junb (genome browser, Extended Data Fig. 10a) was not induced; however, its transcripts could be detected after 30 minutes (Extended Data Fig. 10b). Thus, if developing neurons become exposed to a relevant signal, the bipartite signature at the Fos and Egr1 loci may still allow for rapid inducibility, whereas the bivalent state constrains the Junb IEG to a slower response and only in the presence of prolonged stimulation.
We then evaluated the amplitude of the transcriptional response of bipartite IEGs to distinct strengths of the same signal. We used serum treatment after starvation in mouse ESCs, a well-known model to rapidly induce expression of IEGs3. Fos and Egr1 carried the bipartite signature also in mouse ESCs (Extended Data Fig. 3d). We treated serum-starved wild-type and EedKO ESCs with low (1%) or high (10%) concentration of fetal calf serum (FCS) for a short (8 minutes) or a longer (16 minutes) time of exposure and quantified Fos and Egr1 transcriptional induction (Fig. 5f, Extended Data Fig. 10c). 10% FCS treatment could induce a rapid (i.e. within 8 minutes) Fos and Egr1 transcriptional response in both wild-type and EedKO backgrounds; however, the amplitude of the Fos and Egr1 transcriptional responses was higher in EedKO than wild-type ESCs (Fig. 5f). Furthermore, lowering the concentration of the stimulus by 10-fold, i.e. treating with 1% FCS, was not sufficient to elicit a transcriptional response after an 8-minute treatment in wild-type ESCs but caused significant Fos and Egr1 induction in the EedKO background (Fig. 5f). In wild-type ESCs, the bipartite Fos and Egr1 could only be induced after prolonged exposure (i.e. 16 minutes) to 1% FCS (Extended Data Fig. 10c).
In summary, H3K27me3 marking of bipartite IEGs gene bodies, while still allowing for rapid induction, regulates the amplitude of the transcriptional response to relevant stimuli. Moreover, Pc marking of gene bodies of bipartite stimulus response genes may establish a transcriptional threshold to prevent rapid productive induction of IEGs in response to sub-optimal and/or non-physiologically relevant levels of environmental stimuli (summary scheme, Fig. 5g).
Mechanism of stimulus-dependent transition of bipartite to active chromatin
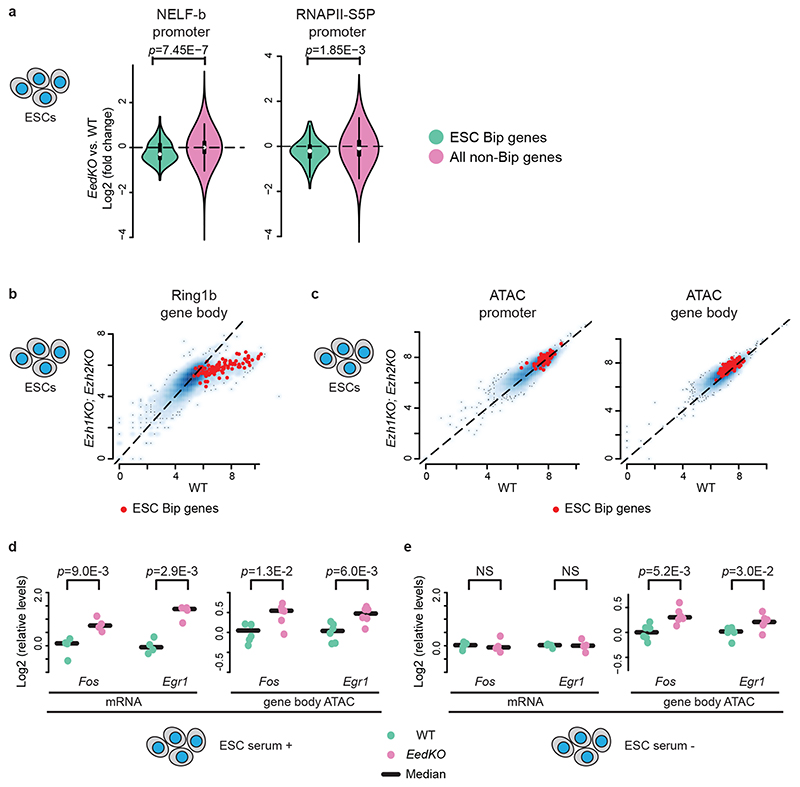
NELF negatively regulates transcriptional elongation by pausing RNAPII at TSSs28. Stimulus-dependent NELF removal from IEG promoters causes release of paused RNAPII into elongation39. We found that H3K27me3 on gene body inhibits transcriptional elongation in bipartite genes in part by interfering with stimulus-dependent NELF release (Fig. 6a, Supplementary Note). Moreover, Ezh1/Ezh2 removal caused a reduction of gene body Ring1b levels in bipartite genes (Fig. 6b), correlating with significant increase of bipartite gene body, though not promoter, accessibility in Ezh1KO;Ezh2KO mouse ESCs (Fig. 6c; see Supplementary Note). Such de-compaction of bipartite gene bodies was not only merely correlative with increased transcription, but was at least partially caused by the removal of H3K27me3 (Fig. 6d,e, Supplementary Note).
Fig. 6. Polycomb marking of bipartite genes bodies hampers productive mRNA elongation by inhibition of stimulus-dependent NELF release and chromatin compaction.
a, Violin plots visualizing log2 fold changes of NELF-b and RNAPII-S5P levels at promoters in EedKO versus wild-type (WT) ESCs; decreased NELF-b and RNAP-S5P levels are selectively detected in ESC bipartite (Bip) (green, top 100 bipartiteness scoring genes in ESCs, n = 100) as compared to non-Bip (purple) genes. Plots extend from the data minima to the maxima with the white dot indicating median, the box showing the interquartile range and whiskers extending to the most extreme data point within 1.5× the interquartile range. P values are from a two-sided Wilcoxon’s test. b and c, Scatter plots comparing gene body Ring1b levels (b) and promoter and gene body accessibilities (c) between WT and Ezh1KO;Ezh2KO ESCs. Bipartite genes (n = 100) are highlighted in red. d and e, mRNA expression and gene body accessibilities of bipartite Fos and Egr1 are visualized in EedKO (purple) as compared to WT (green) ESCs in serum-containing (d) and serum-starved (e) conditions. In the serum-starved condition, even though Fos and Egr1 mRNA levels do not differ between WT and EedKO ESCs, gene body accessibilities (ATAC) are higher in EedKO as compared to WT ESCs. mRNA (n = 4, biologically independent cell cultures), accessibility (n = 6, biologically independent cell cultures) levels at Fos and Egr1 loci were quantified by qPCR and the median is indicated by bars. P values are from Welch’s two-sample two-sided t-tests. NS: not significant (P > 0.05).
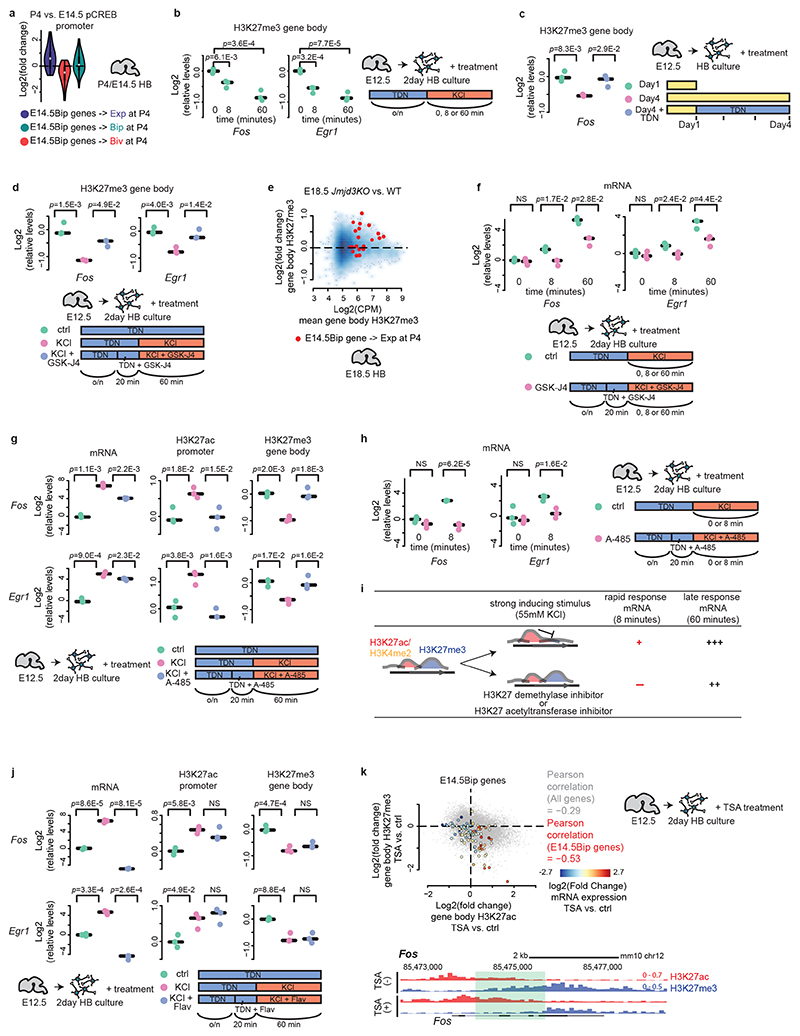
As for the transition from a bipartite to an active state, we reasoned that stimulus-dependent posttranslational modification of transcription factors pre-bound to promoters could be involved, in turn inducing an increase of H3K27ac, decrease of H3K27me3, and gain of productive transcription (Extended Data Fig. 6a). CREB phosphorylation is rapidly increased in response to neuronal activity and/or other environmental stimuli and induce CBP-dependent H3K27ac increase and transcription of IEGs2,9. Indeed, phosphoCREB (pCREB) levels increased in the promoter regions of genes that were bipartite at E14.5 and became active at P4 (Fig. 7a, Bip → Exp), including neuronal activity-induced IEGs such as Fos and Egr1 (Fig. 3e, Extended Data Fig. 6b). This correlated with the resolution of the bipartite signature and productive transcription (Fig. 7a, Extended Data Fig. 6a,d,e).
Fig. 7. Mechanism of stimulus-dependent transition from bipartite to active chromatin.
a, Violin plots visualizing log2 fold changes of promoter phosphoCREB (pCREB) levels of E14.5Bip genes from E14.5 to P4; E14.5Bip genes that become expressed (Exp, blue, n = 20 genes), bivalent (Biv, red, n = 25 genes) or remain bipartite (Bip, green, n = 55 genes) at P4 are compared. Plots extend from the data minima to the maxima with the white dot indicating median, the box showing the interquartile range and whiskers extending to the most extreme data point within 1.5× the interquartile range. b, After over-night (o/n) treatment with TDN = TTX + D-AP5 + NBQX (activity blockers, inhibitors of sodium channel, NMDAR and AMPAR), E12.5 short-term cultured hindbrain neurons were treated by 55 mM KCl for short (8 minutes) and prolonged (60 minutes) time courses at day 2. H3K27me3 decrease is detectable as early as 8 minutes after KCl treatment. b, c, d, f, g, h, j, qPCR quantification of mRNA, H3K27ac and H3K27me3 levels from n = 3 biologically independent neuron cultures (median indicated by bars). c, Shorter (1 day) or longer (4 days) E12.5 hindbrain neurons cultures in presence or absence of the TDN cocktail. d, E12.5 short-term cultured hindbrain neurons treated by KCl for one hour in absence or presence of GSK-J4 at day 2. KCl treatment causes H3K27me3 removal from bipartite IEGs through active demethylation. e, MA-plot comparing gene body H3K27me3 levels of E14.5Bip genes that become expressed at P4 (red dots, n = 20 genes; see a) between E18.5 Jmjd3KO and wild-type (WT) hindbrain. f, Short (8 minutes) or prolonged (60 minutes) KCl treatment of E12.5 short-term cultured hindbrain neurons) in absence or presence of GSK-J4 at day 2, showing that inhibition of H3K27me3 removal prevents rapid induction of bipartite IEGs. g, One-hour KCl treatment of E12.5 short-term cultured hindbrain neurons in absence or presence of A-485 at day 2. h, Short (8 minutes) KCl treatment of E12.5 short-term cultured hindbrain neurons in absence or presence of A-485 at day 2. Inhibition of de novo promoter H3K27ac prevents rapid KCl-dependent induction of bipartite IEGs. n = 3, P values are from a two-sided t-test. NS: not significant (P > 0.05). i, Diagram of H3K27 demethylase (GSK-J4) or acetyltransferase (A-485) inhibitor treatments on neuronal activity-dependent transcriptional induction of bipartite IEGs after short (8 minutes) or prolonged (60 minutes) exposure to strong inducing stimulus (55 mM KCl). j, One-hour KCl treatment of E12.5 short-term cultured hindbrain neurons in absence or presence of flavopiridol (Flav) at day 2. KCl-induced H3K27me3 removal of bipartite IEGs appears to be dependent on de novo promoter H3K27ac but not on transcriptional elongation. k, (left) Scatter plot showing log2 fold changes of gene body H3K27ac (x axis) and H3K27me3 (y axis) levels upon overnight Trichostatin A (TSA) treatment in short-term cultured E12.5 hindbrain neurons. E14.5Bip gene distribution is mapped. Colors indicate the log2 fold changes of mRNA levels of E14.5Bip genes. (bottom) Genome browser of Fos in TSA-treated short-term cultured hindbrain neurons. H3K27me3 levels are reduced by expansion of H3K27ac in the coding region (green highlight). In b, c, d, g, j, P values are from ANOVA followed by Tukey’s HSD post-hoc tests, NS: not significant (P > 0.05). In f and h, P values are from Welch’s two-sample two-sided t-tests, NS: not significant (P > 0.05).
Are strong inducing stimuli, e.g. neuronal activity, able to resolve the bipartite epigenetic state? By treating E12.5 short-term cultured hindbrain neurons with 55 mM KCl, after over-night incubation with a cocktail of neuronal activity blockers (TDN cocktail = TTX + D-AP5 + NBQX; Methods), the H3K27me3 mark was removed from IEG gene bodies (Fig. 7b). Notably, the decrease of the H3K27me3 mark is detectable as early as 8 minutes after KCl treatment (Fig. 7b), showing that H3K27me3 removal starts very rapidly after exposure to the inducing stimuli. Also, treatment of embryonic neurons with a TDN cocktail prevented the removal of H3K27me3 from IEG gene bodies in long-term hindbrain neuron culture (Fig. 7c; also see above and Extended Data Fig. 9a). This indicates that the removal of H3K27me3 from IEG gene bodies is rapid and stimulus-dependent.
Furthermore, treatment with GSK-J4, an inhibitor of H3K27me3 demethylases (i.e. UTX (Kdm6a), Jmjd3 (Kdm6b)) prevented neuronal activity-dependent gene body H3K27me3 removal (Fig. 7d). Similarly, inactivation of Jmjd3 inhibited, at least partially, gene body H3K27me3 removal from the E14.5 bipartite genes that become active at peri/postnatal stages (Fig. 7e, Supplementary Table 1, Supplementary Note). These results indicate that the stimulus-dependent removal of H3K27me3 from IEG gene bodies requires active de-methylation. In addition, GSK-J4 treatment prevented the rapid transcriptional induction of bipartite IEGs after short (8 minutes) exposure to the inducing stimulus (Fig. 7f). Taken together with our previous observation that, in the absence of the H3K27me3 mark in EedKO ESCs, the amplitude of the rapid bipartite IEG transcriptional response upon short exposure (8 minutes) to inducing stimuli (i.e. FCS) is enhanced as compared to wild-type control (Fig. 5f), these results indicate that stimulus-dependent gene body H3K27me3 mark removal is essential to achieve rapid and sizeable transcriptional induction of bipartite IEGs.
On the other hand, after prolonged exposure (i.e. 60 minutes) to the inducing stimulus GSK-J4-treated neurons showed transcriptional up-regulation of bipartite IEGs, even though mRNA levels remained significantly lower as compared to control neurons (Fig. 7f). Thus, in the event of incomplete H3K27me3 mark removal from the gene body, while rapid bipartite IEG mRNA induction is impaired, transcripts can nonetheless accumulate over time upon prolonged stimulation, albeit never reaching optimal levels.
We then tested the requirement of de novo promoter H3K27 acetylation in activity-dependent removal of the gene body H3K27me3. We treated E12.5 short-term cultured neurons with KCl in the presence of A-485, an inhibitor of H3K27 acetyltransferase p300/CBP. A-485 inhibited KCl-dependent increase of promoter H3K27ac levels, and prevented the removal of the H3K27me3 mark from bipartite IEG gene bodies (Fig. 7g), indicating that gene body H3K27me3 removal requires stimulus-dependent de novo promoter H3K27 acetylation. Furthermore, A-485 treatment prevented rapid induction of bipartite IEGs after short-time (i.e. 8 minutes) exposure to KCl (Fig. 7h), similarly to GSK-J4 treatment (Fig. 7f), indicating that fast bipartite IEG transcriptional induction requires de novo H3K27 acetylation and rapid removal of the gene body H3K27me3 mark through active de-methylation (Fig. 7i, scheme; Supplementary Note). Moreover, the KCl-dependent gene body H3K27me3 removal is not merely the consequence of transcriptional elongation but it is at least partly driven by the de novo promoter acetylation per se (Fig. 7j, Supplementary Note).
Lastly, treatment of E12.5 short-term cultured neurons with the histone deacetylase (HDAC) inhibitor trichostatin A (TSA), resulted in the spreading of H3K27ac into the bipartite gene bodies and H3K27me3 removal, increase of mRNA levels, and resolution of the bipartite signature into an active state (Fig. 7k). Together with the analysis of E14.5 Ezh2cKO hindbrain cells (Fig. 5a), and the finding that bipartite genes can revert to bivalency during development (Fig. 3d, Extended Data Fig. 6a), we propose that a dynamic reciprocal balance between the H3K27ac and H3K27me3 marks maintains the bipartite signature.
In summary, stimulus-dependent increase of promoter H3K27ac causes active and rapid H3K27me3 removal from the gene body and release of the elongation barrier, switching from the bipartite to the productive active transcription state.
Discussion
During development, the response to environmental signals requires rapid, stimulus-dependent, transcriptional responses through the induction of IEGs, whose gene products in turn regulate the activation of specific LRGs, driving cell type-specific differentiation schedules6,8. How chromatin states and epigenetic regulation contribute to the timely and rapid activation of stimulus-induced developmental transcriptional programs is poorly understood. Here, we discovered an unusual Pc-dependent bipartite chromatin signature at stimulus-response IEGs prior to their transcriptional induction in developing neurons, whereas LRGs were preferentially maintained in a bivalent chromatin state. Moreover, we found that the bipartite state is not an exclusive feature of developing neurons but it is generally present in developing cell types and in ESCs. The bipartite state originates from the bivalent state and is dynamic during development, reverting to bivalency or resolving into rapid activation (Fig. 8). Bipartite genes carry an active promoter and the Pc-dependent H3K27me3 mark on the gene body, which inhibits RNAPII transcriptional elongation regulating the transition into stimulus-dependent productive transcription of bipartite genes (Fig. 8). We demonstrate that this unique chromatin signature provides a suitable epigenetic structure to modulate the rapidity and amplitude of the transcriptional response of inducible IEGs to distinct stimuli during development, while inhibiting IEG productive transcription in response to sub-optimal and/or non-physiologically significant levels of environmental stimuli (Fig. 5g). Additional Discussion can be found in Supplementary Discussion.
Fig. 8. Polycomb-dependent regulation of stimulus-response genes during development.
During development, a subset of stimulus-response genes displays a bipartite chromatin signature that carries active H3K27ac+/H3K4me2+ on promoters but repressive H3K27me3+ on gene bodies (middle). The bipartite signature originates from H3K27me3+/H3K4me2+ bivalent chromatin maintaining a transcriptionally poised state and non-productive transcription (left). Distinct transcription factors cause partial resolution of a subset of bivalent poised promoters of stimulus-response genes into the bipartite state. Active promoters of bipartite genes carry actively initiating RNAPII (high 8WG16, S5P and S7P); however, productive mRNA processing and elongation in gene bodies are maintained at a low rate (low RNAPII-S2P and H3K36me3) due to inhibition of stimulus-dependent NELF release and chromatin compaction by Pc (Ezh1/2, Eed)-dependent H3K27me3 (inhibition sign). Pc-dependent marking on gene bodies also inhibits spreading of H3K27ac and accessibility in bipartite gene body regions (mutual inhibition signs). The bipartite state is dynamic and could revert to bivalency. The bipartite signature maintains the potential for fast induction by relevant/strong stimuli, while preventing inappropriate induction by non-relevant/weak stimuli. Inducing stimuli cause de novo promoter H3K27 acetylation, which causes H3K27 demethylase (Kdm6; i.e. UTX and Jmjd3)-dependent rapid removal of the Pc mark from bipartite gene bodies (inhibition sign) and fast transcriptional response by transcription factors (right).
Methods
Mating scheme
To obtain E10.5 and E14.5 Krox20::Cre;R26tdTomato (K20tdTomato/+) embryos, the Krox20::Cre transgenic mouse line40 was crossed with the R26tdTomato reporter mouse line41 (The Jackson Laboratory, #007905). To obtain E14.5, E18.5 and P4 Drg11::Cre;R26RZsGreen;r2::mCherry (Drg11ZsGreen/+;r2mCherry/+) mice, the Drg11::Cre transgenic mouse line42, the R26RZsGreen reporter mouse line41 (The Jackson Laboratory, #007906) and the r2::mCherry (r2mCherry/+) transgenic mouse line42 were crossed (see Extended Data Fig. 1c). To obtain E14.5, Drg11::Cre;R26tdTomato;r2::EGFP (Drg11tdTomato/+;r2EGFP/+) mice, the Drg11::Cre transgenic mouse line, the R26tdTomato reporter mouse line and the r2::EGFP (r2EGFP/+) transgenic mouse line (see Supplementary Methods) were crossed (see Extended Data Fig. 1d). To obtain E18.5 Drg11::Cre;R26Kir-mCherry;r2::EGFP (Drg11Kir/+;r2EGFP/+) mice, the Drg11::Cre transgenic mouse line, the R26Kir-mCherry 43 mouse line and the r2EGFP transgenic mouse line were crossed (see Extended Data Fig. 1e). To obtain E14.5 Krox20::Cre;Ezh2flox/flox;R26RFP (Ezh2cKOr3-RFP) mouse, the Krox20::Cre;Ezh2flox/+ mouse line was crossed with the Ezh2flox/flox;R26RFP mouse line. Ezh2flox mouse line is a kind gift from S.H. Orkin35. The R26RFP mouse line was described before44. To obtain E14.5 Hoxa2::Cre;R26tdTomato (Hoxa2tdTomato/+) embryos, the Hoxa2::Cre transgenic mouse line45 was crossed with the R26tdTomato reporter mouse line. To obtain E14.5 Hoxa2::Cre;Ezh2flox/flox;R26RFP (Ezh2cKOHB-RFP) mouse, the Hoxa2::Cre;Ezh2flox/+;R26RFP mouse line was crossed with the Ezh2flox/flox;R26RFP mouse line. Hoxa2::Cre line, that labels from r2 to posterior hindbrain neurons, was utilized to collect relatively large number of hindbrain neurons to enable the molecular analysis of Ezh2-null neurons (see below). To obtain P8 Krox20::Cre;R26Kir-mCherry (K20Kir/+) mice, the Krox20::Cre transgenic mouse line was crossed with the R26Kir-mCherry mouse line. To obtain P8 Krox20::Cre;R26tdTomato;r2::EGFP (K20tdTomao/+;r2EGFP/+) mice, the Krox20::Cre;r2:EGFP mouse line was crossed with the R26tdTomato reporter mouse line. To obtain P8 Krox20::Cre;R26Kir-mCherry;r2::EGFP (K20Kir/+;r2EGFP/+) mice, the Krox20::Cre;r2::EGFP mouse line was crossed with the R26Kir-mCherry mouse line. Jmjd3-/- (Jmjd3KO) mouse line was described previously46. To obtain P10 Krox20::Cre;LSL-R26TVA-LaxZ (K20TVA/+) mouse, Krox20::Cre transgenic mouse line was crossed with LAL-R26TVA-LacZ transgenic mouse line47, a kind gift of D. Saur. To obtain P10 Krox20::Cre;LSL-R26TVA-LacZ;R26Kir-mCherry (K20TVA/Kir) mouse, Krox20::Cre;LSL-R26TVA-LacZ mouse line was crossed with R26Kir-mCherry transgenic mouse line.
Nomenclatures for mouse lines are summarized in Supplementary Table 1.
Dissociation of hindbrain tissue and isolation of cells by fluorescence-activated cell sorting (FACS)
To collect rhombomere 3 (r3)-derived progenitors from E10.5 K20tdTomato/+ mouse, r2–r4 regions were micro dissected. Dissected tissue was kept in PBS 1× on ice, then treated with papain digestion mix (papain 10 mg/ml/ cysteine 2.5 mM/ HEPES pH7.4 10 mM/ EDTA 0.5 mM/ DMEM 0.9×) for 3 minutes at 37°C and immediately put on ice. Tissue was rinsed by ice-cold DMEM 1×, and dissociated by pipetting and filtered. r3-derived cells were collected by FACS (Supplementary Fig. 1). Processing of these cells was adapted for further analyses (e.g. RNA-seq, ATAC-seq and ChIP-seq). To collect post-mitotic barrelette neurons of vPrV (Drg11vPrV-ZsGreen/+, Drg11vPrV-tdTomato/+, Drg11vPrV-Kir/+, for nomenclatures see Extended Data Fig. 1c-e, Supplementary Table 1, Supplementary Note) from E14.5, E18.5 and P4 Drg11ZsGreen/+;r2mCherry/+, Drg11tdTomato/+;r2EGFP/+ or Drg11Kir/+;r2EGFP/+ mice, r2–r3-derived regions were micro dissected. The boundary between r3 and r4 was identified by the position of the facial nerve. Dissected tissue was kept in PBS 1× on ice, then treated with papain digestion mix for 4 minutes at 37°C and immediately put on ice. Tissue was rinsed by ice-cold DMEM 1×, and dissociated by pipetting and filtered. Wild-type (Drg11vPrV-ZsGreen/+, Drg11vPrV-tdTomato/+) barrelette neurons were FACS-sorted by selecting green single-positive cells from Drg11ZsGreen/+;r2mCherry/+ mice or red single positive cells from Drg11tdTomato/+;r2EGFP/+ mice, while activity-deprived barrelette neurons (Drg11vPrV-Kir/+) were sorted by collecting red single-positive cells from Drg11Kir/+;r2EGFP/+ mice (see Extended Data Fig. 1, Supplementary Fig. 2). Processing of these cells was adapted for further analyses (e.g. RNA-seq, ATAC-seq and ChIP-seq). To collect r3-derived hindbrain cells from E14.5 K20tdTomato/+ or Ezh2cKOr3-RFP mouse, r2–r4 regions were micro dissected. Dissected tissue was kept in PBS 1× on ice, then treated with papain digestion mix for 3 minutes at 37°C and immediately put on ice. Tissue was rinsed by ice-cold DMEM 1×, and dissociated by pipetting and filtered. r3-derived cells were collected by FACS (Supplementary Fig. 3a). Processing of these cells was adapted for further analyses (e.g. RNA-seq and ChIP-seq). To collect hindbrain cells from E14.5 Hoxa2tdTomato/+ or Ezh2cKOHB-RFP mouse, hindbrain regions (from the exit of the trigeminal nerve in the rostral hindbrain down to the beginning of the spinal cord) were micro dissected. Dissected tissue was kept in PBS 1× on ice, then treated with papain digestion mix for 3 minutes at 37°C and immediately put on ice. Tissue was rinsed by ice-cold DMEM 1×, and dissociated by pipetting and filtered. Hindbrain-derived cells were collected by FACS (Supplementary Fig. 3b). Processing of these cells was adapted for further analyses (e.g. RT-qPCR, ATAC-seq and ChIP-seq).
Over-expression of dCas9-UTX
Ex vivo cultured E12.5 hindbrain neurons (see Supplementary Methods) were transfected by Lipofectamine 2000 (Thermo Fisher Scientific, 11668019) at the culture Day 1. dCas9 or dCas9-UTX fusion protein over-expression vector was co-transfected with two gRNA/EGFP over-expression vectors (pGuide_EGFP) targeted to the mouse genes (i.e. Fos, Egr1, Actb, Gapdh; see Supplementary Methods). After 24 hours (Day 2), neurons were dissociated by 0.05% Trypsin/EDTA. About 1% GFP-positive neurons were collected by FACS (Supplementary Fig. 4). Processing of these cells was adapted for further analyses (RNA extraction and ChIP-seq of H3K27me3, see below and Supplementary Methods).
KCl, Trichostatin A (TSA), TDN cocktail, GSK-J4, A-485 and Flavopiridol treatment
Ex vivo cultured E12.5 hindbrain neurons were treated with 2 μM trichostatin A (TSA) (MBJ. JM-1606-1) at the culture Day 1 and incubated for 16 hours. As for the KCl treatment, cultured hindbrain neurons were treated with a cocktail of neuronal activity blockers (TDN cocktail = 1 μM tetrodotoxin (TTX)(TOCRIS, 1069) + 100 μM D-AP5 (Sigma, A8054) + 20 μM NBQX (TOCRIS, 0373) at Day 1 for an over-night incubation, and 55 mM KCl containing medium was treated at Day 2 in the presence or absence of 35 μM GSK-J4 (Sigma, SML0701), 50 μM A-485 (TOCRIS, 6387) or 10 μM Flavopiridol (Sigma, F3055) after a rinse. As for Drg11tdTomato/+ cultured hindbrain neuorns, tdTomato+ neurons were sorted immediately after the KCl treatment. Processing of these cells was adapted for further analyses (mRNA-seq, ATAC-seq and ChIP-seq, see below and Supplementary Methods).
Serum shock of mouse ESCs
Wild-type and EedKO mouse ESCs were cultured up to 80 % confluence in the normal culture medium (see Supplementary Methods) and subsequently serum starved for overnight in the culture medium that does not contain FCS. Serum-starved ESCs were treated by a low (1%) or high (10%) concentration of FCS for a short (8 minutes) or a longer (16 minutes) time of exposure. After reaction, total RNA was immediately extracted by RNeasy Mini Kit (QIAGEN, 74104) with genomic DNA digestion using RNase-Free DNase I Set (QIAGEN, 79254) according to manufacturer’s protocol, and RT-qPCR was conducted (see Supplementary Methods).
Sample preparation, RNA isolation and sequencing (RNA-seq)
For RNA-seq experiments, total RNA was extracted by NORGEN Single Cell RNA Purification Kit (NORGEN, 51800) with genomic DNA digestion using RNase-Free DNase I Kit (NORGEN, 25710) according to manufacturer’s protocol. Library preparation protocols for poly A+ mRNA (Smart-seq2 protocol48) and total RNA (Ovation SoLo RNA-seq System) are described in Supplementary Methods. Protocols for single-cell RNA-seq (10X Genomics) are also described in Supplementary Methods.
Sample preparation, chromatin immunoprecipitation and sequencing (ChIP-seq)
Cells were cross-linked with 1% formaldehyde for 10 minutes at room temperature (RT) and quenched with 125 mM glycine for 5 minutes at RT. To achieve the sequencing of chromatin immunoprecipitated from small amounts of cells, preparation of ChIP-seq library was mostly done by ChIPmentation protocol49. Cells were lysed in Sonication Buffer (10 mM Tris HCl pH8, 5 mM EDTA, 0.5% SDS, 0.1× PBS, 1× Protease Inhibitor Cocktail (PIC – cOmplete – EDTA free, Roche, 04693132001)) on ice, and sonicated using the Covaris machine to obtain DNA fragment the size of which distributes between 150 bp and 500 bp. The supernatant was transferred to a new tube, diluted with Equilibration Buffer (10 mM Tris HCl pH8, 1 mM EDTA, 140 mM NaCl, 1% Triton X-100, 0.1% Sodium deoxycholate, 1× Protease Inhibitor Cocktail). Chromatin solutions were incubated overnight at 4°C with antibodies. The next day, protein G coupled to magnetic beads (Dynabeads Protein G, Thermo Fisher, 10004D) were added and the incubation was continued for 2 hours at 4°C. The beads were then washed and resuspended in Tagmentation Buffer (10 mM Tris HCl pH8, 5 mM MgCl2) containing Tagment DNA Enzyme from the Nextera DNA Sample Prep Kit (Illumina, FC-121-1030) and incubated at 37°C for 10 min. The beads were washed and DNA was eluted from the beads with Elution Buffer (10 mM Tris HCl pH8, 5 mM EDTA, 300 mM NaCl, 0.5% SDS, proteinase K) at 65°C. DNA was purified with SPRI AMPure XP beads (Beckman, sample to beads ratio 1:2) and eluted in 10 mM Tris HCl pH8. libraries were prepared in 50-μl reaction (1× KAPA HiFi Hot Start Ready Mix and 0.8 μM primers). Enriched libraries were purified with size selection using SPRI AMPure XP beads (sample to beads ratio 1:0.6) to remove long fragments, recovering the remaining DNA (sample to beads ratio 1:2). Sequencing was performed on an Illumina HiSeq 2500 machine (50-bp read length, single-end). The ChIP-seq protocol was optimized for different experiments (e.g. FACS-sorted cells, bulk tissue, cultured cells, pre-fixed tissue, sequential ChIP-seq, see Supplementary Methods).
Sample preparation and assay for transposase accessible chromatin (ATAC-seq)
ATAC-seq experiments were performed as described previously50 with minor modifications. For each experiment, 50,000–70,000 cells were used. Two independent biological replicates were prepared. For the detailed protocol of ATAC-seq, see Supplementary Methods.
Reference genome and annotation
The mouse GRCm38/mm10 genome assembly was used as reference. The transcription start site (TSS) most variable in promoter chromatin accessibility in our datasets was selected per gene. Promoter (P) regions were defined as 1,000 bp upstream and 500 bp downstream of that TSS. Gene body (GB) regions were defined from 1,001 bp to 3,000 bp downstream the TSS (Extended Data Fig. 5a), and transcription end sites (TES) as the last 2,000 bp of the most downstream transcript. Spliced and unspliced counts for total RNA datasets (Ovation SoLo RNA-Seq) were obtained for GENCODE transcripts. The unspliced transcriptome was created by including intronic regions in each transcript. For the sequential ChIP analysis, regions were defined as the start of P to the end of GB. In Figure 5c TSS proximal regions were defined from 100 bp upstream to 200 bp downstream the TSS (exonic regions) and compared that to all exonic regions in the gene.
Read alignment to the reference genome
mRNA and total RNA reads were aligned to the genome with STAR and converted to bam files with samtools. In addition, for total RNA datasets, salmon was used to estimate spliced and unspliced transcript abundances. For better comparability with 51-mer paired-end (PE) samples, reads in ATAC-seq samples that had been sequenced as 76-mer PE were trimmed to 51-mer PE using cutadapt, followed by adapter sequence trimming. The trimmed ATAC-seq and ChIP-seq samples were aligned with bowtie2. For genome browser views, the number of alignments per 100-bp window and per million alignments in each sample were calculated and stored in BigWig format with QuasR using qExportWig. When appropriate, counts were corrected to reduce between-sample non-linearities using limma’s normalizeCyclicLoess 51. Coordinates of expected 4C fragments were created by in silico digesting the genome with DpnII. Valid fragments were defined as fragments containing an NlaIII site at least 30 bp away from the fragment start and end. Reads were aligned to the genome with QuasR using qAlign.
Peaks were called on ATAC-seq samples per condition using MACS2 with –f BED, --nomodel, --shift -100, --extsize 200, and --keep-dup all. For E14.5 barrelette H3K27me3, Polycomb (Pc) peaks were defined using a hidden semi-markov model with mhsmm 52 to detect Pc regions of varying sizes. Each gene in Figure 1c was Pc-overlapping if any of its transcripts overlapped with the defined Pc regions. For other ChIP samples, positive regions were defined using a Gaussian mixture model as described in Minoux et al., 201725.
To define barrelette enhancers, we used the union of the ATAC peaks from both E14.5 and P4 barrelette neurons which are at least 1,000 bp away from any TSS with an ATAC log2 fold change greater than 1.5× from E14.5 to P4. Using neuronal activity-dependent Fos targets from Malik et al., 20144, we divided our enhancers into Fos-overlapping (85) and non-Fos-overlapping (3,882).
Read quantification and abundance estimation
All analyses downstream of alignment steps were performed in R. RNA-, ATAC-, and ChIP-seq samples were quantified with QuasR’s qCount on genes (exons) or specified genomic regions defined above. Salmon was used with tximport to quantify spliced and unspliced transcripts per million for total RNA datasets. Single-cell RNA-seq data were quantified with CellRanger53, followed by quality control and log-transformation of UMI counts with scran and scater.
Raw counts were corrected for library size differences by multiplying by scaling factors, calculating counts per million, or calculating reads per kilobase per million (RPKM), followed by averaging across replicates and a log2 transformation. For samples with a strong GC-bias or genome-wide signal changes (Ezh2cKO), specific normalizations were applied (see Supplementary Methods for details).
Activity response genes (ARGs)
ARGs specific to barrelette neurons (bsARGs) were defined as genes lowly expressed at E14.5 (RPKM < 3), upregulated from E14.5 to E18.5, and downregulated between E18.5 Kir-OE and E18.5 wild type (56 genes: Extended Data Fig. 1q-s). Differential expression analyses were done with edgeR using glmQLFit. Non-barrelette ARGs (nbARGs) were defined based on the literature16–18. All activity-dependent genes (rapid and late induced) were used and only genes not expressed (RPKM < 3) in all of E14.5, E18.5 and P4 barrelette neurons and not contained in the bsARGs were kept (83 genes). The bsARGs and nbARGs were grouped as immediate early genes or late response genes as obtained from the literature16–18 (See Supplementary Methods for details), and manually classified as bipartite or bivalent based on histone modifications at E14.5.
Bipartite and bivalent gene scores
To calculate a ‘bipartiteness’ score, we selected genes with low expression (RPKM < 3), more H3K27ac in P than in GB, and more of H3K27me3 in GB than in P. We separately ranked H3K27ac in P and H3K27me3 in GB from low to high and summed the two ranks for each gene. A ‘bivalency’ score was calculated similarly for genes with low expression (RPKM < 3) and summing the ranks of H3K27me3 in P and H3K4me2 in P.
Visual inspection of individual gene loci on the genome browser and correlation between biological replicates were used to evaluate both scores and confirmed strong correlation of bipartiteness and bivalency scores with true bipartite or bivalent chromatin signature, respectively (Extended Data Fig. 3a,b). By calculating the fraction of true positives (Extended Data Fig. 3a,b) for different score values, we estimated the total number of bipartite and bivalent genes in each condition (Fig. 2a). We used conservative definition of bipartite genes and considered only top 100 scoring genes (E14.5Bip genes). We confirmed that this threshold selects at least 75-80% true bipartite genes (Extended Data Fig. 3a), allowing for efficient detection of bipartite genes without manual classification. The chromatin mark distributions surrounding the TSSs for the top 100 bipartite and bivalent genes were obtained using QuasR’s qProfile, normalized for library size, scaled between 0 and 1 and smoothed with runmean (Fig.2b) (See Supplementary Methods).
For the top 100 E14.5 bipartite and bivalent genes in barrelette neurons, the CpG observed-over-expected ratio was calculated in 100-bp bins around the TSS and averaged across genes. Motif enrichment analysis on promoters of bipartite and bivalent genes was carried out using monaLisa and Homer54.
Visualizing combined chromatin states with t-SNE
H3K27me3, H3K27ac, and H3K4me2 and chromatin accessibility (ATAC) were quantified for each gene in P and GB regions as log2 RPKM values. t-distributed stochastic neighbor embedding (t-SNE)55 was used to create a two-dimensional embedding, placing genes with similar chromatin landscapes close together. For the combined t-SNE (Fig.3a), additional normalization steps were performed to reduce between-sample non-linearities (see Supplementary Methods for details).
Using the 100 top-scoring genes for the single time point t-SNE (E10.5 t-SNE) map and the top 300 genes for the combined t-SNE map (E14.5/E18.5/P4 combined t-SNE), two-dimensional densities for bipartite and bivalent genes were estimated with kde2d from MASS 56, and visualized as contour lines (see Extended Data Fig. 5g, l). We calculated Euclidean distances of genes between P4 and E14.5 on the original 8-dimentional space consisting of normalized log2(RPKM) counts of ATAC, H3K27me3, H3K27ac, and H3K4me2 on the P and GB regions, and colored the E14.5 t-SNE by this distance (Extended Data Fig. 5h).
The 100 top-scoring genes for ‘bipartiteness’ at E14.5 were divided into 3 groups: genes that become expressed at P4 (RPKM ≥ 3) (20 genes), that become bivalent (move into the bivalent contour at P4, see Fig. 3d) (25 genes), and that remain bipartite (55 genes) (see Extended Data Fig. 6a).
Gene sets for comparison to E14.5 Bipartite genes
For Figure 4, we first selected the top 100-scoring bipartite and bivalent genes at E14.5 (E14.5Bip and E14.5Biv) and excluded 3 genes contained in both sets. Control sets of the same number of genes (97) were then created using swissknife: E14.5AcP genes were sampled from all genes except the top 400 E14.5 bipartite genes and E14.5Biv genes, to have similar H3K27ac distribution in P as E14.5Bip. E14.5mRNALow genes that match E14.5Bip in log2 RPKM mRNA expression were sampled similarly from all genes excluding E14.5Biv, the top 400 E14.5 bipartite genes and E14.5AcP. Finally, two sets were sampled from the bottom and top 30% of genes ordered by mRNA expression, excluding any of the genes already contained in the previous sets. For the E10.5 samples, gene sets of size 99 were similarly created, excluding 1 gene that was common between the top 100 bipartite and bivalent genes (Extended Data Fig. 4e). For Extended Data Figure 7a,b, Entrez identifiers from the top 100 E14.5 bipartite genes were mapped to Ensemble IDs using biomaRt57, resulting 90 successfully mapped identifiers. A control set of the same size with matching spliced transcript abundance, excluding the top 400 E14.5 bipartite genes, was then randomly sampled.
Additional details
For more details on the analyses, including package or tool versions and parameters, see Supplementary Methods.
Extended Data
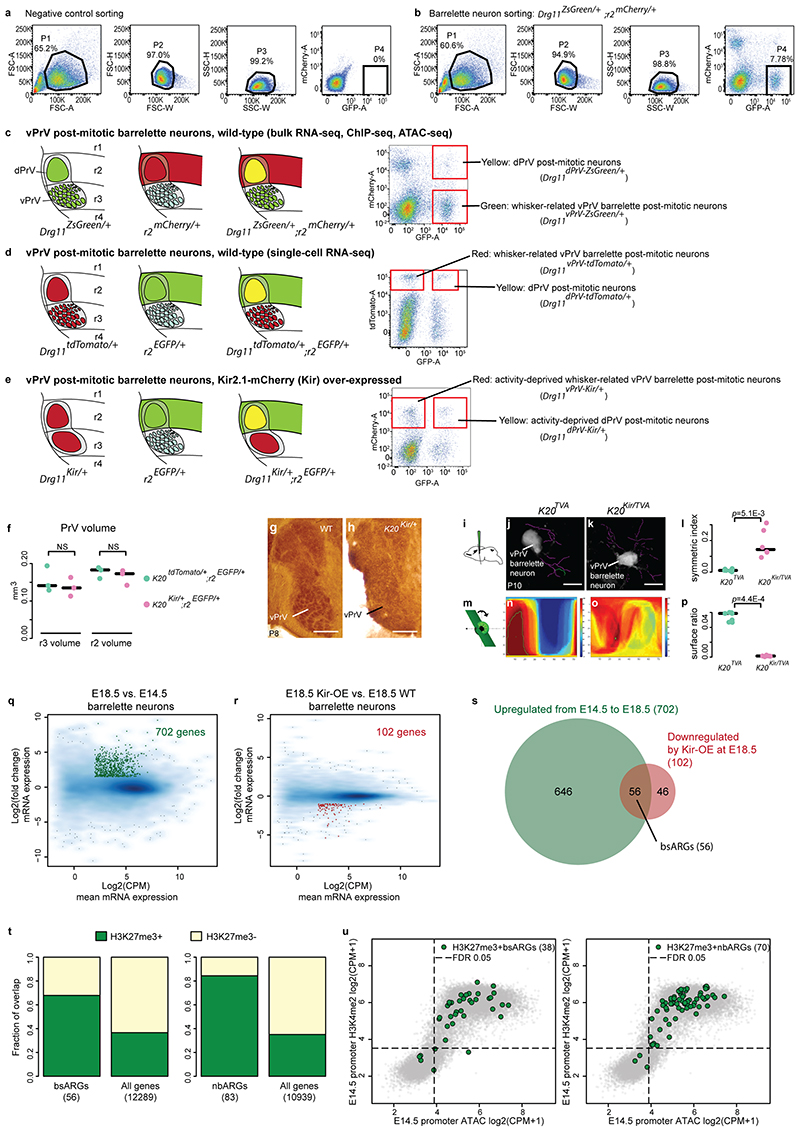
Extended Data Fig. 1. Genetic strategy of barrelette neuron isolation and identification of activity response genes.
a and b, Representative FACS gating for barrelette neurons (Supplementary Figs. 1-4). c and d, Intersectional strategies to FACS isolate E14.5, E18.5 or P4 post-mitotic barrelette neurons (Drg11vPrV-ZsGreen/+ (c), Drg11vPrV-tdTomato/+ (d)) from ventral principal trigeminal nucleus (vPrV). (Supplementary Table 1, Supplementary Note). e, Intersectional strategy to FACS isolate Kir2.1(Kir)-mCherry overexpressing, neuronal activity-deprived, vPrV barrelette neurons (Drg11vPrV-Kir/+) (Supplementary Table 1, Supplementary Note). f, Volumes of PrV in control (K20tdTomato/+;r2EGFP/+) and Kir over-expressing (K20Kir/+;r2EGFP/+) mice (n = 3, biologically independent animals). g and h, P8 cytochrome oxidase (CO) staining in wild-type (WT) (g) and K20Kir/+ (h) mice. Representative images of n = 3 biologically independent animals. Scale bars: 200 μm. i – p, P10 barrelette neuron dendrite orientation by GFP expression after pseudotyped rabies virus (EnvA-SADΔG-GFP) injection in P3 thalamus in control Krox20::Cre;LSL-R26TVA-LacZ (K20TVA/+) (j) and Kir over-expressing Krox20::Cre;R26Kir-mCherry;LSL-R26TVA-LacZ (K20TVA/Kir) (k) mice. Scale bars: 10 μm. Symmetry index (l) and surface ratio (p) are compared (Supplementary Methods). n = 8 (K20TVA/+) and n = 6 (K20TVA/Kir) biologically independent animals were used, and j, k, n, o are representative images. q and r, MA-plots comparing E18.5 and E14.5 mRNA levels in control Drg11vPrV-ZsGreen/+ barrelette neurons (q), and E18.5 Drg11vPrV-Kir/+ (Kir-OE) and E18.5 Drg11vPrV-ZsGreen/+ wild-type (WT) barrelette neurons (r). 702 genes (green dots, q) increase their expression at E18.5 as compared to E14.5 (log2(fold change) > 1.5), while 102 genes (red dots, r) decrease their expression in E18.5 Kir-OE barrelette neurons (log2(fold change) < –1) (Methods). s, Identification of 56 bsARGs. t, Fractions of the 56 bsARGs (left) and 83 nbARGs (right) with H3K27me3- and H3K27me3+ profiles in E14.5 Drg11vPrV-ZsGreen/+ barrelette neurons (see Fig. 1c). u, Scatterplots showing ATAC-seq (x axis) and H3K4me2 (y axis) signals on promoters (1 kb around TSS) in E14.5 Drg11vPrV-ZsGreen/+ barrelette neurons. Dashed lines indicate thresholds corresponding to a 5% false discovery rate (FDR) (Methods) (see Fig. 1c). f, l, p, Bars indicate median and P values are from Welch’s two-sample two-sided t-tests. NS: not significant (P > 0.05).
Extended Data Fig. 2. Chromatin profiles of IEGs carrying the bipartite signature.
a, Fos, Egr1, Fosb and Nr4a3 genome browser views. ATAC (violet), H3K4me2 (yellow, E14.5 barrelette neurons), H3K4me3 (yellow, adult cortical neurons and cultured embryonic neurons), H3K27ac (red) and H3K27me3 (blue) are shown in E14.5 Drg11vPrV-ZsGreen/+ barrelette neurons, E15.5 embryonic cortical neural progenitors (NPC) and post-mitotic neurons (PMID: 28793256), adult cortical excitatory neurons (PMID: 26087164), and embryonic cortical 7 day ex vivo cultured neurons (PMID: 20393465). Shaded boxes highlight promoters (pink) and gene bodies (blue). IEGs display a bipartite chromatin signature characterized by promoter-H3K27ac and gene body-H3K27me3 in E14.5 barrelette neurons and E15.5 cortical progenitors and post-mitotic neurons. In contrast, H3K27me3 is not present on IEG gene bodies in postnatal cortical excitatory neurons, similar to postnatal barrelette neurons (see Fig. 3e and Extended Data Fig. 6b). Also, culturing embryonic cortical neurons for one week results in depletion of the H3K27me3 mark, similar to embryonic hindbrain neuron culture (see Extended Data Fig. 9a). In long genes (e.g. Nr4a3), H3K27me3 deposition on gene body does not stretch throughout the gene body, but is restricted only to the proximal region downstream of the promoter (also see Extended Data Fig. 3c). b, IEG (Fos, Egr1 and Fosb) genome browser views at E14.5, pre-fixed prior to the dissociation procedure. Shaded boxes highlight promoters (pink) and gene bodies (blue). The presence of the bipartite pattern (H3K27ac+ promoter/H3K27me3+ gene body) in the pre-fixed tissue indicates that it is not induced by the dissociation procedure.
Extended Data Fig. 3. Genome-wide characterization of the bipartite signature.
a and b, Bipartite (a) and bivalent (b) gene rank (x axis) and corresponding rate of correct bipartite and bivalent classification obtained through genome browser visual inspection of individual loci (y axis, fraction of bipartite true-positive, Methods) in E10.5 K20tdTomato/+ progenitors and E14.5, E18.5 and P4 Drg11vPrV-ZsGreen/+ barrelette neurons. c, Aggregate plot showing profile of H3K27me3 around the transcription start site (TSS) in E14.5Bip genes (top 100 genes ranked by bipartiteness scores in E14.5 Drg11vPrV-ZsGreen/+ barrelette neurons) with long gene length (>10kb). Promoters (defined as 1 kb upstream to 500 bp downstream of TSS) and gene bodies (from 1 kb to 3kb downstream of TSS) are highlighted. Note that H3K27me3 on gene bodies does not stretch further than 2-3kb downstream of the TSS, even when genes are long. d, Genome browser profiles of representative bipartite IEGs (Fos, Egr1) in mouse ESCs. Note that the H3K27me3 mark is deposited not only on downstream (gene body) but also upstream regions of these H3K27ac promoters. e, Scatterplots showing promoter H3K27ac (x axis) and gene body H3K27me3 (y axis) signals in E14.5 rhombomere 3 (r3)-derived K20tdTomato/+ hindbrain cells. E14.5Bip genes identified in Drg11vPrV-ZsGreen/+ barrelette neurons are mapped (red dots). Dashed lines indicate thresholds corresponding to a 5% false discovery rate (FDR) based on a gaussian mixture model with two components (for foreground and background, see Methods). Barrelette neuron E14.5Bip genes show high levels of promoter H3K27ac and gene body H3K27me3 indicating that they are bipartite also in r3-derived K20tdTomato/+ hindbrain cells. f, CpG average observed/expected (o/e) ratios in a 100bp window in E14.5Bip and E14.5Biv gene loci. Bins overlapping with the promoter, TSS, and gene body are indicated. g, Transcription factor binding motifs specifically enriched in E14.5Bip as compared to E14.5Biv promoters (Methods).
Extended Data Fig. 4. Coexistence of H3K27ac and H3K27me3 at promoter and gene body of bipartite genes.
a, Scheme of sequential ChIP-seq protocol (Supplementary Methods). b and c, Scatterplots comparing H3K27ac (x axis) and H3K27me3 (y axis) signals detected in regions from 1kb to +3kb around the transcription start site (TSS) by single ChIP-seq performed with large (2-3kb) chromatin fragments in E14.5 hindbrain tissue. The colors indicate the corresponding H3K27me3/H3K27ac sequential-ChIP-seq signals, either for all autosomal genes (b), or only for E14.5Bip genes (c). Dashed lines indicate thresholds corresponding to a 5% FDR based on a gaussian mixture model with two components (for foreground and background, see Methods). Stratified by one single ChIP signal (e.g. H3K27ac), the sequential ChIP signal still correlates with the other (e.g. H3K27me3), which indicates that single chromatin fragments have been double-marked and thus have been enriched at both steps of the sequential ChIP experiments. d, Genome browser view of bipartite Egr1 gene locus displaying chromatin accessibility (ATAC-seq), 2-3kb-fragment H3K27ac, H3K27me3 and H3K27me3/H3K27ac sequential-ChIP-seq in E14.5 hindbrain tissue. H3K27me3 and H3K27ac coexist on gene body and promoter, respectively. e, Violin plots displaying promoter H3K27ac (left), bulk mRNA-seq (middle, Smart-seq2), and single cell fraction with detected mRNA-seq (right, 10X genomics) of E10.5 K20tdTomato/+ progenitors. E10.5 bipartite (E10.5Bip) genes (green, n = 99 genes, see Methods) and E10.5 non-bipartite genes with Bip-matching promoter H3K27ac levels (blue, n = 99 genes) are compared. E10.5Bip gene transcripts are only detected in as little as 6% of single cells on average. Plots extend from the data minima to the maxima with the white dot indicating median, the box showing the interquartile range and whiskers extending to the most extreme data point within 1.5X the interquartile range. P values are from two-sided Wilcoxon’s tests. NS: not significant (P > 0.05).
Extended Data Fig. 5. t-SNE visualization of mouse genes according to chromatin pattern.
a, Aggregate plot of chromatin profiles (ATAC-seq, ChIP-seq) around transcript start sites (TSSs) of all autosomal genes in E14.5 Drg11vPrV-ZsGreen/+ barrelette neurons. Promoter and gene body regions are highlighted (Methods). b-d, Two-dimensional (2D) projection on a E14.5, E18.5 and P4-combined t-SNE map of autosomal genes according to chromatin accessibility, H3K27me3, H3K4me2, and H3K27ac levels at promoters and gene bodies in Drg11vPrV-ZsGreen/+ barrelette neurons (Methods). b, E14.5 (red), E18.5 (blue) and P4 (green) genes are indicated (Supplementary Note). c, Color-coded t-SNE gene maps according to promoter (top row) and gene body (bottom row) chromatin profiles (columns). d, Color-coded t-SNE gene maps indicating mRNA levels. Numbers 1-3: example genes in E14.5 barrelette neurons. e, Chromatin profiles of the example genes in d, namely H3K4me2+/H3K27ac+/H3K27me3-/ATAC+ (active, Actb), Polycomb-dependent H3K4me2+/H3K27ac-/H3K27me3+/ATAC+ (permissive, Dlx5) and H3K4me2-/H3K27ac-/H3K27me3-/ATAC-(repressed, Olfr67). f, color-coded E14.5, E18.5 and P4-combined t-SNE gene maps displaying bipartiteness (left) or bivalency (right) scores in E14.5, E18.5 and P4 barrelette neurons (Methods). g, E14.5, E18.5 and P4-combined t-SNE map with contour lines indicating regions enriched with bipartite (green) and bivalent (red) genes (Methods). h, E14.5, E18.5 and P4-combined t-SNE map in which all E14.5 genes are colored according to their developmental change of chromatin state from E14.5 to P4 (Supplementary Note and Methods). i, E14.5Bip genes are subdivided into two subgroups according to their localization on the t-SNE plot (n = 57, E14.5Bip-a genes, orange dots; n = 43, E14.5Bip-b genes, blue dots). j, Violin plots showing promoter H3K27ac (left), gene body H3K27me3 (middle) and mRNA (right) levels in E14.5Bip-a (orange) and E14.5Bip-b genes (blue) in E14.5 barrelette neurons (Supplementary Note and Methods). Plots extend from the data minima to the maxima with the white dot indicating median, the box showing the interquartile range and whiskers extending to the most extreme data point within 1.5X the interquartile range. P values are from two-sided Wilcoxon’s tests. k and l, E10.5 K20tdTomato/+ progenitor t-SNE maps with bipartiteness or bivalency scores (k) and contour lines (l) at E10.5 (Methods).
Extended Data Fig. 6. Developmental dynamics of the bipartite chromatin signature.
a, Developmental dynamics of chromatin profiles (ATAC-seq and ChIP-seq signals in promoter and gene body regions) and mRNA levels of E14.5Bip genes in E14.5, E18.5 and P4 Drg11vPrV-ZsGreen/+ barrelette neurons. Log2 fold changes are calculated with reference to E14.5. At P4, 20% of E14.5Bip genes become expressed (Exp, i.e. RPKM >= 3 at P4), 25% become bivalent (Biv, red dots in Fig. 3d), and the rest (55%) remain bipartite (Bip), (blue, red and green lines, respectively). Bottom: summary diagram. b, Genome browser view of the Egr1 locus at the E10.5, E14.5, E18.5 and P4 stages. c, 3D interaction map (4C-seq) using the Fos promoter (top left), enhancer 2 (e2, bottom left) and enhancer 5 (e5, bottom right) as viewpoints in E10.5, E14.5, E18.5 and P4 hindbrain tissue. Normalized read per 4C fragment is visualized. d, Genome browser views of Fos and Egr1 at the E14.5, E18.5 and P4 stages. e, Violin plots showing transcription end site (TES, Methods) RNAPII-S7P (left), RNAPII-S2P (middle), and H3K36me3 (right) levels of E14.5Bip genes at E14.5 and P4 (see a). E14.5Bip genes that become expressed (Exp, blue, n = 25) at P4 displayed significantly higher levels of RNAPII-S7P, -S2P and H3K36me3 marks as compared to E14.5Bip genes that become bivalent (Biv, red, n = 20) or remain bipartite (Bip, green, n = 55) at P4: violin deviations between groups are to be compared within the same time point since the time points reflect different batches. Plots extend from the data minima to the maxima with the white dot indicating median, the box showing the interquartile range and whiskers extending to the most extreme data point within 1.5X the interquartile range. P values are from two-sided Wilcoxon’s tests. NS: not significant (P > 0.05).
Extended Data Fig. 7. Polycomb marking of gene bodies inhibits productive mRNA elongation.
a, Spliced transcript expression (transcripts per million, TPM, Methods) of E14.5Bip genes (red) and control genes (blue) with matching distributions of spliced transcripts (Methods) (n=3 biologically independent replicates). b, Unspliced over total transcript fractions for each gene set in a (Methods). Note the larger fraction of unspliced transcripts of E14.5Bip genes compared to control genes. c, Fractions of spliced over total transcripts of E14.5Bip genes (red) in E14.5 control K20tdTomato/+ (WT) and Ezh2cKOr3-RFP hindbrain cells (n=3, biologically independent littermates). d, Violin plots comparing the TSS/whole gene ratios of total RNA-seq reads between Ezh2cKOr3-RFP and WT hindbrain cells (see Fig. 5c). e, Scatter plot (left) comparing H3K36me3 levels on the coding region between E14.5 wild-type Hoxa2tdTomato/+ (WT) and Ezh2cKOHB-RFP hindbrain cells, indicating H3K36me3-positive and negative E14.5Bip genes in red and gray, respectively (Methods). Increased H3K36me3 levels of H3K36me3-positive E14.5Bip genes in Ezh2-depleted cells are further illustrated (right panel). Bars indicate the median. f, (left, middle) Genes with non-zero expression in EedKO and wild-type (WT), and carrying H3K27me3 on gene bodies in mouse ESCs (n=3457) were subdivided into genes that show up-regulated (red, n=1067), down-regulated (blue, n=93) and unchanged (gray, n=2297) levels of mRNA in EedKO compared with WT ESCs (Supplementary Note, Methods). (right) Violin plots showing log2 fold changes of transcription end site (TES) RNAPII-S2P levels in EedKO mutant compared with WT ESCs. g, Chromatin profiles of Fos in WT and EedKO ESCs. While stalled RNAPII-S5P showed decrease in the promoter (pink highlight), elongating RNAPII-S2P was increased (green highlight) in EedKO ESCs. h, MA-plots comparing mRNA levels of bipartite (Bip) genes (n=100, red) between full Ezh1KO;Ezh2KO (left) or Ezh2 catalytically inactive Ezh1KO;Ezh2Y726D (right) with WT ESCs. d and f, Plots extend from the data minima to the maxima with the white dot or middle bar indicating median, the box showing the interquartile range and whiskers extending to the most extreme data point within 1.5X the interquartile range. P value is from a two-sided Wilcoxon’s test between the two groups.
Extended Data Fig. 8. IEG bipartite chromatin is necessary to prevent precocious activity-dependent neuronal maturation.
a, Short time (two days) E12.5 ex vivo-cultured Drg11tdTomato/+ hindbrains. After over-night (o/n) treatment with a cocktail of neuronal activity blockers (TDN cocktail = TTX + D-AP5 + NBQX, inhibitors of sodium channel, NMDAR and AMPAR), cultured neurons were treated by 55mM KCl for 1 hour. Drg11-positive immature trigeminal neurons were FACS-isolated for ATAC-seq analysis. Violin plots visualize log2 fold changes of enhancer chromatin accessibilities in 1hour KCl-treated neurons as compared to non-treated control neurons. Increased accessibility is selectively detected in KCl-treated neurons at activity-dependent Fos-binding enhancers that normally become open only at P4 (green, n = 85 enhancers) (purple, all non-Fos-binding enhancers that gain accessibilities only at P4, n = 3882 enhancers). Plots extend from the data minima to the maxima with the white dot indicating median, the box showing the interquartile range and whiskers extending to the most extreme data point within 1.5X the interquartile range from the box. P value is from a two-sided Wilcoxon’s test. b, Scatterplots comparing enhancer accessibilities (ATAC) in E14.5 Ezh2 heterozygous control (ctrl) and homozygous mutant (Ezh2cKOHB-RFP) hindbrain cells. All the barrelette enhancers in Drg11vPrV-ZsGreen/+ barrelette neurons (left), non-Fos-binding enhancers that gain accessibilities at P4 as compared with E14.5 in Drg11vPrV-ZsGreen/+ barrelette neurons (n = 3882 enhancers, middle, purple), neuronal activity-dependent Fos-binding enhancers that gain accessibilities at P4 as compared with E14.5 Drg11vPrV-ZsGreen/+ barrelette neurons (n = 85 enhancers, left, green) are shown (Methods). 85 activity-dependent Fos-binding enhancers show precocious opening upon H3K27me3 removal at E14.5. Also see Fig. 5d.
Extended Data Fig. 9. dCas9-UTX overexpression in E12.5 short-term ex vivo cultured neurons.
a, H3K27me3 profiles of the Fos locus in E14.5 Drg11vPrV-ZsGreen/+ barrelette neurons and E12.5 cultured hindbrain neurons at day 1 and day 7 of culture. One week hindbrain neuron culture results in the loss of the H3K27me3 mark from the Fos gene body, similarly to one-week embryonic cortical neuron culture (Extended Data Fig. 2a); in contrast, short-term (day 1) cultured hindbrain neurons still maintain H3K27me3 levels comparable to E14.5 barrelette neurons. b, H3K27me3 levels at the Fos locus in short-term cultured E12.5 hindbrain neurons overexpressing control dCas9 (green) or dCas9-UTX (red) targeted to Fos gene body: three biological replicates overlaid. Genomic regions targeted by guide-RNAs (gRNAs) are indicated. c, Averaged H3K27me3 profiles of Fos (left) and the rest of the E14.5Bip genes (right). Overexpression of control dCas9 (green) or dCas9-UTX (red) are compared. d, (left) MA plot comparing H3K27me3 levels of dCas9 UTX against dCas9 targeting to Fos locus. Fos (red dot) shows a loss of gene body H3K27me3 compared to control genes carrying similar levels of H3K27me3 (green dots). (right) Density plot (green line) shows the distribution of the logFC values of the selected control genes (greed dots), highlighting the Fos logFC (red line) in the 1.48 % lower tail of the density plot and logFC of E14.5Bip genes (yellow line), indicating slight but significant decrease in Fos H3K27me3. n = 3 biologically independent neuron cultures. e, mRNA levels of Actb, Gapdh and Fos determined by RT-qPCR in short-term cultured E12.5 hindbrain neurons over-expressing control dCas9 (green) or dCas9-UTX (purple) targeted to Actb (left) or Gapdh (right) loci (n = 6 biologically independent neuron cultures). The median expression is indicated by bars. P values are from Welch’s two-sample two-sided t-tests. NS: not significant (P > 0.05).
Extended Data Fig. 10. Polycomb marking of bipartite gene bodies regulates the rapidity and amplitude of transcriptional response to relevant stimuli.
a, Genome browser view of bivalent Junb in E14.5 Drg11vPrV-ZsGreen/+ barrelette neurons. Chromatin accessibility (ATAC), H3K4me2, H3K27ac and H3K27me3 are shown. b, mRNA levels of bipartite (Fos, Egr1) and bivalent (Junb) ARGs, determined by RT-qPCR in E14.5 hindbrain cells treated by KCl for 8 (left) or 30 minutes (right) (n = 4, biologically independent embryos). The median expression is indicated by bars. P values are from Welch’s two-sample two-sided t-tests. NS: not significant (p > 0.05). c, mRNA levels of Fos (left) and Egr1 (right), determined by RT-qPCR in serum-starved WT (green) and EedKO (purple) mouse ESCs (n = 4, biologically independent cultured cells) treated with a low (1%) or high (10%) concentration of Fetal Calf Serum (FCS) for 16 minutes. WT ESCs Fos and Egr1 could be induced only after prolonged exposure (i.e. 16 minutes) to 1% FCS: also see the effects of shorter (i.e. 8 minutes) time exposure to 1% FCS in Fig. 5f and 5g. The median expression is indicated by bars. P values are from Welch’s two-sample two-sided t-tests.
Supplementary Material
Acknowledgments
F.M.R. wishes to dedicate this paper to the memory of Paolo Sassone-Corsi (1956-2020), dear friend and eminent scientist who made seminal contributions to immediate early gene and AP-1 transcriptional regulation, and with whom F.M.R. discussed this project at an early stage. We thank A. Pombo for very useful discussion. We thank N. Vilain, S. Smallwood, D. Gaidatzis, the members of the Rijli group and FMI facilities for excellent technical support and discussion. We thank S. H. Orkin (Harvard Medical School) and A. Wutz (ETH Zurich) for the kind gifts of the Ezh2flox mouse line and EedKO ESCs, respectively. T.K. was supported by a Japan Society for the Promotion of Science fellowship, and O.J. was supported by an EMBO Long-Term fellowship. F.M.R. was supported by the Swiss National Science Foundation (31003A_149573 and 31003A_175776). This project has also received funding from the European Research Council (ERC) under the European Union’s Horizon 2020 research and innovation programme (grant agreement No 810111-EpiCrest2Reg). F.M.R. and M.B.S. were also supported by the Novartis Research Foundation.
Footnotes
Author contributions
T.K. and F.M.R. conceived the study, designed experiments, and analyzed experimental data; T.K. performed most of the experiments; H.K. carried out cell sorting; D.M., T.K., and M.B.S. performed computational analysis; O.J. performed 4C-seq; S.K. carried out some ChIP-seq assays; S.D., H.G. and G.L.B. contributed to Kir-OE mouse generation and characterization; N.M. analyzed the phenotype of Kir-OE mice; C.S. performed analysis of scRNA-seq; C.S. and P.P. contributed to the Solo RNA-seq analysis; T.K., D.M.., and M.B.S. wrote a first draft; F.M.R. revised and wrote the final manuscript.
Competing interests
The authors declare no competing interests.
Data availability
All sequencing raw data and processed data used for this study are deposited into ArrayExpress and will be released to the public without restrictions. mRNA-seq (Smart-seq2), E-MTAB-8314; total RNA-seq (Solo RNA-seq), E-MTAB-8311; ChIP-seq (ChIPmentation), E-MTAB-8317; ATAC-seq, E-MTAB-8313; 4C-seq, E-MTAB-8295; single-cell RNA-seq (10X Genomics), E-MTAB-8312. FACS gating strategies/source data are presented in Supplementary Figs. 1-4. Public sequencing data sets were obtained as follows. Mouse cortical culture (GSE21161, GSE60192), mouse embryonic forebrain (GSE93011, GSE52386), mouse adult cortical excitatory neuron (GSE63137), mouse ESCs (GSE36114, GSE94250), mouse ESCs for Ezh2-KO experiments (GSE116603), mouse E14.5 heart tissues (GSE82764, GSE82637, GSE82640, GSE78441, ENCSR068YGC), mouse E14.5 liver tissues (GSE78422, GSE82407, GSE82615, GSE82620, ENCSR032HKE) and E10.5 mouse neural crest cells isolated from the frontal nasal process (FNP) (GSE89437).
Code availability
The computational analyses in this work were done in R using the mentioned publicly available packages (see Methods, Reporting Summary, and Supplementary Methods for more details). The custom tool monaLisa (v0.1.28) used to do motif enrichment can be found on GitHub: https://github.com/fmicompbio/monaLisa. The custom tool swissknife (v0.10) can be found on https://github.com/fmicompbio/swissknife.
References
- 1.Fowler T, Sen R, Roy AL. Regulation of primary response genes. Mol Cell. 2011;44:348–360. doi: 10.1016/j.molcel.2011.09.014. [DOI] [PMC free article] [PubMed] [Google Scholar]
- 2.West AE, Greenberg ME. Neuronal activity-regulated gene transcription in synapse development and cognitive function. Cold Spring Harb Perspect Biol. 2011;3 doi: 10.1101/cshperspect.a005744. [DOI] [PMC free article] [PubMed] [Google Scholar]
- 3.Greenberg ME, Ziff EB. Stimulation of 3T3 cells induces transcription of the c-fos proto-oncogene. Nature. 1984;311:433–438. doi: 10.1038/311433a0. [DOI] [PubMed] [Google Scholar]
- 4.Malik AN, et al. Genome-wide identification and characterization of functional neuronal activity-dependent enhancers. Nat Neurosci. 2014;17:1330–1339. doi: 10.1038/nn.3808. [DOI] [PMC free article] [PubMed] [Google Scholar]
- 5.Vierbuchen T, et al. AP-1 Transcription Factors and the BAF Complex Mediate Signal-Dependent Enhancer Selection. Mol Cell. 2017;68:1067–1082 e1012. doi: 10.1016/j.molcel.2017.11.026. [DOI] [PMC free article] [PubMed] [Google Scholar]
- 6.Stroud H, et al. An Activity-Mediated Transition in Transcription in Early Postnatal Neurons. Neuron. 2020;107:874–890 e878. doi: 10.1016/j.neuron.2020.06.008. [DOI] [PMC free article] [PubMed] [Google Scholar]
- 7.Mayer A, Landry HM, Churchman LS. Pause & go: from the discovery of RNA polymerase pausing to its functional implications. Curr Opin Cell Biol. 2017;46:72–80. doi: 10.1016/j.ceb.2017.03.002. [DOI] [PMC free article] [PubMed] [Google Scholar]
- 8.Yap EL, Greenberg ME. Activity-Regulated Transcription: Bridging the Gap between Neural Activity and Behavior. Neuron. 2018;100:330–348. doi: 10.1016/j.neuron.2018.10.013. [DOI] [PMC free article] [PubMed] [Google Scholar]
- 9.Lonze BE, Ginty DD. Function and regulation of CREB family transcription factors in the nervous system. Neuron. 2002;35:605–623. doi: 10.1016/s0896-6273(02)00828-0. [DOI] [PubMed] [Google Scholar]
- 10.Toth AB, Shum AK, Prakriya M. Regulation of neurogenesis by calcium signaling. Cell Calcium. 2016;59:124–134. doi: 10.1016/j.ceca.2016.02.011. [DOI] [PMC free article] [PubMed] [Google Scholar]
- 11.Ginty DD, Glowacka D, Bader DS, Hidaka H, Wagner JA. Induction of immediate early genes by Ca2+ influx requires cAMP-dependent protein kinase in PC12 cells. J Biol Chem. 1991;266:17454–17458. [PubMed] [Google Scholar]
- 12.Greenberg ME, Greene LA, Ziff EB. Nerve growth factor and epidermal growth factor induce rapid transient changes in proto-oncogene transcription in PC12 cells. J Biol Chem. 1985;260:14101–14110. [PubMed] [Google Scholar]
- 13.Erzurumlu RS, Murakami Y, Rijli FM. Mapping the face in the somatosensory brainstem. Nat Rev Neurosci. 2010;11:252–263. doi: 10.1038/nrn2804. [DOI] [PMC free article] [PubMed] [Google Scholar]
- 14.Kitazawa T, Rijli FM. Barrelette map formation in the prenatal mouse brainstem. Curr Opin Neurobiol. 2018;53:210–219. doi: 10.1016/j.conb.2018.09.008. [DOI] [PubMed] [Google Scholar]
- 15.Erzurumlu RS, Gaspar P. Development and critical period plasticity of the barrel cortex. Eur J Neurosci. 2012;35:1540–1553. doi: 10.1111/j.1460-9568.2012.08075.x. [DOI] [PMC free article] [PubMed] [Google Scholar]
- 16.Hrvatin S, et al. Single-cell analysis of experience-dependent transcriptomic states in the mouse visual cortex. Nat Neurosci. 2018;21:120–129. doi: 10.1038/s41593-017-0029-5. [DOI] [PMC free article] [PubMed] [Google Scholar]
- 17.Tyssowski KM, et al. Different Neuronal Activity Patterns Induce Different Gene Expression Programs. Neuron. 2018;98:530–546 e511. doi: 10.1016/j.neuron.2018.04.001. [DOI] [PMC free article] [PubMed] [Google Scholar]
- 18.Valles A, et al. Genomewide analysis of rat barrel cortex reveals time-and layer-specific mRNA expression changes related to experience-dependent plasticity. J Neurosci. 2011;31:6140–6158. doi: 10.1523/JNEUROSCI.6514-10.2011. [DOI] [PMC free article] [PubMed] [Google Scholar]
- 19.Mohn F, et al. Lineage-specific polycomb targets and de novo DNA methylation define restriction and potential of neuronal progenitors. Mol Cell. 2008;30:755–766. doi: 10.1016/j.molcel.2008.05.007. [DOI] [PubMed] [Google Scholar]
- 20.Ferrai C, et al. RNA polymerase II primes Polycomb-repressed developmental genes throughout terminal neuronal differentiation. Mol Syst Biol. 2017;13:946. doi: 10.15252/msb.20177754. [DOI] [PMC free article] [PubMed] [Google Scholar]
- 21.Hirabayashi Y, et al. Polycomb limits the neurogenic competence of neural precursor cells to promote astrogenic fate transition. Neuron. 2009;63:600–613. doi: 10.1016/j.neuron.2009.08.021. [DOI] [PubMed] [Google Scholar]
- 22.Aranda S, Mas G, Di Croce L. Regulation of gene transcription by Polycomb proteins. Sci Adv. 2015;1:e1500737. doi: 10.1126/sciadv.1500737. [DOI] [PMC free article] [PubMed] [Google Scholar]
- 23.Schuettengruber B, Bourbon HM, Di Croce L, Cavalli G. Genome Regulation by Polycomb and Trithorax: 70 Years and Counting. Cell. 2017;171:34–57. doi: 10.1016/j.cell.2017.08.002. [DOI] [PubMed] [Google Scholar]
- 24.Bernstein BE, et al. A bivalent chromatin structure marks key developmental genes in embryonic stem cells. Cell. 2006;125:315–326. doi: 10.1016/j.cell.2006.02.041. [DOI] [PubMed] [Google Scholar]
- 25.Minoux M, et al. Gene bivalency at Polycomb domains regulates cranial neural crest positional identity. Science. 2017;355 doi: 10.1126/science.aal2913. [DOI] [PubMed] [Google Scholar]
- 26.Piunti A, Shilatifard A. Epigenetic balance of gene expression by Polycomb and COMPASS families. Science. 2016;352 doi: 10.1126/science.aad9780. aad9780. [DOI] [PubMed] [Google Scholar]
- 27.Bonnefont J, et al. Cortical Neurogenesis Requires Bcl6-Mediated Transcriptional Repression of Multiple Self-Renewal-Promoting Extrinsic Pathways. Neuron. 2019;103:1096–1108 e1094. doi: 10.1016/j.neuron.2019.06.027. [DOI] [PMC free article] [PubMed] [Google Scholar]
- 28.Chen FX, Smith ER, Shilatifard A. Born to run: control of transcription elongation by RNA polymerase II. Nat Rev Mol Cell Biol. 2018;19:464–478. doi: 10.1038/s41580-018-0010-5. [DOI] [PubMed] [Google Scholar]
- 29.Brookes E, Pombo A. Modifications of RNA polymerase II are pivotal in regulating gene expression states. EMBO Rep. 2009;10:1213–1219. doi: 10.1038/embor.2009.221. [DOI] [PMC free article] [PubMed] [Google Scholar]
- 30.Zaborowska J, Egloff S, Murphy S. The pol II CTD: new twists in the tail. Nat Struct Mol Biol. 2016;23:771–777. doi: 10.1038/nsmb.3285. [DOI] [PubMed] [Google Scholar]
- 31.Brookes E, et al. Polycomb associates genome-wide with a specific RNA polymerase II variant, and regulates metabolic genes in ESCs. Cell Stem Cell. 2012;10:157–170. doi: 10.1016/j.stem.2011.12.017. [DOI] [PMC free article] [PubMed] [Google Scholar]
- 32.Stock JK, et al. Ring1-mediated ubiquitination of H2A restrains poised RNA polymerase II at bivalent genes in mouse ES cells. Nat Cell Biol. 2007;9:1428–1435. doi: 10.1038/ncb1663. [DOI] [PubMed] [Google Scholar]
- 33.Simon JA, Kingston RE. Mechanisms of polycomb gene silencing: knowns and unknowns. Nat Rev Mol Cell Biol. 2009;10:697–708. doi: 10.1038/nrm2763. [DOI] [PubMed] [Google Scholar]
- 34.Blackledge NP, Rose NR, Klose RJ. Targeting Polycomb systems to regulate gene expression: modifications to a complex story. Nat Rev Mol Cell Biol. 2015;16:643–649. doi: 10.1038/nrm4067. [DOI] [PMC free article] [PubMed] [Google Scholar]
- 35.Shen X, et al. EZH1 mediates methylation on histone H3 lysine 27 and complements EZH2 in maintaining stem cell identity and executing pluripotency. Mol Cell. 2008;32:491–502. doi: 10.1016/j.molcel.2008.10.016. [DOI] [PMC free article] [PubMed] [Google Scholar]
- 36.Schoeftner S, et al. Recruitment of PRC1 function at the initiation of X inactivation independent of PRC2 and silencing. EMBO J. 2006;25:3110–3122. doi: 10.1038/sj.emboj.7601187. [DOI] [PMC free article] [PubMed] [Google Scholar]
- 37.Lavarone E, Barbieri CM, Pasini D. Dissecting the role of H3K27 acetylation and methylation in PRC2 mediated control of cellular identity. Nat Commun. 2019;10 doi: 10.1038/s41467-019-09624-w. 1679. [DOI] [PMC free article] [PubMed] [Google Scholar]
- 38.Kim TK, et al. Widespread transcription at neuronal activity-regulated enhancers. Nature. 2010;465:182–187. doi: 10.1038/nature09033. [DOI] [PMC free article] [PubMed] [Google Scholar]
- 39.Schaukowitch K, et al. Enhancer RNA facilitates NELF release from immediate early genes. Mol Cell. 2014;56:29–42. doi: 10.1016/j.molcel.2014.08.023. [DOI] [PMC free article] [PubMed] [Google Scholar]
- 40.Voiculescu O, et al. Hindbrain patterning: Krox20 couples segmentation and specification of regional identity. Development. 2001;128:4967–4978. doi: 10.1242/dev.128.24.4967. [DOI] [PubMed] [Google Scholar]
- 41.Madisen L, et al. A robust and high-throughput Cre reporting and characterization system for the whole mouse brain. Nat Neurosci. 2010;13:133–140. doi: 10.1038/nn.2467. [DOI] [PMC free article] [PubMed] [Google Scholar]
- 42.Bechara A, et al. Hoxa2 Selects Barrelette Neuron Identity and Connectivity in the Mouse Somatosensory Brainstem. Cell Rep. 2015;13:783–797. doi: 10.1016/j.celrep.2015.09.031. [DOI] [PubMed] [Google Scholar]
- 43.Moreno-Juan V, et al. Prenatal thalamic waves regulate cortical area size prior to sensory processing. Nat Commun. 2017;8 doi: 10.1038/ncomms14172. 14172. [DOI] [PMC free article] [PubMed] [Google Scholar]
- 44.Luche H, Weber O, Nageswara Rao T, Blum C, Fehling HJ. Faithful activation of an extra-bright red fluorescent protein in “knock-in” Cre-reporter mice ideally suited for lineage tracing studies. Eur J Immunol. 2007;37:43–53. doi: 10.1002/eji.200636745. [DOI] [PubMed] [Google Scholar]
- 45.Di Meglio T, et al. Ezh2 orchestrates topographic migration and connectivity of mouse precerebellar neurons. Science. 2013;339:204–207. doi: 10.1126/science.1229326. [DOI] [PMC free article] [PubMed] [Google Scholar]
- 46.Maheshwari U, et al. Postmitotic Hoxa5 Expression Specifies Pontine Neuron Positional Identity and Input Connectivity of Cortical Afferent Subsets. Cell Rep. 2020;31 doi: 10.1016/j.celrep.2020.107767. 107767. [DOI] [PubMed] [Google Scholar]
- 47.Seidler B, et al. A Cre-loxP-based mouse model for conditional somatic gene expression and knockdown in vivo by using avian retroviral vectors. Proc Natl Acad Sci U S A. 2008;105:10137–10142. doi: 10.1073/pnas.0800487105. [DOI] [PMC free article] [PubMed] [Google Scholar]
- 48.Picelli S, et al. Full-length RNA-seq from single cells using Smart-seq2. Nat Protoc. 2014;9:171–181. doi: 10.1038/nprot.2014.006. [DOI] [PubMed] [Google Scholar]
- 49.Schmidl C, Rendeiro AF, Sheffield NC, Bock C. ChIPmentation: fast, robust, low-input ChIP-seq for histones and transcription factors. Nat Methods. 2015;12:963–965. doi: 10.1038/nmeth.3542. [DOI] [PMC free article] [PubMed] [Google Scholar]
- 50.Buenrostro JD, Giresi PG, Zaba LC, Chang HY, Greenleaf WJ. Transposition of native chromatin for fast and sensitive epigenomic profiling of open chromatin, DNA-binding proteins and nucleosome position. Nat Methods. 2013;10:1213–1218. doi: 10.1038/nmeth.2688. [DOI] [PMC free article] [PubMed] [Google Scholar]
- 51.Ritchie ME, et al. limma powers differential expression analyses for RNA-sequencing and microarray studies. Nucleic Acids Res. 2015;43:e47. doi: 10.1093/nar/gkv007. [DOI] [PMC free article] [PubMed] [Google Scholar]
- 52.O’Connell J, Hojsgaard S. Hidden Semi Markov Models for Multiple Observation Sequences: The mhsmm Package for R. Journal of Statistical Software. 2011;39:4. [Google Scholar]
- 53.Zheng GX, et al. Massively parallel digital transcriptional profiling of single cells. Nat Commun. 2017;8 doi: 10.1038/ncomms14049. 14049. [DOI] [PMC free article] [PubMed] [Google Scholar]
- 54.Heinz S, et al. Simple combinations of lineage-determining transcription factors prime cis-regulatory elements required for macrophage and B cell identities. Mol Cell. 2010;38:576–589. doi: 10.1016/j.molcel.2010.05.004. [DOI] [PMC free article] [PubMed] [Google Scholar]
- 55.Maaten LJPVD, Hinton GE. Visualizing High-Dimensional Data using t-SNE. Journal of Machine Learning Research. 2008;9:2579–2605. [Google Scholar]
- 56.Venables WN, Ripley BD. Modern Applied Statistics with S. Fourth. Springer; NY: 2002. [Google Scholar]
- 57.Durinck S, Spellman PT, Birney E, Huber W. Mapping identifiers for the integration of genomic datasets with the R/Bioconductor package biomaRt. Nat Protoc. 2009;4:1184–1191. doi: 10.1038/nprot.2009.97. [DOI] [PMC free article] [PubMed] [Google Scholar]
Associated Data
This section collects any data citations, data availability statements, or supplementary materials included in this article.
Supplementary Materials
Data Availability Statement
All sequencing raw data and processed data used for this study are deposited into ArrayExpress and will be released to the public without restrictions. mRNA-seq (Smart-seq2), E-MTAB-8314; total RNA-seq (Solo RNA-seq), E-MTAB-8311; ChIP-seq (ChIPmentation), E-MTAB-8317; ATAC-seq, E-MTAB-8313; 4C-seq, E-MTAB-8295; single-cell RNA-seq (10X Genomics), E-MTAB-8312. FACS gating strategies/source data are presented in Supplementary Figs. 1-4. Public sequencing data sets were obtained as follows. Mouse cortical culture (GSE21161, GSE60192), mouse embryonic forebrain (GSE93011, GSE52386), mouse adult cortical excitatory neuron (GSE63137), mouse ESCs (GSE36114, GSE94250), mouse ESCs for Ezh2-KO experiments (GSE116603), mouse E14.5 heart tissues (GSE82764, GSE82637, GSE82640, GSE78441, ENCSR068YGC), mouse E14.5 liver tissues (GSE78422, GSE82407, GSE82615, GSE82620, ENCSR032HKE) and E10.5 mouse neural crest cells isolated from the frontal nasal process (FNP) (GSE89437).
The computational analyses in this work were done in R using the mentioned publicly available packages (see Methods, Reporting Summary, and Supplementary Methods for more details). The custom tool monaLisa (v0.1.28) used to do motif enrichment can be found on GitHub: https://github.com/fmicompbio/monaLisa. The custom tool swissknife (v0.10) can be found on https://github.com/fmicompbio/swissknife.


