Abstract
Autonomous regulation of the intestine requires the combined activity of functionally distinct neurons of the enteric nervous system (ENS). However, the variety of enteric neuron types and how they emerge during development remain largely unknown. Here, we define a molecular taxonomy of twelve enteric neuron classes within the myenteric plexus of the mouse small intestine using single cell RNA-sequencing. We present cell-cell communication features, histochemical markers for motor, sensory, and interneurons together with transgenic tools for class-specific targeting. Transcriptome analysis of embryonic ENS uncovers a novel principle of neuronal diversification, where two neuron classes arise through a binary neurogenic branching, and all other identities emerge through subsequent post-mitotic differentiation. We identify generic and class-specific transcriptional regulators and functionally connect Pbx3 to a post-mitotic fate transition. Our results offer a conceptual and molecular resource for dissecting ENS circuits, and predicting key regulators for directed differentiation of distinct enteric neuron classes.
Introduction
Within the gastrointestinal (GI) tract, the enteric nervous system (ENS) controls motility, blood flow and secretion, but also communicates with the immune system and the microbiome.1,2 These physiological processes rely on the combined activity of diverse enteric neuron types. Meticulous work over the last decades has identified a framework of enteric neurons with sensory (Intrinsic Primary Afferent Neurons, IPANs), motor or interneuron characteristics.3 Notably, only a few studies have focused on the mouse, despite its primary role as experimental model.4,5,6 To make ENS attainable to modern genetic technologies, the unique molecular signatures of the full range of mouse enteric neurons would be desirable. For instance, this could resolve whether the many functions of IPANs (first neurons in intrinsic reflex circuits) rely on subtypes with different properties, information that would help develop gut motility therapies targeting this neuron type.7
That functional diversity amongst enteric neurons is critical for physiological homeostasis is evidenced in several gut disorders where selective neuron types are affected (mainly NOS1+ neurons).8,9 Likewise, the absence of all enteric neurons in the distal bowel of Hirschsprung disease patients causes chronic constipation and requires surgical resection. Motivated by the lack of satisfactory treatments for enteric neuropathies, and spearheaded by the recent derivation of enteric neurons from human pluripotent stem cells10, efforts are now placed on developing reparative cell therapies.11 Potential approaches to repopulate ENS-deficient bowel segments include transplantation of in vitro-derived stem cells and steering of endogenous stem cells to neurons. In either case, complete functional recovery will depend on the success of recreating a correct cellular composition. This emphasizes the importance of acquiring a refined picture of the neuron subtypes that constitute the normal ENS, and how they specialize during development.
The ENS is mainly generated from vagal neural crest cells that colonize the foregut at embryonic day (E)9 and reach the hindgut at E14 where they converge with sacral-derived neural crest.12 Subsequently, Schwann cell precursors (SCPs), associated with extrinsic nerves, invade the gut wall and contribute to the ENS.13 Unlike the developing central nervous system (CNS), where neuron subtypes emerge at stereotypical positions from patterned zones of stem cells14, the ENS develops from highly motile streams of enteric stem cells.12 Phenotypically distinct neurons are generated at different embryonic time windows, suggesting a temporal mode of diversification.15,16 A comprehensive mapping of transcription and signaling regulators with temporo-spatially distinct expression has been carried out in the developing ENS, but lacked the refinement to describe neuron class lineages.17
In this study we optimized efficient capture of enteric neurons for single-cell transcriptomics and evidence a novel taxonomy of 12 myenteric neuron classes of the mouse small intestine, including motor, inter- and sensory neuron types, greatly expanding and refining our earlier characterisation.18 The enteric neuron classes (ENCs) are defined by their communication features, which we portray along with immunohistochemical markers and transgenic tools for immediate use in experimental neuroscience. Based on further transcriptome analysis of the developing ENS we postulate a new logic for enteric neuron diversification where myenteric ENC identities are generated from an initial binary difference at neurogenesis that successively diverge at the post-mitotic state. The principle is supported by the identification of the transcription factor PBX3 that regulate the transition of post-mitotic inhibitory ENC8/9 to excitatory ENC12 neurons.
Results
Single-cell RNA sequencing reveals 12 Enteric Neuron Classes in the myenteric plexus of the mouse small intestine
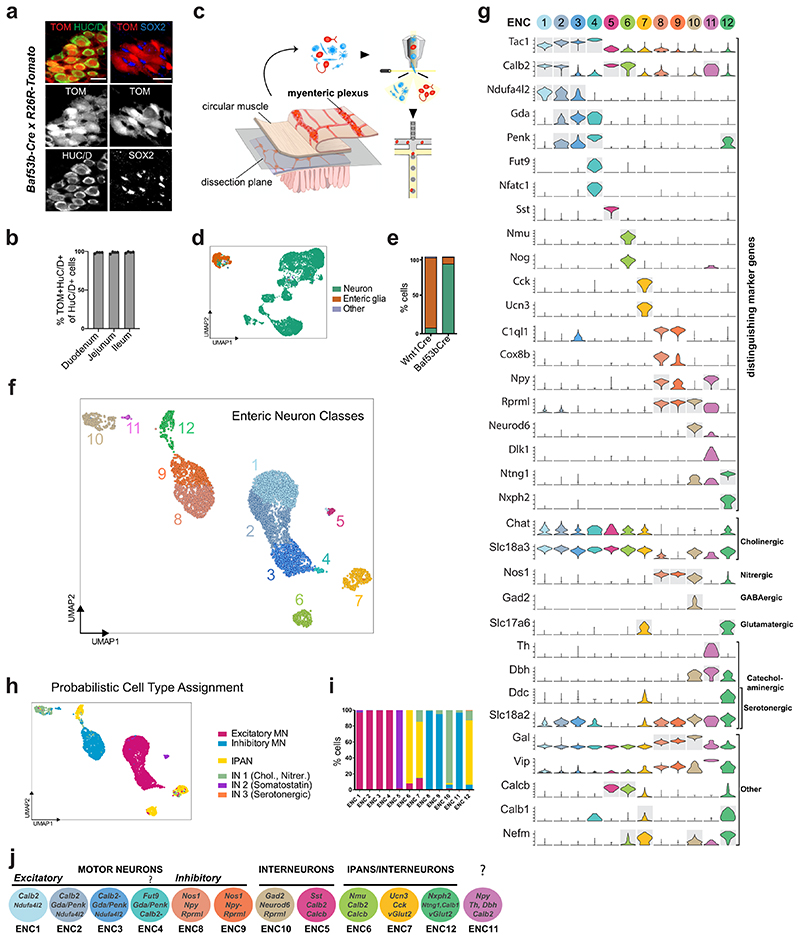
We have previously reported single-cell RNA sequencing (scRNA-seq) of myenteric plexus isolated from the small intestine of Wnt1-Cre;R26R-Tomato juvenile mice, yielding 1105 neurons classified into nine clusters. We suspected that the number of neurons was insufficient to represent the full range neuronal diversity of the ENS. Seeking to enrich neuron proportion, we investigated whether the recently described pan-neuronal Baf53b-Cre line19 specifically and efficiently labels enteric neurons, when crossed with R26R-Tomato reporter mice. We quantified co-expression of TOM with the neuron marker HUC/D and the enteric glia markers SOX2/10 in myenteric plexus across the small intestine. We found that all TOM+ cells expressed HUC/D whereas none expressed SOX2/10 (Fig. 1a). Likewise, the vast majority of HUC/D+ cells expressed TOM (~98%; Fig 1b). An improved protocol for cell dissociation was applied on the myenteric plexus from the small intestine of Baf53b-Cre;R26R-Tomato juvenile mice (postnatal day (P)21), TOM+ cells were sorted by flow cytometry and single cells analyzed by 10 x Chromium RNA-sequencing (Fig. 1c).
Figure 1. Molecular definition of 12 Enteric Neuron Classes in the mouse small intestine myenteric plexus.
a) Peels of the myenteric plexus from Baf53b-Cre;R26R-Tomato mice at postnatal day (P)26, showing Tomato (TOM, red) expression in enteric neurons (HUC/D+, green) but not in enteric glia (SOX2+, blue). b) Graph showing the average percentage of HUC/D+ cells expressing TOM within the duodenum (2138 cells), jejunum (2791 cells) and ileum (3180 cells); n=4 mice at P24-26. TOM was not detected in any SOX2/10+ cells (1848 cells; n= 3 mice at P24-26; data not in graph). c) Schematic drawing of experimental procedure indicating the dissection plane to retrieve myenteric plexus of small intestine, flow sorting and single cell RNA-sequencing. d) UMAP representation of sequenced cells with total UMI counts > 600, annotated by probabilistic cell type assignment. e) Comparison of the proportion of major cell types in current single-cell dataset (postnatal day P(21)) and our published dataset from Wnt1-Cre;R26R-Tomato mice (P21,23)18. f) Unsupervised clustering of enteric neurons, color-coded by enteric neuron classes (ENC)1-12 and represented on UMAP. g) Violin plots representing the expression (log-scale) of key genes among ENCs, including new class-specific marker genes and neurotransmitter/neuropeptide genes. Grey boxes indicate genes whose expression were confirmed by immunohistochemistry (see Fig. 3). Expression of selected markers genes are also represented on UMAPs (Extended Data Fig. 2). h) Probabilistic neuron subtype assignment based on literacy-curated functional type markers represented on UMAP. i) Proportion of learned functional neuron subtypes in each ENC. j) Schematic drawing indicating proposed functional assignment and selected combinatorial marker genes for each ENC. Color channels were individually adjusted in (a). ENC: Enteric Neuron Class; FC: Fold Change; MN: Motor neuron; IN: Interneuron; UMI: Unique Molecular Identifiers; UMAP: Uniform Manifold Approximation and Projection
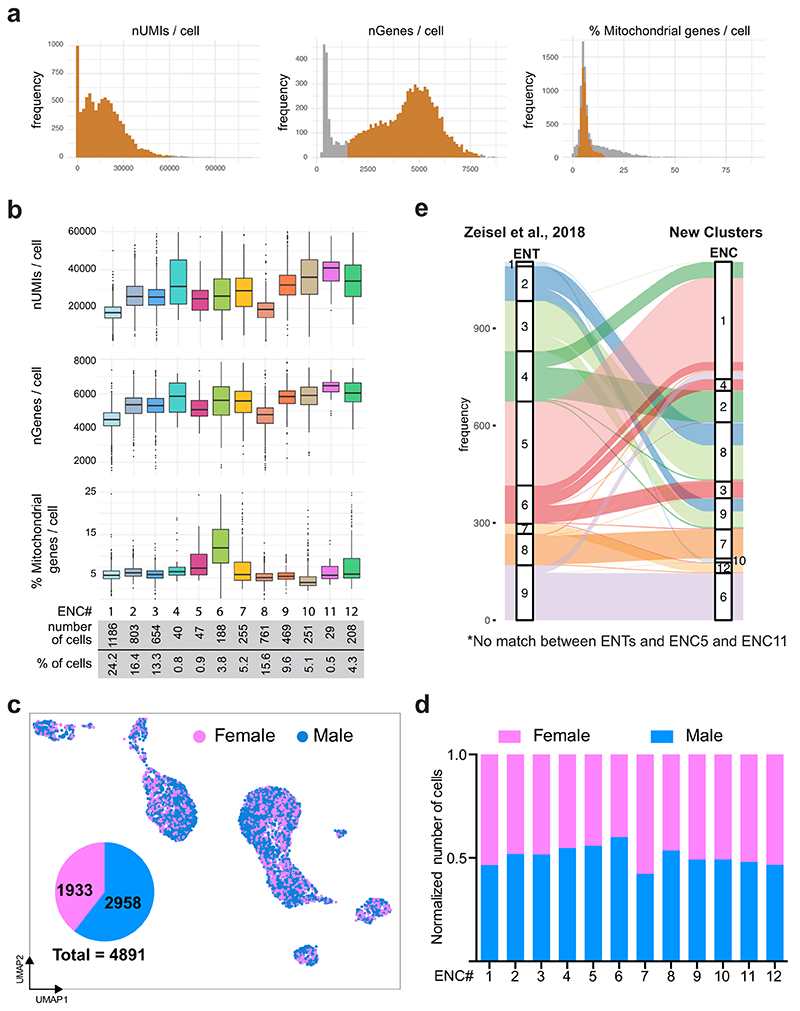
Of 9,141 cells captured we retained those with 600 total unique molecular identifier (UMI) counts to assess the proportion of neurons in the dataset (Fig. 1d, Extended Data Fig. 1a). More than 90% of the recovered cells corresponded to enteric neurons, compared to only 10% from Wnt1-Cre;R26R-Tomato mice18 (Fig. 1e). We employed iterative clustering with increasingly restrictive quality control thresholding, and removed low-quality, non-neuronal and ambiguous cells. 4,892 high quality enteric neurons were used for unsupervised graph-based clustering, yielding 12 enteric neuron classes (ENCs) with similar contribution from both sexes (Fig. 1f; Extended Data Fig. 1b-d). Note that our new classification confirmed 4 of the previously found clusters, re-defined 6 clusters and identified 2 new distinct clusters (Extended Data Fig. 1e).
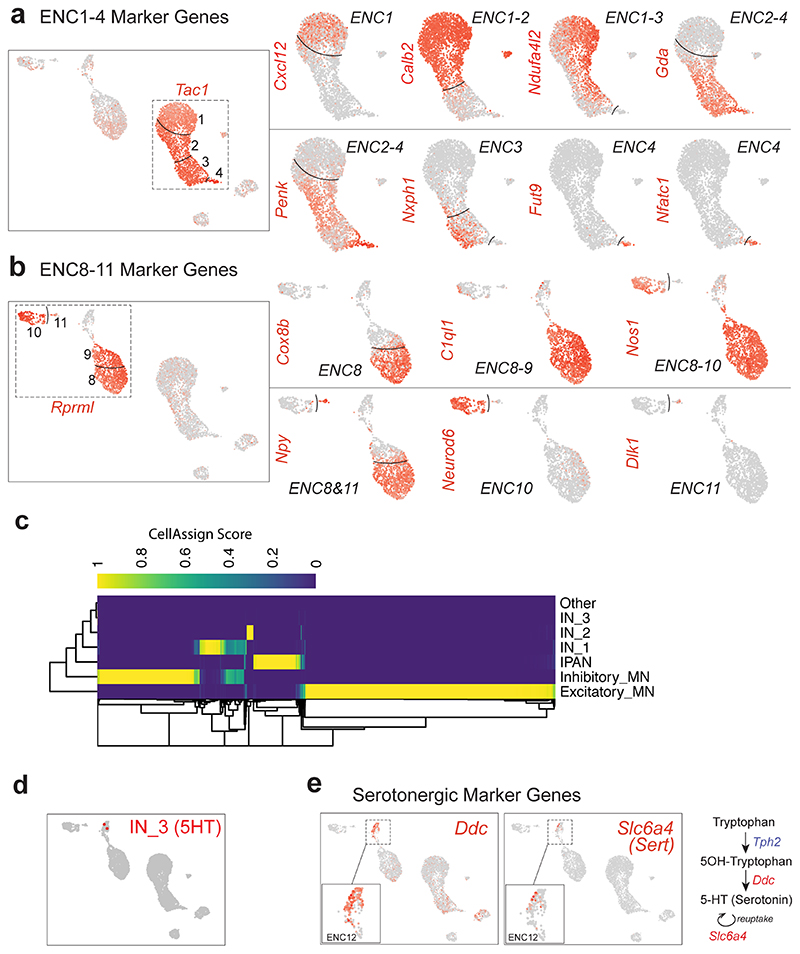
We discovered the most highly enriched genes in each class (Fig. 1g, Supplementary Table 1, Supplementary Fig. 1). Notably, some classes were defined by the selective expression of single genes with likely importance for their neuronal activity. These included ENC5 (somatostatin; Sst), ENC6 (neuromedin U; Nmu), ENC7 (cholecystokinin; Cck and urocortin 3; Ucn3), ENC10 (neuronal differentiation 6; Neurod6) and ENC12 (neurexophilin-2; Nxph2). Other classes were distinguished by combinatorial gene codes (Fig. 1g). ENC1-4 displayed a partly shared gene expression, including Tac1, but differed in their expression of Calb2, Ndufa4l2, Gda, Penk and Fut9 (Extended Data Fig. 2a). ENC8-9 jointly expressed Nos1 and c1ql1, but Npy and Cox8b were significantly lower in ENC9. ENC11 highly expressed Npy, but lacked Nos1 (Extended Data Fig. 2b).
We next sought to relate our new ENS classification to previously discovered characteristics of functional enteric neuron types. To this end, we gathered phenotypic marker codes from previous immunohistochemical studies,4,5,6 performed probabilistic cell type assignment (Fig. 1h, Extended Data Fig. 2c) and regrouped according to the ENCs. The ENCs generally consisted of cells with the same functional type (Fig. 1h,i). ENC1-4 were assigned to excitatory motor neurons (Tac1/Calb2), while ENC8 and 9 matched inhibitory motor neurons (Nos1/Gal/Vip/Npy). ENC6, 7 and 12 were mapped to IPANs and expressed different combinations of previously defined markers (Calca/Calcb/Nfem/Calb1/Calb2). These plausible IPANs were clearly separable by their selective expression of Nmu, Ucn-3/Cck or Nxph2. The IPAN identity of ENC6 and subsets of ENC12 was confirmed, while ENC7 likely have different functions (See analysis in Fig. 4). ENC10 was assigned to Interneuron (IN)1, and was, contrary to most enteric neurons, both nitrergic (Nos1) and cholinergic (Slc18a3; Chat detection level overall low18). ENC5 expressed Sst/Calcb/Calb2 and was mapped to IN2. Characteristics of serotonergic IN3, (Ddc, Slc18a2, Slc6a4, Fig. 1h; Extended Data Fig. 2d,e) were detected in a subset of ENC12 cells.
Gene profiles signified several additional neuroregulatory substances with class-specific expression. vGlut2 and Gad2 expression suggested glutamatergic (ENC7,12) and GABAergic (ENC10) phenotypes (Fig. 1g,j). ENC11 expressed Dbh and Th, key enzymes in the noradrenaline biosynthesis (Fig. 1g,j), but lacked Ddc.
Enteric Neuron Classes are defined by their unique communication features
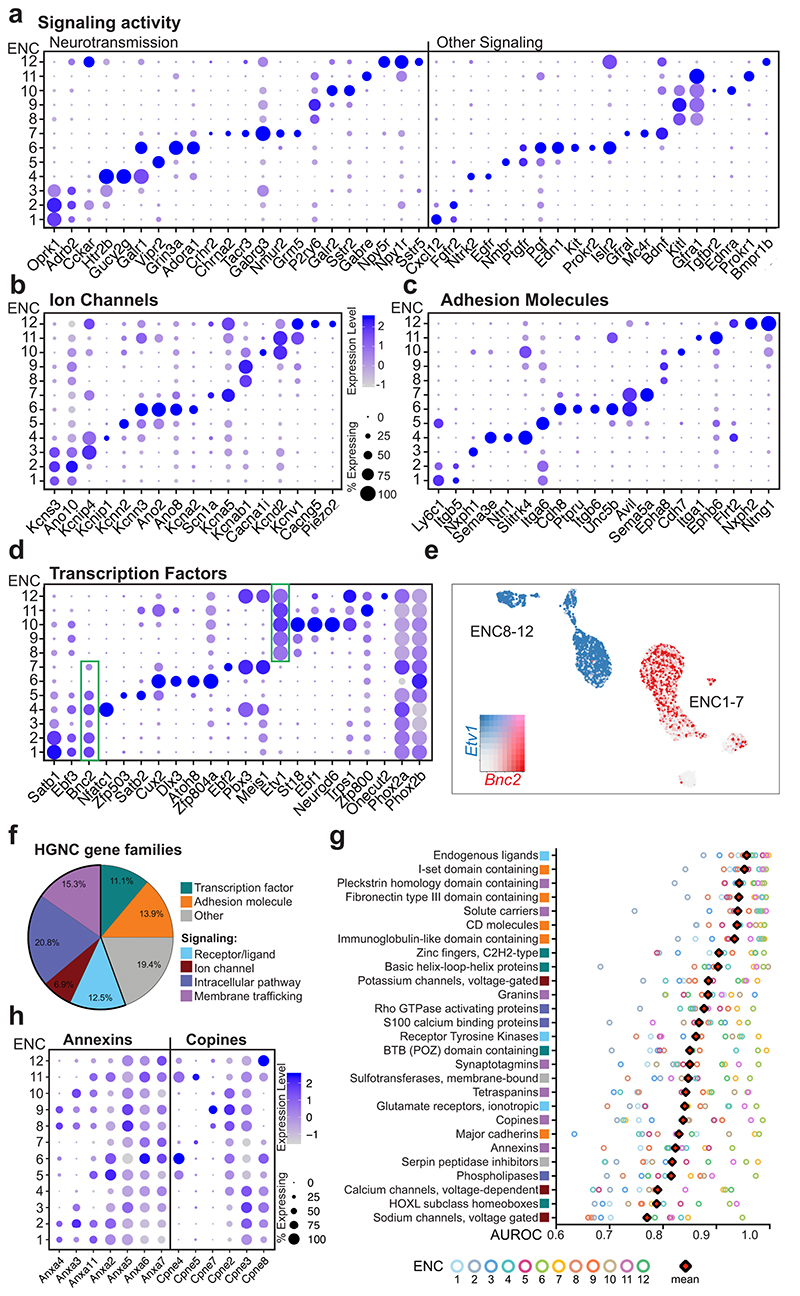
Synaptic input-output communication represents a fundamental distinction among neuron types and is determined by connectivity, responsiveness, and release of neurotransmitters/peptides.20 We explored gene families that control these functions and found differential expression between the ENCs (Fig. 2a-d; Supplementary Fig. 2). Responsiveness to enteric neurotransmitters/peptides appeared class-specific. For example, glutamate receptor Grm5 was selectively expressed in ENC7, while somatostatin receptor Sstr5 was limited to ENC12 (Fig. 2a). Distinct expression of many cell signaling molecules with unknown functions in the mature ENS (e.g. Kit, Bdnf) was also detected amongst ENCs. Notably, ENC6 selectively expressed signaling factors/modulators recently linked to enteric control of immune cells (Nmu and the BMP inhibitor Nog)21–23 (Fig. 1g, Supplementary Fig. 2b). Ion channels showed class-specific distribution likely reflecting unique electrophysiological properties (Fig. 2b; Supplementary Fig. 2e). ENC6 expressed Kcnn3 and Ano2, described in sensory transduction7,24, while ENC12 expressed the mechanosensory channel Piezo2 25, further supporting sensory identities of these two classes. ENCs also displayed unique combinations of adhesion molecules (e.g. semaphorins and ephrins) that may determine their precise connectivity patterns (Fig. 2c; Supplementary Fig. 2d). Of notice, neurexophilins (Nxph1-4), modulators of synaptic plasticity26, displayed almost mutually exclusive expression patterns. Taken together, the selective expression of genes conferring neuronal properties strongly supports that ENC1-12 represent functionally distinct neurons.
Figure 2. Gene categories conferring functional characteristics in Enteric Neuron Classes.
a-d) Dot plots showing differentially expressed genes categorized as signaling molecules, ion channels, adhesion molecules and transcription factors. Color scale represents z-score and dot size represent percentage of cells with non-zero expression within a given class. See Supplementary Fig. 2 for dot plots of all enriched gene members within these gene categories. Green boxes in (d) highlight Bnc2 and Etv1 whose expression broadly span class 1-7 and 8-12, respectively. e) Bnc2 and Etv1 expression in individual cells depicted on UMAP. Color map represents scaled expression of Bnc2 (red), Etv1 (blue), co-expressed (pink) and non-expressing (grey). f) Pie chart showing the proportion of different categories of gene families with mean AUROC > 0,75. g) Selected top scoring HGNC gene families ordered by mean AUROC. Square colors indicate gene family categories. See Supplementary Table 2 for the full list of the gene families. Top-scoring gene families corresponded to 69% of gene families previously shown to define diversity amongst cortical inhibitory neurons20. h) Dot plot showing differentially expressed genes within two gene families categorized to membrane trafficking (see also Supplementary Fig. 2f). AUROC: area under the receiver operator characteristic curve; ENC: Enteric Neuron Class; HGNC: HUGO Gene Nomenclature Committee; UMAP: Uniform Manifold Approximation and Projection
Gene profiles conferring neuronal characters result from fine-tuned transcriptional programs. We found that each ENC were distinguishable by its combinatorial set of transcription factors, for example ENC10 (Neurod6) and ENC12 (Pbx3, Onecut2)) (Fig. 2d; Supplementary Fig. 2c). ENC6 showed the most distinct profile and was the only class that lacked Phox2a. Etv1 and Bnc2 were expressed across several ENCs but with a complementary pattern, possibly reflecting early developmental divisions (Fig. 2d,e).
To identify additional gene families that define ENC identities, we assessed HGNC (HUGO Gene Nomenclature Committee) gene-sets curated by Paul et al (2017)20 in our ENCs (Supplementary Table 2). The majority of enriched gene families could be classified according to their transcription, adhesion and signaling activities (Fig. 2f,g). We also found 15% of the high-ranking gene-sets to have “membrane trafficking” properties, including the relatively unexplored copines27 and annexins28 (Fig. 2h, Supplementary Fig. 2f). Thus, proteins organizing membrane distribution of receptors/channels/vesicles may contribute to neuron subtype specific features.
Identification of immunohistochemical markers for Enteric Neuron Classes
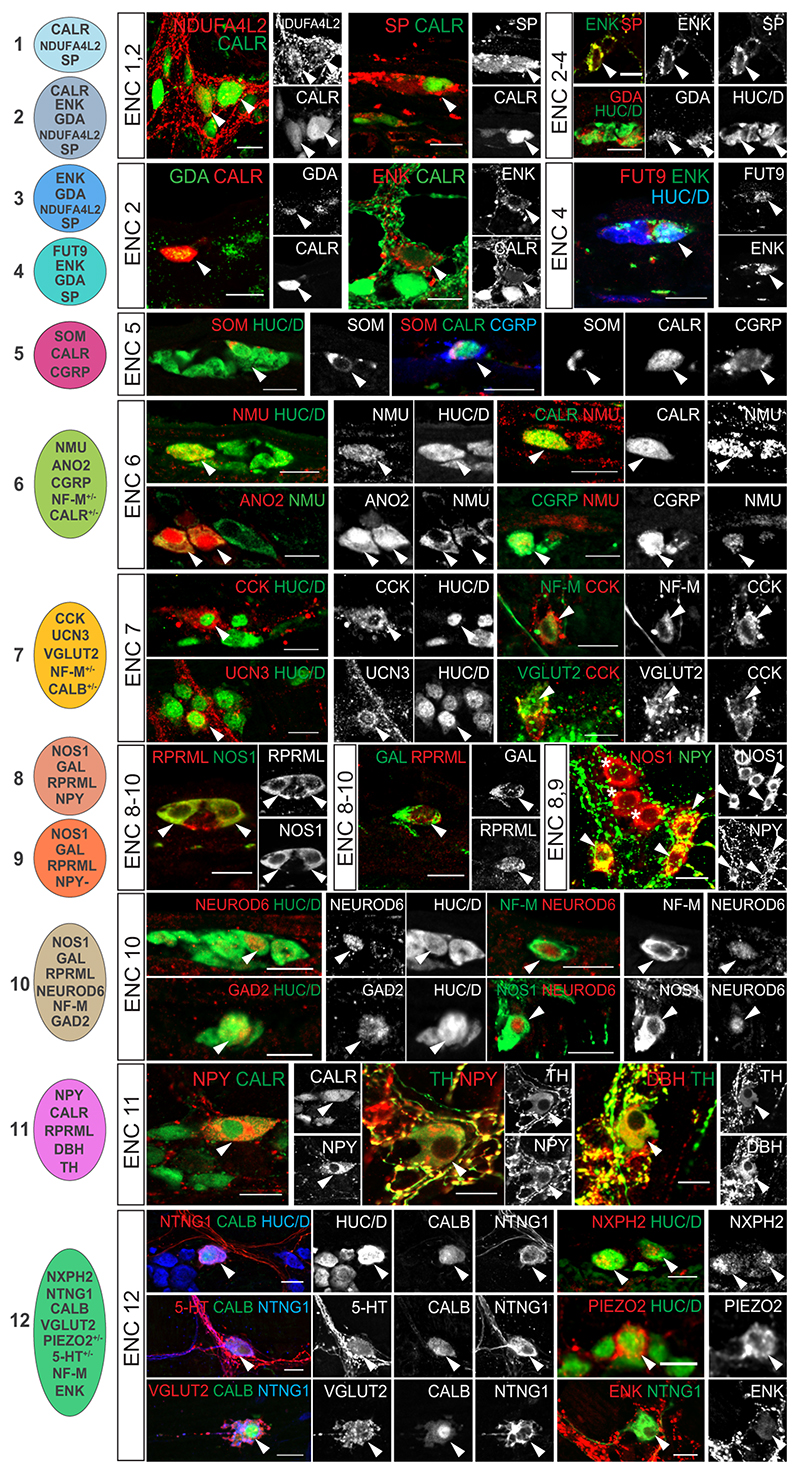
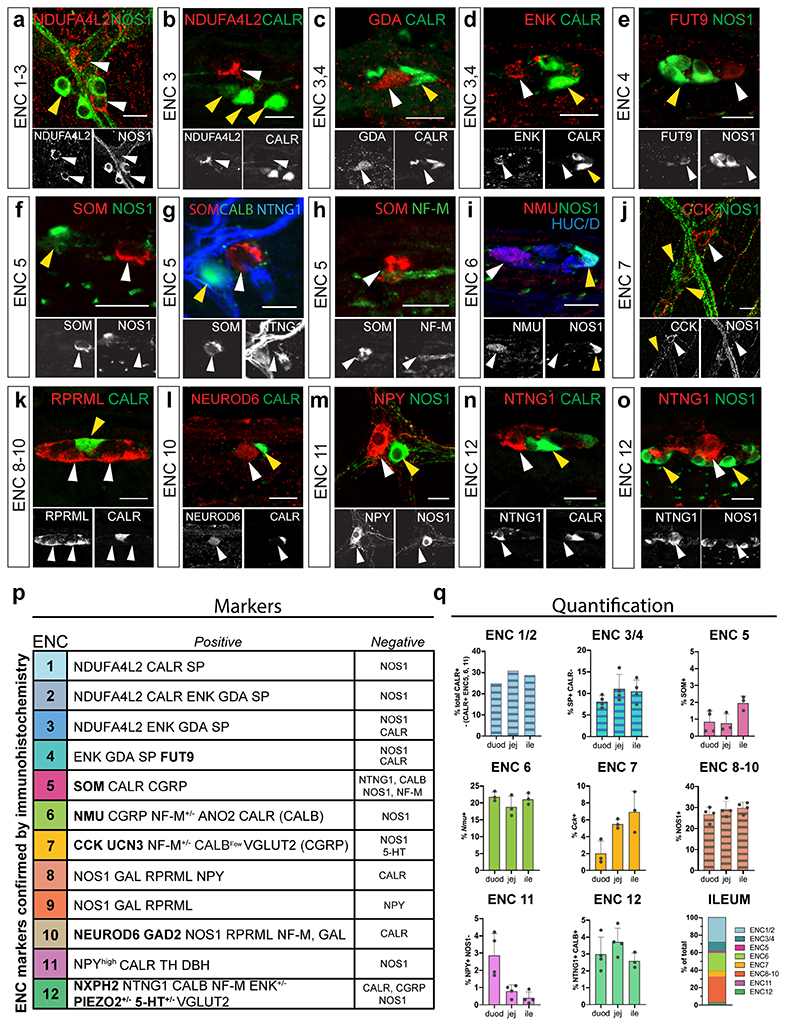
To validate the existence of enteric neuron classes in vivo we performed immunohistochemistry in the mouse small intestine and included both positive (Fig. 3) and negative markers (Extended Data Fig. 3) for all ENCs. A total of 23 proteins were analysed with respect to our newly defined ENCs. Several antibodies for the same antigen and ENC were assessed to ensure faithful histochemical reagents for individual ENCs (Supplementary Table 3). Of notice, proteins previously not linked to distinct enteric neuron subtypes in the mouse ENS were detected including NDUFA4L2 (ENC1-3), FUT9 (ENC4), UCN3 (ENC7), NEUROD6 (ENC10), and NXPH2 (ENC12). Their expression was found in the context of a combinatorial marker code (See Extended Data Fig. 3p for a summary table). For instance, NEUROD6 co-expressed NOS1 and NF-M (Fig. 3, ENC10) but never co-appeared with CALR (Extended Data Fig. 3l). We furthermore quantified the relative proportion of ENCs across the small intestine in 9-12 weeks C57/B6 mice (Extended Data Figure 3q).
Figure 3. Immunohistochemical validation of marker genes for Enteric Neuron Classes.
Immunohistochemical localisation of selected key marker proteins of ENC1-12 in the myenteric plexus of small intestine. Images for CCK, VGLUT2 and CGRP were obtained from colchicine treated tissues where proteins are concentrated to neuron bodies. Arrowheads indicate co-expression of proteins. Stars indicate NOS1+ neurons lacking NPY expression (ENC9). Schematic cell drawings to the left indicate positive markers tested. Pictures show either myenteric peel preparations or transverse sections at P21-P90. See Extended Data Fig. 3 for negative marker genes and summary of all validated marker genes. See also Extended Data Fig. 4 for schematic tables summarising gene expression. Color channels were individually adjusted. Scale bars indicate 20μm. CALB: Calbindin; CALR: Calretinin; CCK: Cholecystokinin; CGRP: Calcitonin Gene Related Peptide; DBH: Dopamine Beta Hydroxylase; ENK: Enkephalin; GAD2: Glutamic Acid Decarboxylase 2; GAL: Galanin; HUC/D: Elav-Like Protein 3/4; NF-M: Neurofilament M; NMU: Neuromedin U; NOS1; Nitric Oxide Synthase 1; NPY: Neuropeptide Y; NTNG1: Netrin G1; RPRML: Reprimo-Like; SOM: Somatostatin; SP: Substance P; TH: Tyrosine Hydroxylase; VGLUT2: Vesicular Glutamate Transporter 2
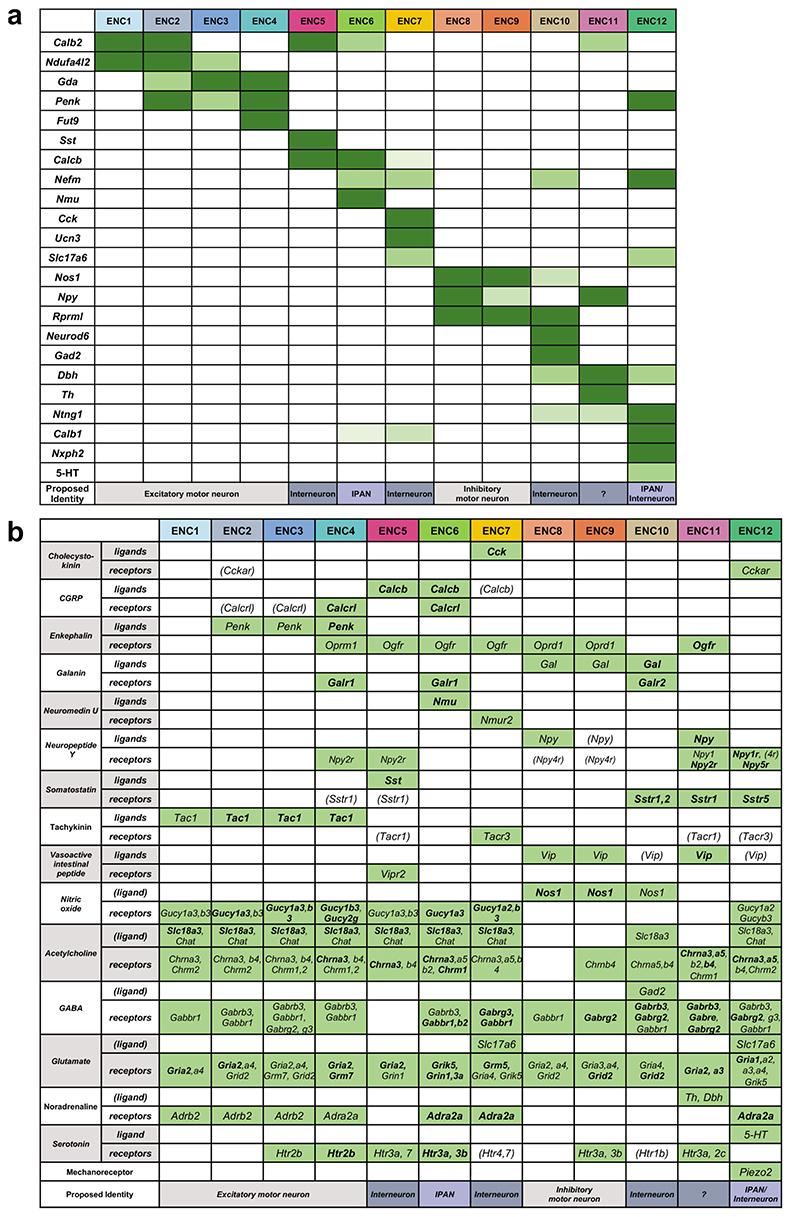
Analysis of protein expression enabled the additional study of neurotransmitters, which are catalytic amino acid products and therefore not detectable in transcriptomes. Of notice, 5-HT (serotonin) was identified in a subset of ENC12 neurons (Fig. 3) as suggested from the cell assignment (Extended Data Fig. 2d,e). The analysis also supported GABAergic (GAD2) and glutamatergic (VGLUT2) phenotypes (Fig. 1j, Fig. 3). See Extended Data Fig. 4 for schematic tables contrasting the ENC gene expression patterns.
ENC6 and subsets of ENC12 neurons show morphological and projectional IPAN traits
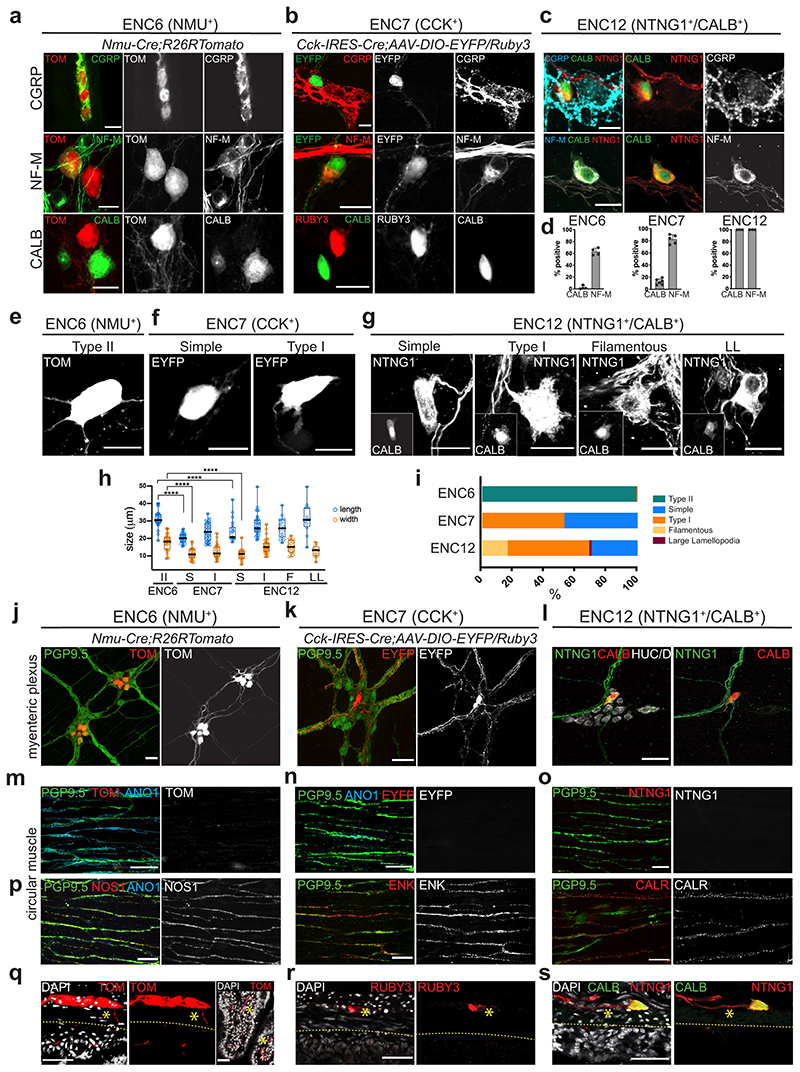
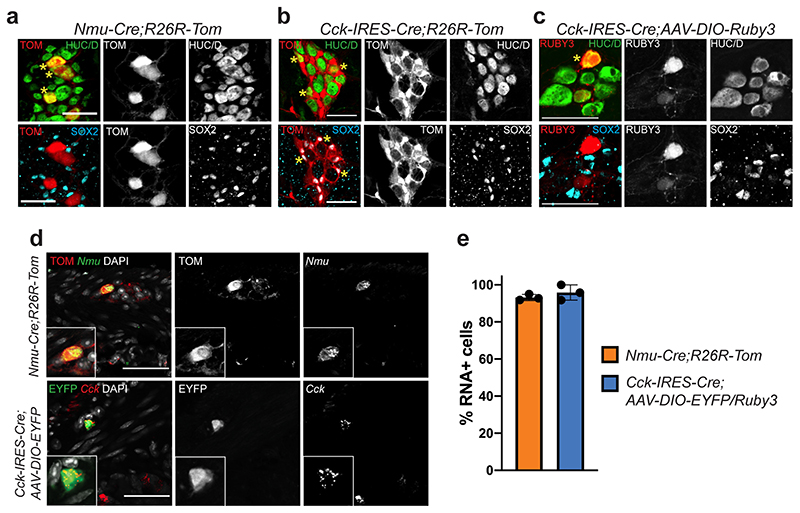
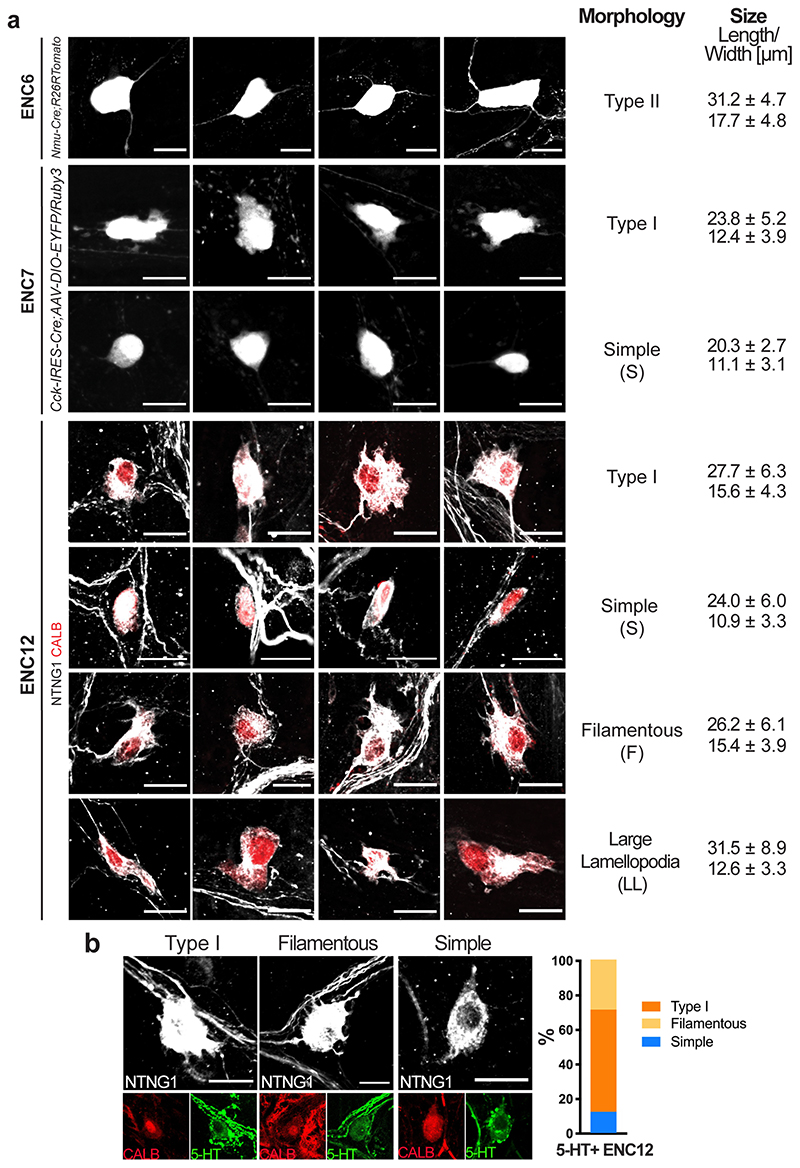
We chose to further investigate the three predicted IPANs (ENC 6,7 and 12) given the key functions enteric neurons with sensory abilities are expected to play in gut physiology7 (Fig. 1h,j). Immunohistochemical identification of ENC6 and ENC7 by their most specific markers was possible but not robust (Fig. 3), and we therefore acquired Nmu-Cre and Cck-IRES-Cre mice. Both transgenic lines were initially crossed to R26R-Tomato mice. Using RNAscope® we determined that 95.8±2.9% of Nmu + cells were labelled with TOM and that 93.2±1.6% of TOM+ cells expressed Nmu, confirming the efficiency and specificity of Nmu-Cre;R26R-Tomato mice (Extended Data Fig. 5a,d,e). In contrast, Cck-IRES-Cre;R26R-Tomato mice showed wide-spread TOM labelling in both enteric neurons and glia (Extended Data Fig. 5b), likely due to transient embryonic Cck expression17. To target Cck + neurons, we instead injected Adeno-Associated Virus (AAV-PHP-S)29 carrying an inducible reporter (DIO-EYFP or DIO-Ruby3) into Cck-IRES-Cre mice. Reporter expression specifically labelled Cck + neurons (95.8±4.1% of EYFP cells; Extended Data Fig. 5c-e). To detect ENC12 we used NTNG1 and CALB (validated in Fig. 3).
We first assessed the IPAN markers CGRP, NF-M and CALB protein expression as scRNA-seq indicated differential expression in the three putative IPAN classes (Fig. 1g). CGRP marked most ENC6 neurons, but was not readily detectable in ENC7 and 12 (Fig. 4a-d). NF-M was most prominent in ENC12 (100%), but also detected in the majority of ENC6 and ENC7. CALB (defined as marker of ENC12) was only found in a minor proportion of ENC6 and ENC7. In conclusion, previous IPAN markers formed the following combinatorial codes: ENC6 (CALB- CGRP+ NF-M+/-), ENC7 (CALB+/- CGRP- NF-M+/-), and ENC12 (CALB+ CGRP- NF-M+).
Figure 4. Assessment of IPAN characteristics in ENC6, 7 and 12.
a-c) Immunohistochemical detection of IPAN markers in ENC6, 7 and 12. d) Graph showing the proportions of cells among ENC6, 7 and 12 expressing IPAN markers. Each dot indicates one animal (n= 3-6). NF-M was detected in 63,6±5,43% of ENC6 (1326 cells), 82,5±7,42% of ENC7 (903 cells) and 100% of ENC12 neurons. CALB was found in 2,3±2,96% of ENC6 (1999 cells) and 14,9±4,76% of ENC7 (1588 cells) neurons and considered a defining marker of ENC12. Bar graphs show mean SD. We did not attempt to quanitify CGRP as faithful detection required colchicine treatment, compromising other marker expression. e-g) Representative examples of ENC6, 7 and 12 cell morphologies in Nmu-Cre;R26RTomato, Cck-IRES-Cre;AAV-DIO-Eyfp/Ruby3 mice and wildtype mice labelled with NTNG1/CALB, respectively. See Extended Data Fig. 6 for more examples. h) Quantification of neuron sizes in morphological groups of ENC6, 7 and 12. Each circle represents one cell. Box-and-whisker plots indicate max-min (whiskers), 25-75 percentile (boxes) with median as a centre line. Two-sided Student’s t-test was used for statistical analysis. ****p <0.0001. i) Quantification of proportions of different morphological types among ENC6, 7, and 12. Number of cells analysed (each from 2 animals): 689 ENC6 neurons; 440 ENC7 neurons; 321 ENC12 neurons. j-l) Cell bodies and projections originating from ENC6,7 and 12 are visible in the myenteric plexus plane. m-o) Immunohistochemical analysis in the circular muscle layer showing clear labelling of axons (PGP9.5+) and ICCs (ANO1+) but absence of ENC6, 7 and 12 axons. p) Abundance of motor neuron projections (NOS1+, ENK+ or CALR+) in the circular muscle layer. q-s) Transverse sections showing the direction of projections originating from NMU+, CCK+ and NTNG1/CALB neurons. Many NMU+ axons (but not CCK+ or NTNG1/CALB) were found to cross the circular muscle layer and project down into submucosa and villi. Stars indicate positive axons and dotted stripes demarcates the submucosal layer. Color channels were individually adjusted. Pictures show either myenteric peel preparations or transverse sections at P21-P90. Scale bars indicate 20μm in a-g, and 50μm in j-s. ANO1: Anoctamin 1; CALB: Calbindin; CALR: Calretinin; CCK: Cholecystokinin; CGRP: Calcitonin Gene Related Peptide; EYFP: Enhanced Yellow Fluorescent Protein; ENK: Enkephalin; HUC/D: ELAV-like Protein 3/4; ICC: Interstitial Cell of Cajal; NF-M: Neurofilament M; NMU: Neuromedin U; NOS1: Nitric Oxide Synthase 1; NTNG1: Netrin G1; PGP9.5: Neuron Cytoplasmic Protein 9.5; TOM: tdTomato, DAPI: 4′,6-diamidino-2-phenylindole
IPANs are thought to mainly correspond to cells with Dogiel Type II morphology, defined as large, smooth cell body with multiple axons.30,31 However, uni-axonal filamentous neurons have also been attributed mechanosensory functions in the guinea pig.32 ENC6 neurons classified as Type II (Fig. 4e,h,i; Extended Data Fig. 6a). ENC7 neurons were either Dogiel Type I (lamellar dendrites and one discernible axon)30 or what we termed “Simple”, having round or oval cell bodies and one (sometimes two) axons (Fig. 4f,h,I; Extended Data Fig. 6a). ENC12 morphologies displayed remarkable heterogeneity; we found Type I, “Simple”, Filamentous, and a population with large lamellar cytoplasmic extension, here termed “LL” (Fig. 4g-I, Extended Data Fig. 6a).
Given the first position of IPANs in the peristaltic circuit, they connect to interneurons and motor neurons within the myenteric plexus but do not innervate the external muscle layers. While axons from the three ENCs were readily observed in the myenteric plexus plane (Fig. 4j-l), none were identified within the circular muscle (Fig. 4m-o). In contrast, extensive axonal tracts for inhibitory (NOS1+) and excitatory (ENK+, CALR+) motor neurons were found in proximity to Interstitial Cells of Cajal (ANO1+) in the circular muscle plane (Fig. 4p). Thus, we concluded that ENC 6, 7, and 12 are not motor neurons.
Another distinguishing feature of IPANs is their projection to the submucosa and mucosa. On transverse tissue sections, we found NMU+ axons intersecting the circular muscle (Fig. 4q). Projections in the villi were also detected, which possibly have a mixed origin also emanating from NMU+ submucosal neurons. In contrast, CCK+ axons and NTNG1/CALB+ axons were only observed in the myenteric plexus and not in the muscle or villi (Fig. 4r,s).
In conclusion, our study identified ENC6 as Type II IPANs and with that the Nmu-Cre mouse strain as a useful tool to further study and modulate this important enteric neuron type. The particular morphology displayed by a subset of ENC12 neurons and the expression of PIEZO2 (Figs. 2b, 3) connects these cells to the reported filamentous IPANs. Our analysis indicated that ENC7 do not correspond to bona fide IPANs, despite their expression of NF-M and CALB. Thus, previously used IPAN markers cannot faithfully discriminate IPANs from other neuron types.
Single-cell RNA sequencing reveals transcriptional programs of generic cell states of the developing ENS
To understand the generic and specific differentiation processes underlying the formation of ENC1-12 we performed scRNA-seq of the whole ENS isolated from Wnt1Cre-R26RTomato small intestine at E15.5 and E18.5, when most myenteric neuron types are generated.15,16
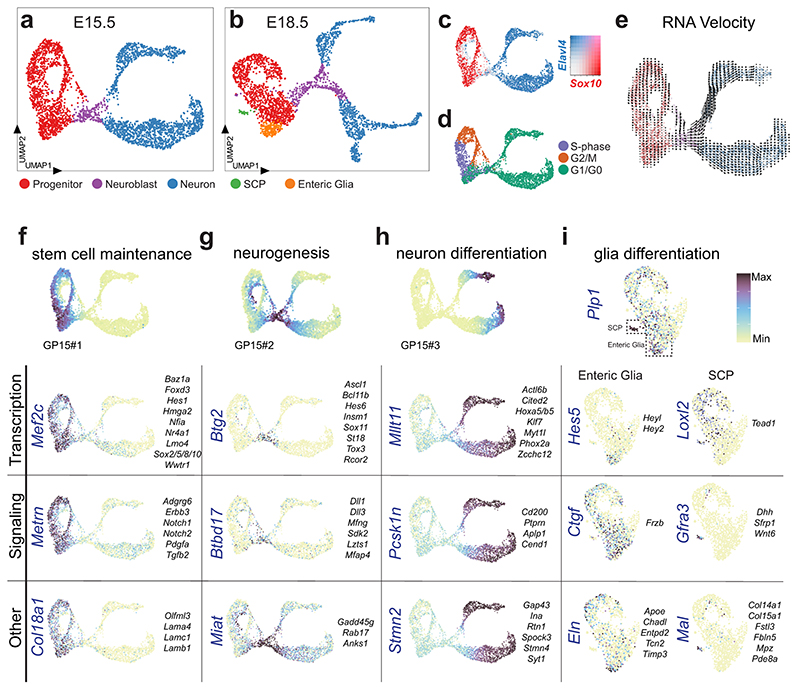
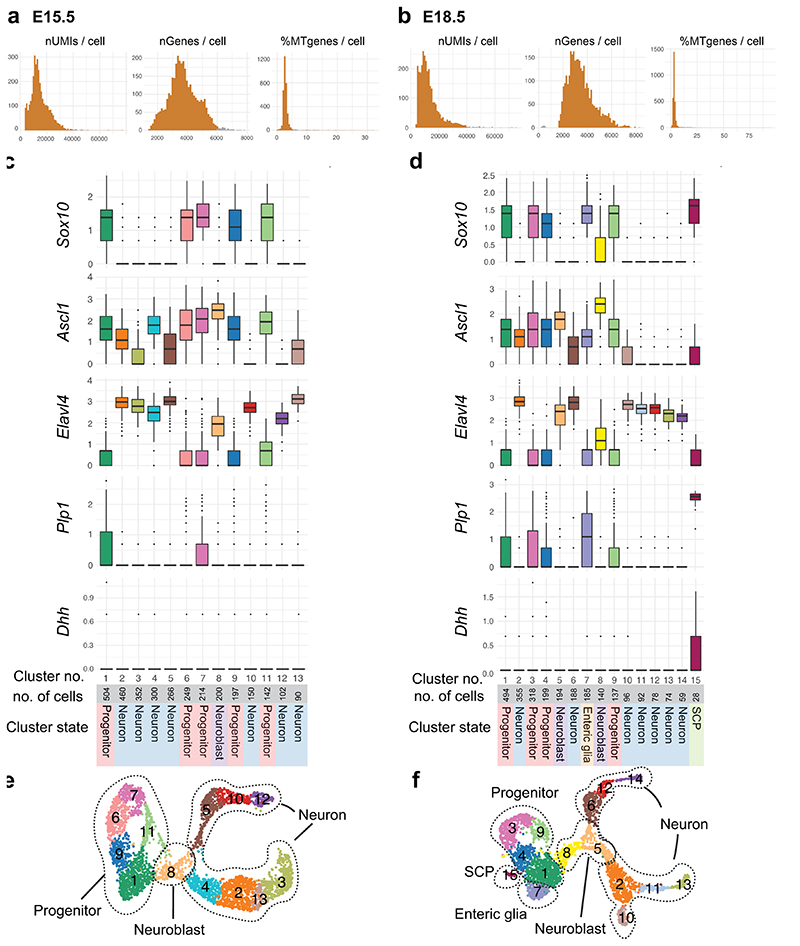
A total of ~3000-3500 cells were captured per stage. After removal of unhealthy, ambiguous or non-ENS cells (Supplementary Fig. 3, Extended Data Fig. 7a,b), the remaining cells (3260 for E15.5 and 2733 for E18.5) were subjected to clustering and coordinated gene pattern analysis. An overall similar manifold (UMAP, Uniform Manifold Approximation and Projection) was observed at the two stages (Fig. 5a,b; Extended Data Fig. 7c-f). The enteric progenitor/glial marker Sox10 (Fig. 5c) was used to assign clusters corresponding to progenitor cells within different parts of the cell cycle (Fig. 5d), while Elavl4HIGH expression (Fig. 5c) demarcated differentiating (maturing) neurons. An Ascl1 HIGH cluster at the intersection of the two was considered to correspond to cells undergoing the transitory phase of neurogenesis (here termed neuroblasts). While glial differentiation occurs early33, we only observed clear clusters corresponding to glia (Plp1 high; S100bhigh) at E18.5 (Fig. 5b). The two populations appeared to be the previously reported Schwann cell precursors (SCPs) that contribute to the ENS at perinatal stages13 (SCP markers: Dhh, Mal and Mpz; mousebrain.org), and vagal neural crest-derived enteric glia (enteric glia markers: Apoe, Nkain4; mousebrain.org). To investigate the cell differentiation dynamics, we performed RNA velocity analysis (Fig. 5e), which confirmed the overall direction from progenitors to maturing neurons. The strongest transcriptional change appeared to occur at the neuroblast stage (indicated by long arrows), while cells at the branch “tips” seemed to approach a differentiated steady-state (short arrows).
Figure 5. Single cell transcriptome analysis of the developing ENS reveals transcriptional programs of generic cell states.
UMAP of E15.5 (a) and E18.5 (b) ENS scRNA-seq datasets displaying generic states of the developing ENS. c) Complementary expression of Sox10 and Elavl4 reveals progenitor/glia cells versus neuronal populations in UMAP. Color map represents scaled expression of Sox10 (red), Elavl4 (blue), co-expressed (pink) and non-expressing (grey). d) Cell cycle assignment mapped onto UMAP at E15.5. e) RNA velocity analysis on UMAP at E15.5 suggesting the rate (indicated by arrow length) and direction (indicated by arrow direction) of cell differentiation. f-i) Enriched genes organized into categories, with likely functions in stem cell maintenance (E15.5; f), neurogenesis (E15.5; g), neuron differentiation (E15.5; h) and glial differentiation (E18.5; i) plotted on UMAPs. Top of panel displays UMAPs with corresponding gene patterns (GP15#1-3). Vertically written genes are displayed as UMAP for each category, while more genes with similar expression patterns are listed to the right of the UMAP. All transcription factors are displayed as Feature plots in Extended Data Fig. 9. See Supplementary Fig. 4 and Supplementary Table 4 for heat maps and lists of enriched genes, and Supplementary Table 5 for GP15#1-3 indicated in (f-h). Color bar indicates 0-90th percentile expression level. UMAP: Uniform Manifold Approximation and Projection; ENC: Enteric Neuron Class; GP15: Gene Pattern at E15.5.
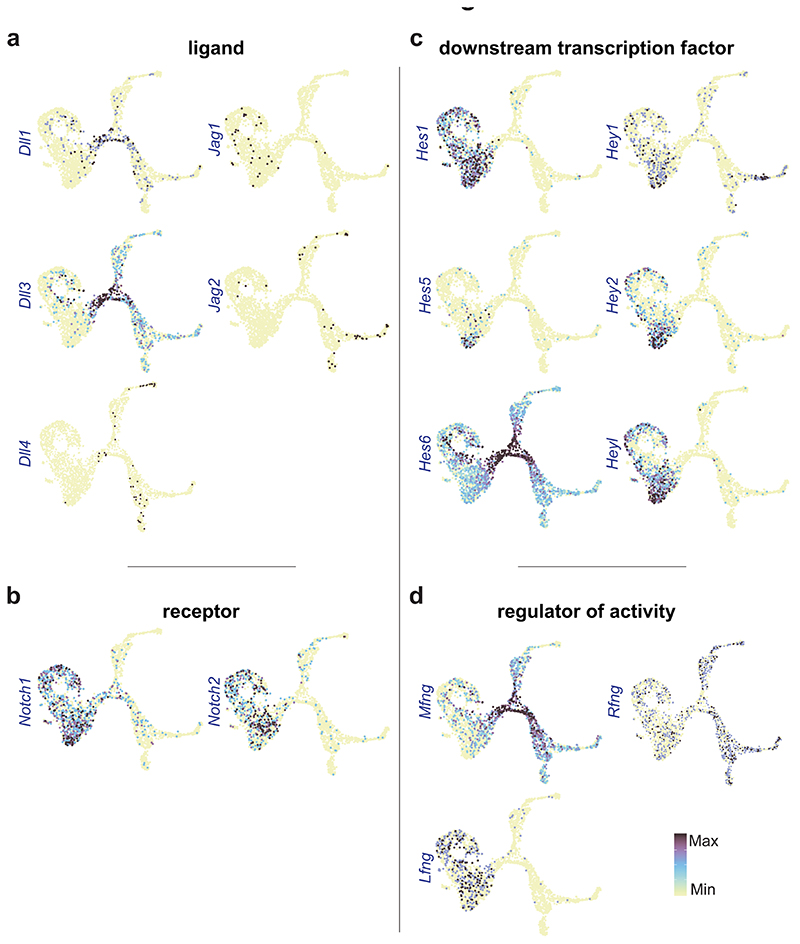
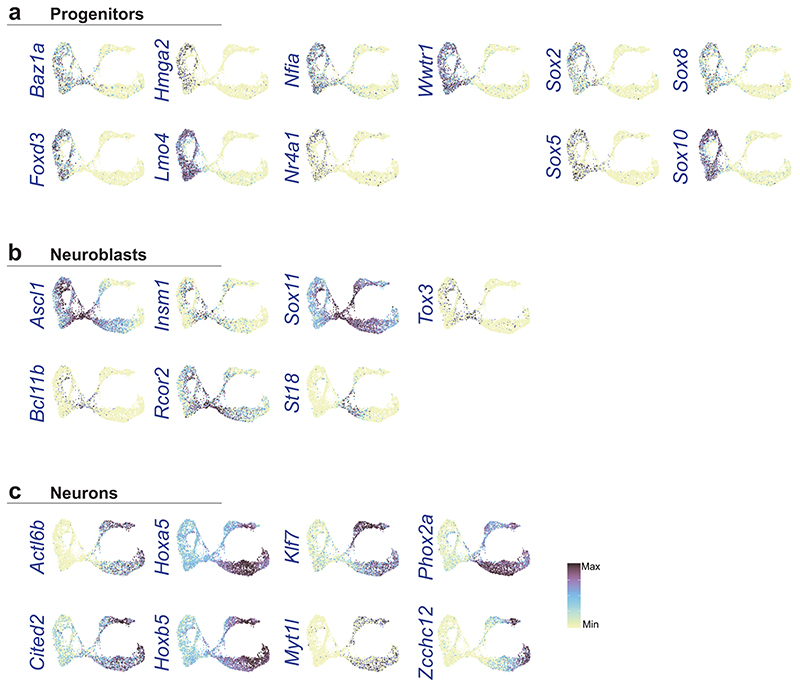
Differential expression analysis and coordinated gene patterns (Supplementary Fig. 4; Supplementary Tables 4,5) of these broad cell states were used to discover transcription and signaling genes with likely functions in stem cell maintenance (Mef2c, Sox5/8, Notch1/2; Fig. 5f), neurogenesis (Dll3, Hes6; Fig. 5g), neuron differentiation (Myt1l, Ptprn; Fig. 5h), SCP (Gfra3, Wnt6; Fig. 5i) and enteric glia (Hes5, Frzb; Fig. 5i). The Notch signaling pathway appeared strongly implicated in ENS development given the differential expression of its molecular components across cell states (Extended Data Fig. 8). Neuroblasts displayed enriched expression of various epigenetic modifiers (Rcor2, Bcl11b; Extended Data Fig. 9) likely to execute the observed vast transcriptional change (Fig. 5g) at neurogenesis.
Enteric Neuron Classes are formed through a binary fate split at neurogenesis followed by successive diversification at the post-mitotic stage
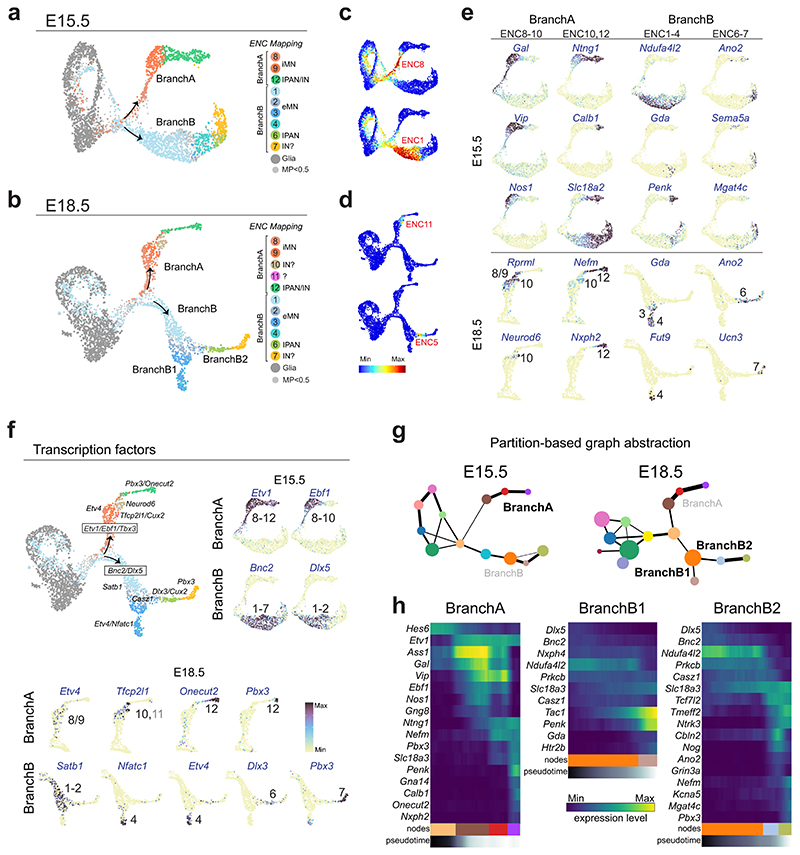
UMAP of ENS at E15.5 and E18.5 showed that enteric neurons are formed through two trajectories, which we termed BranchA and BranchB. On these branches, we sought to locate cells that have acquired traits of ENC1-12. By searching for shared overlap of mutual neighbors in projected principal component analysis (PCA) space, class identifiers were assigned by a weigh vote classifier, giving a prediction score for each ENC on the developmental data. Mapping of transferred identities with predicted score >0.5 onto the trajectories indicated that ENC8-12 are generated through BranchA, while ENC1-7 differentiate in BranchB (Fig. 6a-d; Supplementary Fig. 5). ENC5 and ENC11 likely emerge mainly postnatally, although some cells scored high for these identities when analyzed individually (Fig. 6d). Notably, the branching split point coincided with ENC8 and ENC1 identities (Fig. 6c). Differential expression analysis of fine clusters (Extended Data Fig. 7e,f; Supplementary Table 6) further corroborated the mapping and identified Gal/Vip/Nos1 (ENC8,9) and Ndufa4l2 (ENC1/2) within early branches (Fig. 6e). Within BranchA, traits corresponding to ENC10 (Neurod6) and ENC12 (Ntng1, Calb1, Nxph2) gradually appeared (Fig. 6e). ENC10-12 identities formed through a nitrergic-to-cholinergic switch (Nos1 down- and Slc18a2 up-regulated; Fig. 6e). The generation of ENC10 at the intersection of this process could therefore explain the mixed nitrergic/cholinergic identity of this neuron type (Fig. 1g). BranchB diverged further into BranchB1, corresponding to emergence of ENC3/4 (Gda, Fut9) or BranchB2, corresponding to ENC6 (Ano2) and ENC7 (Mgat4c, Ucn3).
Figure 6. ENC identities emerge through a binary neurogenic branching followed by post-mitotic neuronal diversification.
a,b) UMAP of E15.5 and 18.5 data sets with identity transfer of ENC1-12 and ‘enteric glia’. Threshold for maximum prediction score was set to > 0.5. Small grey dots indicate cells with no identity transfer. Most progenitor cells mapped to enteric glia due to their overall similar gene expression. c) Individual prediction scores of ENC8 and ENC1 coincide with emergence of BranchA and B. d) Individual prediction score of late-developing ENCs. See Supplementary Fig. 5 for prediction score of all individual ENCs mapped on UMAP. e) ENC1-12 juvenile marker genes displayed on E15.5 and E18.5 Feature plots validate ENC assignments. f) Transcription factors defining early binary branching and emerging ENCs on summary UMAP and Feature plots. See Extended Data Fig. 10 for more transcription factors on Feature plots. Color bar indicates 0-90th percentile expression level. g) PAGA graphs on UMAPs of E15.5 and E18.5 ENS corresponding to the differentiation of ENC8-12 (BranchA), ENC1-4 (BranchB1) and ENC1-3;6-7 (BranchB2). Weighted edges represent degree of significant connectivity between partitions. Size of node depicts number of cells in the corresponding cluster. Coloring is arbitrary, but matched between stages when possible. See Extended Data Fig. 7e and f for the corresponding clusters represented on UMAP. h) Heatmaps organized by diffusion pseudotime indicating gradual gene expression changes in PAGA paths. BranchA is shown at E15.5, while BranchB1, B2 are shown at E18.5 when clusters corresponding to ENC4, 6 and 7 are more distinct. Several more marker genes of juvenile ENCs picked from Supplementary Table 1 are shown: Ass1 and Gng8 (ENC8/9); Gna14 (ENC12); Nxph4 (ENC2/3, but not ENC4); Prkcb (ENC2/3/4, but not ENC6/7) Tmeff2 and Ntrk3 (ENC6/7), Cbln2 (ENC6) and Mgat4c/Kcna5 (ENC7). UMAP: Uniform Manifold Approximation and Projection; ENC: Enteric Neuron Class; PAGA: Partition-based graph abstraction; iMN: inhibitory motor neuron; eMN: excitatory motor neuron. IPAN: Intrinsic Primary Afferent Neuron; IN: Interneuron.
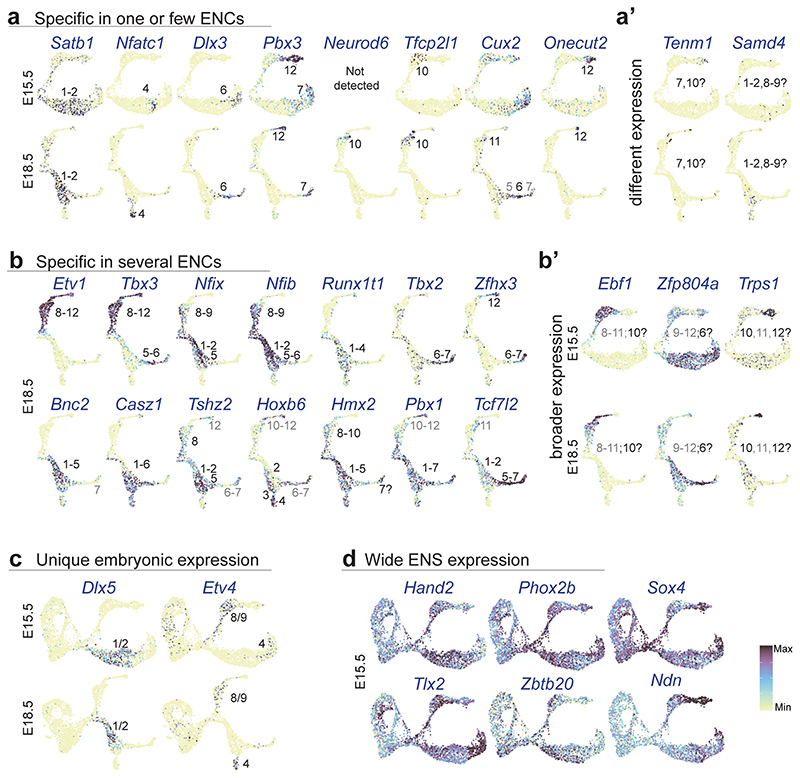
We screened for transcription factors that could define the two branches and their differentiation into ENCs. A pattern of Etv1/Ebf1/Tbx3 and Bnc2/Dlx5 marked the early trajectories of BranchA and BranchB, respectively. Those transcription factors either remained in the full branch (Etv1) or were suppressed in the process of differentiation (Ebf1) (Fig. 6f, Extended Data Fig. 10b,c). Thus, the complementary expression of Etv1 and Bnc2 in juvenile ENCs (see Fig. 2e) indeed reflects a developmental binary fate choice. Most transcription factors formed combinatorial codes that mirrored their juvenile expression (e.g. Neurod6, Onecut2), while a minority displayed broader developmental expression (Zfp804a, Trps1) (Fig. 6f; see also Extended Data Fig. 10; compare with Fig. 2d and Supplementary Fig. 2c). Transcription factors with transient expression in development were also discovered (Etv4, Dlx5; Extended Data Fig. 10c), and may function in neuron diversification, but not cell identity maintenance.
To investigate gene expression along developmental trajectories, we defined partition-based graph abstraction (PAGA) representation of E15.5 and E18.5 data (Fig. 6g). PAGA coupled with diffusion pseudotime analysis confirmed the gradual differentiation of ENCs within BranchA, BranchB1 and B2 (Fig. 6h). Thus, the 12 ENCs appear not to be generated from own stem cell pools. Instead, proliferating progenitors undertake only two prototypic traits similar to ENC1 or ENC8 upon completing neurogenesis (excitatory and inhibitory motor neurons; Fig. 6c). Subsequently, many neurons mature within their first identity, while others downregulate their specific markers and convert into new classes (ENC2-7; ENC9-12).
The ENC8/9 to ENC12 phenotypic switch depends on PBX3 expression
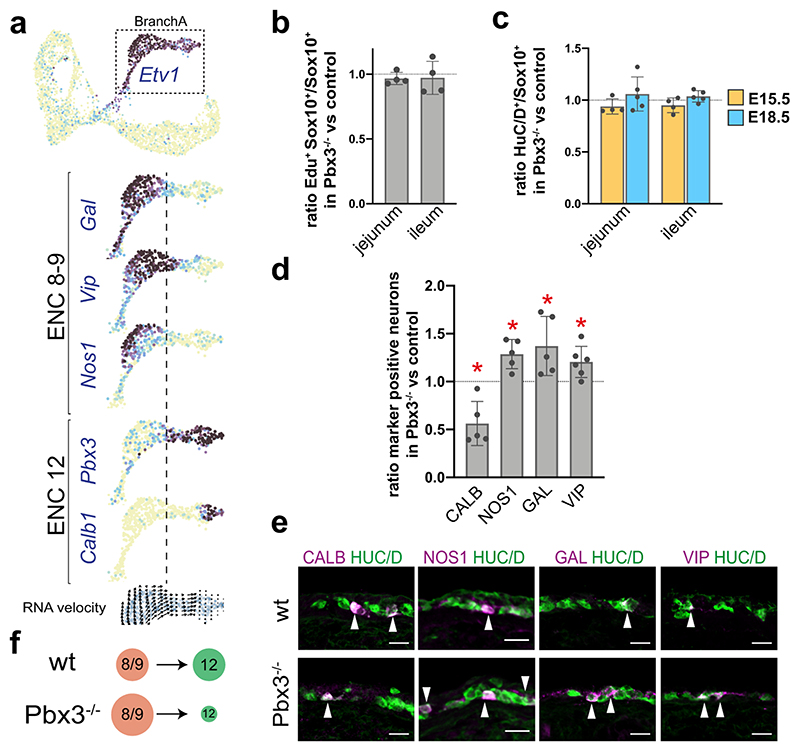
As nitrergic neurons (NOS1+) are of particular clinical importance8,9, we decided to focus on the gradual diversification within BranchA. We noted a border between ENC8/9 and ENC12 (Fig. 6a), coinciding with opposing expression of Gal/Vip/Nos1 relative to Ntng1/Nfem/Calb1 (Fig. 6e; Fig. 7a). Given the differentiation direction indicated by RNA velocity (Fig. 5e), neurons obtaining early ENC8/9 traits thus appear to convert into ENC12 neurons. Notably, Pbx3 expression correlated with the transition point (Figs. 7a). We have previously reported PBX3+ enteric neurons both in mouse and human embryonic gut that express CALB, but not NOS1.17 Quantification at E18.5 revealed that only 1.5±0.4% (n=3) of the NOS1+ neurons expressed PBX3, and those displayed low NOS1 levels. This expression dynamics suggests that the ENC8/9 identity may be negatively regulated by PBX3.
Figure 7. Loss of PBX3 expression impairs the ENC8/9 to ENC12 transition.
a) Feature plots showing the expression profile change in BranchA (Etv1+) at E15.5. Dotted line demarcates the approximate border between ENC8/9 and ENC12 and coincide with onset of Pbx3 expression. b) Graph showing that the ratio of SOX10+ cells that incorporated EdU after a 90 min pulse injection is similar in Pbx3-/- mutants and wt controls (set to 1) at E15.5. n = 4 Pbx3-/- mutants vs wt controls animal pairs. c) Graph showing an unchanged ratio of HUC/D+ over SOX10+ cells in Pbx3-/- mutants compared with wt controls (set to 1) at E15.5 and E18.5. n = 4-5 animal pairs. d) Graph showing the ratio between the percentages of neurons (HUC/D) expressing different neurotransmitters/peptides in Pbx3-/- mutant and control (set to 1). Two-sided Student’s Paired t-test was used for statistical analysis. n= 5-6 animal pairs. *p <0.05; bar graphs show mean SD. CALB: p=0,015; NOS1: p=0,013; GAL: p=0,038; VIP: p=0,02. The absolute percentages were: NOS1: Wt: 34,75 ± 5,26%; Mutant: 44,56 ± 7,69%; GAL: Wt: 13,40 ± 2,10%; Mutant: 17,85 ± 1,32%; VIP: Wt: 12,28 ± 4,20%; Mutant: 14,48 ± 4,43%; CALB: Wt: 5,95 ± 1,16%; Mutant: 3,4 ± 1,65%. e) Representative pictures of the small intestine at E18.5 in wt and Pbx3-/- embryos showing increased ratios of neurons expressing NOS1, GAL and VIP and decreased ratio of neurons expressing CALB. f) Schematic drawing indicating the increased number of presumed ENC8/9 at the expense of ENC12 neurons in the ENS of Pbx3-/- mutant mice compared to control. (d). Color channels were individually adjusted in (e); wt: wildtype; EdU: 5-ethynyl-2 deoxyuridine; HUC/D: Elav-Like Protein 3/4; GAL: Galanin: NOS1: Nitric Oxide Synthetase 1; CALB, Calb1: Calbindin; VIP: Vasoactive Intestinal Peptide; ENC: Enteric Neuron Class.
To evaluate the role of Pbx3 in ENS development, we analyzed the guts of Pbx3-/- mutant mice. As Pbx3-/- mutant mice die within hours after birth,34 we focused our analysis at E15.5-E18.5. We first investigated if the proliferative capacity of ENS cells was affected in Pbx3-/- mutant mice. The ratio of SOX10+ cells in the S-phase of the cell cycle, incorporating the nucleoside analog EdU after a 90 min pulse, was the same in mutant and control guts at E15.5 (Fig. 7b). Moreover, the ratio of HUC/D+ cells to SOX10+ cells was unchanged in the mutant compared to control guts (Fig. 7c). Thus, the loss of Pbx3 does not impact generic programs of enteric proliferation or neurogenesis.
The correlation between Pbx3 expression in emerging ENC12 neurons bordering ENC8/9 neurons prompted us to determine the percentage of HUC/D+ neurons expressing the ENC8/9 markers GAL, NOS1 and VIP and the ENC12 marker CALB at E18.5. We found a significant increase in the proportion of neurons expressing VIP (20.5%), NOS1 (28.7%) and GAL (37.1%) (Fig. 7d,e), while the ratio of CALB+ neurons was decreased by 43.8% (Fig. 7d,e) in Pbx3-/- mutants compared to control guts. Thus, our data suggest that PBX3 suppresses the ENC8/9 phenotype and allows or induces differentiation of the ENC12 identity. In the absence of PBX3, neurons fail to differentiate efficiently into CALB+ ENC12 neurons and mature instead into GAL+/VIP+/NOS+ neurons (Fig. 7f). ENC7 neurons also express PBX3 (Fig. 6f), and we found that they too were reduced in Pbx3-/- mutant mice (ratio of neurons expressing CCK was decreased by 72,1±1,43%; n=4 mouse pairs). These data support a post-mitotic cell diversification model, where initial branch-specific gene expression is repressed in a process of cell identity conversion to achieve neuron subtype heterogeneity.
Discussion
The neuronal composition of murine ENS and how it emerges during development have not been determined in detail. This study provides a new taxonomy of small intestine myenteric neurons and a novel principle of their embryonic diversification.
A novel molecular classification of myenteric neurons in the mouse small intestine
We present a pan-neuronal mouse line, Baf53b-Cre, that allow specific and efficient capturing of ENS neurons. We define 12 classes of myenteric ENS neurons, (ENCs) and suggest their basic functional assignment. Although previously IPAN markers were found within three ENCs, our characterization of morphology and projections suggest that sensory neurons may only correspond to ENC6 and a subset of ENC12, having immunoregulatory or mechanosensory properties, respectively. The validated genetic mouse tool (Nmu-Cre) and stringent markers (NTNG1/CALB), together with cell-cell communication profiles could help to refine the definition of different types of enteric neurons with sensory abilities and determine possible additional interneuron characteristics. We do not rule out that other ENCs (or subsets within) form additional atypical IPAN types, including ENC7. A plausible alternative role of ENC7 is viscerofugal, as CCK expression is associated with this neuron type in the guinea pig.3 Our molecular classification of motor neurons is in agreement with the previous major division into inhibitory and excitatory types3, and we also identified plausible subtypes (ENC1-3 and ENC8-9, respectively). ENC5 and ENC10 were assigned as suggested interneurons, but knowledge of these neuron types is limited. ENC4 and 11 appeared as rare neuron types with unique expression patterns. Further functional dissections of these four classes could be aided by transgenic mice driven by herein identified marker genes. 5-HT was associated with several morphological types within the heterogeneous ENC12 class (Extended Data Fig. 6b), possibly reflecting additional functions beyond interneurons, as recently suggested.35 Note also that enteric neuron identities may be different at other regions including the stomach.
A novel model for cell diversification in the developing ENS
Although cell proliferation, migration and survival are well understood processes within the developing ENS12, neuronal diversification has received little attention17,36. In contrast, gene regulatory programs driving neuronal subtype differentiation in the developing CNS have been comprehensively resolved.37 This lag of knowledge in ENS development may stem from the fundamentally different ways in which these nervous systems are formed. In the neural tube, the differentiation of committed progenitors into specified neuron subtypes occurs at stereotypical positions (Fig. 8a), making studies of gene regulatory networks attainable.14 In the developing gut, progenitor cells and differentiating neurons are intermingled in seemingly stochastic manners, and the motile behavior of progenitors38 is likely to perturb morphogens to set up stable differentiation programs based on position. Instead, a temporal mechanism has been the suggested dominant mode of specification within the developing ENS. Birth-dating studies signify that the neurogenic peak of different neurons occurs at different developmental timepoints.15,16 The present study puts forward a new model of enteric neuron specification (Fig. 8b). We show that primitive features of only two subsets of enteric neuron subclasses (ENC1 and ENC8) are generated as dividing progenitors undergo neurogenesis. Subsequent identity conversions appear to underlie formation of ENC2-7 and ENC9-12. Thus, the twelve ENCs are generated from an initial binary difference, which become further diversified at the post-mitotic state. In support, neurons start expressing CGRP and 5-HT, here mapped to ENC6 and ENC12 (Figs. 3, 4a), 4-6 days (E17-18)36 after they are born16. Furthermore, neurons labelled between E11.5 and E16.5 have single long processes39, indicating that Dogiel Type II neurons (ENC6) develop at later stages. A sequential differentiation process within already post-mitotic neurons was also indicated by our previous gene expression resource of the developing ENS17, which showed a greater diversity of transcription and signaling factors in neurons than in dividing progenitors. The developing ENS thus relies on flexible postnatal neurons, a principle that might explain how neuronal complexity can be formed without spatially defined stem cell populations and during a protracted time (until P30)40.
Figure 8. Schematic representation of the major principle of neuronal diversification in the developing CNS versus ENS.
a) Progenitor cells within the neural tube are patterned according to their position within the coordinates of morphogenetic cues. The transcription factor codes (depicted by different colors) of each progenitor is decoded into different neuron class identities at neurogenesis. Further maturation leads to neuronal heterogeneity within each major neuron class. Temporal specification mechanisms (important in telencephalon and ventral myelencephalon) are not accounted for here. b) In contrast to progenitors within the neural tube, ENS progenitor cells are migratory and therefore lack distinct positional identities. A binary heterogeneity is apparent in neuroblasts undergoing their last cell cycle, resulting in post-mitotic neurons with traits of ENC1 or ENC8. Immature neurons either differentiate into these prototypic classes, or differentiate further in a gradual diversification process where the initial features are downregulated and replaced by other transcriptional programs generating ENC2-7 and ENC9-12. Picture depicts the plausible branching process, but future interrogation is needed to resolve the trajectory of each ENC in detail. CNS: Central Nervous System; ENS: Enteric Nervous System; ENC: Enteric Neuron Class.
The two major branch identities must, however, already be segregated in progenitors undergoing their last cell-cycle, as a previous Confetti-based lineage-tracing study showed that clones consisting of 2-4 cells, traced at E12.5 and analyzed in adulthood, never contained both NOS1+ (ENC8-10; Branch A) and CALR+ (ENC1,2,5,6; Branch B) neurons.33 The subsequent conversions of ENC1 or ENC8 traits are associated with switching of a number of critical phenotypic genes. As part of the ENC8/9 to ENC12 conversion, Nos1/Gal/Vip is suppressed and Calb1 is upregulated, a process critically dependent on PBX3. Transient expression of NOS1 is supported by an earlier study which determined that the birth-wave of NOS1+ neurons commence at E12.5, although NOS1+ neurons already can be observed at E11.5.16 Thus, even though ENC8/9 and ENC12 are generated from the same birth branch, ENC12 could represent neurons that are born at early developmental time points and switch class, while later born neurons retain their ENC8/9 identity. Such model would make our data consistent with studies showing a correlation between birth date and cell identity15,16. Like most studies on ENS development, we focused on the small intestine and cannot rule out that other principles might prevail at other gut regions.
Impact on future regenerative medicine for enteric neuropathies
Several primary enteric neuropathies mainly affect NOS1+ neurons including esophageal achalasia and hypertrophic pyloric stenosis. NOS1+ neurons are also damaged in Chagas disease and diabetic gastroparesis.8,9 These neurons may be especially susceptible to damage due to the reaction between free radical nitric oxide and reactive oxygen species in stressed tissue.9 Esophageal achalasia has been pointed out as plausible first disease for cell-based therapies as its neural deficit is well defined within a small tissue area.11 Our study provides knowledge that could aid in the specific engineering of nitrergic neurons including the embryonic generation of nitrergic motor neurons (ENC8/9), early nitrergic marker genes and a negative transcriptional regulator (PBX3). The identified neurogenic program could further aid in efforts to convert enteric glia to neurons. Thus, with further functional interrogation of the herein identified transcription factors, selective production of NOS1+ neurons is likely conceivable following the same principle used to make various types of brain neurons41,42.
Methods
Mice
The generation of the Baf53b-Cre 19 (JAX, #027826), Cck-Ires-Cre 43 (JAX, #12706), Nmu-Cre (MMMRC, 036643-UCD), and Wnt1-Cre 44 mouse strains have been previously described. Strains were crossed with Ai14 45 (R26RTomato; JAX #007908). Pbx3+/- mice were kindly provided by C. Villaescusa (Karolinska Institutet) and have been described34. Pbx3+/- and Baf53b-Cre mice were kept on a C57BL/6 background. Animals were group-housed, with food and water ad libitum, under 12-h light-dark cycle conditions, 22°C ambient temperature and 50% humidity. Animal experiments were approved by the local ethics committee in northern Stockholm (Stockholm Norra djurfo?rso?ksetiska na?mnd, Jordbruksverket) (N87/13 and 5264/18).
Tissue preparation for single cell RNA sequencing
Juvenile tissue preparation
A total of four Baf53b-Cre;R26RTomato mice (2 females, 2 males), postnatal day (P)21, were used for single cell RNA-sequencing. During all stages of the dissociation protocol, the tissue was kept in dissection solution: TRIS-HEPES recovery solution containing 76 mM Tris HCl, 19.5 mM Tris Base, 2.5 mM KCl, 1.2 mM NaH2PO4, 30 mM NaHCO3, 20 mM glucose, 5 mM sodium ascorbate, 3 mM sodium pyruvate, 0.5 mM CaCl2 and 10 MgSO4 (pH 7.3-7.4). The dissection solution was equilibrated in 95% O2, 5% CO2 for 30 min before the start of the experiment and held on ice at all steps. The dissected small intestines were cut in 5 cm pieces and each segment flushed inside with ice-cold dissection solution. The mesentery was removed and intestine pieces opened lengthwise along the mesenteric border. The tissue pieces were pinned with the mucosa side down on a Sylgaard (Dow Corning) covered dissection dish on top of an ice-block. The smooth muscle layers, containing the myenteric plexus were peeled off from the submucosa using watchmaker forceps and stored in dissection solution on ice until all pieces were peeled. Peels were cut in 2-5 mm2 pieces and placed in 5 ml digestion solution (0.75 mg/ml Liberase TH Research grade (Roche), 0.1 mg/ml DNAseI (Sigma-Aldrich) and 25U/ml Dispase (Corning)) in DMEM/F12 at 37°C for 30 minutes, with gentle shaking of the tube every 10 min. After completed digestion, enzyme mixture was replaced with 2.5% bovine serum albumin (BSA; Sigma-Aldrich), 5mM EDTA in ice-cold DMEM/F12. Tissue pieces were triturated using three fire-polished Pasteur pipettes with decreasing opening size (from ~70% to 10% of the original opening size) that had been coated with 1% BSA solution, and then filtered through a DMEM/F12-equilibrated 30 μm cell strainer (Miltenyi Biotec). Single cells were collected by centrifugation at 120g for 5 min at 4°C. The pellet was resuspended in 2 ml DPBS solution, 1% BSA and 1% DRAQ7 (Biostatus). Tomato+ cells were sorted by flow cytometry (see Supplementary Fig. 6 for representative plots) on a BD Influx™ cell sorter and collected in ice-cold PBS containing 0.04% BSA. 2,91% of total singlets were captured (45 631 cells) and used for single cell RNA-sequencing. The gating of cells was performed on BD FACS Software v. 1.0.0.650.
Embryonic tissue preparation
Embryonic day (E) 0,5 was considered when vaginal plug was seen in female mice. Wnt1-Cre;R26Tomato were used for single cell RNA sequencing experiments. In total 5 and 3 embryos at E15.5 and E18.5 respectively, were used and for each developmental stage the small intestines were pooled. During all stages of the dissociation protocol the tissue was kept in DMEM/F12 medium (Invitrogen) on ice, except where mentioned otherwise. Dissection steps were carried out under a stereo microscope. The mesentery was removed, the small intestines were cut into 2-5mm2 pieces and put into digestion solution (0.75mg/ml Liberase TH Research Grade (Roche), 12 U/ml Dispase, 0.1mg/ml and DNAseI (Sigma) in DMEM/F12) at 37°C for 10 min (E15.5) or 20 min (E18.5) with shaking every 5 min. The enzyme mixture was replaced with DMEM/F12 medium containing 2% BSA and 5mM EDTA. The cells were then manually triturated using 3 fire-polished Pasteur pipettes with decreasing opening size (from ~70% to 10% of the original opening size) that were previously coated with 1% BSA solution for at least 1h at RT. The single cell suspension was filtered through a DMEM/F12-equilibrated 30μm cell strainer (Miltenyi Biotec) and centrifuged at 120g for 5 min at 4°C. Cells were resuspended in DPBS containing 1% BSA. Tomato+ cells were sorted on a BD Influx™ cell sorter, collected in ice cold PBS containing 0.04% BSA. The gating of cells was performed on BD FACS Software v. 1.0.0.650. 23,62% and 11,84% of singlets were captured at E15.5 and E18.5, respectively (see Supplementary Fig. 6 for representative plots). Single cell solutions were passed on for single cell RNA sequencing analysis.
Single cell RNA-sequencing
The sampling was carried out with 10x Genomics Chromium Single Cell Kit (10x Genomics, CA, USA) Version 2 (embryonic cells) and Version 3 (juvenile cells) at the Eukaryotic Single Cell Genomics (ESCG), Stockholm, Sweden. Cell suspensions were adjusted to 500-1000 cells/μl, and added to 10x Chromium RT mix to achieve loading target numbers between 2500-8000 cells. The manufacturer’s instructions were followed for downstream cDNA synthesis, library preparation, and sequencing (Novaseq S1 reagent kit; 100 cycles) using the Novaseq 6000 platform (Illumina). Cellranger version 2.1.1 was used for E15.5 and E18.5 datasets, and Cellranger version version 3.0.1 was used for P21 dataset.
Virally-mediated neuron labelling
ssAAV-PHP.S/2-shortCAG-dlox-EYFP(rev)-dlox-WPRE-hGHp(A) (abbreviated as PHP.S-DIO-EYFP) and ssAAV-PHP.S/2-shortCAG-dlox-mRuby3(rev)-dlox-WPRE-hGHp(A) (abbreviated as PHP.S-DIO-mRuby3) were constructed at the Viral Vector Facility (VVF) of the Neuroscience Center Zurich (ZNZ) (# v309-PHP.S and v378-PHP.S respectively) using Addgene plasmids pUCmini-iCAP-PHP.S (#103006) and pAAV-CAG-DIO-EYFP (#104052). Procedure was performed as described.29 Cck-Ires-Cre were injected intravenously into the tail with 5.7*1011 viral dose. Animals were sacrificed 2-3 weeks after injection and tissue analyzed.
Tissue preparation for immunofluorescence (IF) analysis
Juvenile and adult small intestine sections
P21-90 small intestine was dissected, mesentery removed, and duodenum, jejunum and ileum separated. Intestinal pieces were flushed clean with ice-cold PBS and fixed overnight in 4% paraformaldehyde (PFA) in PBS at 4°C. Some tissue was prepared as swiss-rolls.46 Briefly, the opened tissue pieces were placed flat, mucosa side down on the bottom of an empty petri dish. A toothpick was placed at one end and the tissue was rolled up to form a roll. The rolls were pinned to a Sylgaard-covered dissection dish and fixed in 4% PFA at 4°C over-night. Tissues were then washed three times with PBS and incubated in 30% sucrose in PBS overnight at 4 °C and embedded in O.C.T. (Histolab, Leiden, The Netherlands), snap frozen and stored at −80 °C. The tissue was cut at 14 μm (20 μm for RNAscope ®) and kept at −20 °C until use.
Adult myenteric plexus peels
Duodenum, jejunum and ileum intestinal segments from P21-90 mice were cleaned of mesentery and opened lengthwise along the mesenteric border. The intestinal contents were rinsed out with ice-cold PBS. The tissue was stretched and pinned with the mucosa side down on a Sylgaard-covered dissection dish and fixed in 4% PFA at 4°C overnight. Tissue was then washed three times with PBS, longitudinal muscle-myenteric plexus-circular muscle layer peeled off (myenteric peels), cut into 1 cm2 segments and stained directly or stored in 100% methanol at -20°C. In some cases, stretched fresh tissue was cultured overnight in DMEM (ThermoFisher) containing 10% heat-inactivated fetal bovine serum (ThermoFisher), 100 U/ml penicillin (ThermoFisher), 100 ug/ml streptomycin (ThermoFisher) and 0.1 mg/ml colchicine (Sigma). Thereafter, myenteric peels were prepared as above.
Embryonic tissue
Guts from E15.5 and E18.5 embryos were dissected out and fixed in 4% PFA in PBS at 4°C for 2h. Samples were subsequently washed in PBS and cryoprotected in 30% sucrose in PBS at 4°C overnight. The tissue was then embedded in O.C.T. and frozen at -80°C. Samples were sectioned at 12-14 μm, dried at RT (room temperature) for 1h and further processed for IF or frozen at -20°C.
Immunofluorescence analysis
Frozen tissue sections (juvenile and embryonic) were air dried at RT for 1 hour, rinsed with PBS and incubated in blocking solution containing purified donkey anti-mouse Fab (Jackson, #715-007-003) diluted 1:50 in PBS for 1 hour at RT. Sections were then blocked with 2% normal donkey serum (NDS, Jackson) and 0,1% Triton X-100 (Sigma) in PBS for 1 hour and incubated with primary antibodies diluted in the same solution overnight at 4°C. They were then washed 3 times with PBS (10 minutes each) and incubated with secondary antibodies at RT for 1 hour. Tissue was washed 3 times with PBS (10 minutes each) and mounted in DAKO mounting medium (Agilent) containing DAPI.
Myenteric peels were incubated in blocking solution containing purified donkey anti-mouse Fab diluted 1:50 in PBS and 0,3% Triton X-100 overnight at 4°C. The blocking solution was replaced by the incubation buffer containing 2% NDS, 1% BSA and 0,3% Triton X-100 in PBS for 8 hours at 4°C. The tissue was incubated in primary antibodies diluted in the incubation buffer for 48 hours 4°C, washed 3 times with PBS (30 minutes each) and then placed in the secondary antibodies diluted in the incubation buffer for 2 hours at RT. The tissue was washed 3 times with PBS (15 minutes each) and mounted on glass slides using DAKO mounting medium containing DAPI. For a complete list of primary and secondary antibodies, see Supplementary Table 2.
EdU labelling
Time plug-mated Pbx3-/- mice received a single intraperitoneal injection of 5-ethynyl-2’-deoxyuridine (EdU; 0,1mg/g animal; Invitrogen) at E15.5. Mice were sacrificed 90 min after injection. Embryos were prepared for immunohistochemistry as described above. Tissue sections were first immuno-stained for SOX10 and then reacted for EdU using the Click iT® EdU Alexa Fluor ® 488 Imaging kit (Invitrogen). After 20 minutes slides were washed in PBS and mounted.
RNAscope®
RNAscope® was performed according to manufacturer’s instructions (RNAscope® Multiplex Fluorescent Reagent Kit v2 Assay) on 20μm sections. Protease III was used for tissue digestion. The following probes were used for the analysis: Mm-Nmu-C3 (Ref 446831) and Mm-Cck-C2 and -C3 (Ref 402271). Immunohistochemistry (as described above) was applied after completion of RNAscope®.
Imaging
Imaging of single plane or z-stacks was performed using Zeiss LSM700 or LSM800 confocal microscopes (Oberkochen, Germany) using Zeiss ZEN 2010 software, and processed in Fiji image analysis software (version 2.0.0-rc-69/1.52i) (National Institutes of Health, Bethesda, MD). Color was in some cases changed and each channel was individually adjusted.
Cell counting, statistical analysis and reproducibility
Counting of fluorescent cells was performed using the “Cell Counter” plugin in ImageJ or directly under a Zeiss fluorescent microscope. GraphPad Prism (version 8.4.1) was used to generate bar and box-and-whisker plots. In all graphs, error bars indicate mean ± Standard Deviation of the Mean (SD). Figure 4: Number of cells expressing various markers in myenteric peel preparations (approximately 1 cm2 pieces) were counted from at least 3 animals. Percent expression was calculated on the combined jejunum and ileum counts. Cell sizes were measured on z-stack images. Two-sided student’s t-test was used for statistical analysis. Figure 7: Since the number of neurons can vary greatly between sections, we calculated the percentage of total neurons expressing a certain marker (Marker+ neurons) combining several sections. The ratio between the percentage Marker+ neurons in the mutant and that in the control is presented with the control normalized to 1. A minimum of 3 sections was investigated per region of the gut in mutant and littermate WT embryos. Two-sided Paired Student’s t test comparisons were performed for statistical examinations. Extended Data Fig. 3q: Quantification of ENC proportions was performed in C57BL/6 mice at 9-12 weeks (both females and males) using HUC/D or PGP9.5 for total neuron counts. For each ENC quantification, a minimum of 550 neurons/animal in sections and 1500 neurons/animal in peels, were assessed. The following specific markers were used: ENC2-3: SUBP+/CALR-; ENC5: SST+; ENC6: Nmu + - (RNAscope, sections); ENC7: Cck + (RNAscope, sections); ENC8-10: NOS1+; ENC11: NPY+/NOS1- ENC12: CALB+/NTNG1+. For ENC1/2, we counted the total ratio of CALR+ neurons, and deducted the mean percentages for ENC5, ENC11 and CALR+ ENC12 (64,6% ± 15,3). This percentage of CALR+ ENC12 was determined by counting the proportion of Nmu + neurons expressing CALR (n=423 Nmu + neurons, combined from duodenum, jejunum and ileum in 3 animals). Extended Data Fig. 5: The number of Reporter+ / RNA+ cells was evaluated in 20μm sections from jejunum and ileum of 3 animals. Both myenteric and submucosal Nmu+ neurons were counted. Marker+ cells in Figure 3 and Extended Data Fig. 3a-o and 5a-c are representative out of many more cells in at least two animals. Note that detailed statistics for many markers in Figure 3 are shown in Extended Data Fig. 3q. No statistical methods were used to pre-determine sample sizes but our sample sizes are similar to those reported in previous publications.17,47 Animals from different litters were used for repeat experiments to avoid confounding. Data collection and analysis were not performed blind to the conditions of the experiments. Samples with poor immunohistochemical staining quality were excluded from further analysis. Apparent unhealthy enteric ganglia (e.g. nuclear HUC/D staining) were excluded in neuron quantifications. Data distribution was assumed to be normal but this was not formally tested.
Analysis of single cell RNA-sequencing data
Clustering analysis
To identify molecularly distinct cell types in juvenile (P21) dataset, we classified the cells into transcriptionally similar clusters. We filtered 9,141 starting cells based on three quality control (QC) covariates: the number of UMI counts per cell, the number of genes per cell and the fraction of counts from mitochondrial genes per cell (Extended Data Fig. 1a). Cells with <1,500 genes or >8,000 genes are removed. To mitigate potential doublets, we also excluded cells with >60,000 UMI counts. Of the remaining cells we further removed cells with the fraction of counts from mitochondrial genes <0.1 (for cells with <4000 genes) and <0.25 (for cells with >4000 genes) to account for injured cells. Downstream analysis was performed using the R package Seurat version 3.1.4.48 Briefly, we normalized the expression data using regularized negative binomial regression method49 implemented in the SCTransform() function while regressing out contribution from mitochondrial gene counts, retaining 3,000 variable genes. Prominent sex specific genes (Xist, Gm13305, Tsix, Eif253y, Ddx3y, Uty) and a set of immediate early genes (Fos, Jun, Junb, Egr1) were removed from variable genes before principal component (PC) analysis. We then performed preliminary clustering with permissive parameters to identify and removed cluster that are of low quality and are non-enteric. At this level, we constructed K-nearest neighbour graph based on Euclidian distance in 50 principal components (PCs) space and identified distinct communities of cells using Leiden algorithm (res. = 1.5; version 0.3.3). We removed clusters that shows both high Plp1 and high Elavl4 as they likely represented neuron-glia contamination, and clusters that have low UMI counts per cells, low genes per cell and high fraction of mitochondrial genes, as the indication of low quality cells. The remaining cells were subject to second level clustering (35 PCs, res. = 1.0), yielding a clear separation of enteric glia and enteric neuron clusters. Only neuron clusters (4,892 cells in total) were retained for third level clustering (30 PCs, res. = 0.4), yielding 12 final neuron clusters. The clusters were visualized on two dimensional using the RunUMAP() function (min.dist = 0.5, n_neighbors = 30L, umap.method = “umap-learn”, metric = “correlation”).
For embryonic datasets, we employed a similar approach, but with dataset-specific parameters and Louvain algorithm for clustering. We obtained 3,468 cells from E15.5. After removing cells with <1,000 genes or >6,000, with >40,000 UMI counts (to mitigate potential doublets), and with > 0.05 fraction of mitochondrial genes, we retained 3,260 cells for first level clustering (50 PCs, res. = 0.8). At this step, we removed one non-enteric cluster. The remaining cells were then subject to second level clustering (30 PCs, res. = 0.9), yielding 13 clusters. Similarly, of 2,996 stating cells from E18.5, we removed cells with <1,000 genes or >8,000, with >40,000 UMI counts, and with > 0.1 fraction of mitochondrial genes, yielding 2,733 remaining cells. We removed one non-enteric clusters at first level clustering (50 PCs, res. = 0.8). After second level clustering (30PCs, res. = 0.9), we obtained 15 clusters. We then performed differential expression analysis and, based on differential expressed genes, categorized each cluster as one of the following major cell types: neuron (Elavl4, Tubb3), neuroblast (Ascl1), progenitor (Sox10), enteric glia (S100b, Plp1), and Schwann cell precursor cells (high Plp1, Dhh). Clusters considered to share generic state were merged before re-analyzing differential expression to identify broad gene modules (Fig. 5; Extended Data Fig. 7). The clusters were visualized on two dimensional using the RunUMAP() function (for E15.5: min.dist = 0.48, n_neighbors = 69L, umap.method = “umap-learn”, metric = “correlation”; for E18.5: min.dist = 0.5, n_neighbors = 49L, umap.method = “umap-learn”, metric = “correlation”).
Differential expression analysis
To identify cluster-enriched genes, we performed non-parametric Wilcoxon rank sum test for cells in each cluster compared to all other cells. p-values were adjusted based on Bonferroni correction, giving false discovery rate (FDR). Genes with FDR <0.01, at least 0.25 average fold change (log-scale) and at least 25% cluster-specific detection (percent of cells expressing a particular gene in a cluster) were defined as enriched genes for each cluster. Top genes were then scrutinized in order of average fold change (log-scale).
Supervised cell type assignment
We used the hierarchical statistical framework CellAssign 50 (version 0.99.12) to compute the probability that each cell belongs to a cell type defined by a set of know makers genes. We used priori makers information gathered from previous studies. The curated markers were converted to binary codes before being used as an input to the model. Cell specific size factors were computed from the sizeFactor() function of the R package scarn (version 1.12.1). Individual cells were annotated to the cell type with maximum probability. For Fig. 1d and 1e, the following priori markers were used; Elavl4, Tubb3, Stmn2, Snap25 (enteric neuron); Sox10, Plp1, S100b (enteric glia); Ube2c, Top2a, Cenpef (cycling); Actg2, Mylk (smooth muscle). For presentation, we combined cells assigned to “cycling”, “smooth muscle” and “unassigned” to a new group, “Other”. Also note that, for comparison of cell types obtained from Wnt1Cre;R26Tomato and Baf53bCre;R26Tomato experiments (Fig. 1e), we applied the same permissive pre-processing thresholding (UMI counts > 600) for both datasets. For Fig. 1i and 1j, priori markers were curated based on a series of immunohistochemical studies on the mouse small intestine.4–6 The following markers were used: Calca, Calcb, Chat, Slc18a3, Nefm, Calb1, Calb2 (IPAN); Chat, Slc18a3, Calb2, Tac1 (excitatory motor neuron); Nos1, Vip, Npy (inhibitory motor neuron); Chat, Slc18a3, Nos1, Vip (interneuron 1); Chat, Slc8a3, Calb2, Sst (interneuron 2); Chat, Slc18a3, Ddc, Slc6a4 (interneuron 3). For sex inference in Extended Data Fig. 1d and e, we used the following priori markers: Xist (female), and Eif2s3y, Ddx3y and Kdm5d (male).
Cell cycle assignment
For each cell, we computed a score based on its expression of G2/M and S phase markers; cells that express neither of these markers are likely not cycling or are in G0/G1 phase. The scoring strategy is described in Tirosh et al. 2016.51 We used Seurat’s implementation of this strategy in the CellCycleScoring() function.
Label transfer
For comparison of our newly proposed enteric neuron clusters to our previously reported ones (Extended Data Fig. 1c), we used expression data and cluster identities of enteric neurons at level L6 which can be found at http://mousebrain.org. The accession number for raw sequence data from Wnt1Cre;R26RTomato P21,23 animals is SRP135960, available at https://www.ncbi.nlm.nih.gov/sra/SRP135960). Both datasets (Wnt1Cre;R26RTomato and Baf53bCre;R26RTomato) were subjected to the same pre-processing steps using regularized negative binomial regression method49, while retaining original cluster identities, before undergoing Seurat’s label transfer52, using the FindTransferAnchors() function with 30 PCs and then the TransferData() function with Baf53bCre;R26Tomato dataset as the reference dataset. Finally, the mapping identities were presented as Alluvial plot using the R package ggalluvial (version 0.11.1).
For mapping of juvenile cell types to embryonic datasets (Fig. 6a,b), we employed similar approach as mentioned above. We compiled a juvenile reference dataset by combining enteric neurons from third level clustering (retaining their ENC1-12 identities) with enteric glial cells from second level clustering (removing cells with high expression of Elavl4 and Tubb3, and merging all subclasses to ‘enteric glia’), giving a total of 13 class identities (12 ENCs and enteric glia). Here, we used 30 PCs for mapping of E15.5 dataset and 40 PCs for mapping of E18.5 dataset. Only cells with >0.5 maximum prediction score were mapped.
Computational screening of HGNC gene sets
To assess whether given gene sets can explain heterogeneity within the 12 ENCs, we performed a computational screening as previously described20, which is based on the MetaNeighbor (version 1.4.0.1) method.53 In brief, we defined a Spearmann correlation subnetwork of cells in our dataset by their expression of a given gene set, and performed a stratified cross-validation. In doing so, we divided our dataset into test and train sets and then held back cluster identity from one set at a time and predicted based on the other. The efficacy of cells of the same cluster were recovered for each cluster and reported as the area under the receiver operator characteristic curve (AUROC). We then ranked the gene sets by the mean AUROC. We perform this test on HGNC54 (HUGO Gene Nomenclature Committee) families curated by Paul et al. 201720, selecting only gene sets with more than three detectable genes.
Partition-based graph abstraction and pseudotime analysis
We used partitioned-based graph abstraction (PAGA) for interring developmental trajectories.55 We found this approach most suitable with our developmental datasets which consist of both cycling and branching topology. We used cluster identities from Louvain algorithm (as mentioned above) to define partitions of the graph of neighborhood relation among data points. PAGA was computed using the tl.paga() function implemented in the Python package Scanpy 1.4.5 post3.56 For pseudotime inference, we employed diffusion pseudotime method which infers progression of cells through geodesic distance along the graph.57 We used Scanpy’s tl.dpt(), setting the root at the cluster that most likely correspond to neuroblast, and the number of diffusion components to 10. Together with PAGA, which allowed detection of Branches, we were able to define developmental paths within each developmental dataset. Cells were then re-ordered within each path before plotting gene expression (Fig. 6h).
Gene pattern discovery
To find coordinated gene patterns, we performed non-negative matrix factorization (NMF) on E15.5 and E18.5 datasets using the R package CoGAPS version 3.4.1.58 In brief, CoGAPS decomposes this expression matrix into the amplitude matrix (A) and the pattern matrix (P). The rows of A and columns of P quantify the sources of variation among the genes and the cells, respectively. Each column of A and the corresponding row of P represent distinct sources of biological (or technical) variation in each cell. We constructed the ‘counts’ matrix of 3000 high variable genes, excluding prominent sex specific genes (Xist, Gm13305, Tsix, Eif253y, Ddx3y, Uty) and a set of immediate early genes (Fos, Jun, Junb, Egr1), before decomposing it using the CoGAPS() function (nPatterns = 7, nIterations = 1000). The PatternMarker statistics was computed as previously described.59 The list of pattern markers was manually curated, together with differentially expressed genes from cluster analysis, to infer plausible biological processes represented by each pattern.
RNA velocity
We predicted the direction of transcriptional changes in the E15.5 and E18.5 datasets using the RNA velocity framework, which estimates the gene expression dynamics from exonic and intronic expression.60 We first annotated spliced, unspliced and spaning reads using the run10x command (velocyto.py). Genes were filtered based on average expression per cluster retaining ones with > 0.5 (for spliced) and > 0.05 (for unsliced). RNA velocities were then predicted using the gene-relative model implemented in the R package velocyto.R (version 0.6) with the k.nearest cell pooling = 10 (for E15.5) or 50 (for E18.5), fit.qualtile = 0.02, and deltaT = 1). To improve the estimates, we took cell-cell distance from Seurat’s processing steps, instead of using the velocyto.R’s default whole-transcriptome correlation distance. We represented RNA velocity estimated on UMAP with a regular grid coordinated (scale = ‘sqrt’). The direction of the arrows denotes the estimated future state of the current cells. Long arrows correspond to large gene expression changes and thus can intuitively imply that cells are undergoing rapid differentiation. While the lengths of arrows in low-dimensional representation such as UMAP need to be interpreted with caution, they are likely biologically meaningful.
Extended Data
Extended Data Fig. 1. Supportive Data related to Figure 1d-g.
a) Frequency distribution of the number of UMIs, detected genes and percent of mitochondrial genes per cell. Orange bars indicate proportion of cells passing the thresholding for each parameter. b) Box plots showing number of UMIs, detected genes and percent of mitochondrial genes per cell for each of the ENCs. Box-and-whisker plots indicate max-min (whiskers), 25-75 percentile (boxes) with median as a centre line. Points indicate outliers. c) UMAP depicting inferred female (Xist) and male (Eif2s3y, Ddx3y, Kdm5) cells. Pie-chart showing proportions of male and female cells (2:3 ratio). d) Bar-graph showing fraction of male and female cells in each ENC after normalized by total number of cells from each sex and scaled to 1. e) Label transfer relationship between previously proposed enteric neuron types (ENT)1-9 in Zeisel et al., 201818 and ENC1-12 presented in this study. Notably, ENC5 (Sst) and ENC11 (Npy/Th/Dbh) represent new clusters. ENT-clusters representing plausible excitatory (ENT4-6) and inhibitory (ENT2,3) motor neurons were not retained, but distributed into ENC1-4 and ENC8-9, respectively. UMI: Unique Molecular Identifier; ENT: Enteric Neuron Type; ENC: Enteric Neuron Class; UMAP: Uniform Manifold Approximation and Projection.
Extended Data Fig. 2. Supportive data related to Figure 1h-j.
a) Feature plots related to Tac1+ clusters (ENC1-4). A gene set including Calb2 and stronger Ndufa4l2 demarcated ENC1-2 from ENC3-4, while Gda and Penk expression discriminated ENC2-4 from ENC1. ENC4 resembled ENC3, but displayed a unique expression of Fucosyltransferase 9 (Fut9) and the transcription factor Nfatc1. b) Feature plots related to Rprml+ clusters (ENC8-11). c) Heatmap representing CellAssign score for each cell (columns) to each functional type (rows). d) Rare cells assigned with maximum likelihood to interneuron 3 (IN_3, serotonin-producing), presented on UMAP. e) Feature plots displaying expression of genes correlated to serotonin production (Ddc) and re-uptake (Slc6a4) in ENC12.
Extended Data Fig. 3. Negative markers for ENC1-12, summary table of validated ENC markers and ENC proportions across the small intestine.
a-o) Immunohistochemical validation of negative marker proteins. Pictures show either myenteric peel preparations or transverse sections at P21-P90. white arrow: positive marker; yellow arrow: negative marker. Scale bars indicate 20mm. p) Table summarizing ENC markers verified by immunohistochemistry (unique markers in bold) q) Graphs indicating proportions of ENCs at week 9-12 (n=3-4 mice) using HUC/D or PGP9.5 for total neuron counts. ENC1-2 was calculated by subtracting CALR+ ENC6, ENC5 and ENC11 percentages from the average total CALR+ neurons. Note the much higher proportion of ENC6 in tissue, than in scRNA-seq data, reflecting the difficulties in isolating big size neurons from tissue. Graph with all ENCs in ileum was normalized to 100% (absolute value 102,6%). Data are presented as mean values ± SD.
Extended Data Fig. 4. Schematic tables summarizing marker and ligand/receptor gene expression in each ENC.
We combined information gained from RNA-sequencing (Fig. 1 and Supplementary Fig. 2), immunohistochemical analysis (Fig. 3) and transgenic mice (Fig. 4) to make a reasonable representation of gene expression patterns of a) marker genes b) ligand/receptors in the ENCs. (ligand): refers to genes required for the production of a ligand, including enzymes. ENC: Enteric Neuron Class
Extended Data Fig. 5. Validation of Cre mouse lines for the investigation of ENC6 and ENC7.
a) Myenteric plexus peel from Nmu-Cre;R26R-Tom mouse showing TOM in HUC/D+ neurons (stars) and its exclusion from enteric glia (SOX2+). b) Myenteric plexus peel from Cck-IRES-Cre;R26-Tom mouse showing TOM in both neurons (stars) and enteric glia (stars). c) Myenteric plexus peel of Cck-IRES-Cre mouse injected with AAV-DIO-Ruby3 showing RUBY3 only in neurons and not in glia. d) Transverse sections showing that Nmu and Cck RNA expression correlate with reporter+ neurons in Nmu-Cre;R26R-Tom and Cck-IRES-Cre; AAV-DIO-EYFP/Ruby3 animals. e) Graph showing the percentage of reporter+ neurons expressing the reciprocal RNA. Data are presented as mean values ± SD. A total of 638 reporter+ neurons were investigated in three Nmu-Cre;R26R-Tom mice, and 71 reporter+ neurons were investigated in three Cck-IRES-Cre;AAV-DIO-EYFP/Ruby3 mice. TOM: dtTomato. Scale bars indicate 50μm.
Extended Data Fig. 6. Morphological characterization of ENC6, 7, 12 and 5-HT+ ENC12.
Related to Fig. 4e-g. A) Representative examples of each morphological type found within ENC6, 7 and 12 and their size. B) Representative examples of each morphological type and their relative proportion (n=90 neurons from 5 animals) within jejunum and ileum of 5-HT+ ENC12. Scale bars indicates 20μm. Data are presented as mean values ± SD.
Extended Data Fig. 7. Supportive data related to Figure 5a,b .
a-b) Frequency distribution of the number of UMIs, detected genes and percent of mitochondrial genes per cell in E15.5 (a) and E18.5 (b) datasets. Orange bars represent cells that pass the thresholding for each parameter. c-d) Boxplots showing normalized expression (log scale) of known cell state genes: Sox10 (progenitor), Ascl1 (neuroblast), Elavl4 (enteric neuron), Plp1 (Enteric glia) and Dhh (SCP), grouped by Louvian clusters for E15.5 (c) and E18.5 (d). Box-and-whisker plots indicate max-min (whiskers), 25-75 percentile (boxes) with median as a centre line. Points indicate outliers. e-f) Refined clusters on UMAP for E15.5 (e) and E18.5 (f). Clusters in the same state were merged to obtain the generic ENS state clusters shown in Figure 5a,b. UMI: Unique Molecular Identifier; SCP: Schwann cell precursor; E: Embryonic day; UMAP: Uniform Manifold Approximation and Projection; MT: Mitochondrial
Extended Data Fig. 8. Feature plots displaying expression of Notch signaling genes at E18.5.
Related to Figure 5.
a) Ligands; note the predominant expression of Dll1 and Dll3 in neuroblasts
b) Receptors; note the predominant expression of Notch1,2 in progenitors.
c) Downstream transcription factor; note the enriched expression of Hes6 in neuroblasts, Hes1 in progenitors and Hes5, Heyl and Hey2 in enteric glia.
d) Regulator of activity; note the enriched expression of Mfng in neuroblasts and Lfng in progenitors. Color bar indicate expression level with maximum cut off at the 90th percentile.
Extended Data Fig. 9. Feature plots displaying transcription factors associated with generic cell states of the ENS at E15.5.
Related to Figure 5f-h. a) progenitors, b) neuroblasts and c) neurons. Color bar indicate expression level with maximum cut-off at the 90th percentile.
Extended Data Fig. 10. Supportive data related to Figure 6f.
a) TFs expressed in one or few ENCs that correlated well with juvenile expression (exception in a’).
b) TFs with broad ENC-specific expression that correlated well with juvenile expression (exception in b’).
c) TFs only expressed at embryonic stages, and not maintained in juvenile ENCs.
d) TFs with wide expression, including bona fide ENS markers Hand2 and Phox2b. See Supplementary Figure 2c to compare with the gene expressions in juvenile ENCs. Color bar indicate expression level with maximum cut off at the 90th percentile.
Supplementary Material
Acknowledgements
Cell sampling was performed at the Eukaryotic Single-cell Genomics core facility at Science for Life Laboratory, Sweden, funded by the Swedish Research Council. The authors acknowledge support from Science for Life Laboratory, the Knut and Alice Wallenberg Foundation, the National Genomics Infrastructure funded by the Swedish Research Council, and Uppsala Multidisciplinary Center for Advanced Computational Science for assistance with massively parallel sequencing and access to the UPPMAX computational infrastructure. U.M was supported by The Swedish Research Council (Vetenskapsrådet; 2016-03130), Swedish Medical Society (SLS), Ruth and Richard Julin Foundation, Ollie and Elof Ericssons Foundation, Magnus Bergvall Foundation, Brain Foundation (Hjärnfonden) and Åke Wiberg Foundation. A.M was supported by Wenner-Gren Foundations. F.M was supported by the Brain Foundation (Hjärnfonden). P.E acknowledges ERC (PainCells 740491), The Swedish Research Council, KAW Scholar and project grant, and Wellcome Trust (200183). The imaging was performed in the Biomedicum Imaging Core (BIC) with support from the Karolinska Institutet. We thank the Viral Vector Facility (VVF) of the Neuroscience Center Zurich (ZNZ) for excellent service and construction of AAV-virus vectors. We thank G. Tabacaru for laboratory assistance. We thank C. Villascusa (Karolinska Institutet, SE) for sharing the Pbx3 mutant mice and J. Kaltschmidt (Stanford University, CA, US) for antibodies. We acknowledge J. Frisén and S. Giatrellis for access and assistance with Flow Cytometry.
Footnotes
Author Contributions
Study concept and design: A.M, K.M, V.K and U.M
Acquisition of data: A.M, F.M, K.M, V.K, R.K, W.L and U.M
Analysis and interpretation of data: A.M, F.M, K.M, V.K, R.K, W.L, and U.M
Drafting of Manuscript: A.M, K.M, V.K, P.E and U.M
Obtained Funding: F.M, P.E and U.M
Competing Interests Statement
The authors disclose no conflicts.
Reporting Summary
Further information on research design is available in the Life Sciences Reporting Summary linked to this article.
Data Availability
Raw sequence and processed data are available on the Gene Expression Omnibus (GEO) database under the identifier GSE149524. The data accession number is SRP258962 found at http://ncbi.nlm.nih.gov/sra/SRP258962.
References
- 1.Furness JB. The enteric nervous system and neurogastroenterology. Nat Rev Gastroenterol Hepatol. 2012;9:286–294. doi: 10.1038/nrgastro.2012.32. [DOI] [PubMed] [Google Scholar]
- 2.Veiga-Fernandes H, Pachnis V. Neuroimmune regulation during intestinal development and homeostasis. Nature Immunology. 2017;18:116–122. doi: 10.1038/ni.3634. [DOI] [PubMed] [Google Scholar]
- 3.Furness JB. Types of neurons in the enteric nervous system. J Auton Nerv Syst. 2000;81:87–96. doi: 10.1016/s0165-1838(00)00127-2. [DOI] [PubMed] [Google Scholar]
- 4.Sang Q, Young HM. Chemical coding of neurons in the myenteric plexus and external muscle of the small and large intestine of the mouse. Cell Tissue Res. 1996;284:39–53. doi: 10.1007/s004410050565. [DOI] [PubMed] [Google Scholar]
- 5.Sang Q, Williamson S, Young HM. Projections of chemically identified myenteric neurons of the small and large intestine of the mouse. J Anat. 1997;190:209–222. doi: 10.1046/j.1469-7580.1997.19020209.x. [DOI] [PMC free article] [PubMed] [Google Scholar]
- 6.Qu ZD, et al. Immunohistochemical analysis of neuron types in the mouse small intestine. Cell Tissue Res. 2008;334:147–161. doi: 10.1007/s00441-008-0684-7. [DOI] [PubMed] [Google Scholar]
- 7.Furness JB, Jones C, Nurgali K, Clerc N. Intrinsic primary afferent neurons and nerve circuits within the intestine. Progress in Neurobiology. 2004;72:143–164. doi: 10.1016/j.pneurobio.2003.12.004. [DOI] [PubMed] [Google Scholar]
- 8.Knowles CH, Lindberg G, Panza E, De Giorgio R. New perspectives in the diagnosis and management of enteric neuropathies. Nat Rev Gastroenterol Hepatol. 2013;10:206–218. doi: 10.1038/nrgastro.2013.18. [DOI] [PubMed] [Google Scholar]
- 9.Rivera LR, Poole DP, Thacker M, Furness JB. The involvement of nitric oxide synthase neurons in enteric neuropathies. Neurogastroenterology and Motility. 2011;23:980–988. doi: 10.1111/j.1365-2982.2011.01780.x. [DOI] [PubMed] [Google Scholar]
- 10.Fattahi F, et al. Deriving human ENS lineages for cell therapy and drug discovery in Hirschsprung disease. Nature. 2016;531:105–9. doi: 10.1038/nature16951. [DOI] [PMC free article] [PubMed] [Google Scholar]
- 11.Burns AJ, et al. White paper on guidelines concerning enteric nervous system stem cell therapy for enteric neuropathies. Dev Biol. 2016;417:229–51. doi: 10.1016/j.ydbio.2016.04.001. [DOI] [PMC free article] [PubMed] [Google Scholar]
- 12.Obermayr F, Hotta R, Enomoto H, Young HM. Development and developmental disorders of the enteric nervous system. Nature Reviews Gastroenterology and Hepatology. 2013;10:43–57. doi: 10.1038/nrgastro.2012.234. [DOI] [PubMed] [Google Scholar]
- 13.Uesaka T, Nagashimada M, Enomoto H. Neuronal differentiation in schwann cell lineage underlies postnatal neurogenesis in the enteric nervous system. J Neurosci. 2015;35:9879–9888. doi: 10.1523/JNEUROSCI.1239-15.2015. [DOI] [PMC free article] [PubMed] [Google Scholar]
- 14.Le Dréau G, Martí E. Dorsal-ventral patterning of the neural tube: A tale of three signals. Dev Neurobiol. 2012;72:1471–1481. doi: 10.1002/dneu.22015. [DOI] [PubMed] [Google Scholar]
- 15.Pham TD, Gershon MD, Rothman TP. Time of origin of neurons in the murine enteric nervous system: sequence in relation to phenotype. J Comp Neurol. 1991;314:789–798. doi: 10.1002/cne.903140411. [DOI] [PubMed] [Google Scholar]
- 16.Bergner AJ, et al. Birthdating of myenteric neuron subtypes in the small intestine of the mouse. J Comp Neurol. 2014;522:514–527. doi: 10.1002/cne.23423. [DOI] [PMC free article] [PubMed] [Google Scholar]
- 17.Memic F, et al. Transcription and Signaling Regulators in Developing Neuronal Subtypes of Mouse and Human Enteric Nervous System. Gastroenterology. 2018;154:624–636. doi: 10.1053/j.gastro.2017.10.005. [DOI] [PMC free article] [PubMed] [Google Scholar]
- 18.Zeisel A, et al. Molecular Architecture of the Mouse Nervous System. Cell. 2018;174:999–1014.e22. doi: 10.1016/j.cell.2018.06.021. [DOI] [PMC free article] [PubMed] [Google Scholar]
- 19.Zhan X, et al. Generation of BAF53b-Cre transgenic mice with pan-neuronal Cre activities. Genesis. 2015;53:440–448. doi: 10.1002/dvg.22866. [DOI] [PMC free article] [PubMed] [Google Scholar]
- 20.Paul A, et al. Transcriptional Architecture of Synaptic Communication Delineates GABAergic Neuron Identity. Cell. 2017;171:522–539.e20. doi: 10.1016/j.cell.2017.08.032. [DOI] [PMC free article] [PubMed] [Google Scholar]
- 21.Cardoso V, et al. Neuronal regulation of type 2 innate lymphoid cells via neuromedin U. Nature. 2017;549:277–281. doi: 10.1038/nature23469. [DOI] [PMC free article] [PubMed] [Google Scholar]
- 22.Klose CSN, et al. The neuropeptide neuromedin U stimulates innate lymphoid cells and type 2 inflammation. Nature. 2017;549:282–286. doi: 10.1038/nature23676. [DOI] [PMC free article] [PubMed] [Google Scholar]
- 23.Muller PA, et al. Crosstalk between muscularis macrophages and enteric neurons regulates gastrointestinal motility. Cell. 2014;158:300–313. doi: 10.1016/j.cell.2014.04.050. [DOI] [PMC free article] [PubMed] [Google Scholar]
- 24.Neureither F, Stowasser N, Frings S, Möhrlen F. Tracking of unfamiliar odors is facilitated by signal amplification through anoctamin 2 chloride channels in mouse olfactory receptor neurons. Physiol Rep. 2017;5 doi: 10.14814/phy2.13373. [DOI] [PMC free article] [PubMed] [Google Scholar]
- 25.Alcaino C, et al. A population of gut epithelial enterochromaffin cells is mechanosensitive and requires Piezo2 to convert force into serotonin release. Proc Natl Acad Sci U S A. 2018;115:E7632–E7641. doi: 10.1073/pnas.1804938115. [DOI] [PMC free article] [PubMed] [Google Scholar]
- 26.Born G, et al. Modulation of synaptic function through the a-neurexin-specific ligand neurexophilin-1. Proc Natl Acad Sci U S A. 2014;111 doi: 10.1073/pnas.1312112111. [DOI] [PMC free article] [PubMed] [Google Scholar]
- 27.Creutz CE, et al. The copines, a novel class of C2 domain-containing, calcium-dependent, phospholipid-binding proteins conserved from Paramecium to humans. J Biol Chem. 1998;273:1393–1402. doi: 10.1074/jbc.273.3.1393. [DOI] [PubMed] [Google Scholar]
- 28.Gerke V, Creutz CE, Moss SE. Annexins: Linking Ca2+ signalling to membrane dynamics. Nature Reviews Molecular Cell Biology. 2005;6:449–461. doi: 10.1038/nrm1661. [DOI] [PubMed] [Google Scholar]
- 29.Chan KY, et al. Engineered AAVs for efficient noninvasive gene delivery to the central and peripheral nervous systems. Nat Neurosci. 2017;20:1172–1179. doi: 10.1038/nn.4593. [DOI] [PMC free article] [PubMed] [Google Scholar]
- 30.Nurgali K, Stebbing MJ, Furness JB. Correlation of Electrophysiological and Morphological Characteristics of Enteric Neurons in the Mouse Colon. J Comp Neurol. 2004;468:112–124. doi: 10.1002/cne.10948. [DOI] [PubMed] [Google Scholar]
- 31.Furness JB, Robbins HL, Xiao J, Stebbing MJ, Nurgali K. Projections and chemistry of Dogiel type II neurons in the mouse colon. Cell Tissue Res. 2004;317:1–12. doi: 10.1007/s00441-004-0895-5. [DOI] [PubMed] [Google Scholar]
- 32.Spencer NJ, Smith TK. Mechanosensory S-neurons rather than AH-neurons appear to generate a rhythmic motor pattern in guinea-pig distal colon. J Physiol. 2004;558:577–596. doi: 10.1113/jphysiol.2004.063586. [DOI] [PMC free article] [PubMed] [Google Scholar]
- 33.Lasrado R, et al. Lineage-dependent spatial and functional organization of the mammalian enteric nervous system. Science. 2017;356:722–726. doi: 10.1126/science.aam7511. [DOI] [PubMed] [Google Scholar]
- 34.Rhee JW, et al. Pbx3 deficiency results in central hypoventilation. Am J Pathol. 2004;165:1343–1350. doi: 10.1016/S0002-9440(10)63392-5. [DOI] [PMC free article] [PubMed] [Google Scholar]
- 35.Okamoto T, et al. Extensive projections of myenteric serotonergic neurons suggest they comprise the central processing unit in the colon. Neurogastroenterol Motil. 2014;26:556–570. doi: 10.1111/nmo.12302. [DOI] [PubMed] [Google Scholar]
- 36.Hao MM, Young HM. Development of enteric neuron diversity. J Cell Mol Med. 2009;13:1193–1210. doi: 10.1111/j.1582-4934.2009.00813.x. [DOI] [PMC free article] [PubMed] [Google Scholar]
- 37.Arenas E, Denham M, Villaescusa JC. How to make a midbrain dopaminergic neuron. Development. 2015;142:1918–36. doi: 10.1242/dev.097394. [DOI] [PubMed] [Google Scholar]
- 38.Young HM, et al. Colonizing while migrating: how do individual enteric neural crest cells behave? BMC Biol. 2014;12:23. doi: 10.1186/1741-7007-12-23. [DOI] [PMC free article] [PubMed] [Google Scholar]
- 39.Young HM, Jones BR, McKeown SJ. The projections of early enteric neurons are influenced by the direction of neural crest cell migration. J Neurosci. 2002;22:6005–6018. doi: 10.1523/JNEUROSCI.22-14-06005.2002. [DOI] [PMC free article] [PubMed] [Google Scholar]
- 40.Laranjeira C, et al. Glial cells in the mouse enteric nervous system can undergo neurogenesis in response to injury. J Clin Invest. 2011;121:3412–3424. doi: 10.1172/JCI58200. [DOI] [PMC free article] [PubMed] [Google Scholar]
- 41.Panman L, et al. Transcription factor-induced lineage selection of stem-cell-derived neural progenitor cells. Cell Stem Cell. 2011;8:663–675. doi: 10.1016/j.stem.2011.04.001. [DOI] [PubMed] [Google Scholar]
- 42.Rivetti Di Val Cervo P, et al. Induction of functional dopamine neurons from human astrocytes in vitro and mouse astrocytes in a Parkinson’s disease model. Nat Biotechnol. 2017;35:444–452. doi: 10.1038/nbt.3835. [DOI] [PubMed] [Google Scholar]
- 43.Taniguchi H, et al. A Resource of Cre Driver Lines for Genetic Targeting of GABAergic Neurons in Cerebral Cortex. Neuron. 2011;71:995–1013. doi: 10.1016/j.neuron.2011.07.026. [DOI] [PMC free article] [PubMed] [Google Scholar]
- 44.Danielian PS, Muccino D, Rowitch DH, Michael SK, McMahon AP. Modification of gene activity in mouse embryos in utero by a tamoxifen-inducible form of Cre recombinase. Curr Biol. 1998;8:1323–1326. doi: 10.1016/s0960-9822(07)00562-3. [DOI] [PubMed] [Google Scholar]
- 45.Madisen L, et al. A robust and high-throughput Cre reporting and characterization system for the whole mouse brain. Nat Neurosci. 2010;13:133–140. doi: 10.1038/nn.2467. [DOI] [PMC free article] [PubMed] [Google Scholar]
- 46.Bialkowska AB, Ghaleb AM, Nandan MO, Yang VW. Improved swiss-rolling technique for intestinal tissue preparation for immunohistochemical and immunofluorescent analyses. J Vis Exp. 2016 doi: 10.3791/54161. [DOI] [PMC free article] [PubMed] [Google Scholar]
- 47.Memic F, et al. Ascl1 is required for the development of specific neuronal subtypes in the enteric nervous system. J Neurosci. 2016;36:4339–4350. doi: 10.1523/JNEUROSCI.0202-16.2016. [DOI] [PMC free article] [PubMed] [Google Scholar]
- 48.Butler A, Hoffman P, Smibert P, Papalexi E, Satija R. Integrating single-cell transcriptomic data across different conditions, technologies, and species. Nat Biotechnol. 2018;36:411–420. doi: 10.1038/nbt.4096. [DOI] [PMC free article] [PubMed] [Google Scholar]
- 49.Hafemeister C, Satija R. Normalization and variance stabilization of single-cell RNA-seq data using regularized negative binomial regression. Genome Biol. 2019;20 doi: 10.1186/s13059-019-1874-1. [DOI] [PMC free article] [PubMed] [Google Scholar]
- 50.Zhang AW, et al. Probabilistic cell-type assignment of single-cell RNA-seq for tumor microenvironment profiling. Nat Methods. 2019;16:1007–1015. doi: 10.1038/s41592-019-0529-1. [DOI] [PMC free article] [PubMed] [Google Scholar]
- 51.Tirosh I, et al. Dissecting the multicellular ecosystem of metastatic melanoma by single-cell RNA-seq. Science. 2016;352:189–196. doi: 10.1126/science.aad0501. [DOI] [PMC free article] [PubMed] [Google Scholar]
- 52.Stuart T, et al. Comprehensive Integration of Single-Cell Data. Cell. 2019;177:1888–1902.e21. doi: 10.1016/j.cell.2019.05.031. [DOI] [PMC free article] [PubMed] [Google Scholar]
- 53.Crow M, Paul A, Ballouz S, Huang ZJ, Gillis J. Characterizing the replicability of cell types defined by single cell RNA-sequencing data using MetaNeighbor. Nat Commun. 2018;9 doi: 10.1038/s41467-018-03282-0. [DOI] [PMC free article] [PubMed] [Google Scholar]
- 54.Braschi B, et al. Genenames.org: The HGNC and VGNC resources in 2019. Nucleic Acids Res. 2019;47:D786–D792. doi: 10.1093/nar/gky930. [DOI] [PMC free article] [PubMed] [Google Scholar]
- 55.Wolf FA, et al. PAGA: graph abstraction reconciles clustering with trajectory inference through a topology preserving map of single cells. Genome Biol. 2019;20:1–9. doi: 10.1186/s13059-019-1663-x. [DOI] [PMC free article] [PubMed] [Google Scholar]
- 56.Wolf FA, Angerer P, Theis FJ. SCANPY: Large-scale single-cell gene expression data analysis. Genome Biol. 2018;19 doi: 10.1186/s13059-017-1382-0. [DOI] [PMC free article] [PubMed] [Google Scholar]
- 57.Haghverdi L, Büttner M, Wolf FA, Buettner F, Theis FJ. Diffusion pseudotime robustly reconstructs lineage branching. Nat Methods. 2016;13:845–848. doi: 10.1038/nmeth.3971. [DOI] [PubMed] [Google Scholar]
- 58.Stein-O’Brien GL, et al. Decomposing Cell Identity for Transfer Learning across Cellular Measurements, Platforms, Tissues, and Species. Cell Syst. 2019;8:395–411.e8. doi: 10.1016/j.cels.2019.04.004. [DOI] [PMC free article] [PubMed] [Google Scholar]
- 59.Stein-O’Brien GL, et al. PatternMarkers & GWCoGAPS for novel data-driven biomarkers via whole transcriptome NMF. Bioinformatics. 2017;33:1892–1894. doi: 10.1093/bioinformatics/btx058. [DOI] [PMC free article] [PubMed] [Google Scholar]
- 60.La Manno G, et al. RNA velocity of single cells. Nature. 2018;560:494–498. doi: 10.1038/s41586-018-0414-6. [DOI] [PMC free article] [PubMed] [Google Scholar]
Associated Data
This section collects any data citations, data availability statements, or supplementary materials included in this article.
Supplementary Materials
Data Availability Statement
Raw sequence and processed data are available on the Gene Expression Omnibus (GEO) database under the identifier GSE149524. The data accession number is SRP258962 found at http://ncbi.nlm.nih.gov/sra/SRP258962.


