Abstract
Mitochondria contain the genetic information and expression machinery to produce essential respiratory chain proteins. Within the mitochondrial matrix, newly synthesised RNA, RNA processing proteins, and mitoribosome assembly factors form punctate sub-compartments referred to as mitochondrial RNA granules (MRGs) 1–3. Despite their proposed importance in regulating gene expression, the structural and dynamic properties of MRGs remain largely unknown. We investigated the internal architecture of MRGs using fluorescence super-resolution localisation microscopy and correlative electron microscopy, and find that MRG ultrastructure consists of compacted RNA embedded within a protein cloud. Using live-cell super-resolution structured illumination microscopy and fluorescence recovery after photobleaching, we reveal that MRGs rapidly exchange components and can undergo fusion, characteristic properties of fluid condensates 4. Furthermore, MRGs associate with the inner mitochondrial membrane and their fusion coincides with mitochondrial remodelling. Inhibition of mitochondrial fission or fusion leads to an aberrant accumulation of MRGs into concentrated pockets, where they remain as distinct individual units despite their close apposition. Together, our findings reveal that MRGs are nanoscale fluid compartments, which are dispersed along mitochondria via membrane dynamics.
RNA in eukaryotic and bacterial cells can be sequestered into ribonucleoprotein granules that exhibit a wide range of forms and functions, under both physiological and stress conditions. For example, in the nucleus, speckles and paraspeckles are involved in RNA splicing and transcriptional regulation 5,6 whereas the nucleolus creates a compartment for ribosomal assembly 7,8. RNA-protein granules often form by liquid-liquid phase separation (LLPS) 9,10, and multivalent weak interactions between disordered RNA-binding protein (RBP) domains, and RNA itself, were identified as hallmark factors for the formation of biomolecular condensates in many in vitro and in silico studies 11–13. However, phase behaviour is sensitive to a number of environmental parameters, such as concentration, ionic strength, pH or crowding, native conditions of which are challenging to reproduce in test tubes14. Therefore, studies in living cells are fundamental to understanding the formation mechanisms, which may go beyond LLPS 15, and biological functions of such structures.
In mitochondria, MRGs comprise newly synthesised mtRNAs, transcribed from the 16kb mitochondrial DNA (mtDNA) as long polycistronic precursors, as well as mitochondrial RBPs 1,2,16. It was previously demonstrated that mtRNA is essential for MRG formation 3. However, both the structural organisation of and the dynamic interplay between MRG components remain unknown. Mitochondria undergo dramatic shape changes through fission, fusion, and branching, of which fission directly impacts the distribution of mtDNA 17,18. How MRGs respond to this dynamicity and complex architecture is also unknown, due in part to their size below the diffraction limit. Here, we investigated the molecular organisation, distribution, and positioning mechanism of MRGs within the mitochondrial network, using super-resolution and correlative fluorescence and electron microscopy. We show that MRGs are ~130 nm, sub-compartmentalised liquid condensates. They associate with the inner mitochondrial membrane (IMM), and mislocalise upon perturbation of mitochondrial fission and fusion dynamics.
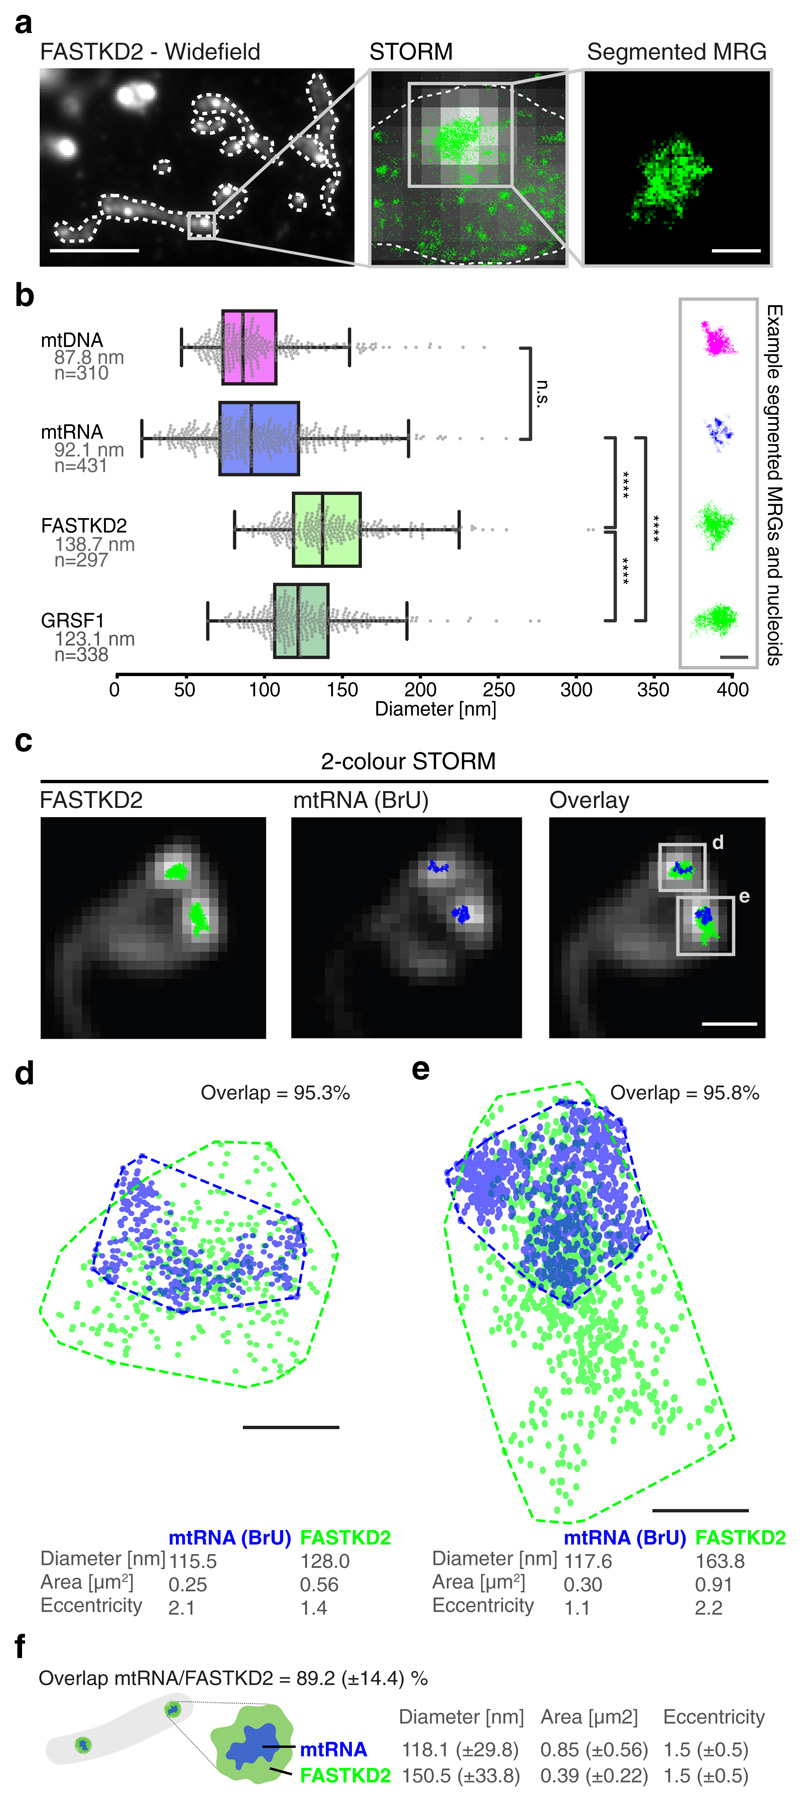
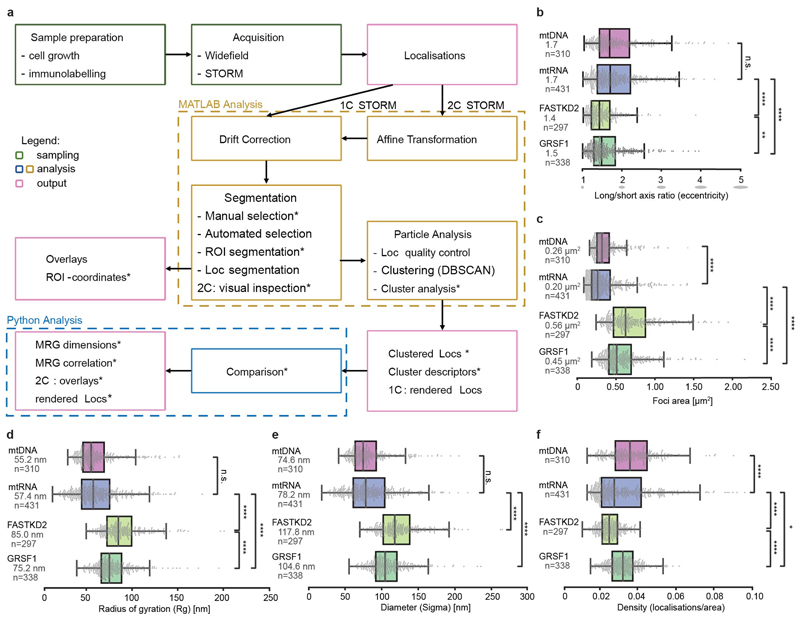
To assess MRG dimensions and overall organisation, we examined two MRG-associated RBPs, FASTKD2 and GRSF1, along with mtRNA in fixed COS-7 cells. We stained endogenous proteins using immunofluorescence, and newly synthesised RNA by incubation with 5 mM bromouridine (BrU) for one hour, and anti-BrU staining as previously described 2, 3. In conventional immunofluorescence images against FASTKD2, MRGs appear as bright, diffraction-limited punctae against a dim mitochondrial matrix (Fig. 1a). We used similar fluorescence images to identify in-focus MRGs, and the corresponding high throughput stochastic optical reconstruction microscopy (htSTORM) 19 images to compute their size and shape at the nanoscale (Extended Data Fig. 1). We found mtRNA within MRGs to occupy a region 92 nm in average diameter (± 40 (SD), n= 431) (Fig. 1b and Supplementary Fig. 1). To assess MRG shape we determined the ratio between the long and the short axis for each granule and measured a median eccentricity of 1.7 (± 0.6 (SD)) for mtRNA (Extended Data Fig. 1 and Supplementary Fig. 1). mtDNA is also packaged into punctate structures called nucleoids, which we measured to have a diameter of 88 nm (± 32 (SD), n = 310) (Fig. 1b and Supplementary Fig. 2), when stained with antibodies against mtDNA. This is consistent with previous reports of ~100 nm nucleoid diameters 20–22, as is our estimated eccentricity of 1.7 (± 0.7 (SD)), reflecting a slightly ellipsoidal shape. Thus, mtDNA serves as an internal reference or positive control for our STORM-based size and shape measurements.
Fig. 1. The nanoscopic architecture of MRGs consists of compacted RNA surrounded by RNA binding proteins.
a, Widefield immunofluorescence of FASTKD2 (right) shows punctate, diffraction limited MRGs within mitochondria (white dashed lines). Scale bar: 10 μm. Zoom (centre) of a representative MRG, overlay of STORM (green) and widefield images (greyscale). The MRG is segmented (right) by its high density of STORM localisations using DBSCAN 25. Images are representative of the dataset are shown in (b). Scale bar: 200 nm. b, MRG (mtRNA, FASTKD2, or GRSF1) and nucleoid (mtDNA) diameters determined by mean full width at half maximum (FWHM) from htSTORM images. Number (n) of clusters quantified for each condition is represented in the figure and is pooled from 24, 13, 7, and 14 FOVs, and 4, 4, 3, and 2 samples for BrU, GRSF1, FASTKD2, and mtDNA respectively. Median diameter and number of analysed clusters are noted. Box plots denote first and third quartiles as well as the median, whiskers comprise rest of distributions except outliers. Two-sided Mann-Whitney-U test was used and **** denotes p-values < 0.0001; n.s. is non-significant (pBrU-mtDNA = 1, pBrU-FASTKD2 = 1.0x10-48, pBrU-GRSF1 = 4.5x10⁻³⁰, pGRSF1-FASTKD2 = 3.1x10⁻¹¹). Representative images are shown (right). Scale bar: 200 nm. c, Example of two-colour htSTORM of MRGs (anti-FASTKD2, green) and mtRNA (anti-BrdU, blue) overlaid on widefield images (grey). Scale bar: 500 nm. Images are representative of the dataset shown in (f). d, e Scatter plot of localisations from clusters in c. Areas were estimated using a convex hull (dashed line) and used to find the percent overlap between channels. Diameter and eccentricity were also quantified (Supplementary Information). Scale bar: 100 nm. f, Schema of MRG organisation and median ±SD values for all analysed two-colour htSTORM clusters (n = 26 MRGs examined over 8 independent experiments). Statistical source data are provided in Source data fig. 1.
We then quantified the nanostructure of MRGs immunolabeled for GRSF1 or FASTKD2, bona fide MRG markers for which mutations in the latter are associated with severe mitochondrial diseases 23,24. Our measurements showed that the MRG diameter marked by either protein is significantly larger than that of mtRNA: 139 nm (± 36 (SD), n = 297) for FASTKD2, and 123 nm (± 31 (standard deviation, SD), n= 338) for GRSF1 foci in COS-7 cells (Fig. 1b and Supplementary Fig. 3, 4). Alternative size descriptors including radius of gyration and convex hull area showed the same trends (Extended Data Fig. 1). Furthermore, protein punctae are significantly rounder, with an eccentricity of 1.4 (± 0.4 (SD)) and 1.5 (± 0.5 (SD)) for FASTKD2 and GRSF1 respectively (Extended Data Fig. 1), underlining differences between RNA and protein organisation in MRGs.
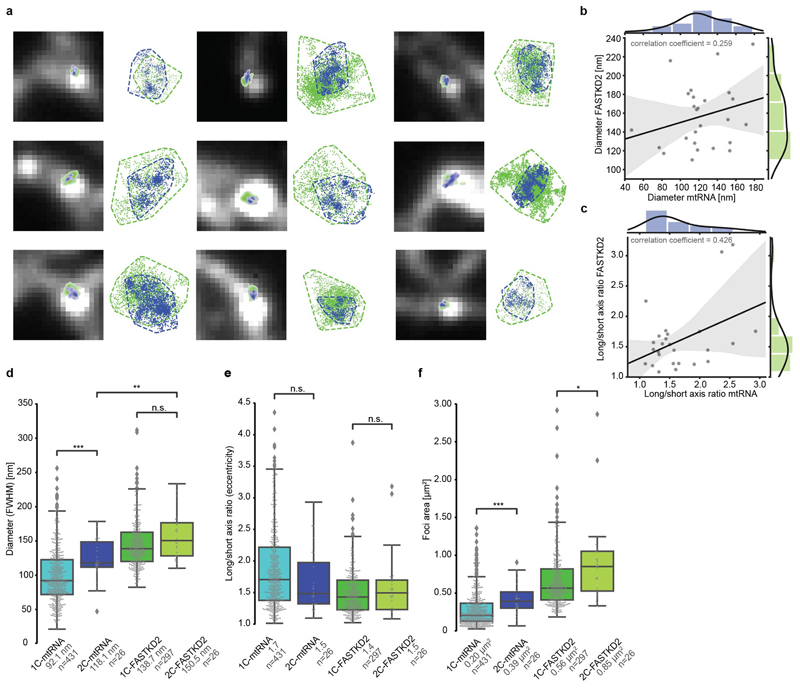
To further investigate MRG architecture and the relationship between mtRNA- and FASTKD2-foci dimensions, we then performed two-colour htSTORM (Fig. 1c, Extended Data Fig. 2). We found no correlation between the size (R = 0.26, n = 26) or eccentricity (R = 0.42) of the protein components and newly synthesized RNA for individual granules (Extended Data Fig. 2). Yet, in 80% of measured MRGs, the projected area of mtRNA was smaller and contained within (>80% overlap) the FASTKD2 area (Fig. 1d-f and Supplementary Table 1). These quantifications lead us to schematise the ultrastructure of a typical MRG as compacted RNA surrounded by and commingled with RBPs (Fig. 1f).
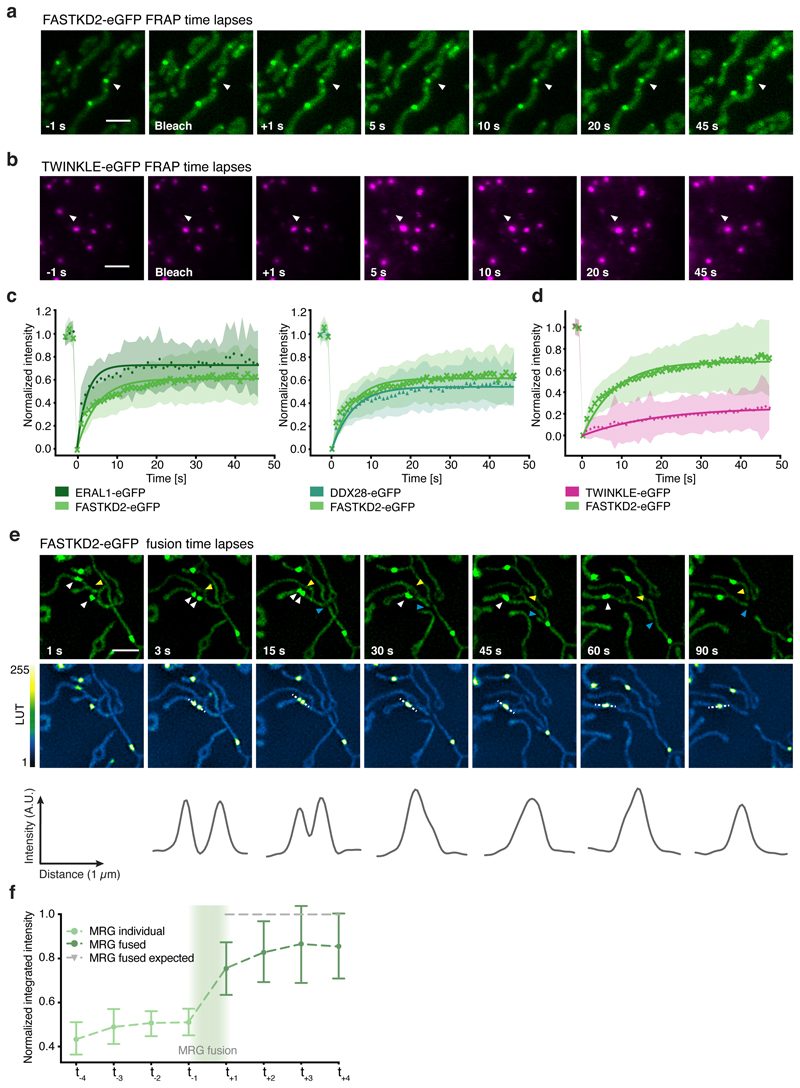
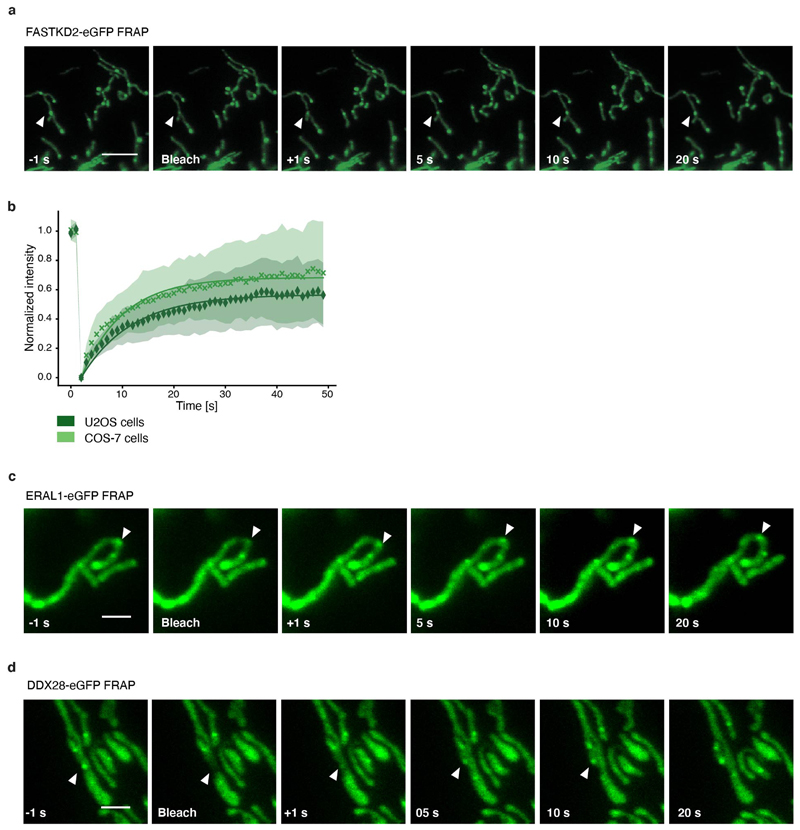
Liquid phase properties, such as the ability to rapidly exchange components while maintaining a high local concentration of selected molecules, play a functional role in stress- and other RNA granules by enabling mRNA sequestration, enzyme buffering, and tuning of reaction kinetics 9. These roles may apply to MRGs and their function in gene expression, if they are indeed liquid-like. To test this hypothesis, we generated stable FASTKD2-eGFP expressing cell lines and assessed common hallmarks of fluids: content exchange and droplet fusion 26. We examined the molecular exchange of MRG components by fluorescence recovery after photobleaching (FRAP). To monitor MRG fluorescence inside highly mobile mitochondria, we developed a software tool for FRAP analysis with motion tracking (Fig. 2a). We found FASTKD2-eGFP molecules within MRGs to recover on average to ~64% of their bleached intensity, with a median half-recovery time of 5.8 (± 3.3 (SD)), and 4.6 (± 11.3 (SD)) seconds in U2OS and COS-7 cells (Fig. 2c, d, Extended data Fig. 3 and Supplementary Movies 1-2). To test whether dynamic exchange is generalisable beyond FASTKD2, we created two additional stable cell lines expressing MRG markers, ERAL1 and DDX28 27,28, both fused to eGFP. Both recovered at a timescale similar to FASTKD2 (half-recovery time of 1.9 (± 0.7 (SD)) seconds for ERAL1 and 3.1(± 1.9 (SD)) seconds for DDX28) (Fig. 2c, Extended data Fig. 3 and Supplementary Movies 3 and 4). For comparison, we overexpressed the mitochondrial helicase TWINKLE fused to eGFP as a nucleoid marker with high DNA-binding affinity 29. TWINKLE foci only slightly (~29%) recovered over the course of our FRAP assay (50 sec), and served as negative control to highlight that fast protein exchange is particular to MRGs (Fig. 2b, d). Thus, MRG components exchange rapidly, on a fast timescale, even compared to stress granules (recovery half-time: 18.5-35 sec) 30.
Fig. 2. MRGs exchange content and undergo fusion in live COS-7 cells.
a, b, Examples of FRAP time lapse series of MRGs (stable expression, FASTKD2-eGFP, green) or nucleoids (transient transfection, TWINKLE-eGFP, magenta), from datasets represented in (c) and (d), respectively. An individual MRG or nucleoid (arrowhead) was partially photobleached to allow tracking during recovery. Scale bars: 2 μm. c, d, FRAP intensity where symbols represent mean data points, lines are single exponential fits, and shaded areas standard deviations each time point. FASTKD2- (n = 44 MRGs examined over 8 independent experiments), ERAL1- (n = 17 MRGs examined over 3 independent experiments), DDX28- (n = 17 MRGs examined over 3 independent experiments) (c) and TWINKLE-eGFP (n = 50 nucleoids examined over 5 independent experiments) (d). e, Representative SIM time lapse series of an MRG fusion event (white arrowheads) in cells stably expressing FASTKD2-eGFP. Cells were imaged at 1/3 Hz. Yellow and blue arrowheads highlight mitochondrial network dynamics (top). Line profiles of MRGs along the mitochondrial axis (middle, dashed lines) show the intensity values at each time point (bottom). Scale bar: 2 μm. f, Temporal evolution of the integrated intensity of MRGs in COS-7 before and after fusion. Pre-fusion integrated intensities were summed for each granule pair (n=9 biologically independent cells), and their sum used for normalisation (grey dashed line). Mean and SD for each MRG type are shown for four time-points before (light green, t-4 – t-1) as well as after fusion (dark green, t+1 – t+4). Statistical source data are provided in Source data fig. 2.
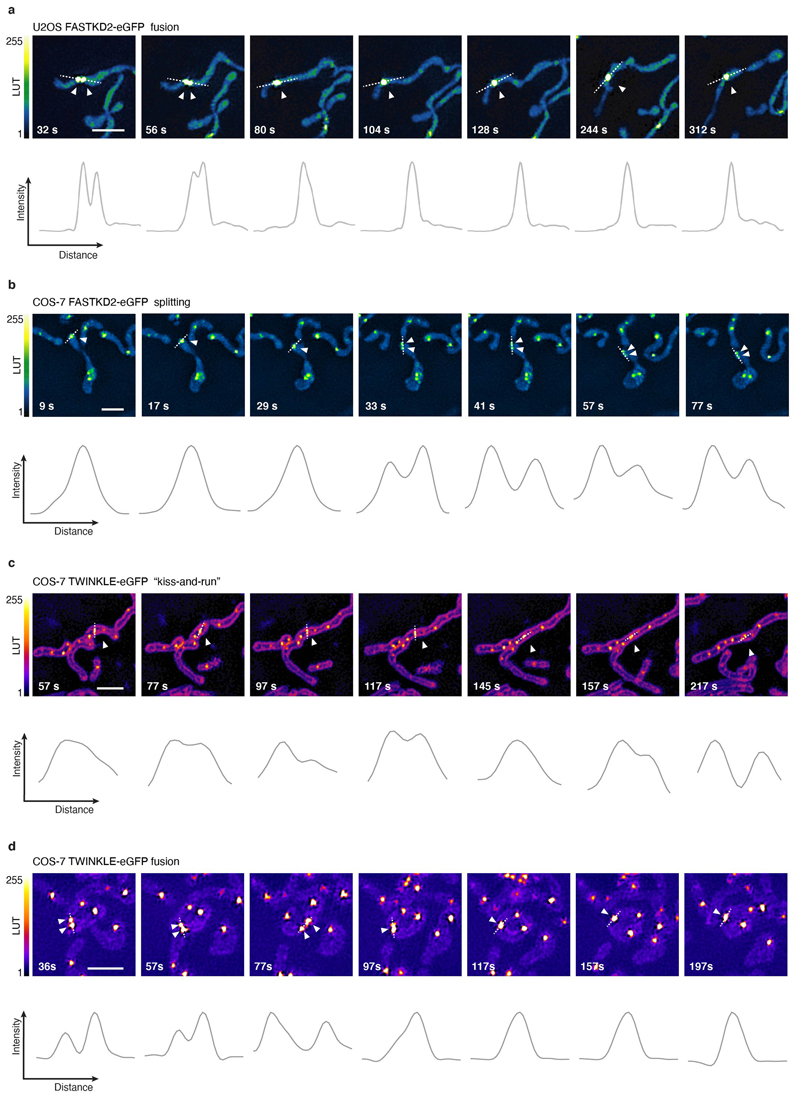
Whereas liquid drops may fuse upon contact, solid granules would instead remain inert or aggregate while maintaining their shape. We followed FASTKD2 foci by live-cell super-resolved structured illumination microscopy (SIM), which provides the necessary resolution to discern the two cases. We observed MRG fusion in multiple instances in both U2OS and COS-7 cells, where two individual foci merged to form a single spot (Fig. 2e, Extended data Fig. 4 and Supplementary Movies 5 and 6). We also noted MRG splitting on some occasions (Extended Data Fig. 4 and Supplementary Movie 7). Imaging TWINKLE-eGFP by SIM, we observed nucleoid “kiss-and-runs”, and nucleoid splitting, as previously described 31, as well as one fusion event (Extended Data Fig. 4, Supplementary Movies 8 and 9). We determined the photobleaching-corrected integrated intensity of FASTKD2-eGFP in the merged droplet to be approximately the sum of the initial droplets, as expected if no material was lost during fusion (Fig. 2f). Notably, 75% of fusion events coincided with visible mitochondrial rearrangements such as fusion, fission, or bulging (Supplementary Table 2).
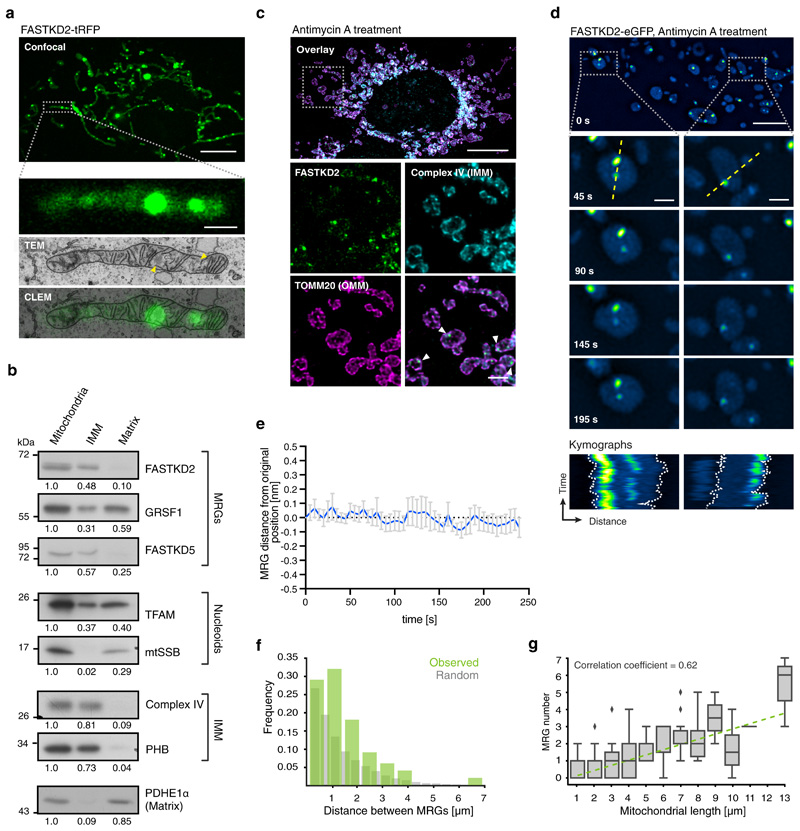
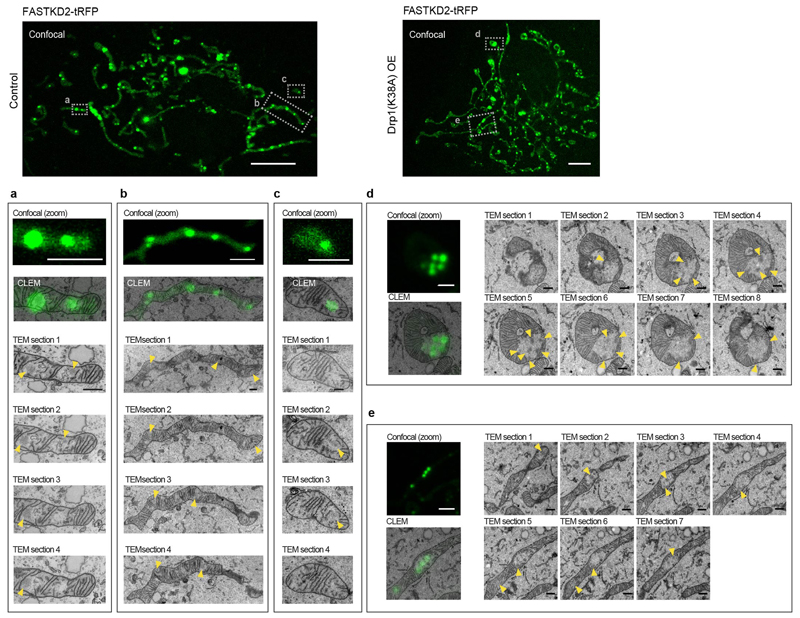
Infoldings of the IMM called cristae densely populate the mitochondrial interior. By correlative fluorescence and electron microscopy (CLEM), we observed that displaced cristae accommodate MRGs in open spaces (Fig. 3a), as it was recently reported for nucleoids by live-cell STED microscopy 32. MRGs are clearly distinguishable as round electron-dense granules, with dimensions consistent with our htSTORM data (Fig. 1 and 3a and Extended Data Fig. 5) and an ultrastructure reminiscent of that of stress granules and P-bodies 33.
Fig. 3. MRGs are associated with inner mitochondrial membranes, and are randomly spaced along the mitochondrial network.
a, Correlated fluorescence (axially-projected confocal image, green) and transmission electron micrograph (TEM, greyscale), in a FASTKD2-tRFP expressing COS-7 cell. Electron densities corresponding to MRGs are visible (arrowheads)(n= 7 MRGs from 3 mitochondria). Scale bars: 10 μm (top), 1 μm (bottom). b, Western blot of fractionated mitochondria, probed with antibodies against MRG (FASTKD2, GRSF1, FASTKD5) and nucleoid (TFAM, mtSSB) components. IMM-integrated proteins (complex IV, PHB) and soluble matrix protein PDHE1α served as controls. Blots were processed simultaneously and compared quantitatively from the same gel. The experiment was performed twice with similar results. c, FASTKD2-eGFP expressing HeLa cells treated with 100 μM antimycin A for 1 hour, then fixed. IMM (anti-complex IV, cyan) and OMM (anti-TOMM20, magenta), reveal swollen mitochondria with few inner membranes. MRGs appear proximal to the IMM (arrowheads). The experiment was performed twice with similar results). Scale bars: 10 μm (top), 2 μm (bottom). d, FASTKD2-eGFP expressing COS-7 cells treated with 100 μM antimycin A for 1 hour, imaged live. Time-lapse series are shown for two exemplary mitochondria (dashed boxes). Kymographs (from yellow dashed line) highlight the co-mobility of individual granules. Scale bars: 10 μm (top), 1 μm (bottom). The experiment was performed twice with similar results e, MRG movement over time, measured as distance between MRG and closest membrane, for swollen mitochondria as exemplified in (d) (n = 20 MRGs examined from 3 cells). Data are represented as mean (blue line) ± SD (error bars). f, Histogram of the distance between neighbouring pairs of MRGs for unbranched mitochondria (n = 100 mitochondria over 3 independent experiments, green) and simulated randomly distributed granules (grey). g, Correlation between MRG number and length of unbranched mitochondria (n = 206 mitochondria over 3 independent experiments). Each box-plot indicates median, 1st and 3rd quartiles and diamonds show outliers for each bin (e.g.: bin_1 = 0–1 μm, etc.). Linear regression (green dashed line), was computed on non-binned data. Unprocessed blots and statistical source data are provided in Source data fig. 3.
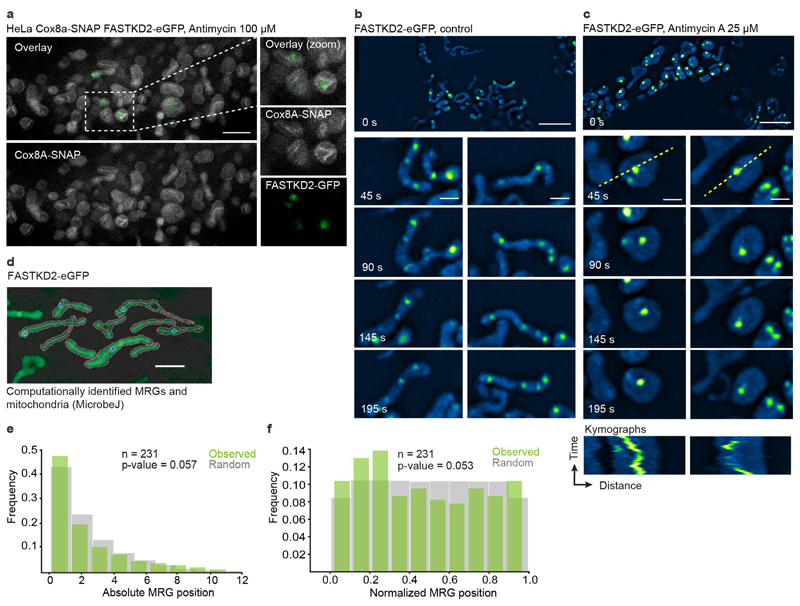
Noticing their close proximity to the IMM and intrigued by the concurrence between MRG fusion and membrane dynamics, we assessed their association with the membrane using both biochemical and image-based approaches. First, we performed a biochemical fractionation to enrich for IMM or matrix-associated proteins. We found MRG components FASTKD2 and FASTKD5 primarily in the IMM fraction, while GRSF1 was present in both IMM and matrix fractions (Fig. 3b), similar to the nucleoid associated protein TFAM, in accordance with previous reports 34. Next, we swelled mitochondria by antimycin A treatment of live COS-7 and HeLa cells, to test whether MRGs would diffuse freely within the cristae-devoid enlarged lumen 35, or remain associated with the IMM. We observed that most MRGs decorated the perimeter (Fig. 3c), and retained their relative position within mitochondria over time (Fig. 3d, e, Extended Data Fig. 6 and Supplementary Movies 10 and 11), consistent with IMM association. Thus, as nucleoids 34, MRGs appear to be physically attached to the IMM.
We then assessed the distribution of MRGs along the mitochondrial network. A semiregular nucleoid spacing was found to be important in fission yeast, to circumvent the problem that random spacing would contribute to binomial errors in genome partitioning and thus a high probability of total mtDNA loss 17. We used the same method to compare measured inter-MRG distances with that of simulated randomly placed granules (Fig. 3f). Our analysis shows that the positions of individual MRGs within their respective mitochondria is not distinguishable from a random distribution (Extended Data Fig. 6), while the distances between MRGs inside the same mitochondrion are at the borderline to be considered different from random (p = 0.04997) (Fig. 3f). In the case of a random distribution along the entire mitochondrial network, we would expect an equal probability of finding an MRG anywhere along the network, so that larger mitochondria should have more granules. Indeed, we found on average one MRG every of 2.00 (±1.65) μm of mitochondria (n = 131), and a positive correlation between MRG number and mitochondrial length (correlation coefficient = 0.62) (Fig. 3g, Extended Data Fig. 6). While nucleoids are accurately positioned 18, our data suggest that MRGs are not.
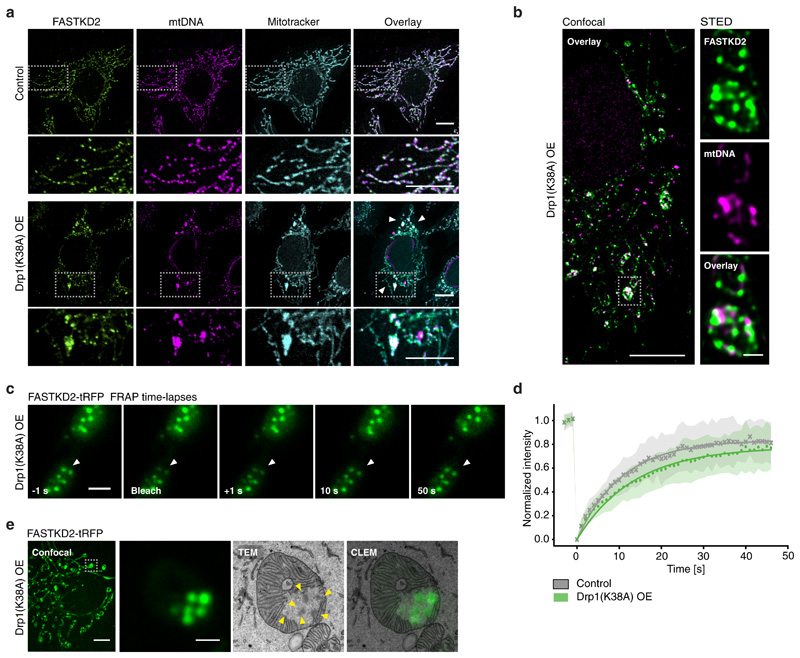
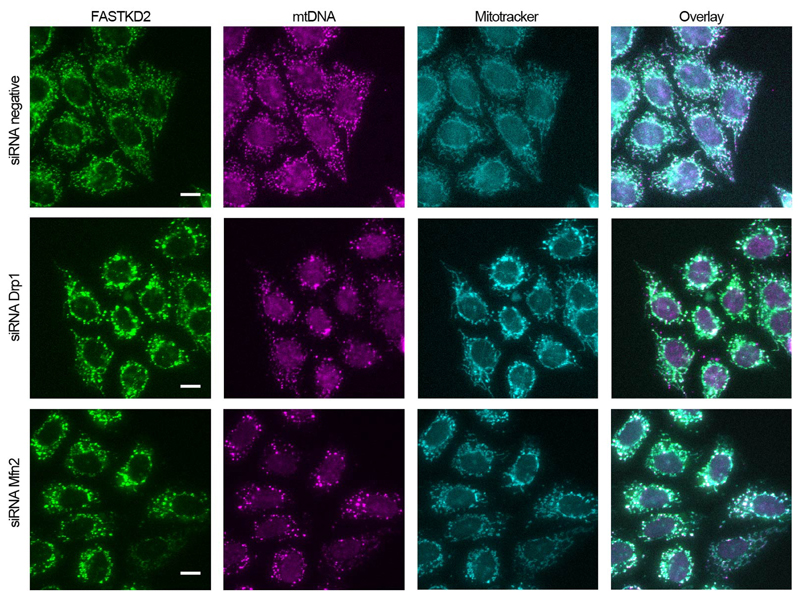
Since MRGs appear relatively immobile within the matrix, yet are randomly distributed, we decided to investigate the interplay between MRG positioning and mitochondrial dynamics. We inhibited mitochondrial fission by overexpression of a dominant negative mutant of the fission factor dynamin related protein 1 (Drp1), Drp1K38A. Under this condition, we observed highly elongated mitochondria with enlarged domains, as previously described and termed "mito-bulbs" 36. We found that these domains contain not only nucleoids, but also MRGs (Fig. 4a). With super-resolved stimulated emission depletion (STED) microscopy, we discovered that mito-bulbs are better described as resembling bunches of grapes, composed of many interspersed MRGs and nucleoids, rather than as a single enlarged and coalesced structure as previously proposed 36 (Fig. 4b). Intrigued by the absence of MRG fusion (illustrated in Fig. 2) in such a confined space, we assessed whether MRGs may have solidified, as stress granules can 37. We found that fluorescence recovery of stably expressed FASTKD2-tRFP was similar in control and Drp1K38A overexpressing cells, suggesting that the liquid nature of MRGs within the mito-bulbs had not changed (Fig. 4c, d, and Supplementary Movie 12 and 13). Using CLEM, we confirmed that MRGs remained as distinct individual units despite their close apposition and did not observe the presence of cristae that could have formed physical barriers to the fusion of these granules (Fig. 4e and Extended Data Fig. 5). Furthermore, this EM analysis showed that a number of these electron dense granules was closely apposed to membranes, consistent with the results shown in Fig. 3a-c. Tightly stacked cristae could be seen adjacent to mito-bulbs in affected mitochondria (Fig. 4d). Knock-down of mitochondrial fusion factor Mitofusin 2 (Mfn2) evoked similar MRG clustering, further supporting a role for mitochondrial dynamics in maintaining an even distribution of MRGs along mitochondria (Extended Data Fig. 7).
Fig. 4. Impaired mitochondrial fission leads to aberrant MRG positioning.
a, HeLa cells imaged by confocal microscopy in control settings (top) or after 48 hours of Drp1K38A overexpression (OE, bottom) stained for MRGs (anti-FASTKD2, green), nucleoids (anti-DNA, magenta), and mitochondria (Mitotracker Deep Red, cyan). Zoomed regions (grey (top) boxes, below). The experiment was performed three times with similar results. Scale bars: 10 μm (top), 1 μm (bottom). b, Confocal (left) and STED (right) images of mito-bulbs containing MRGs (anti-FASTKD2, green) and nucleoids (anti-mtDNA, magenta) in fixed Drp1K38A overexpressing COS-7 cells. The experiment was performed twice with similar results. Scale bars: 10 μm (left), 2 μm (right, zoom). c, Example of FRAP time lapse images from datasets represented in (d) of mito-bulb-associated MRGs (arrowheads), in FASTKD2-tRFP (green) stably expressing COS-7 cells transiently transfected with Drp1K38A for 24 hours. Scale bar: 2 μm. d, Comparison of FASTKD2-tRFP FRAP between control (n = 31 MRGs examined over 4 independent experiments) and Drp1K38A (n = 40 MRGs examined over 3 independent experiments) over-expressing cells. Symbols represent mean data points, lines are single exponential fits, and shaded areas standard deviations for each time point. e, Confocal fluorescence and TEM (CLEM) of MRGs (stable expression, FASTKD2-tRFP, green) in COS-7 cells, fixed 24 hours after Drp1K38A transfection. Zoom of a single mitochondrion shows several MRGs (arrowheads), resembling a bunch of grapes (10 MRGs were analysed from 3 mitochondria). Scale bars: 10 μm (left), 1 μm (right). Grey dashed boxes indicate magnified regions. Statistical source data are provided in Source data fig. 4.
In conclusion, our data show that MRGs share several properties with phase-separated condensates, albeit the exact mechanism of their formation is not yet fully elucidated. We propose that condensation of mtRNA and RBPs into MRGs may allow mammalian cells to regulate positioning of these components along the mitochondrial network via membrane association (Fig. 3). Mitochondrial dynamics via fission and fusion is critical for maintaining a random positioning of MRGs, and its perturbation leads to their accumulation in small domains, while their individual stability and capacity for molecular exchange is maintained (Fig. 4). Our findings show that changes in positioning can arise, decoupled from changes in the biophysical properties of RNA sub-compartments. This insight could be important for understanding mitochondrial disorders that are reported to feature aberrant mitochondrial RNA and DNA distribution into clusters. Adequate positioning of genetic material and transcripts may be crucial for proper synthesis of the respiratory chain and oxidative phosphorylation 38.
Methods
Plasmids and reagents
All cell culture reagents and chemicals were purchased from Sigma unless stated otherwise.
The following plasmids were cloned in the laboratory, using pWPT lentiviral vector (Addgene #12255) as a backbone: FASTKD2-eGFP, FASTKD2-tRFP, DDX28-eGFP, ERAL1-eGFP and TWINKLE-eGFP. CFP-Drp1(K38A) plasmid was a gift from Alexander Van der Bliek. Plasmids for lentiviral production pMD2.G and psPAX2 were gifts from Didier Trono (Addgene #12259 and #12260, respectively).
Cell culture and transfection
HeLa (ATCC, CCL-2), HEK293T (ATCC, CRL-11268), COS-7 (ECACC, 87021302), and U2OS (ATCC, HTB-96) cells were cultured in 5% CO2 at 37 °C in Dulbecco’s modified Eagle medium (DMEM) supplemented with: 10-25 mM glucose, 4 mM GlutaMAX (Gibco) or 2 mM L-glutamine, 10% heat-inactivated foetal bovine serum (FBS), 100 U/ml penicillin and 100 mg/ml streptomycin. All cells were maintained in culture for a maximum of 20 passages, and routinely assessed for mycoplasma contamination. CRISPR-engineered HeLa Cox8a-SNAP cells were a gift from Till Stephan & Stefan Jakobs 32.
Plasmid transfection of cells was performed using Lipofectamine LTX (Invitrogen) or FuGENE 6 (Promega) according to manufacturer’s instructions (typically 4-6μL FUGENE-reagent and 100-500ng plasmid DNA were used per well of a six-well plate). Cells were analysed 12-48 hours after transfection. siRNA transfection was performed using Lipofectamine RNAi Max (Invitrogen) and cells were analysed 72 hours after transfection.
siRNA sequences: for Drp1 and Mfn2 silencing, ON-TARGETplus SMARTpool (Dharmacon, GE Healthcare) were used following the manufacturer’s instructions. siDrp1 catalogue number: L-012092-00; siMfn2 catalogue number: L-012961-00, ON-TARGETplus non-targeting pool (negative control) catalogue number: D-001810-10.
Stable cell-line generation
We used a second-generation lentiviral system to transform individual cell-lines. In brief, gene sequences of interest were cloned into lenti-expression vector pWPT (as described above). Co-transfection of HEK293T cells was performed with packaging plasmids pMD2.G and psPAX2 using calcium phosphate precipitation. Medium containing virus was collected 48 hours after transfection and filtered using membranes with a pore size of 0.45 μm. The viral supernatant and polybrene were added to 70% confluent recipient cells, and culture medium was replaced 24 hours after infection. For FASTKD2-, ERAL1-, and DDX28-eGFP cell-lines, FACS sorting was performed with the help of the Flow Cytometry Core Facility at EPFL, to enrich cells expressing eGFP at the desired level.
Live-cell treatments
Bromouridine tagging of RNA
When bromouridine pulse assay was performed, cells were incubated with 5 mM 5-bromouridine (BrU) in complete culture medium for 1 hour prior to fixation, as previously described 1,2. BrU was stored at -20 °C as 250 mM aliquots, and was heated and vortexed prior to dilution in culture medium when used.
Antimycin A treatment
For antimycin A treatment, cells were incubated with 25 or 100 μM antimycin A (Abcam) in complete culture medium for 24 hours or 1 hour respectively, prior to fixation or live-imaging. Live-imaging was performed in Leibovitz L-15 medium (Gibco) for SIM microscopy or Live Cell Imaging Solution (Thermo Fisher Scientific) for STED microscopy, supplemented with adequate amount of antimycin A. Antimycin A was resuspended in EtOH at 1 mM, and stored at -20°C.
Immunofluorescence
Cells were seeded on glass coverslips and grown to a confluence of 40-80%. Following live-cell treatments if indicated, fixation of cultured cells was performed in warm 4% paraformaldehyde (PFA) in phosphate-buffer saline (PBS) for 15 minutes. Then, cells were rinsed with PBS, and cell-permeabilisation and -blocking were co-executed by incubating the fixed cells in PBS containing 0.3% Triton X-100 and 10% pre-immune goat serum for 15 minutes. The same buffer was used to incubate cells with the specified primary antibody (see antibody list below). After incubation with primary antibodies over-night in a humid chamber and at 4°C or 2 hours at room temperature (RT), the cells were washed with PBS and incubated with the appropriate secondary antibody conjugated with a fluorophore. Where indicated, mitochondrial network was stained before fixing the cells using Mitotracker Deep Red FM (Thermo Fisher Scientific), according to manufacturer’s instructions.
Primary antibodies used for immunofluorescence
anti-FASTKD2 (Proteintech, 17464-1-AP; 1:250 dilution), anti-bromodeoxyuridine (Roche, 11170376001; 1:250 to 1:500 dilution), anti-GRSF1 (Sigma, HPA036985; used 1:250), anti-DNA (ProGen, 61014; 1:250 to 1:400 dilution), anti-TOMM20 (Abcam, ab186734; Santa Cruz Biotech., SC-17764; 1:200 dilution for both antibodies), anti-OxPhos Complex IV subunit IV (clone 20E8C12, Thermo Fisher Scientific, A21348; 1:200 dilution), and anti-mtHSP70 (Thermo Fisher Scientific, MA3-028; 1:250 dilution).
Secondary antibodies were different depending on the microscopy technique applied and are detailed below. All secondary antibodies for immunofluorescence were diluted 1:500-1:1,000.
htSTORM
htSTORM experiments were performed as previously described 19,39, using the same hardware. Microscope acquisitions were controlled by the Micromanager software (v. 2.0 beta), interfaced with the Thorlabs APT software (v. 3.21.4) to control the piezo stage. Immunofluorescence was performed as described above. The following primary antibodies were combined for one- or two-colour imaging, as stated in the figures: anti-FASTKD2, anti-bromodeoxyuridine, anti-GRSF1 and anti-DNA. For one colour htSTORM, we used Alexa Fluor 647 coupled anti-rabbit or anti-mouse secondary antibodies (Invitrogen), and respective number of foci analysed are stated in Fig. 1. To verify mitochondrial localisation of analysed foci, we co-stained the mitochondrial proteins TOMM20 or mtHSP70 using the respective primary antibodies and Alexa Fluor 488 coupled secondary antibody (Invitrogen). For two-colour htSTORM, we used Alexa Fluor 647 for BrU coupled with DyLight 755 (Invitrogen) to label FASTKD2 and we analysed 12 FOVs from four distinct imaging days. To allow lateral drift-correction, 100nm Gold-nanospheres coated with poly-L-lysine were incubated on each sample for 5min, before the sample was mounted on the microscope with fresh imaging buffer. Before acquiring each raw STORM stack (10 ms exposure, 20,000-40,000 frames), we collected a 50 ms widefield reference image at low laser power. Manually incrementing the 405-laser power allowed prolonged imaging. Imaging conditions (excitation illumination powers of 500-1500 mW) were adjusted per sample-type.
We analysed and plotted the obtained localisations by adapting published MATLAB 39, and new Python scripts (see Supplementary Fig. 1). In brief, adaptations of data-processing encompassed manual selection of ROIs around MRGs that were in focus. For two-colour experiments, this selection was applied very restrictively, verifying the presence of a bright WF-signal in both channels. For two-colour experiments, additional care was paid to reduce effects due to chromatic aberrations. For this, the localisations of every selected ROI were visually inspected, and ROIs were rejected from further analysis unless no visually detectable systematic shift was visible upon DBSCAN-clustering 25.
All descriptors were computed from localisations belonging to each particular cluster. We calculated the full width at half maximum (FWHM) from the summed eigenvalues as diameter for each granule (see python script). The eccentricity was determined as the ratio between the long axis and the short axis. Axis-lengths are the eigenvalues of the covariance matrix of clustered localisations in x- and y-dimension as described in (V. Spruyt, "A geometric interpretation of the Covariance Matrix", 2014, https://www.visiondummy.com/2014/04/geometric-interpretation-covariance-matrix/). We used the MATLAB-function "convexHull" to compute granule area and identify the hull-defining edge-points. Three data points > 0.25μm2 were omitted for creation of Supplementary Fig. 1, but kept for all statistical analysis. Radius of gyration was computed as the sum of variances in x, and y, divided by the number of localisations. Sigma was computed as the sum of the eigenvalues in x and y.
SIM live-cell microscopy
SIM was performed on a 3D NSIM Nikon microscope with a CFI Apochromat TIRF objective (100x, numerical aperture NA 1.49, Nikon). The microscope is equipped with 400 mW, 561 nm and 480 mW, 488 nm lasers (Coherent Sapphire) and a back illuminated EMCCD camera (iXon 3, Andor Technology). Live-cell imaging was performed at 37°C, using 488 and 561nm lasers for eGFP and tRFP excitation, respectively. Imaging settings were adapted to yield best image quality with minimal photobleaching at laser-power between 2 - 10%, and 3 - 10 seconds per frame. Per field of view, 15 raw images were acquired in 3D-SIM imaging mode to ensure highest signal-to-noise ratio and resolution. Final, super-resolved SIM-images were reconstructed using the commercial Nikon NIS-Elements software (v. 3.2.2) and analysed in Fiji (ImageJ 2.0.0.-rc-69/1.52p). Open source MicrobeJ software 40, originally developed for analysis of bacteria, was used for supervised automatic segmentation of mitochondria and location of their associated foci (see Supplementary Fig. 4).
FRAP and confocal microscopy
For FRAP assays, cells were seeded on coverslips and grown to 60-80% confluence. Coverslips were mounted on a Zeiss LSM 700 inverted confocal microscope with a Plan-Apochromat oil objective (63x, NA 1.40). Microscope acquisitions were controlled by the Zen (2009 v. 6.0.0) software from Zeiss. The microscope is equipped with 488 nm and 555 nm solid-state lasers and 3 photomultipliers for simultaneous transmission and epifluorescence recording. A sliding prism and green and red bandpass filters were used to ensure clean fluorescence emission. For live assays, an Okolab stage top incubator H301 was used to maintain sample temperature at 37°C. Cells were maintained in CO2 independent Leibovitz L-15 medium (Gibco). For FASTKD2- (n eGFP = 44, ntRFP = 31, n tRFP-Drp1KD = 40), ERAL1- (n = 17), and DDX28- (n = 16) FRAP the pixel size was reduced to 70 nm (Zoom 12) and line scans recorded at a pixel dwell time of 2.55 μs (maximum speed), resulting in a scan time of 97.75 ms per 128 x 128 pixel FOV. The pinhole was opened for FRAP recording. 10 x 10 pixel ROIs were manually drawn around single MRGs for FRAP and two or three pre-bleach time-points were acquired for normalisation. FASTKD2-eGFP in COS-7- (n = 75) & U2OS- (n = 38), and TWINKLE-eGFP (n = 50) FRAP were acquired with twice as many pixels (254x254, and 20 x 20 ROI) but for the same sample-region (Zoom = 12). A different FOV was chosen for every FRAP-experiment, multiple different cells could be imaged per sample but samples were exchanged after ~1h of imaging, and when low mitochondrial motility was noticeable, to avoid confounding effects of deteriorating cell-health. If MRGs had left the ROI before bleaching, the assay was aborted and a different MRG was chosen. Recovery was monitored over 50-60 s at 1 fps.
For confocal microscopy of fixed cells, samples were prepared as described above. Alexa Fluor 488, Alexa Fluor 594 or Alexa Fluor 647 secondary conjugated antibodies (Invitrogen) were used to visualise the immunolabelled targets. Imaging was performed using a Leica TCS SP8 inverted microscope with a Plan-Apochromat oil objective (63x, NA 1.4), using the Lightning mode (Leica) to generate deconvolved images. Microscope acquisitions were controlled by the LAS X (v. 3.5.2) software from Leica. The microscope is equipped with 405 nm, 488 nm, 552 nm and 638 nm lasers. Imaging for Supplementary Fig. 6 was performed using Molecular Devices ImageXpress Micro XL automated widefield microscope, equipped with an air objective (60x).
FRAP analysis and software
For FRAP recording of moving objects, a custom Fiji-script was co-developed with Olivier Burri from the bioimaging and optics platform (BIOP) at EPFL. In brief, this script "TrackFRAP" is based on the Fiji plugin TrackMate, and automatically follows the bleaching ROI during recovery. It allows the user to choose other foci as FRAP references for overall bleaching correction and outputs both, a list of intensity values, and metadata to allow reproducible data analysis. All tracks were manually inspected to ensure the bleached granule was recorded correctly over the full course of acquisition. If no reference granule could be tracked over the full acquisition period, the dataset was excluded from analysis. We then developed a python script to load and analyse TrackFRAP data, which we termed FRAPtrackAnalyser [FRAPtA] and is based on the FRAPAnalyser tool (A. Halavatyi, M Yotskou, E Friederich, FRAPAnalyser, 2008 https://omictools.com/frapanalyser-tool). Single or double exponentials were fit and plotted for each data-set, as well as used to extract recovery times.
Correlative confocal Light and Electron Microscopy (CLEM)
Cells were seeded on a gridded coverslip (MatTek, P35-1.5-14-CGRD-D), transfected with CFP-Drp1(K38A) plasmid if applicable, and grown to 50-60% confluence. Cells were then fixed at room temperature for 1 hour in fresh fixative (2% PFA, 1% glutaraldehyde in PBS 0.1M pH7.4), washed in PBS and imaged by confocal microscopy the same day. Z-stacks were acquired of whole cells, the pinhole was closed to 0.5 AU, and pixel size reduced to 50-100 nm in xy and 100-150 nm in z. Samples were then stored overnight in PBS, and at 4°C. They were then stained with osmium and potassium ferrocyanide, followed by osmium alone, each with cacodylate buffer. They were finally stained with 1% uranyl acetate, then washed in water, dehydrated through increasing concentrations of alcohol, and infiltrated with Epon resin. This was polymerised over night at 65°C. Serial, ultra-thin sections were then cut of the cell of interest, and the sections collected on single slot copper grids with a formvar support membrane. Images were recorded in a transmission electron microscope operating at 80kV (FEI Company, Tecnai Spirit).
Mitochondrial sub-fractionation and Western blotting
To perform mitochondrial sub-fractionation experiments, HeLa cells were grown to ~60% confluency in four 150 mm Petri dishes. Cells were washed in PBS and collected by mechanical scraping. For a first mitochondrial extraction, cells were broken in cold MB buffer (210 mM mannitol, 70 mM sucrose, 10 mM HEPES-KOH pH 7.4, 1 mM EDTA) in presence of protease inhibitors (Roche), using a syringe with a G25 n18 needle. Cell passage through the needle was repeated 20 times. Unbroken cells and nuclei were discarded in the pellet after centrifugation for 5 minutes at 1,000 g at 4°C, followed by a second centrifugation for 5 minutes at 2,500 g at 4°C. The mitochondria-rich fraction was pelleted by centrifugation for 10 minutes at 6,000 g at 4°C, then the pellet was washed in 1 mL of fresh MB buffer and centrifuged again for 15 minutes at 13,000 g at 4°C.
To further proceed with sub-mitochondrial fractionation and remove the OMM, mitoplasts were prepared by gently resuspending the mitochondria in cold 10 mM HEPES buffer pH 7.4, in presence of protease inhibitors (Roche) and 1U/μL of RNAsin (Promega), at a final concentration of 0.5 μg of mitochondria/μL. After incubation for 20 minutes on ice, mitoplasts were recovered in the pellet by centrifugation for 15 minutes at 15,000 g at 4°C. Finally, to obtain the IMM and matrix fractions, mitoplast were resuspended in MB buffer (in presence of protease and RNAse inhibitors) and sonicated using a water bath sonicator Bioruptor TM Twin with 30 second pulses for 15 cycles at 4°C. After sonication, the samples were ultra-centrifuged for 30 minutes at 45,000 g at 4°C, to obtain a pellet corresponding to the IMM-rich fraction and a supernatant corresponding to the matrix-rich fraction. Mitochondria-, IMM- and matrix-rich fractions were analysed by SDS-page using 4-20% gradient Novex TM Tris-Glycine gels (Thermo Fisher Scientific).
For immunoblotting, proteins were transferred electrophoretically to PVDF membranes (GE Healthcare) and exposed to the primary antibodies listed below, diluted in 5% non-fat dry milk in Tris Buffered Saline with Tween 20 (TBST). The blots were further incubated with anti-mouse or anti-rabbit HRP-conjugated secondary antibodies (Dako, P0447 and P0448 respectively; used 1:5,000-1:10,000 dilution), and visualised using ECL (GE Healthcare). Where required, images of Western blots were treated for contrast enhancement and band intensities were quantified using ImageJ.
Primary antibodies used for Western blots
anti-FASTKD2 (Proteintech, 17464-1-AP), anti-GRSF1 (Sigma, HPA036985), anti-FASTKD5 (Sigma, SAB2700438), anti-TFAM (Proteintech, 22386-1-AP), anti-mtSSB (Proteintech, 12212-1-AP), anti-PHB (Thermo Fisher Scientific, MS-261-PO), anti-OxPhos Complex IV subunit IV (clone 20E8C12,Thermo Fisher Scientific, A21348), anti-PDHE1α (GeneTex, GTX104015). All primary antibodies were diluted 1:2000.
STED microscopy
STED microscopy was performed on a Leica TCS SP8 STED 3X inverted microscope equipped with a HC PL-APO glycerol motC STED W objective (93x, NA 1.30) for fixed samples or a HC PL-APO oil objective (100x, NA 1.40) for live samples. The microscope is equipped with a white laser (470-670 nm) and 592 nm, and 775 nm (pulsed) depletion lasers for STED.
For fixed-cell STED microscopy, samples were prepared following the immunofluorescence protocol described above. Abberior STAR 580 and Abberior STAR RED secondary antibodies (Abberior) were used in combination to label the primary antibodies. Coverslips were mounted on slides using Prolong Gold Antifade mounting agent (Thermo Fisher Scientific). STED depletion lasers were set to 70% of maximum power. The pinhole was opened to 1 AU for image acquisition. Lightning mode (Leica) was used to deconvolve STED images.
For live-cell STED microscopy, we followed the sample preparation and adapted the imaging protocol as recently published in 32. In brief, HeLa Cox8a-SNAP cells were seeded onto coverslips the day prior to imaging. Following antimycin A treatment, cells were incubated at 37°C for 15-30 minutes with 1 μM of SNAP-Cell SiR (New England Biolabs), followed by a 15-30 minutes washing step in dye-free medium. Cells were imaged at 37°C in Life cell imaging solution (Thermo Fisher Scientific). For live-cell STED-acquisitions the pinhole was set to 1 Airy unit, the zoom was set to 5-9x and pixel size automatically adapted. SiR was excited at 640 nm with 775 nm depletion at 60-70%. Fine tuning the gating (1-5 ns) and emission-filter bandwidths proved vital. Dwell times were around 8 μs, and 8x line-accumulation was used to obtain the best images. FASTKD2-eGFP signal to visualise the MRGs was acquired in confocal mode and each line was scanned once. No deconvolution was used. Images presented are raw data, adjusted for brightness and contrast using the FiJi software.
Statistics and Reproducibility
All plotting and statistical analysis was performed using Python 3, with Jupyter Notebook 6.0 used to document analyses. Mann-Whitney-U, Students-T and Kolmogorov-Smirnov tests were used as indicated, and computed using the Python scipy-library. seaborn- and matplotlib-libraries were used to plot figures and to add statistical significance indicators we used the statannot-library (M. Weber, "statannot", 2019, https://github.com/webermarcolivier/statannot). To avoid conflicts with non-Gaussian distributions we report the median values, unless stated otherwise. Correlation coefficients are calculated as the Pearson's R using numpy-library. Analysis is reproducible through automated analysis scripts.
Extended Data
Extended Data Fig. 1. Workflow and quantification of nanoscopic architecture of MRGs.
a, Workflow used for this study. Previously unpublished parts of the analysis are highlighted by asterisks, while other parts were previously published 17, 37.
b - f Additional quantification of MRG and nucleoid (mtDNA) architecture from htSTORM data. Markers (mtRNA, FASTKD2 and GRSF1), number of granules n and median values are indicated for each condition; n.s. denotes p-values > 0.05, * denotes p-values = 0.05, ** denote p-values = 0.01, *** denote p-values = 0.001,**** denote p-values = 0.0001 of two-sided Mann-Whitney-U test. Individual data points are plotted grey, box plots denote first and third quartiles, and the median, whiskers comprise rest of distributions except outliers. Multiple acquisitions, samples and imaging days were pooled. b, Median eccentricity of both MRG-proteins differ slightly (p = 5.1e-3), with largely overlapping boxes and can be approximated by spheres. Nucleoids and nascent RNA components of MRGs are more elongated (pBrU-FASTKD2 = 1.4e-15, pBrU-GRSF1 = 1.7e-6). c, Comparison of areas described by convex hull. MRG-protein foci are significantly larger than nascent-RNA foci (pBrU-FASTKD2 = 2.7x10-61, pBrU-GRSF1 = 6.5x10-49), yet less different from one another (pGRSF1-FASTKD2 = 6.9x10⁻⁷). The distribution of mtRNA- and mtDNA-foci areas strongly overlap, though their medians are significantly different with pmtRNA-mtDNA = 1.2x10⁻⁶. Three outliers for FASTKD2 (> 2.5 μm2) were removed for better visualisation, but included in all quantitative analysis. d, and e, Show comparison of alternative standard point-cloud descriptors Radius of gyration (Rg), and Sigma as the average of the eigenvalues in two dimensions, and multiplied by two to yield a diameter. f, Density of localisations was also compared, and both GRSF1 and FASTKD2-foci follow a narrow normal distribution, while mtDNA & BrU show a larger variance of density. Number (n) of clusters quantified for each condition is represented in the figure and is pooled from 24, 13, 7, and 14 FOVs, and 4, 4, 3, and 2 samples for BrU, GRSF1, FASTKD2, and mtDNA respectively. Statistical source data are provided in Source data Extended data fig. 1.
Extended Data Fig. 2. Comparison and correlation of two-colour htSTORM data.
a, Nine additional examples of two-colour htSTORM of MRGs. Scatter plots of localisations (right) are shown next to corresponding clusters of FASTKD2 (green) and mtRNA (BrU, blue) overlaid on widefield images (left). Convex hull areas are represented with dashed lines. b, and c, Scatter plots of all FASTKD2-mtRNA (BrU) pairs with regression-fit (black) and standard deviation (grey). Histograms of the distribution for FASTKD2 (y-axis, right, green), and mtRNA (x-axis, top, blue), including a kernel density estimate are shown. No correlation of Diameter (FWHM) (R = 0.26) or eccentricity (length/width, R = 0.43) was found between FASTKD2 and BrU foci from individual granules (n=26 MRGs over 4 independent experiments) d-f, Comparison of foci characteristics for one- versus two-colour htSTORM by Two-sided Mann-Whitney-U test from two-colour to one-colour data. Number of granules n (pooled from 20 FOVs, and 8 samples) and median values are indicated for each condition; n.s. denotes p-values > 0.05, * denotes p-values = 0.05, ** denote p-values = 0.01, *** denote p-values = 0.001,**** denote p-values = 0.0001. d, FWHM is not significant for FASTKD2 (p = 0.22) but two-colour BrU foci were significantly larger (p = 8.8e-4), and two-colour FASTKD2 were also larger than two-colour-mtRNA (p = 0.0014) e, Eccentricity is not significantly different (pmtRNA = 0.36, pFASTKD2 = 1.0) f, Size determined by convex hull, differed between one-colour and two-colour BrU (p = 2.4e-4) as well as FASTKD2 (p = 0.017). This may in parts be due to the heavy weight of two outliers as visible in the plot. Statistical source data are provided in Source data Extended data fig. 2.
Extended Data Fig. 3. FRAP of MRG-associated proteins.
a, Representative time lapse images of MRGs FRAP experiments in U2OS cells stably expressing FASTKD2-eGFP (green) (n= 39 MRGs examined over 3 independent experiments). White arrowheads indicate the photobleached structures. Scale bar: 5 μm. b, FRAP analysis of FASTKD2-eGFP in U2OS (n= 39 MRGs examined over 3 independent experiments) and COS-7 cells (n = 44 MRGs examined over 8 independent experiments). Symbols in the graph represent mean data points. Single exponential fits (lines) and standard deviations for each time point (shaded area) are shown. c, d, Representative time lapse images of ERAL1- (n = 17 MRGs examined over 3 independent experiments) and DDX28-eGFP (n = 17 MRGs examined over 3 independent experiments) FRAP experiments in COS-7 cells. White arrowheads indicate the photobleached structures. These images correspond to the data plotted in Fig. 2c. Scale bar: 2 μm.
Extended Data Fig. 4. MRG and nucleoid dynamics in live cells.
a, Representative time lapse images of an MRG fusion event in a live U2OS cell, monitored by SIM. MRGs are visualized by stable expression of FASTKD2-eGFP (n= 7 cells). b, Representative time lapse images of an MRG splitting event in a live COS-7 cell, monitored by SIM. MRGs are visualized by stable expression of FASTKD2-eGFP (n= 6 cells). c, d, Representative time lapse images of nucleoid “kiss-and-run” (n=1 cell) and splitting events (n=2 cells), respectively, in COS-7 cells, monitored by SIM. Nucleoids are visualized by transient expression of TWINKLE-eGFP and mitochondrial outlines are highlighted by TOMM20-eGFP expression. a-d, Cells were imaged at 1/5 Hz. White arrowheads indicate the dynamic events. Dashed lines indicate the segments used to measure the intensity (grey values) represented in the plots below. Scale bars: 2 μm. Statistical source data are provided in Source data Extended data fig. 4.
Extended Data Fig. 5. CLEM of FASTKD2-tRFP and MRG electron densities.
Correlative confocal fluorescence micrograph of FASTKD2-tRFP and transmission electron micrograph (TEM) in COS-7 control (a - c)(7 MRGs were examined from 3 mitochondria of a single cell) and Drp1K38A-CFP positive (d, e)(10 MRGs were examined from 2 mitochondria of a single cell) cells. TEM-highlights correspond to the data presented in Fig. 3a and Fig. 4e respectively, and show additional examples. Contiguous 50 nm TEM microtome sections show electron densities corresponding to the MRGs visualized by fluorescence microscopy (yellow arrowheads). Scale bars: Confocal: 10 μm; Confocal zoom: 2 μm; CLEM and TEM sections: 500 nm.
Extended Data Fig. 6. Membrane association and distribution of MRGs within mitochondria.
a, STED microscopy of HeLa cells stably expressing Cox8a-SNAP (grey) and FASTKD2-eGFP (green), treated with 100 μM antimycin A for 1 hour, prior to labelling with SIR-SNAP dye and live cell imaging (The experiment has been performed twice with similar results). A zoomed field of view on the right (dashed box). Scale bar: 2 μm. b-c, FASTKD2-eGFP expressing COS-7 cells untreated (b) or treated with 25 μM antimycin A for 24 hours (c), imaged live using SIM microscopy. Zoomed time lapse series are shown for two mitochondria (dashed boxes) (The experiment has been performed twice with similar results). Kymographs below (plotted lines are represented on the analysed mitochondria as yellow dashed lines). Scale-bar: 2 μm. d, Example FOV of semi-automated mitochondria segmentation and MRG-association with their parent organelle with the ImageJ plugin, MicrobeJ. (The experiment has been performed three times with similar results). e, and f, Histograms of absolute or relative position of MRGs (n = 231 MRGs examined over 3 independent experiments) within their host mitochondria (green) and simulated, randomly positioned granules (grey). The observed distribution of MRG positions is not significantly different from the simulated random distribution (Kolmogorov-Smirnov test: pabs = 0.057, pnorm = 0.053). Statistical source data are provided in Source data Extended data fig. 6.
Extended Data Fig. 7. Effect of perturbations to mitochondrial dynamics on MRG distribution.
Representative widefield-microscopy images of HeLa cells silenced using siRNAs against Drp1 (second row) or Mfn2 (third row). Cells were fixed after 72 hours of silencing. A negative control siRNA was used in parallel, and is shown in the first row. MRGs and nucleoids were immunolabeled using anti-FASTKD2 (green) and anti-DNA (magenta), respectively. Mitochondria were labelled using Mitotracker Deep Red staining (cyan) (The experiment has been performed twice with similar results). Scale-bar: 10 μm. Disrupted MRG and nucleoid positioning, and clumped appearance as described for mitobulbs is apparent when either Drp1 and Mfn2 are silenced, but the negative control shows well-dispersed MRGs and nucleoids.
Supplementary Material
Exemplary movie of FRAP recovery of COS-7 cells stably expressing FASTKD2-eGFP, as shown in Fig. 2a. Time 0 marks the moment of photobleaching. Scale bar: 2 μm.
Statistical source data Fig.1b and f.
Statistical source data Extended data Fig. 1.
Supplementary Table 1: two-colour STORM data. Data for all the individual two-colour mtRNA and FASTKD2 clusters (n=26) analysed and represented in Fig. 1f and Supplementary Fig. 2.
Supplementary Table 2: Summary of fusion events, and association with mitochondrial remodelling.
Statistical source data Fig.2c, d and f.
Statistical source data Extended data Fig. 2.
Exemplary movie of FRAP recovery of U2OS cells stably expressing FASTKD2-eGFP. Time 0 marks the moment of photobleaching. Scale bar: 2 μm.
Unprocessed Western Blots
Statistical source data Fig.3e, f and g.
Exemplary movie of FRAP recovery of COS-7 cells stably expressing ERAL1-eGFP, as shown in Fig. 2c. Time 0 marks the moment of photobleaching. Scale bar: 2 μm.
Statistical source data Fig.4d.
Exemplary movie of FRAP recovery of COS-7 cells stably expressing DDX28-eGFP, as shown in Fig. 2c. Time 0 marks the moment of photobleaching. Scale bar: 2 μm.
Exemplary movie of MRG fusion in COS-7 cells stably expressing FASTKD2-eGFP, as shown in Fig. 2e. Scale bar: 2 μm.
Exemplary movie of MRG fusion in U2OS cells stably expressing FASTKD2-eGFP. Scale bar: 2 μm.
Statistical source data Extended data Fig. 6.
Exemplary movie of MRG fission in COS-7 cells stably expressing FASTKD2-eGFP. Scale bar: 2 μm.
Exemplary movie of nucleoid fusion in COS-7 cells transiently transfected with TWINKLE-eGFP. Scale bar: 2 μm.
Exemplary movie of nucleoid kissing in COS-7 cells transiently transfected with TWINKLE-eGFP. Scale bar: 2 μm.
Exemplary SIM movie of MRGs in swollen mitochondria in COS-7 cells stably expressing FASTKD2-eGFP, after 1 hour of 100 μM antimycin A treatment. Scale bar: 2 μm.
Exemplary SIM movie of MRGs in swollen mitochondria in COS-7 cells stably expressing FASTKD2-eGFP, after 1 day (24h) of 25 μM antimycin A treatment. Scale bar: 2 μm.
Exemplary movie of FRAP recovery of COS-7 cells stably expressing FASTKD2-tRFP, as shown in Fig. 4d, c. Time 0 marks the moment of photobleaching. Scale bar: 2 μm.
Movie of FRAP recovery of COS-7 cells stably expressing FASTKD2-tRFP, and transfected with DRP1K38A dominant negative mutant as shown in Fig. 4c. Time 0 marks the moment of photobleaching. Scale bar: 2 μm.
Acknowledgments
We thank Hélène Perreten for molecular cloning, François Prodon for help with STED microscopy, Olivier Burri for the initial FRAPtrack-code, and the BIOP (EPFL) for imaging support. We thank Rishi Jajoo for his generous sharing of original code and data, and Till Stephan and Stefan Jakobs for the unreserved provision of Cox8a-SNAP cell lines and plasmids. Mariona Colomer, and Marian Martinez for their contribution to assess MRG-distribution. We are grateful to Christian Sieben, Kyle Douglass, Tatjana Kleele, Juliette Griffié and all members of the Manley- and Martinou-groups for discussions. Flow cytometry cell sorting was performed at the EPFL Flow Cytometry Core Facility; Electron microscopy was performed at the EPFL BioEM facility; Fluorescence microscopy was partially performed at the EPFL Bio Optics Platform (BIOP) and UniGe Bio Imaging Core facility.
Footnotes
Contributions
S.Z., T.R., J.C.M., and S.M. conceived and designed the study and wrote the manuscript. All authors reviewed and edited the manuscript. T.R., and S.Z. designed, executed, analysed, and validated the experiments, E.C. executed and coded FRAP experiments and analysis. E.V. performed fractionation and Western-blotting. M.C. embedded, sectioned and acquired transmission electron microscopy samples. T.R. and S.Z. prepared the figures and plots. S.M. and J.C.M. supervised the project.
Ethics declarations
Competing interests
All authors declare no competing interests
Materials availability
Plasmids and cell lines are available, please contact the corresponding authors should you have further enquiries.
Data availability
All imaging as well as numerical data relevant to this study are publicly available in the online repository Zenodo (https://doi.org/10.5281/zenodo.3747143), or upon reasonable request. A README-file on Zenodo will guide the reader. Additionally, source data are provided with this study. All remaining other data supporting the findings of this study are available from the corresponding author on reasonable request.
Code availability
All code including adapted STORM-analysis code, TrackFRAP, FRAPtA and other python scripts and Fiji macros for analysis and figure generation are available in the online repository Github (https://github.com/TimoHenry/MitochondrialRNAgranules), or upon reasonable request. Jupyter Notebooks are available in the data repository on Zenodo to trace the application of the code to the data in our manuscript.
References
- 1.Antonicka H, Sasarman F, Nishimura T, Paupe V, Shoubridge EA. The mitochondrial RNA-binding protein GRSF1 localizes to RNA granules and is required for posttranscriptional mitochondrial gene expression. Cell Metab. 2013;17:386–398. doi: 10.1016/j.cmet.2013.02.006. [DOI] [PubMed] [Google Scholar]
- 2.Iborra FJ, Kimura H, Cook PR. The functional organization of mitochondrial genomes in human cells. BMC Biol. 2004;2 doi: 10.1186/1741-7007-2-9. [DOI] [PMC free article] [PubMed] [Google Scholar]
- 3.Jourdain AA, et al. GRSF1 regulates RNA processing in mitochondrial RNA granules. Cell Metab. 2013;17:399–410. doi: 10.1016/j.cmet.2013.02.005. [DOI] [PMC free article] [PubMed] [Google Scholar]
- 4.Hyman AA, Weber CA, Jülicher F. Liquid-liquid phase separation in biology. Annu Rev Cell Dev Biol. 2014;30:39–58. doi: 10.1146/annurev-cellbio-100913-013325. [DOI] [PubMed] [Google Scholar]
- 5.Handwerger KE, Cordero JA, Gall JG. Cajal bodies, nucleoli, and speckles in the Xenopus oocyte nucleus have a low-density, sponge-like structure. Mol Biol Cell. 2005;16:202–211. doi: 10.1091/mbc.E04-08-0742. [DOI] [PMC free article] [PubMed] [Google Scholar]
- 6.Yamazaki T, et al. Functional Domains of NEAT1 Architectural lncRNA Induce Paraspeckle Assembly through Phase Separation. Mol Cell. 2018;70:1038–1053 e1037. doi: 10.1016/j.molcel.2018.05.019. [DOI] [PubMed] [Google Scholar]
- 7.Feric M, et al. Coexisting Liquid Phases Underlie Nucleolar Subcompartments. Cell. 2016;165:1686–1697. doi: 10.1016/j.cell.2016.04.047. [DOI] [PMC free article] [PubMed] [Google Scholar]
- 8.Frottin F, et al. The nucleolus functions as a phase-separated protein quality control compartment. Science. 2019 doi: 10.1126/science.aaw9157. [DOI] [PubMed] [Google Scholar]
- 9.Banani SF, Lee HO, Hyman AA, Rosen MK. Biomolecular condensates: organizers of cellular biochemistry. Nat Rev Mol Cell Biol. 2017;18:285–298. doi: 10.1038/nrm.2017.7. [DOI] [PMC free article] [PubMed] [Google Scholar]
- 10.Boeynaems S, et al. Protein Phase Separation: A New Phase in Cell Biology. Trends Cell Biol. 2018;28:420–435. doi: 10.1016/j.tcb.2018.02.004. [DOI] [PMC free article] [PubMed] [Google Scholar]
- 11.Langdon EM, et al. mRNA structure determines specificity of a polyQ-driven phase separation. Science. 2018;360:922–927. doi: 10.1126/science.aar7432. [DOI] [PMC free article] [PubMed] [Google Scholar]
- 12.Maharana S, et al. RNA buffers the phase separation behavior of prion-like RNA binding proteins. Science. 2018;360:918–921. doi: 10.1126/science.aar7366. [DOI] [PMC free article] [PubMed] [Google Scholar]
- 13.Wang J, et al. A Molecular Grammar Governing the Driving Forces for Phase Separation of Prion-like RNA Binding Proteins. Cell. 2018;174:688–699 e616. doi: 10.1016/j.cell.2018.06.006. [DOI] [PMC free article] [PubMed] [Google Scholar]
- 14.Alberti S, Gladfelter A, Mittag T. Considerations and Challenges in Studying Liquid-Liquid Phase Separation and Biomolecular Condensates. Cell. 2019;176:419–434. doi: 10.1016/j.cell.2018.12.035. [DOI] [PMC free article] [PubMed] [Google Scholar]
- 15.McSwiggen DT, et al. Evidence for DNA-mediated nuclear compartmentalization distinct from phase separation. eLife. 2019;8 doi: 10.7554/eLife.47098. [DOI] [PMC free article] [PubMed] [Google Scholar]
- 16.Jourdain AA, et al. A mitochondria-specific isoform of FASTK is present in mitochondrial RNA granules and regulates gene expression and function. Cell Rep. 2015;10:1110–1121. doi: 10.1016/j.celrep.2015.01.063. [DOI] [PubMed] [Google Scholar]
- 17.Jajoo R, et al. Accurate concentration control of mitochondria and nucleoids. Science. 2016;351:169–172. doi: 10.1126/science.aaa8714. [DOI] [PMC free article] [PubMed] [Google Scholar]
- 18.Lewis SC, Uchiyama LF, Nunnari J. ER-mitochondria contacts couple mtDNA synthesis with Mitochondrial division in human cells. Science. 2016;353 doi: 10.1126/science.aaf5549. [DOI] [PMC free article] [PubMed] [Google Scholar]
- 19.Douglass KM, Sieben C, Archetti A, Lambert A, Manley S. Super-resolution imaging of multiple cells by optimized flat-field epi-illumination. Nat Photon. 2016;10:705–708. doi: 10.1038/nphoton.2016.200. [DOI] [PMC free article] [PubMed] [Google Scholar]
- 20.Alán L, Špaček T, Ježek P. Delaunay algorithm and principal component analysis for 3D visualization of mitochondrial DNA nucleoids by Biplane FPALM/dSTORM. Eur Biophys J. 2016;45:443–461. doi: 10.1007/s00249-016-1114-5. [DOI] [PubMed] [Google Scholar]
- 21.Brown TA, et al. Superresolution Fluorescence Imaging of Mitochondrial Nucleoids Reveals Their Spatial Range, Limits, and Membrane Interaction. Mol Cell Biol. 2011;31:4994–5010. doi: 10.1128/MCB.05694-11. [DOI] [PMC free article] [PubMed] [Google Scholar]
- 22.Kukat C, et al. Super-resolution microscopy reveals that mammalian mitochondrial nucleoids have a uniform size and frequently contain a single copy of mtDNA. Proc Natl Acad Sci U S A. 2011;108:13534–13539. doi: 10.1073/pnas.1109263108. [DOI] [PMC free article] [PubMed] [Google Scholar]
- 23.Ghezzi D, et al. FASTKD2 nonsense mutation in an infantile mitochondrial encephalomyopathy associated with cytochrome c oxidase deficiency. Am J Hum Genet. 2008;83:415–423. doi: 10.1016/j.ajhg.2008.08.009. [DOI] [PMC free article] [PubMed] [Google Scholar]
- 24.Yoo DH, et al. Identification of FASTKD2 compound heterozygous mutations as the underlying cause of autosomal recessive MELAS-like syndrome. Mitochondrion. 2017;35:54–58. doi: 10.1016/j.mito.2017.05.005. [DOI] [PubMed] [Google Scholar]
- 25.Ester M, Kriegel H-P, Sander J, Xu X. A density-based algorithm for discovering clusters in large spatial databases with noise. Proc. 2nd Int. Conf. on Knowledge Discovery and Data Mining; 1996. pp. 226–231. [Google Scholar]
- 26.Brangwynne CP. Germline P granules are liquid droplets that localize by controlled dissolution/condensation. Science. 2009;324:1729–1732. doi: 10.1126/science.1172046. [DOI] [PubMed] [Google Scholar]
- 27.Tu YT, Barrientos A. The Human Mitochondrial DEAD-Box Protein DDX28 Resides in RNA Granules and Functions in Mitoribosome Assembly. Cell Rep. 2015;10:854–864. doi: 10.1016/j.celrep.2015.01.033. [DOI] [PMC free article] [PubMed] [Google Scholar]
- 28.Zaganelli S, et al. The Pseudouridine Synthase RPUSD4 Is an Essential Component of Mitochondrial RNA Granules. J Biol Chem. 2017;292:4519–4532. doi: 10.1074/jbc.M116.771105. [DOI] [PMC free article] [PubMed] [Google Scholar]
- 29.Farge G, et al. The N-terminal domain of TWINKLE contributes to single-stranded DNA binding and DNA helicase activities. Nucleic Acids Res. 2008;36:393–403. doi: 10.1093/nar/gkm1025. [DOI] [PMC free article] [PubMed] [Google Scholar]
- 30.Wheeler JR, Matheny T, Jain S, Abrisch R, Parker R. Distinct stages in stress granule assembly and disassembly. eLife. 2016;5 doi: 10.7554/eLife.18413. [DOI] [PMC free article] [PubMed] [Google Scholar]
- 31.Garrido N, et al. Composition and dynamics of human mitochondrial nucleoids. Mol Biol Cell. 2003;14:1583–1596. doi: 10.1091/mbc.E02-07-0399. [DOI] [PMC free article] [PubMed] [Google Scholar]
- 32.Stephan T, Roesch A, Riedel D, Jakobs S. Live-cell STED nanoscopy of mitochondrial cristae. Sci Rep. 2019;9 doi: 10.1038/s41598-019-48838-2. [DOI] [PMC free article] [PubMed] [Google Scholar]
- 33.Souquere S, et al. Unravelling the ultrastructure of stress granules and associated P-bodies in human cells. J Cell Sci. 2009;122:3619–3626. doi: 10.1242/jcs.054437. [DOI] [PubMed] [Google Scholar]
- 34.Gerhold JM, et al. Human Mitochondrial DNA-Protein Complexes Attach to a Cholesterol-Rich Membrane Structure. Sci Rep. 2015;5 doi: 10.1038/srep15292. [DOI] [PMC free article] [PubMed] [Google Scholar]
- 35.Hytti M, et al. Antimycin A-Induced Mitochondrial Damage Causes Human RPE Cell Death despite Activation of Autophagy. Oxid Med Cell Longev. 2019;2019 doi: 10.1155/2019/1583656. [DOI] [PMC free article] [PubMed] [Google Scholar]
- 36.Ban-Ishihara R, Ishihara T, Sasaki N, Mihara K, Ishihara N. Dynamics of nucleoid structure regulated by mitochondrial fission contributes to cristae reformation and release of cytochrome c. Proc Natl Acad Sci U S A. 2013;110:11863–11868. doi: 10.1073/pnas.1301951110. [DOI] [PMC free article] [PubMed] [Google Scholar]
- 37.Jain S, et al. ATPase-Modulated Stress Granules Contain a Diverse Proteome and Substructure. Cell. 2016;164:487–498. doi: 10.1016/j.cell.2015.12.038. [DOI] [PMC free article] [PubMed] [Google Scholar]
- 38.Durigon R, et al. LETM1 couples mitochondrial DNA metabolism and nutrient preference. EMBO Mol Med. 2018;10 doi: 10.15252/emmm.201708550. [DOI] [PMC free article] [PubMed] [Google Scholar]
- 39.Sieben C, Banterle N, Douglass KM, Gonczy P, Manley S. Multicolor single-particle reconstruction of protein complexes. Nat Meth. 2018;15:777–780. doi: 10.1038/s41592-018-0140-x. [DOI] [PMC free article] [PubMed] [Google Scholar]
- 40.Ducret A, Quardokus EM, Brun YV. MicrobeJ, a tool for high throughput bacterial cell detection and quantitative analysis. Nat Microbiol. 2016;1 doi: 10.1038/nmicrobiol.2016.77. [DOI] [PMC free article] [PubMed] [Google Scholar]
Associated Data
This section collects any data citations, data availability statements, or supplementary materials included in this article.
Supplementary Materials
Exemplary movie of FRAP recovery of COS-7 cells stably expressing FASTKD2-eGFP, as shown in Fig. 2a. Time 0 marks the moment of photobleaching. Scale bar: 2 μm.
Statistical source data Fig.1b and f.
Statistical source data Extended data Fig. 1.
Supplementary Table 1: two-colour STORM data. Data for all the individual two-colour mtRNA and FASTKD2 clusters (n=26) analysed and represented in Fig. 1f and Supplementary Fig. 2.
Supplementary Table 2: Summary of fusion events, and association with mitochondrial remodelling.
Statistical source data Fig.2c, d and f.
Statistical source data Extended data Fig. 2.
Exemplary movie of FRAP recovery of U2OS cells stably expressing FASTKD2-eGFP. Time 0 marks the moment of photobleaching. Scale bar: 2 μm.
Unprocessed Western Blots
Statistical source data Fig.3e, f and g.
Exemplary movie of FRAP recovery of COS-7 cells stably expressing ERAL1-eGFP, as shown in Fig. 2c. Time 0 marks the moment of photobleaching. Scale bar: 2 μm.
Statistical source data Fig.4d.
Exemplary movie of FRAP recovery of COS-7 cells stably expressing DDX28-eGFP, as shown in Fig. 2c. Time 0 marks the moment of photobleaching. Scale bar: 2 μm.
Exemplary movie of MRG fusion in COS-7 cells stably expressing FASTKD2-eGFP, as shown in Fig. 2e. Scale bar: 2 μm.
Exemplary movie of MRG fusion in U2OS cells stably expressing FASTKD2-eGFP. Scale bar: 2 μm.
Statistical source data Extended data Fig. 6.
Exemplary movie of MRG fission in COS-7 cells stably expressing FASTKD2-eGFP. Scale bar: 2 μm.
Exemplary movie of nucleoid fusion in COS-7 cells transiently transfected with TWINKLE-eGFP. Scale bar: 2 μm.
Exemplary movie of nucleoid kissing in COS-7 cells transiently transfected with TWINKLE-eGFP. Scale bar: 2 μm.
Exemplary SIM movie of MRGs in swollen mitochondria in COS-7 cells stably expressing FASTKD2-eGFP, after 1 hour of 100 μM antimycin A treatment. Scale bar: 2 μm.
Exemplary SIM movie of MRGs in swollen mitochondria in COS-7 cells stably expressing FASTKD2-eGFP, after 1 day (24h) of 25 μM antimycin A treatment. Scale bar: 2 μm.
Exemplary movie of FRAP recovery of COS-7 cells stably expressing FASTKD2-tRFP, as shown in Fig. 4d, c. Time 0 marks the moment of photobleaching. Scale bar: 2 μm.
Movie of FRAP recovery of COS-7 cells stably expressing FASTKD2-tRFP, and transfected with DRP1K38A dominant negative mutant as shown in Fig. 4c. Time 0 marks the moment of photobleaching. Scale bar: 2 μm.
Data Availability Statement
All imaging as well as numerical data relevant to this study are publicly available in the online repository Zenodo (https://doi.org/10.5281/zenodo.3747143), or upon reasonable request. A README-file on Zenodo will guide the reader. Additionally, source data are provided with this study. All remaining other data supporting the findings of this study are available from the corresponding author on reasonable request.
All code including adapted STORM-analysis code, TrackFRAP, FRAPtA and other python scripts and Fiji macros for analysis and figure generation are available in the online repository Github (https://github.com/TimoHenry/MitochondrialRNAgranules), or upon reasonable request. Jupyter Notebooks are available in the data repository on Zenodo to trace the application of the code to the data in our manuscript.


