Abstract
Microbial communities often undergo intricate compositional changes yet also maintain stable coexistence of diverse species. The mechanisms underlying long-term coexistence remain unclear as system-wide studies have been largely limited to engineered communities, ex situ adapted cultures, or synthetic assemblies. Here we show how kefir, a natural milk-fermenting community of prokaryotes (predominantly lactic and acetic acid bacteria) and yeasts (family Saccharomycetaceae), realizes stable coexistence through spatiotemporal orchestration of species and metabolite dynamics. During milk fermentation, kefir grains (a polysaccharide matrix synthesized by kefir microbes) grow in mass but remain unchanged in composition. In contrast, the milk is colonized in a sequential manner in which early members open the niche for the followers by making available metabolites like amino acids and lactate. Through metabolomics, transcriptomics and large-scale mapping of inter-species interactions, we show how microbes poorly suited for milk survive in — and even dominate — the community, through metabolic cooperation and uneven partitioning between grain and milk. Overall, our findings reveal how inter-species interactions partitioned in space and time lead to stable coexistence.
Large microbial communities like gut microbiota are characterized by resilience and stable, long-term, coexistence (i.e. constant community membership despite changes in relative abundance)1–4. In contrast, ecological models have predicted diminishing stability with increasing community size5,6. Laboratory studies therefore remain crucial for understanding the emergence of stable coexistence and for closing the gap between theory and nature. Experiments with synthetic assemblies or communities with genetically engineered members have provided important empirical evidence for stability at higher species richness7, uncovering assembly rules8, and identifying cross-feeding9–12 interactions. The latter can manifest in, for example, efficient exploitation of resources13,14 and maintaining community diversity15. Environmental changes can also support coexistence by temporally partitioning the growth of distinct species16–18.
In large communities, inter-species and species-environment interactions simultaneously contribute to community diversity but also lead to intricate compositional dynamics2,4. This interplay has been difficult to dissect, as most experimental communities consist of few species, are cultivated ex situ under a variety of conditions, or require inoculation from synthetic assemblies11,19–21. Further, system-wide interactions have been mapped only in small communities. Thus, theory has hitherto been the main avenue for investigating stable coexistence in large communities22,23.
To gain insights into stability of natural communities, here we experimentally interrogated kefir as a model microbial ecosystem. Kefir grains currently in use have suggested origins in the Caucasian mountain region24–28, with evidence of early usage connected to a 3,500-year-old Chinese mummy29. Each kefir community encompasses approximately 30-50 species30, mainly lactic and acetic acid bacteria and yeasts (Fig. 1a). Despite this diverse membership, the cultivation and maintenance of kefir is straightforward as the grains act as a self-renewing community-scale inoculum (Methods). The kefir community has been shown to be resilient to various abiotic and biotic stresses including desiccation and non-sterile handling31. These and other features, summarized in Supplementary Table 1, collectively motivated our choice of kefir as a model ecosystem. We measure and integrate species dynamics, metabolomics, inter-species interactions, and transcriptomics to uncover principles underlying stable coexistence of this diverse community.
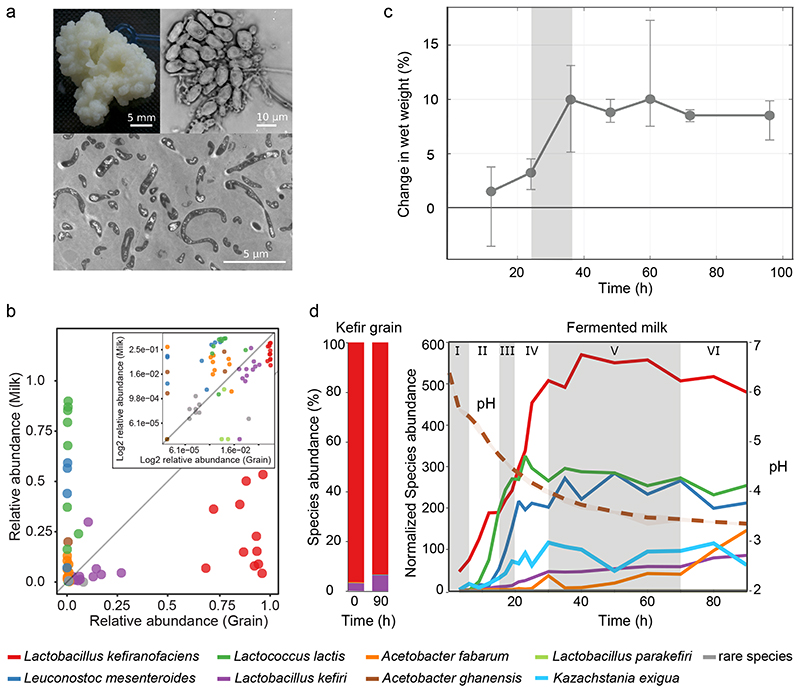
Fig. 1. Kefir community undergoes extensive compositional change during milk fermentation.
a, Example images of (top left) macroscopic kefir grain, (top right) light microscopy of a region with high yeast density, and (bottom) and transmission electron microscopy of bacteria embedded in the grain matrix. b, The relative abundances of major kefir bacteria (color key at bottom) in fermented milk are in stark contrast to that in the grain. Each point represents a distinct kefir grain (geographic origin and collection dates in Table S2). (Inset) log-scaled data. c, The reference kefir grain (kefir GER6, OG2) gains weight during milk fermentation. N=4 biologically independent samples; error bars = mean values +/- SD; grey shading marks the time-window of the grain growth (Data in Supplementary Table 18). d, Kefir community undergoes compositional change in milk yet features stable grain composition. (Left) Relative species abundances in the grain at the start and end of fermentation. (Right) Species dynamics in the fermented milk during kefir fermentation (stages labeled) are revealed by 16S amplicon sequencing (bacteria) and qPCR (yeast, K. exigua). Species-abundance estimates are normalized by total DNA yield from extracted samples. Shown values are average over eight replicates (four biological replicates, each with two technical replicates; the relative abundance and their variations are shown in Extended Data Fig. 3a). Dotted line shows pH change during fermentation. See also Supplementary Table 19.
Results
A core microbial community spans kefir grains from distinct locations
We started by profiling the compositional diversity of kefir grains collected from various geographical locations (Supplementary Table 2), and that of the corresponding fermented milk products. Supporting their hypothesized common origin, and in line with previous studies26–28, we found a bacterial core community consisting of Lactobacillus sp. (mainly L. kefiranofaciens and L. kefiri), Leuconostoc sp. (usually L. mesenteroides), Lactococcus lactis, and Acetobacter sp., which together accounted for > 95% of total abundance. The grains differed only in the harbored yeasts and low abundance bacteria (rare species) (Supplementary Fig. 1). Shotgun metagenomic sequencing of two selected grains further confirmed these results (Supplementary Table 3). The bacterial communities in the solid (grain) and the liquid (milk) fractions were strikingly different in composition in all cases (Fig. 1b and Supplementary Fig. 2), suggesting extensive community dynamics during fermentation.
Grain composition remains constant despite large compositional changes in milk fraction
Toward understanding how a kefir community colonizes milk, we profiled grain and species growth over a 90-h fermentation using grains collected in Germany (GER6). For the milk fraction, 18 sampling times were chosen with denser sampling during early fermentation when pH dropped rapidly. The species composition of the grain was analyzed in the beginning and at the end. Relative as well as absolute abundances of bacterial and yeast members were estimated by combining amplicon sequencing, qPCR analysis, and total DNA estimation (Methods).
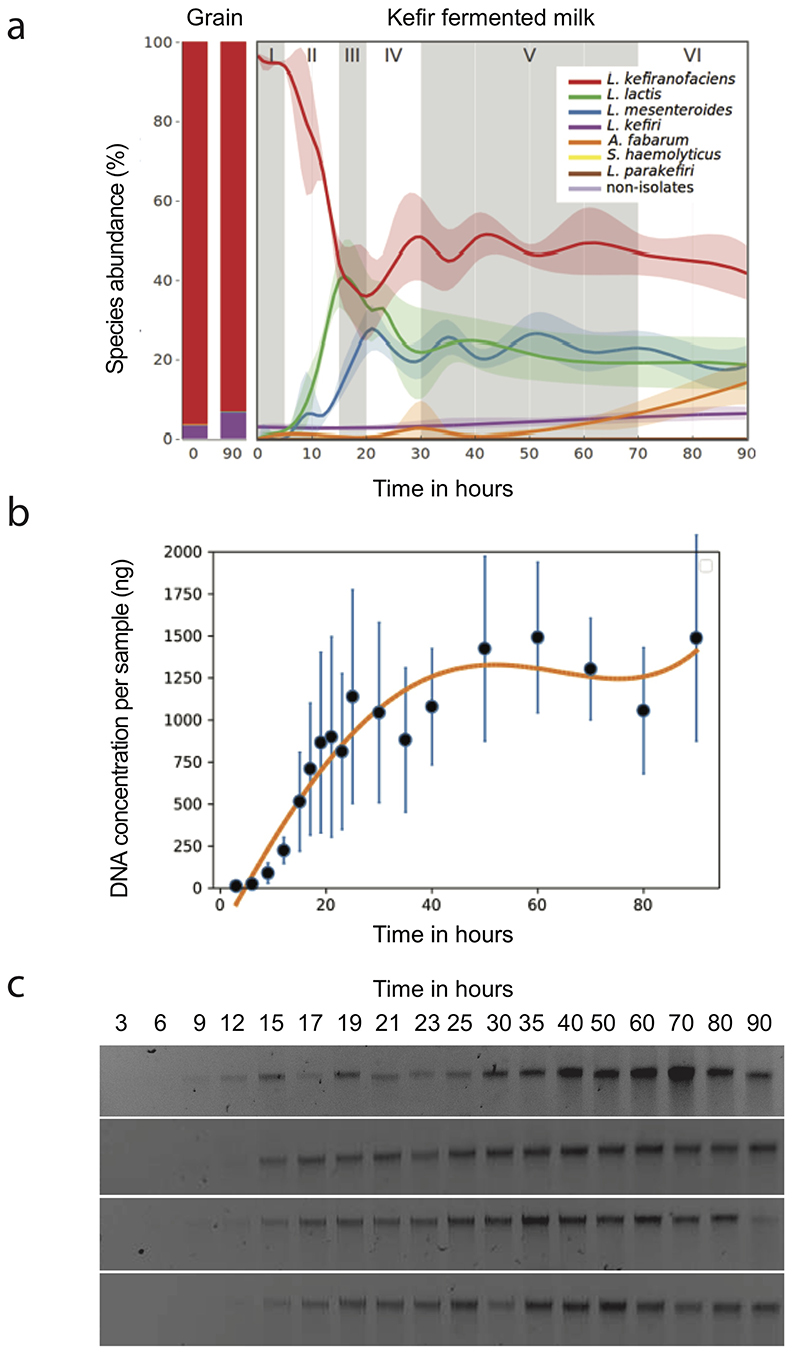
The grains followed a sigmoidal growth pattern with circa 10% mass gain in 36 h (Fig. 1c). Its microbial composition, however, remained unchanged. In contrast, the community in the fermented milk underwent substantial changes (Fig. 1d, Extended Data Fig. 1, Supplementary Fig. 3). The fermentation could be divided into six stages based on the trends in species growth. Stage I consists mostly of L. kefiranofaciens in line with its dominance in the grain. Stage II and III are marked by rapid growth of L. lactis and L. mesenteroides, respectively. L. kefiranofaciens reached its stationary phase near the end of the stage IV, coinciding with increase in L. kefiri. Growth of most species stagnates in stage V and A. fabarum and L. kefiri are the only appreciably growing species in stage VI. Overall, kefir fermentation shows a peculiar compositional dynamic, with the grain remaining unchanged while the milk fraction is sequentially colonized.
Metabolomics uncovers niche dynamics and suggests cross-feeding
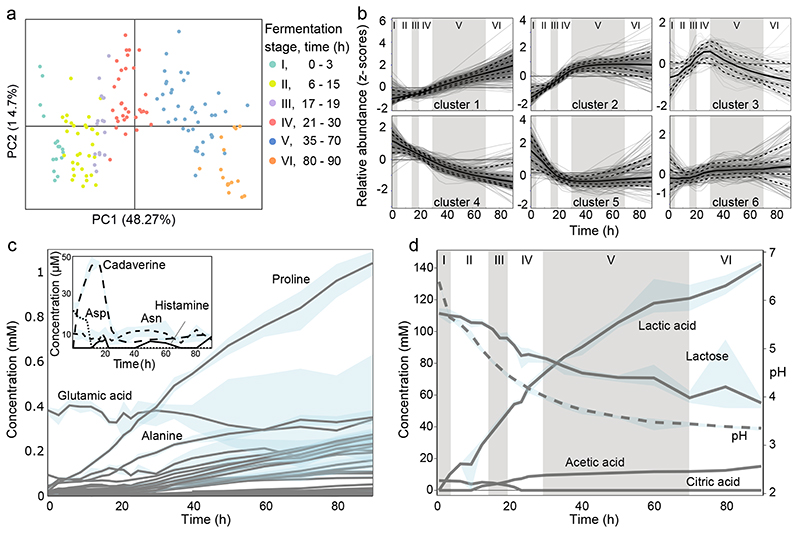
Extracellular metabolites in the fermenting milk were first monitored using untargeted analysis (Methods), which revealed extensive metabolic changes reflecting sequential colonization by the community (Fig. 2a). The measured ions displayed various patterns ranging from monotonic accumulation (notably ions putatively mapping to amino acids) to an inverted-U pattern (including ions putatively mapping to sugars and carboxylic acids) suggestive of cross-feeding (Fig. 2b, Supplementary Fig. 4 and Supplementary Table 4). The time points at which the rates of change in the putative metabolites shifted in magnitude or direction (inflection points) aligned well with the distinct growth stages observed in species dynamics (Supplementary Fig. 5).
Fig. 2. Metabolite changes during kefir fermentation depict niche dynamics.
a, Principal component analysis of untargeted metabolomics data shows sequential changes in the milk fraction. Samples are colored according to the six fermentation stages as determined by species dynamics (Fig. 1d). b, Changes in metabolite ions during fermentation reveals diverse patterns including continuous utilization (cluster 4) and bell-shaped pattern suggestive of cross-feeding (cluster 3). All ions detected by FIA-qTOF MS were grouped into 6 clusters via k-means clustering (Methods). Solid line, median values of the ions in each cluster; dashed lines, 10%, 25%, 75%, and 90% of the metabolites, respectively. The six fermentation stages are marked by roman numerals. For a-b, average values are shown from eight replicates (four biological replicates, each with two technical replicates). Quantitative assessment of c, free amino acids and polyamines, and d, carbohydrates and organic acid changes during kefir fermentation suggest major role of the depicted metabolites in orchestrating species dynamics. For c-d, average values are shown from four biological replicates. The blue shaded areas in c and d, indicate the data range. The molecules shown in the inlay of c are present at low concentrations. Only a small amount of histamine is produced during kefir fermentation, and though cadaverine – an undesired by-product - accumulated early on, its concentration dropped to very low levels by 24 h.
The untargeted method used here has shown to be generally in good agreement with targeted analysis, but may have false positives as the annotation is based only on m/z values32,33. We therefore measured amino acids, polyamines, sugars, and organic acids using ion chromatography and GC-MS (Methods). In the first 20 h, when the pH drop was most rapid, lactose metabolism shifted from homofermentative to heterofermentative as reflected in the lactate yield (Supplementary Fig. 6). This observation is in agreement with the shift in species abundance from homofermentative (L. lactis and L. kefiranofaciens) to heterofermentative bacteria (L. mesenteroides)34. Nevertheless, about half of the initial lactose was left unused, implying growth constraint by other nutrients or pH (Fig. 2d). The peculiarity of kefir fermentation was also seen in the lack of histamine accumulation, which is common in fermented products35.
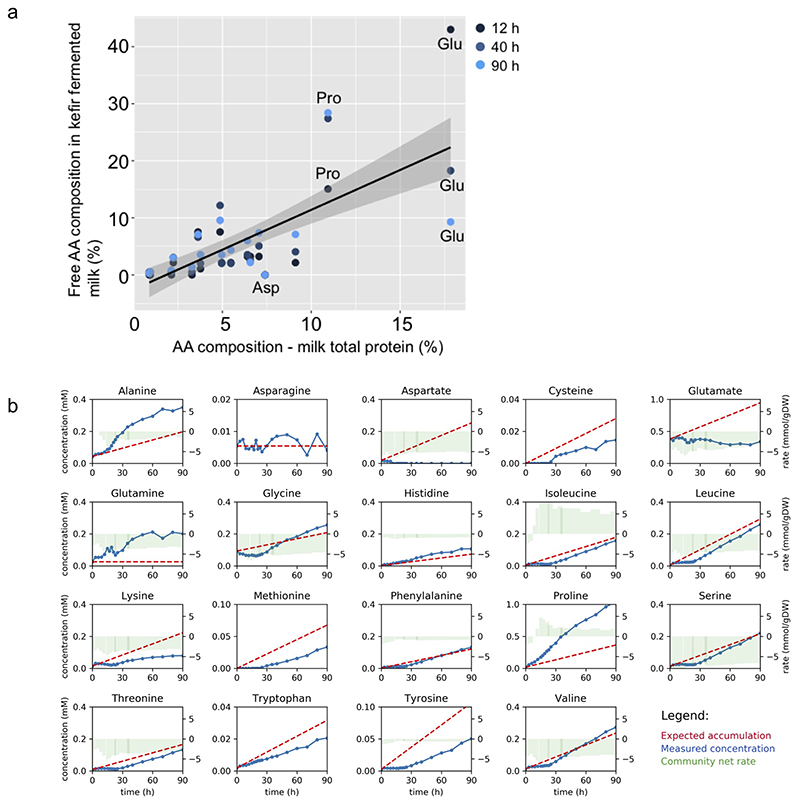
Consistent with the untargeted analysis, most amino acids accumulated throughout (Fig. 2c). Proteolysis by kefir species thus appears to surpass their requirement for amino acids. Exceptions were asparagine and glutamate, whose concentrations remained at initial levels, and aspartate, which was rapidly consumed in the first few hours and thereafter remained undetectable. The concentration profiles of free aspartate and glutamate are lower than their share in the milk protein36,37, and were also predicted by genome-scale metabolic modeling to be substantially consumed by kefir species (Extended Data Fig. 2). Aspartate and glutamate thus stand out as key requirements of kefir species.
Citrate depletion kick-starts community growth
The total amino acid accumulation markedly increased after around 20 h, which coincides with the depletion of citrate (Fig. 2d, Supplementary Fig. 7). We hypothesized that this link is due to metal ion chelating by citrate38, inhibiting metalloproteases secreted by community members like L. lactis 39. Supporting this, we observed that the growth of the grain, which is dependent on proteolysis, as well as that of several kefir species, is inhibited by EDTA (Extended Data Fig. 3, Supplementary Fig. 8). Depletion of citrate in the early fermentation is well correlated with the growth of L. lactis and L. mesenteroides that are known citrate utilizers40,41. Citrate removal thus appears to be one of the first metabolic functions crucial for kick-starting proteolysis and thereby kefir fermentation.
Individual growth performances indicate metabolic dependencies
Toward disentangling the contribution of individual members to kefir fermentation, we isolated 40 kefir bacterial and yeast strains. These covered all core community members as well as rare species like Rothia dentocariosa, together representing circa 99% of the community (Supplementary Table 5). All isolates were genome sequenced, including four species that we recently reported42,43.
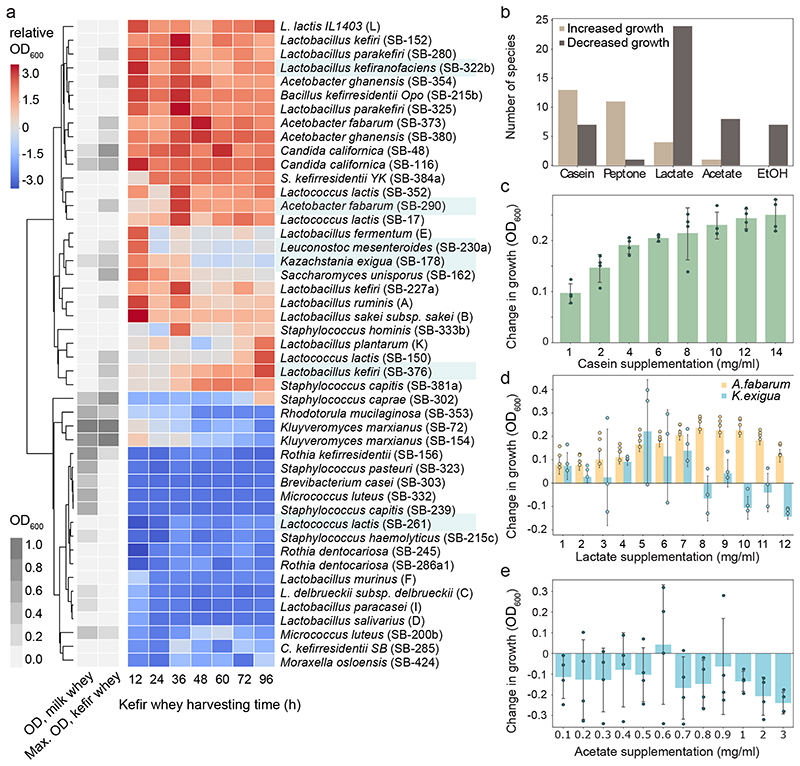
To assess the milk utilization capability of the individual strains, we measured their growth in milk whey (Supplementary Fig. 9, Supplementary Table 6). Notably, only yeasts and some rare species, but none of the abundant kefir bacteria showed appreciable growth. For example, L. kefiranofaciens, which is dominant in the grain as well as in the milk fraction, grew neither in milk whey nor in milk (Supplementary Fig. 10). Abundant kefir microbes thus appear to be reliant on their fellow community members for survival. The support for these species could come from the activity of the members growing before them. To assess this niche-opening hypothesis, we grew all isolated kefir strains – and selected non-kefir lactic acid bacteria – in kefir spent whey prepared at different fermentation stages (Fig. 3a, Supplementary Fig. 9, Supplementary Table 6). The kefir spent whey is, in essence, a medium conditioned by the community, including all soluble metabolites present at the sampling time. Several species showed a marked difference between their growth in milk versus that in kefir spent whey. In agreement with our hypothesis, the growth preferences of four of the five most abundant bacterial species (L. kefiranofaciens, L. mesenteroides, Acetobacter fabarum, and L. kefiri) matched well with their growth time window during kefir fermentation. In contrast, the L. lactis strains grew well in milk, but neither in milk whey nor in kefir spent whey. The growth patterns in milk and kefir whey thereby indicate strong inter-species dependencies.
Fig. 3. Growth performance of individual kefir community members highlight inter-species dependencies for milk colonization.
a, Growth of kefir isolates in milk whey and kefir whey (community-spent medium) are in contrast. Grey, growth measurements (OD600) in milk whey (left column) and maximum growth across kefir whey collected at different harvesting time (right column). The heatmap shows species growth in kefir whey harvested at different time points relative to that in the milk whey. Species names in blue highlight most abundant kefir species in kefir GER6. b, Growth of kefir community members is impacted by major fermentation products (lactate, acetate, and ethanol (EtOH)) and by protein sources casein and peptone added to milk whey (Methods). Shown are the number of species (counts) with increased or decreased growth for each product. Species displaying significant changes (two-sided t-test, p<0.01; N=4) in at least 70% of the concentrations tested were considered to be promoted or suppressed by the tested component. Raw data is available in Supplementary Table 20. c, Adding casein increases the growth of L. lactis. During whey preparation, most of the casein is removed, so that milk whey only contains ~20% of the protein content of bovine milk. Protein supplementation of milk whey with 1-16 mg/ml casein hydrolysate partially restores natural protein content. d, Lactate supports Acetobacter and K. exigua growth in milk whey at different concentrations. e, Acetate has no supportive effect on the growth of K. exigua. In c-e, changes in species growth are assessed relative to growth in non-supplemented milk whey. N=4, biologically independent samples with exception of K. exigua in d (N=3); error bars = mean values +/- SD.
Lactic and acetic acid determine growth window for yeast and Acetobacter
To determine the role of the main fermentation products, we evaluated the performance of individual strains in the milk whey supplemented with lactate, acetate, or ethanol. Additionally, we tested the effect of casein hydrolysate and peptone supplementation to account for the protein removed during whey production. L. lactis as well as several rare species profited from protein supplementation but were inhibited by acetate and lactate (Fig. 3b-c, Supplementary Fig. 11-15). Yet, growth of some species was boosted by lactate and acetate, albeit in a concentration-dependent manner. Acetobacter sp. benefited from lactate most between 7 and 12 mg/ml. Kazachstania exigua (and Saccharomyces unisporus) were also promoted by lactate but at lower concentrations (Fig. 3d, Supplementary Fig. 11-15). Acetate differentially impacted kefir yeast species, with K. exigua being inhibited at all concentrations (Fig. 3e, Extended Data Fig. 4). These effects likely manifest also in community context: the time-windows of yeast and Acetobacter growth align well with the beneficial or inhibitory range of lactate and acetate concentration (Extended Data Fig. 5).
Kefir members interact differently on solid and liquid media
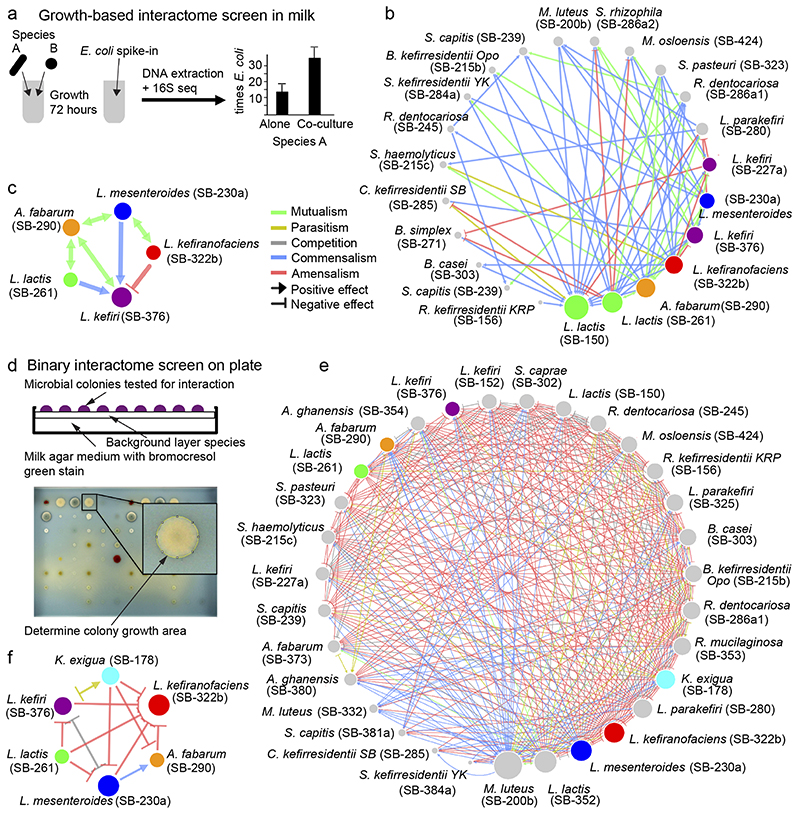
We next set out to identify pairwise interactions between kefir species. To capture different interaction types, we used three functional measurements: i) milk acidification rate, indicating overall fermentation competence (Extended Data Fig. 6); ii) growth in milk (Fig. 4a-c); and iii) colony size on milk-based agar plates (Fig. 4d-f). In all cases, we compared the performance of the co-cultures against monocultures to identify interactions.
Fig. 4. Interactions between kefir community members are extensive and qualitatively differ between solid and liquid phases.
a, Schematic of the method used to assess growth-promoting or growth-inhibiting interactions between kefir species in milk. Species abundance in mono- and co-cultures was assessed via 16S amplicon sequencing with quantitative E. coli spike-in. b-c, Kefir species (b – all tested species, c – abundant species) exhibit predominantly positive (commensal and mutualistic) interactions in milk. In b-c, data are based on three biological replicates. d, (Top) Schematic of the method used to detect species interactions on milk plates (Methods). Each species was plated as a background layer on milk plates containing bromocresol green; all query species were pinned on top. (Bottom) Colony area was assessed as a growth metric. e-f, Kefir species (e – all tested species, f – abundant species) exhibit predominantly negative interactions on milk plates. Node size represents the number of interactions with other species. Data are based on at least four biological replicates for each interaction pair.
The milk acidification assay revealed 15 significantly interacting pairs (p < 0.05, two-sided t-test) (Extended Data Fig. 6b, Supplementary Table 7). L. lactis did not show any interactions and was able to ferment on its own as well as in company, consistent with its early growth during kefir fermentation. In contrast, L. kefiranofaciens, the dominant species, featured 8 interactions: two with abundant species, viz., L. mesenteroides and L. kefiri, and six with rare species. Some of these rare species also supported the growth of kefir grain when supplied in milk before starting fermentation (Extended Data Fig. 7). Beneficial interactions with L. kefiranofaciens thus provide an explanation for inclusion of rare species in the kefir community.
The acidification assay, though functionally insightful, could not reveal whether the growth of the individual microbes was affected. We therefore quantified growth changes in milk using 16S amplicon sequencing combined with spiked-in E. coli standard (Methods). This analysis revealed 70 interactions: 58 positive (mutualism or commensalism) and 12 negative (competition, amensalism, or parasitism) (Fig. 4b, Supplementary Table 8). When only considering interactions between the abundant kefir species, L. kefiranofaciens suppressed its seemingly direct competitor L. kefiri, while promoting growth of L. mesenteroides and having no effect on L. lactis and A. fabarum (Fig. 4c). The majority of the mutualistic interactions, 8 in total, involved A. fabarum and a lactate-producing partner, supporting its dependency on lactate and late onset during fermentation.
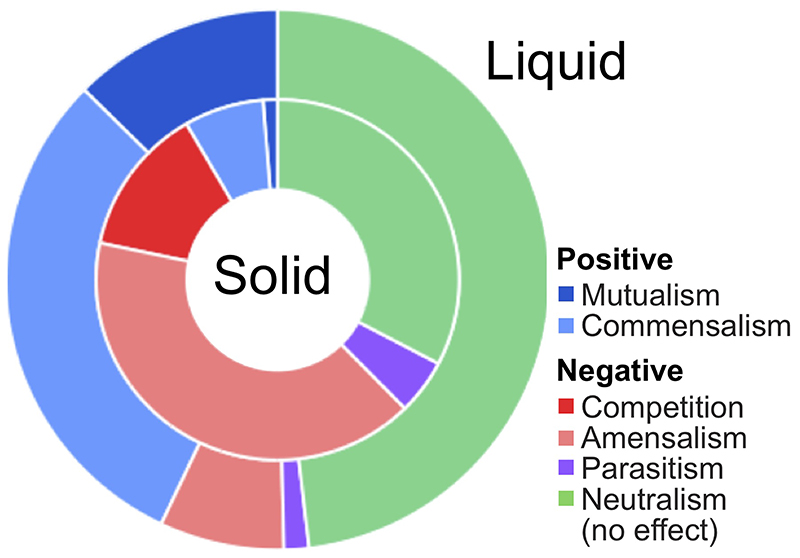
To complement the interactions identified in the milk fraction, we next probed the growth effects on milk agar that would better resemble the conditions in the grain. A total of 48 strains, 39 kefir isolates as well as 9 non-kefir Lactobacilli (Supplementary Table 9), were tested for pairwise interactions. Each strain (background) was plated as a lawn while all strains were pinned on top (queries). Change in the colony size relative to no background was used to determine interactions (Fig. 4d, Methods). This analysis revealed a dense network with a strikingly higher number of negative interactions than observed in the liquid medium, both among major kefir species and in the whole network (Fig. 4e,f, Supplementary Table 10). While 42.8% interactions in the liquid milk medium were positive and only 7.4% negative, the solid medium featured only 8.3% positive but 53.9% negative interactions (Extended Data Fig. 8). Especially L. lactis, known to produce bacteriocins, was a potent inhibitor of other species (Supplementary Fig. 16). Thus, while kefir species seem to support each other in the liquid phase, competition was predominant on the solid medium.
The stark reversal of the cooperation-competition divide between the solid and the liquid medium provide an explanation for the equally stark difference in the community composition between these two phases. The grain is monodominated by L. kefiranofaciens, which is the main producer of the grain matrix and thus has preferential access to this niche. It experiences mostly inhibitory interactions from the lower abundant species that strive to maintain themselves in the grain. In contrast, thriving in the liquid milk requires cooperation and thus this niche is more dynamic and the diversity is more evenly distributed.
L. mesenteroides and L. kefiranofaciens metabolically cooperate
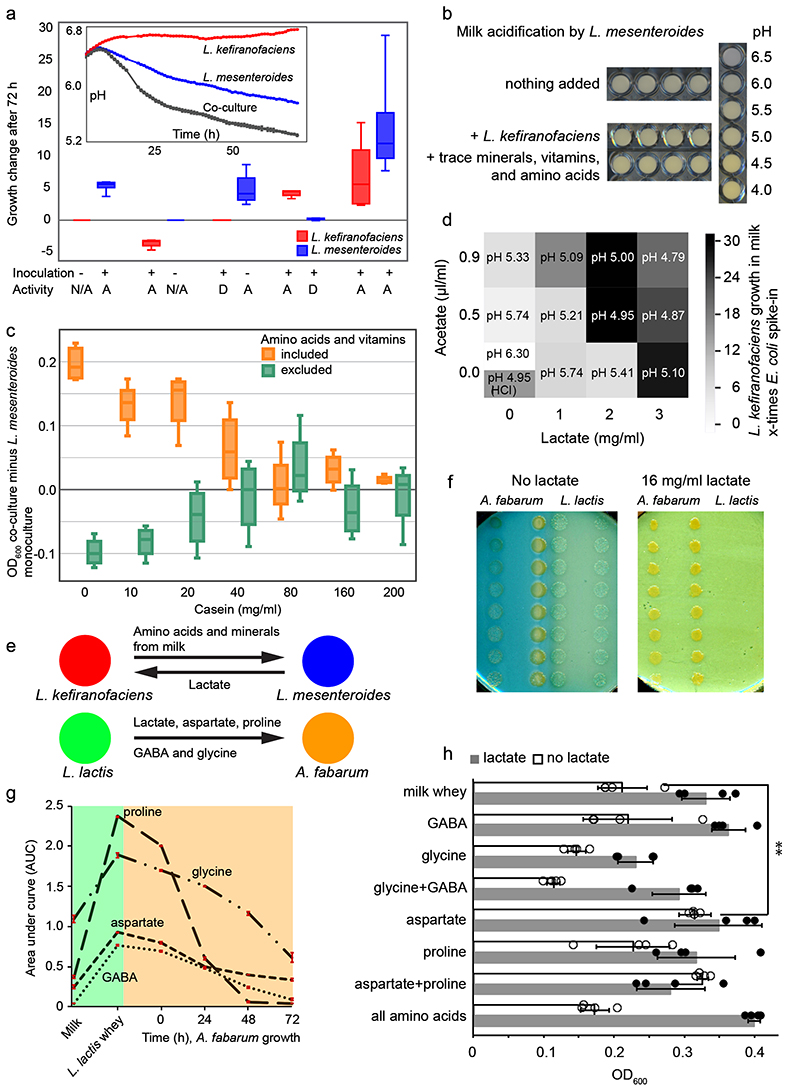
The mutualistic interaction between L. kefiranofaciens and L. mesenteroides is an early event in the milk fermentation and thus a likely determinant of subsequent species dynamics (Extended Data Fig. 6b, Fig. 4b and 5a). To elucidate the interaction agents, we searched for the factors that could compensate for the partner species. Milk was supplemented with various combinations of amino acids, mineral mix, vitamin mix, DNA bases (including uracil), DNAse-treated salmon sperm DNA, xanthine, NAD, and inactivated inoculum. Milk acidification by the two monocultures was then monitored over 76 h. While none of the supplements improved fermentation by L. kefiranofaciens (raw data in Supplementary Table 11), a combination of trace minerals, vitamins and amino acids increased the acidification by L. mesenteroides to an extent similar to its co-culture with L. kefiranofaciens (Fig. 5b).
Fig. 5. Unraveling selected metabolic interactions in kefir.
a, L. kefiranofaciens and L. mesenteroides benefit from each other when both species are alive. While L. kefiranofaciens benefits from dead L. mesenteroides, L. mesenteroides only profits from live L. kefiranofaciens. D=dead (heat or ethanol treated), A=alive, N/A=not present. N=4, biologically independent samples; the boxplot represents the interquartile range including the median, and the ends of the whiskers represent ±1.5× interquartile range. b, Addition of amino acid mix, vitamin mix, and trace minerals enhances milk acidification by L. mesenteroides in a way comparable to co-culture with L. kefiranofaciens. c, Difference between L. mesenteroides growth in monoculture and its co-culture with L. kefiranofaciens underlines the role of proteolytic activity in the interaction between these two species. Shown are the data based on growth (OD600) in milk whey enriched with amino acids, vitamins, and varying amounts of casein peptides. N=4, biologically independent samples; the boxplot represents the interquartile range including the median, and the ends of the whiskers represent ±1.5× interquartile range. Grey shaded boxes, separators between adjacent casein peptide levels. d, Supplementation of lactate and acetate in various proportions supports the growth of L. kefiranofaciens in milk by a combination of lowering pH (which alone improves growth at pH 4.95, adjusted with HCl) and increasing lactate availability. Acetate supplementation does not exceed the effect of pH alone (N=4, biologically independent samples). e, Metabolites exchanged between L. kefiranofaciens and L. mesenteroides and between A. fabarum and L. lactis. f, Growth of A. fabarum and L. lactis on milk agar plates with and without lactate supplementation (16 mg/ml) suggests lactate cross-feeding. g, Aspartate, proline, glycine, and GABA are cross-fed between L. lactis and A. fabarum (N=3; error bars, standard deviation). h, Acetobacter growth in milk whey, and in milk whey plus 8 mg/ml lactate, supplemented with various amino acids and GABA. Lactate additionally boosts Acetobacter growth in all cases except aspartate (and aspartate plus proline) supplementation. N=4; error bars, standard deviation; **p=0,0054 (two-sided t-test). Data for Fig. 5c, d and h can be found in Supplementary Tables 21, 22 and 23, respectively. Data are presented as mean values +/- SD.
To pinpoint the requirements of L. mesenteroides, we shifted to a milk whey-based medium allowing direct growth measurements. The effect of various supplements was evaluated: free amino acids, vitamins and small peptides (<3 kDa) derived from proteinase K digested casein hydrolysate (hereafter referred to as casein peptides). These experiments showed that casein peptides as well as free amino acids restore the growth of L. mesenteroides (Fig. 5c). Further, proteinase K digestion of milk prior to milk whey preparation boosted its growth (Supplementary Fig. 17), underscoring the dependence of L. mesenteroides on proteolytic activity by other community members. This is in agreement with a previous study reporting that L. mesenteroides requires additional trace metals (Mn2+ and Mg2+) and amino acids for its growth in milk44. Our results show that the trace metals are not required per se. However, they could play a role due to metal ion sequestration by milk micelles45. As we show, proteolytic activity can both provide the needed amino acids and overcome the limitation in metal ion availability. Overall, proteolytic activity of L. kefiranofaciens constitutes its beneficial impact on L. mesenteroides.
Regarding feedback from L. mesenteroides to L. kefiranofaciens, we hypothesized lactate and acetate as potential cross-fed metabolites. These two are major by-products of L. mesenteroides metabolism46, and lactate exchange was predicted by our metabolic modelling (Methods). Indeed, lactate considerably boosted (circa three-fold) the growth of L. kefiranofaciens (Fig. 5d). In contrast, acetate supplementation, pH change, and proteolysis had only a minor impact (Supplementary Fig. 18). Taken together, the metabolic cooperation between L. kefiranofaciens and L. mesenteroides is mediated by amino acids and small peptides liberated by proteolytic activity of L. kefiranofaciens (as suggested by our metabolite data), which in turn benefits from lactic acid produced by L. mesenteroides (Fig. 5e).
Acetobacter benefits from aspartate and lactic acid
We next investigated the metabolic dependencies of Acetobacter, which is the latest grower and has low fitness in milk on its own. Since lactate supplementation improved Acetobacter growth in milk whey (Supplementary Fig. 11), and lactate producers showed positive effect on its growth (Fig. 4, Extended Data Fig. 6), we hypothesized that lactic acid and other factors produced by L. lactis were beneficial for Acetobacter. In agreement, Acetobacter grew closer to L. lactis colonies on milk plates, an effect that could be recapitulated using lactate addition (Fig. 5f). To test whether lactate was consumed, and to discover other potentially exchanged metabolites, we performed metabolomic analysis of time-compartmentalized interaction using a conditioned media set-up. Spent whey media prepared from four L. lactis strains were used to culture four Acetobacter isolates. Untargeted FIA-qTOF analysis of the supernatant suggested proline and aspartate exchange between all L. lactis and Acetobacter strains (Supplementary Fig. 19, Supplementary Table 12). Targeted mass-spectrometry analysis using HILIC-qTRAP (Supplementary Fig. 20) and GC-MS (Fig. 5g) confirmed these results. GC-MS further identified two additional exchanged metabolites, glycine and 4-aminobutyric acid (GABA) (Fig. 5g). The latter was recently reported to be produced by L. lactis from glutamate47. GC-MS data also showed accumulation of lactic acid as expected, but no appreciable consumption (Supplementary Fig. 21, Supplementary Table 12 and 13). This could be due to relatively small need by Acetobacter compared to the large lactate availability, in which case the consumption would be within the variation of the method. We also observed that glycine, despite being consumed in the conditioned media assay, is also inhibitory (Fig. 5h). Proline is unlikely to be limiting in the context of whole community, as it accumulates in large quantities (Fig. 2c). Aspartate, on the other hand, is limiting during kefir fermentation and indeed boosts the growth of Acetobacter in milk whey (Fig. 5h). In addition, Acetobacter can synthesize aspartate from lactate48. The metabolomics and supplementation assays thus show the dependency of Acetobacter on lactate and amino acids.
Gene expression changes and metabolic modeling validate cross-feeding
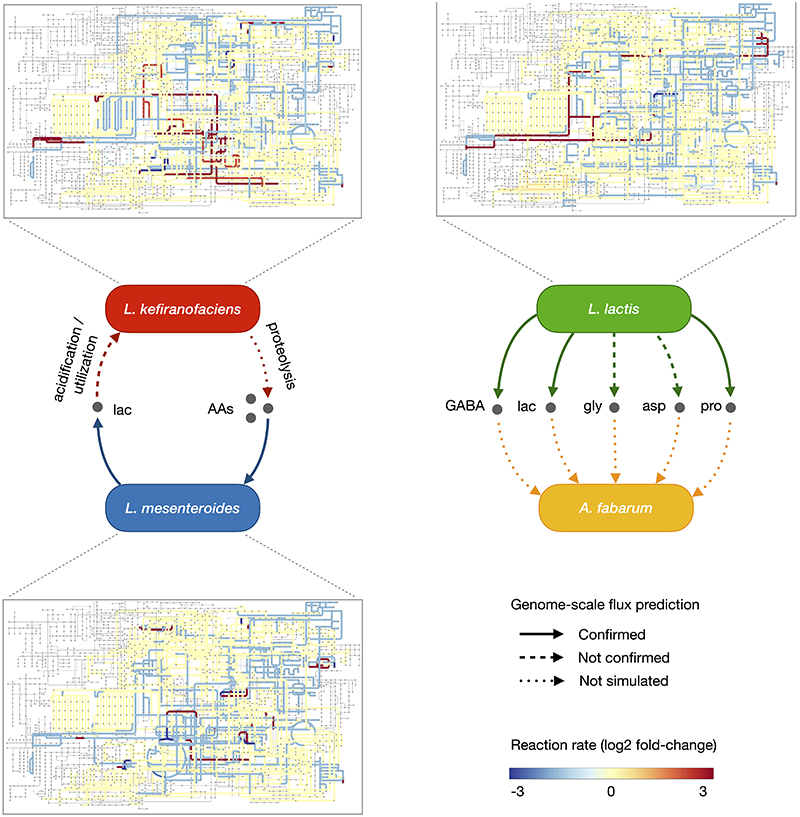
To gain insights into gene regulation accompanying species interactions, we analyzed two interacting pairs using RNA-seq: L. kefiranofaciens - L. mesenteroides and L. lactis – A. fabarum (Methods). As expected, expression of the genes linked to growth and metabolism were affected in both pairs (Supplementary Table 14). We additionally integrated the RNA-seq data with genome-scale metabolic models to identify metabolic exchanges consistent with the gene expression patterns (Methods). The results supported many of the interactions inferred from the metabolomics data, especially up-regulation of GABA, lactate and proline metabolism in L. lactis, and increased lactate production and amino acid consumption by L. mesenteroides (Extended Data Fig. 9).
Discussion
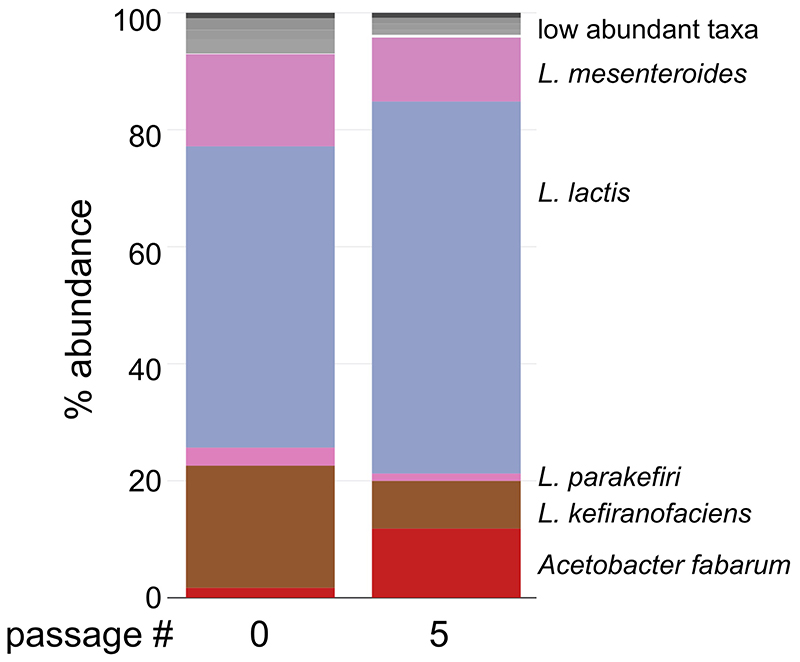
Several cross-feeding interactions in microbial communities have been previously reported9,11,49,50. Here, we systematically unraveled such interactions in a complex community in its natural environment and how these provide a group advantage. Perhaps our most intriguing finding is how L. kefiranofaciens dominates the community despite having no fitness on its own in milk (Supplementary Fig. 10a), which is its only known habitat. Its interaction with L. mesenteroides illustrates how L. kefiranofaciens can survive in milk by cooperating with the fellow community members. Furthermore, as L. kefiranofaciens synthesizes the polymeric matrix of the grain, it can maintain its dominance therein, and, since the community is propagated through grain transfer, continues to retain this advantage. The other members of the community must also be carried along to enable utilization of the milk nutrients. The kefir community is thus shaped by a combination of beneficial and competitive interactions that balance between maintaining grain occupancy and nutrient utilization from milk. Highlighting this balance, several species inhibited L. kefiranofaciens on milk plates, while none was inhibited by it (Fig. 4e,f). At the community scale, this balance was evident in the shift from competitive to cooperative interactions between solid and liquid (Extended Data Fig. 8). In this scenario, the dominance of L. kefiranofaciens would be expected to decline without the grain; we observed this decline in L. kefiranofaciens abundance within a few transfers when the community was passaged without the grain (Extended Data Fig. 10).
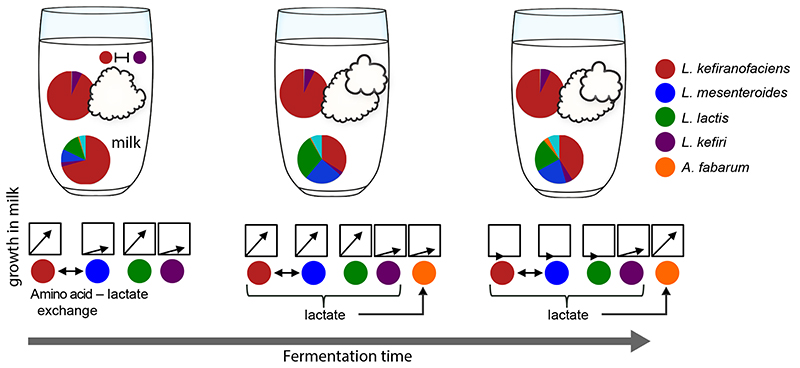
We picture the kefir grain as a “basecamp” from which the members colonize milk in an orderly fashion, which is orchestrated by the accompanying metabolite changes (Fig. 6). Basecamp membership is kept constant during grain growth, ensuring renewal of the inoculum for the next fermentation cycle. The spatiotemporal niche separation underlying this basecamp lifestyle may be operational in other microbial systems. For example, species retained in the mucosal layer of the intestine could provide a basis for community maintenance during nutritional changes51 or after dysbiosis events like antibiotic treatment2. Overall, our results demonstrate how community stability emerges through spatiotemporal niche partitioning and provide a roadmap for deciphering complex microbial ecosystems.
Fig. 6. Kefir community exhibits a “basecamp lifestyle”.
The community in the grain undergoes only minor compositional changes, while the community of microbes that colonizes the milk fraction continuously changes as fermentation proceeds. The grain thus serves as a basecamp that provides inoculum for orderly milk colonization with accompanying metabolite dynamics (Fig. 1 and 2). This basecamp also serves as a reservoir of community members for the next transfer into fresh milk.
Methods
Kefir fermentation and grain propagation
All kefir milk fermentations were carried out using Ultra High Temperature pasteurized cow milk with 3.5 % fat content (MUH Arla eG, Germany). Fermentation was initiated by adding 60 g of kefir grains for one liter milk (or scaled accordingly for lower volumes). The process was carried at the 25 ˚C and without shaking for 48 h, which is similar to that of the traditional home fermentation. See Supplementary Fig. 22 for details. 90 h long fermentation was used for community dynamics and -omics analysis as described in the main text. Kefir grains were collected at the end by straining through a heat sterilized household mesh strainer, washed using double distilled water and subsequently used to inoculate new cultures or for storage. Long-term storage of the grains was done in 80% glycerol at -80 ˚C.
The kefir fermentation curve was run in quadruplicates for 90 hours (h) total time. Each biological replicate contained 650ml total volume with 60g/liter kefir grains. PH measurement, DNA and metabolite sample collection was done from 0-15h, 15-25h, 25-40h and 40-90h every 3, 2, 5 and 10 hours, respectively. Two samples (technical replicates) were collected from each of the four biological replicates. Bacterial and yeast composition were monitored using 16S rDNA and ITS amplicons, respectively. The resulting relative abundance data was then scaled to absolute values using qPCR analysis for yeast (Kazachstania exigua) and L. kefiranofaciens in combination with the measurements of total DNA content. Untargeted metabolomics analysis was done by flow injection analysis time-of-flight mass spectrometry (FIA-qTOF)52.
DNA extraction was done using a two-step approach combining enzymatic digestion and bead beating (modified after53). Kefir grains (~0.1g) and pelleted fermented milk (from 1 ml sample) were suspended in 600 μl TES buffer (25mM Tris; 10mM EDTA; 50mM sucrose) with 25 units lyticase (Sigma-Aldrich, cat# L2524) and 20 mg/ml lysozyme (Sigma-Aldrich, cat# 62971) and incubated for 30 min at 37˚C. The samples were then crushed with 0.3 g glass beads (Sigma-Aldrich, cat# G1277, 212-300 μm) at 4 m/s (fermented milk) and 6 m/s (kefir grains) for five times 20 seconds using a FastPrep®-24 instrument (MP Biomedicals). 150 μl 20 % SDS was added and after 5 min incubation at room temperature the tubes were centrifuged at maximum speed for 2 min. The supernatant was digested with 10 μl Proteinase K (20 mg/ml) for 30 min at 37˚C and proteins were precipitated with 200 μl potassium acetate (5 M) for 15 min on ice. The samples were then centrifuged for 15 min at 4˚C and the supernatant applied to phenol/chloroform extraction and DNA precipitation as described by53. DNA quality was checked on agarose gel. DNA extraction from bacteria and yeasts was done as described above, using lysozyme and lyticase digestion, respectively.
DNA extraction of isolated species was performed using a simplified version of the extraction protocol used for kefir fermented milk containing removing the lysozyme digest (bacterial isolates) or the lyticase step (yeast isolates)
Real-time PCR quantification (qPCR) was done according to manufacturers instructions using the Applied Biosystems® StepOne™ Real-Time PCR System and the SYBR® Green RT-PCR Reagents Kit. The primer pairs LKF_KU504F -LKF_KU504R54 and Kex-qPCR-forw (AGAGTAGTTCCTTTCACCCT TGCC) - Kex-qPCR-rev (AGTCGCTGGGTGATCGTCAG) were used for L. kefiranofaciens and K. exigua, respectively. Data was analyzed using the StepOne™ v2.3 software.
Extracellular metabolite extraction
500 μl kefir fermented milk was centrifuged for 1 min at max. speed and 50 μl supernatant (kefir whey) were added to 950 μl 80˚C H2O and incubated for 3 min at 80˚C and 700 rpm. The samples were then centrifuged for 10 min at 0˚C at maximum speed. The supernatant was harvested and ten times diluted for FIA-TOF measurement.
FIA-qTOF MS untargeted measurements and data analysis. Related to Fig. 2 a, b; Supplementary Fig. 19
Metabolite extracts were injected into an Agilent 6550 time-of-flight mass spectrometer (ESI-iFunnel Q-TOF, Agilent Technologies) operated at 4 Ghz high resolution, in negative mode, with a mass / charge (m/z) range of 50−1,00052. The mobile phase was 60:40 isopropanol:water (v/v) and 1 mM NH4F at pH 9.0 supplemented with hexakis(1H, 1H, 3H-tetrafluoropropoxy)phosphazine and 3-amino-1-propanesulfonic acid for online mass correction. Raw data was processed as described in52, and m/z features (ions) were annotated by matching their accurate mass-to-sum formulas of compounds to a custom KEGG database containing a merged database of Escherichia coli (eco), Saccharomyces cerevisiae (sce), and Homo sapiens (hsa) with 0.001 Da mass accuracy and accounting for deprotonation [M-H+]-. Only ions with high annotation accuracy were included in further analyses. This method has the inherent limitation that isobaric compounds, e.g., metabolites having identical m/z values, cannot be distinguished and that in-source fragmentation cannot be accounted for. The raw data of samples from the 2 sets of experiments (kefir development time course and Lactococcus – Acetobacter cross feeding) were processed and annotated separately to accommodate their different sample matrices or times of measurement. This raw data can be explored in Table S12. Raw data processing and annotation took place in MATLAB (MATLAB 2016b, The Mathworks, Natick) as described previously52, and downstream processing and statistical tests were performed in R (version 3.4.0, R Foundation for Statistical Computing, Vienna, Austria).
For the kefir development time course data ion intensities were transformed to Z-scores, filtered for non-changing patterns55 and the metabolite time sources were subjected to k-means clustering. In order to find the best K for clustering, we computed the Silhouette and Homogeneity score and performed the ensemble K-means clustering in varying random states to create a co-occurrence matrix (Supplementary Fig. 4). We chose six clusters because it returned the best compromise between the consistency and separability (Supplementary Table 4a). Overall dissimilarity of the ion profiles in different sampling points were visualized by Principal Component Analysis.
qTRAP-MS targeted measurements. Related to Supplementary Fig. 20
Metabolite extracts were injected on an Agilent HILIC Plus RRHD column (100 × 2.1mm × 1.8 μm; Agilent, Santa Clara, CA, USA). As was described previously, a gradient of mobile phase A (10 mM ammonium formate and 0.1% formic acid) and mobile phase B (acetonitrile with 0.1% formic acid) was used32. Metabolites were detected on a 5500 QTRAP triple quadrupole mass spectrometer in positive MRM scan mode (SCIEX, Framingham, MA, USA) at a constant flow rate of 400 μl/min.
GC-MS measurements. Related to Fig. 5 g
Dried polar metabolites were derivatized with 50 μl of 20 mg/mL methoxyamine hydrochloride (Alfa Aesar, UK) solution in pyridine for 90 min at 37˚C, followed by reaction with 100 μL N-methyl-trimethylsilyl-trifluoroacetamide (MSTFA) (Alfa Aesar, UK) for 10 hours at room temperature56. GC-MS analysis was performed using a Shimadzu TQ8040 GC-(triple quadrupole) MS system (Shimadzu Corp.) equipped with a 30m x 0.25 mm x 0.25 μm ZB-50 capillary column (7HG-G004-11, Phenomenex, USA). 1 μl of sample was injected in split mode (split ratio 1:20) at 250 ˚C using helium as a carrier gas with a flow rate of 1 ml/min. GC oven temperature was held at 100 ˚C for 4 min followed by an increase to 320 ˚C with a rate of 10 ˚C/min, and a final constant temperature period at 320 ˚C for 11 min. The interface and the ion source were held at 280 ˚C and 230 ˚C, respectively. The detector was operated both in scanning mode recording in the range of 50-600 m/z, as well as in multiple reaction monitoring (MRM) mode for specified metabolites. The metabolite identification was based on an in-house database with analytical standards being utilized to define the retention time, the mass spectrum and the marker ion(s) for each reported metabolite. The metabolite quantification was carried out by calculating the area under the curve (AUC) of the identified marker ion(s) MRM transition of each metabolite normalized to the AUC of ribitol’s marker ion MRM transition (marker ions m/z: γ-aminobutyric acid 174, aspartate 232, glycine 174, proline 142, ribitol 319). Data can be explored in Table S14.
Quantification of sugars, amino acids and small organic acids by high-performance ion-chromatography. Related to Fig. 2 c, d
Samples were quenched with 4N sulfuric acid and deproteinated using an aqueous PCA solution. Arabinose and 2-hydroxyisobutyric acid were used as internal standards for the sugar and acid analysis, respectively. The compounds were identified based on their absolute retention times compared to those of commercial standards. The diluted samples were analyzed on a Dionex ICS-3000 system (Thermo Fischer Scientific, Waltham (MA), USA). For the sugar analysis, an analytical anion-exchange column was used for the separation in combination with a pulsed amperometric detector57. The acids were analyzed in parallel on the same instrument, but with an analytical ion-exclusion column and a suppressed conductivity detector58. Concentrations were calculated based on the chromatographic peak heights after normalizing to the internal standard (arabinose) using a one-point calibration. Raw data in Supplementary Tables 15 and 16.
Amplicon analysis of 16S rRNA and ITS
All samples for the compositional analysis were examined by targeting the v4 regions of the 16S rRNA gene for bacteria and the ITS1/ITS2 region of the 18S rRNA gene for yeast. DNA was extracted as described above and cleaned with the DNA Clean & Concentrator™ kit (Zymo Research). Library preparation for the 16S V4 and 18S ITS was done using the NEXTflexTM 16S V4 Amplicon-Seq Kit 2.0 and NEXTflexTM 18S ITS Amplicon-Seq Kit, respectively. The barcoded amplicons were pooled in equal concentration and sequenced on the Illumina MiSeq platform using 2 X 250 bp at the EMBL genomic core facility in Heidelberg, Germany.
For the 16S analysis, raw paired-end sequences were quality-filtered using Cutadapt v1.1059 and merged using the Paired-End reAd mergeR (PEAR v0.9.11)60. QIIME2 (version 2018.04) was used for the downstream analysis (https://qiime2.org). The demultiplexed sequences were denoised and grouped into amplicon sequence variants (ASVs) using DADA261. The individual ASVs were taxonomically classified with 99% identity threshold by an open reference method (VSEARCH) using the 16S rRNA genes of the kefir isolates as reference62. Taxonomy of the non-kefir isolates ASVs were subsequently determined using the naive-Bayesian classifier trained on the Greengenes63,64. For the ITS analysis, raw sequences were quality-filtered using Cutadapt, but only ITS2-end reads were employed for the diversity analysis because the length variations in the ITS region resulted in the low number of the merged reads. As described above, the demultiplexed ITS2 sequences were denoised and subjected to taxonomic assignment by an open reference method, using the kefir isolated yeast as reference and UNITE for subsequent naive-Bayesian classifier65.
Kefir and milk whey preparation
Kefir fermented milk was centrifuged for 30 min at 6000 rpm. The supernatant (whey) was filtered sterile with bottle top filters (pore size 0.22 μM). For milk whey preparation, 10 ml 32 % HCl was added to 1 liter UTH milk and stirred for ~10 min. The curdled milk was then centrifuged for 30 min at 6000 rpm and the pH of the supernatant was adjusted to 6.5 (pH of milk) with 10 M KOH. The whey was then centrifuged for another 30 min at 7000 rpm and filter sterilized. The sterile whey was stored at room temperature in the dark.
Peptide-rich milk whey was prepared by digestion of 1 liter UTH milk (3.5% fat) with 200 mg proteinase K for 72 hours. Digested milk was then centrifuged for 40 min at 7000 rpm and filter sterilized. The sterile whey was stored at room temperature in the dark.
Species isolation from kefir grains and fermented milk
For species isolation, kefir fermented milk was diluted and plated directly, whereas kefir grains were homogenized using a Dounce tissue grinder before dilution. Diluted grain and milk fractions were inoculated in different rich media: GAM, mGAM, M17 supplemented with lactose and glucose, respectively, YPDA, MRS, TJA (tomato juice agar), YM (yeast mold agar), SD, Lactobacillus selective agar base (Neogen), and milk agar (200ml of 8% water agar plus 800ml UTH milk). MRS and TJA were used both, pure and diluted 1 to 1 with 48h kefir whey and 3.5% fat UTH milk, respectively. Growth was observed on plate for up to 10 days at room temperature, 30˚C and 37˚C, respectively. Kefir Lactobacilli were enriched using high salt conditions reaching from 1-5% NaCl.
Isolated species were identified by Sanger sequencing of the 16S/ITS region, using the primers S-D-Bact-0515-a-S-16 (GTGCCAGCMGCNGCGG) and S-*-Univ-1392-a-A-15 (ACGGGCGGTGTGTRC)66. Unique isolates were sequenced using the Illumina® HiSeq 2000 platform.
Pairwise species interactions in milk and on milk plate
The pairwise (binary) microbial interactions were assessed in liquid milk and on milk plates containing 0.04 g per liter bromocresol purple and blue, respectively. Binary species interactions in liquid milk were inoculated at final OD=0.025 each and grown at room temperature for 72 hours. Directly before DNA extraction, E. coli was spiked in at a final OD of 0.005 to allow relative quantification and growth assessment. DNA was extracted and the 16S amplicons were sequenced and their abundance quantified as described above. We removed samples with a small number of reads (<1,000), lacking E. coli sequences or contaminations above 5% total reads. The abundance of the inoculated species was converted into the fold-abundance of E. coli spike-in (the same amount in all samples). The normalized growth of the species in co-culture was statistically compared to that in monoculture using two-sided t-test (p-value cutoff of 0.05). Thereby the number of reads obtained for one species in monoculture were compared to that for the same species in the co-culture. The effect of one species (A) on the other (B) was classified into positive, negative or neutral depending on growth change of the other species (ΔB). Interaction modes between two species were determined, on the basis of the reciprocal effects, to mutualism, competition, commensalism, amensalism, parasitism, and neutralism (= no effect).
Binary interactions on plates were assessed on milk agar medium containing 80 % UTH milk (3.5 % fat), 1 % agar and bromocresol blue as stain. The species to be tested were pinned on top of a background species spread on plate two hours prior to pinning. In addition to the excess inoculum spread, the two-hour interval between spreading and subsequent pinning provided a growth advance to the background species, towards ensuring dominance of its metabolites on plate. Pinning was done automated using the Singer ROTOR HDA Microbial Pinning Robot. Species were grown seven days at room temperature and plates were imaged under controlled lighting conditions (spImager S&P Robotics Inc.) using an 18 megapixel Canon Rebel T3i. Colony surface area was determined semi-automated using ImageJ (version 2.0.0-rc-43/1.52n). The growth effects (background species to pinned species) were termed positive, negative, or neutral, respectively, if the colony surface area of pinned species was significantly larger, smaller, or similar on plates with background species compared to plates without background species (two-sided t-test, p-value cutoff of 0.05). All identified interactions correspond to at least 50% change in the colony area. Interaction modes were coined as described above.
Pair-wise species interactions in milk (fermentation competence, acidification)
The 20 most interesting species (most abundant and isolated from our reference kefir GER6, respectively) involved in kefir fermentation, including several rare species, were inoculated in milk stained with bromocresol purple solution, a pH indicator, that is yellow at a pH below 5.2 and purple above pH 6.8. The inoculated species were grown for 76 hours at room temperature. Microbial growth was assessed by pH-dependent color change and monitored by automated hourly scanning with a standard flatbed scanner and subsequent analysis of pH changes using the growth profiler software (Enzyscreen B.V., Heemstede, Netherlands). The species were either inoculated alone or in pairs and the potential of the pairs to acidify milk within 76 hours was compared with single inoculate.
The RGB code for changing color in response to different pH were independently plotted, showing that the R-values are linearly-correlated with pH change in the range of 3 to 7. Thus, the acidification by inoculated species was measured by converting the R-value to pH. The species were either inoculated alone or in pairs. The experiment was performed three times, with each species tested in duplicate per run. The interaction potential of the pairs for milk acidification was determined on the basis of reduction area under the pH curves within 76 hours. We define the positive interaction if the acidification area of co-culture is bigger than the sum of those of single inoculum and the negative interaction if the pH of co-culture is higher than those of both individuals.
Inactivated inoculum for L. kefiranofaciens or L. mesenteroides was prepared by ethanol treatment or heat inactivation, and supplied in 1x or 10x amounts for testing effect on the other species.
L. lactis spent whey was produced by L. lactis (strains SB-17, SB-261 and SB-352) fermentation for 72 hours or by L. lactis (strain SB-150) for 120 hours at 30˚C. Whey was harvested by centrifugation for 40 min at 7000 rpm and filter sterilized (0.22 μM pore size). The sterile whey was stored at room temperature in the dark.
Metabolomics measurements in milk and L. lactis spent whey
Four Acetobacter isolates (A. fabarum: internal stock IDs SB-290, SB-373 and A. ghanensis: internal stock IDs SB-354, SB-380) were grown in whey produced with four L. lactis isolates, while sampling extracellular metabolomics samples over time. These samples were measured with untargeted metabolomics in an independent metabolomics experiment. Possibly exchanged metabolites were identified by selecting ions that showed an increase during L. lactis growth (log2(FC) ≥ 1) and a decrease during Acetobacter growth (log2(FC) ≤ 1).
RNA-seq analysis of mono- and co-cultures L. kefiranofaciens - L. mesenteroides and L. lactis - A. fabarum
Species were grown 3 days at 25˚C (no shaking) in milk as single species and in following combinations: 1) L. kefiranofaciens - L. mesenteroides and 2) L. lactis - A. fabarum. Total RNA was extracted using a phenol/chloroform-based altered version of the DNA extraction protocol described above. rRNA was depleted with the NEBNext® rRNA Depletion Kit (Bacteria) and a sequencing library was prepared using the NEBNext Ultra II Directional RNA Library Prep Kit for Illumina. The libraries were then sequenced using the Illumina MiSeq Next Generation Sequencer.
Gene expression quantification and differential expression analysis
In order to quantify gene expression profiles, we used mOTUs267 with a custom database. mOTUs2 is a tool developed to quantify species relative abundances in metagenomes and metatranscriptomes based on 10 universal single copy marker genes. Here we replaced the original database with one that contained the genes from all four kefir species analyzed. Genes were predicted from genome assemblies using Prokka68. We estimated raw read counts (-t insert.raw.counts) after filtering reads that map with at least 75 nucleotides to the gene sequences (-l 75), and at least 97% sequence identity.
Per-gene raw read counts were used for comparisons of gene expression between the following groups: (a) L. lactis in culture alone (3 samples) versus growing with A. fabarum (2 samples); (b) L. kefiranofaciens alone (3 samples) versus in combination with L. mesenteroides (2 samples); and (c) L. mesenteroides alone (3 samples) versus in combination with L. kefiranofaciens (2 samples). A. faburum did not grow alone and could therefore not be tested. All analyses were designed to have 5 samples in total (3 alone and 2 in combination). Prior to statistical analysis, genes were filtered to have a prevalence of 2 samples and have at least 50 reads in total across the 5 samples. Statistical analysis of differentially expressed genes was performed using DEseq269 (version 1.22.2) with default parameters.
Integration of transcriptomics data into flux balance analysis
Differential gene expression levels (eco/emono) between species grown in co-culture were compared to those in the mono-cultures using DESeq2, with the exception of A. fabarum which was unable to grow in mono-culture. Differential expression levels not considered statistically significant by DESeq2 (adjusted p-value > 0.05) were discarded from the subsequent analysis. Gene-pFBA simulation method70 was used to estimate enzyme usage levels for each species when grown in mono-culture (umono). These levels were multiplied by the differential expression levels to estimate the enzyme usage levels in co-culture, and the respective reaction rates using the gene-lMOMA simulation method70 with the following objective function:
GO term enrichment analysis
Gene Ontology (GO) term enrichment analysis was performed using the differential gene expression data to find biological processes consistently up or down-regulated. First, each genome was annotated using eggnog-mapper v271 to associate GO terms with their respective genes (output in Supplementary Table 17). We then selected the GO terms associated with up-regulated and down-regulated genes (|log2(FC)| > 1, adjusted p-value < 0.05) and performed a hypergeometric test to identify significantly enriched GO terms.
Estimation of amino acid uptake and secretion rates
Genome-scale metabolic models were reconstructed for all bacterial species (which account for more than 90% of the total community composition) using CarveMe72. The models were used to simulate the expected uptake/secretion rates of amino acids using flux balance analysis. At each time point the individual rates for each species were combined with the measured species abundances to estimate the overall net accumulation/depletion rates for all amino acids.
Estimation of expected amino acid accumulation
We estimated the level of accumulation of amino acids that would be expected by proteolysis alone. For this we normalized the measured accumulation rates by the natural amino acid abundance in milk protein and estimated a first-order kinetic rate for proteolysis (1.36e-4 h-1) by least-squares regression. We then multiplied this value by the natural abundance of each amino acid to estimate their respective accumulation rate by proteolysis.
Data analysis
In boxplots, the box indicates the inter-quartile range, with the median as marked with a line; the outer bars extend to the 5th and 95th percentiles. All replicates refer to biological replicates and error bars denote standard deviation unless otherwise stated. All measurements concern distinct samples and not repeated measurements of the same samples. Data analysis was performed using Python (version 3.6.4). Libraries NumPy (version 1.14.2), SciPy (version 1.0.0), pandas (version 0.23.0), and R (version 3.3.3). Library EcoPy (version 0.1.1) was used for community diversity and ordination analysis.
Extended Data
Extended Data Fig. 1. Additional information related to Fig. 1d.
a, Temporal dynamics of bacterial composition during fermentation in the kefir fermented milk assessed by 16S amplicon sequencing. The non-isolates represent the sum of all species, which are not in the kefir isolate collection. The fermentation is split into 6 different stages depending on the abundance changes of the major species. The shaded area marks the data range. N=4, biologically independent samples. b, Fitting of DNA concentration dynamics to sigmoid curve. N=4, biologically independent samples, error bars = mean values +/- SD. c, DNA extracted from fermentation samples. DNA concentration estimates, measured using Qubit (Supplementary Table 19), were used to determine absolute abundances shown in Fig. 1d. Raw gel images are depicted in Supplementary Fig. 3.
Extended Data Fig. 2. Amino acid dynamics in milk and kefir fermented milk.
a, Comparison of amino acid composition of milk total protein with that of free amino acids observed in kefir after 12 h, 40 h, and 90 h fermentation. Milk total protein amino acid composition used is average from two previous reports (Park, 2007; Schönfeldt et al., 2011)36,37. Lines depict the best linear fit and grey shading the 95% confidence interval of the linear fit. b, Comparison of expected accumulation (red dotted lines) and measured concentrations (blue lines) of amino acids in milk kefir. Green bars indicate the model-based estimation of uptake (negative values) and secretion (positive values) by kefir microbes.
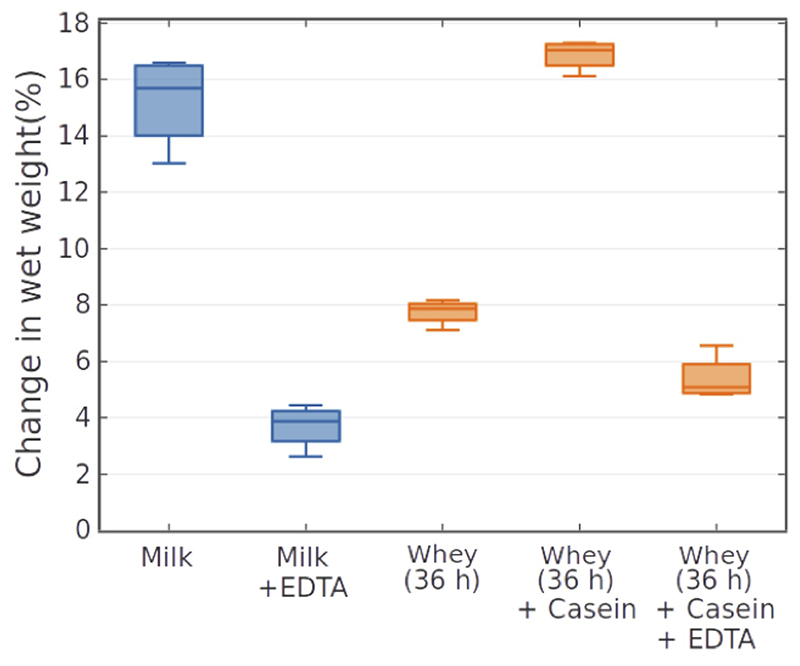
Extended Data Fig. 3. Effect of EDTA and protein addition on grain wet-weight gain after 72 h fermentation.
Kefir grains grown in whey harvested after 36 h fermentation reveal decreased growth that is restored by casein supplementation. Addition of EDTA inhibits grain growth in both milk and casein-supplemented kefir whey. N=4, error bars =SD.
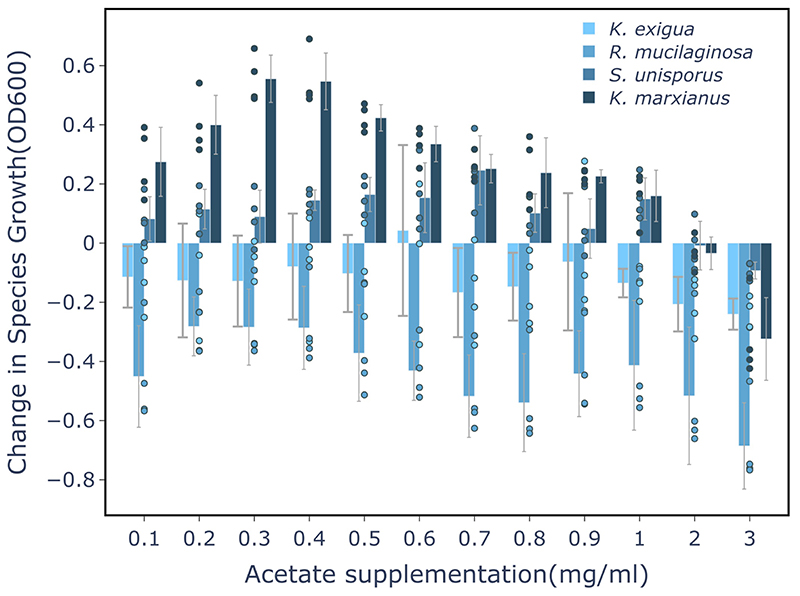
Extended Data Fig. 4. Effect of acetate on growth of K. exigua, R. mucilaginosa, S. unisporus, and K. marxianus. S. unisporus and K. marxianus profit from low acetate concentrations.
K. exigua and R. mucilaginosa, are inhibited even by small acetate supplements. Changes in species growth are assessed relative to growth in non-supplemented milk whey. N=4, biologically independent samples, error bars = mean values +/- SD.
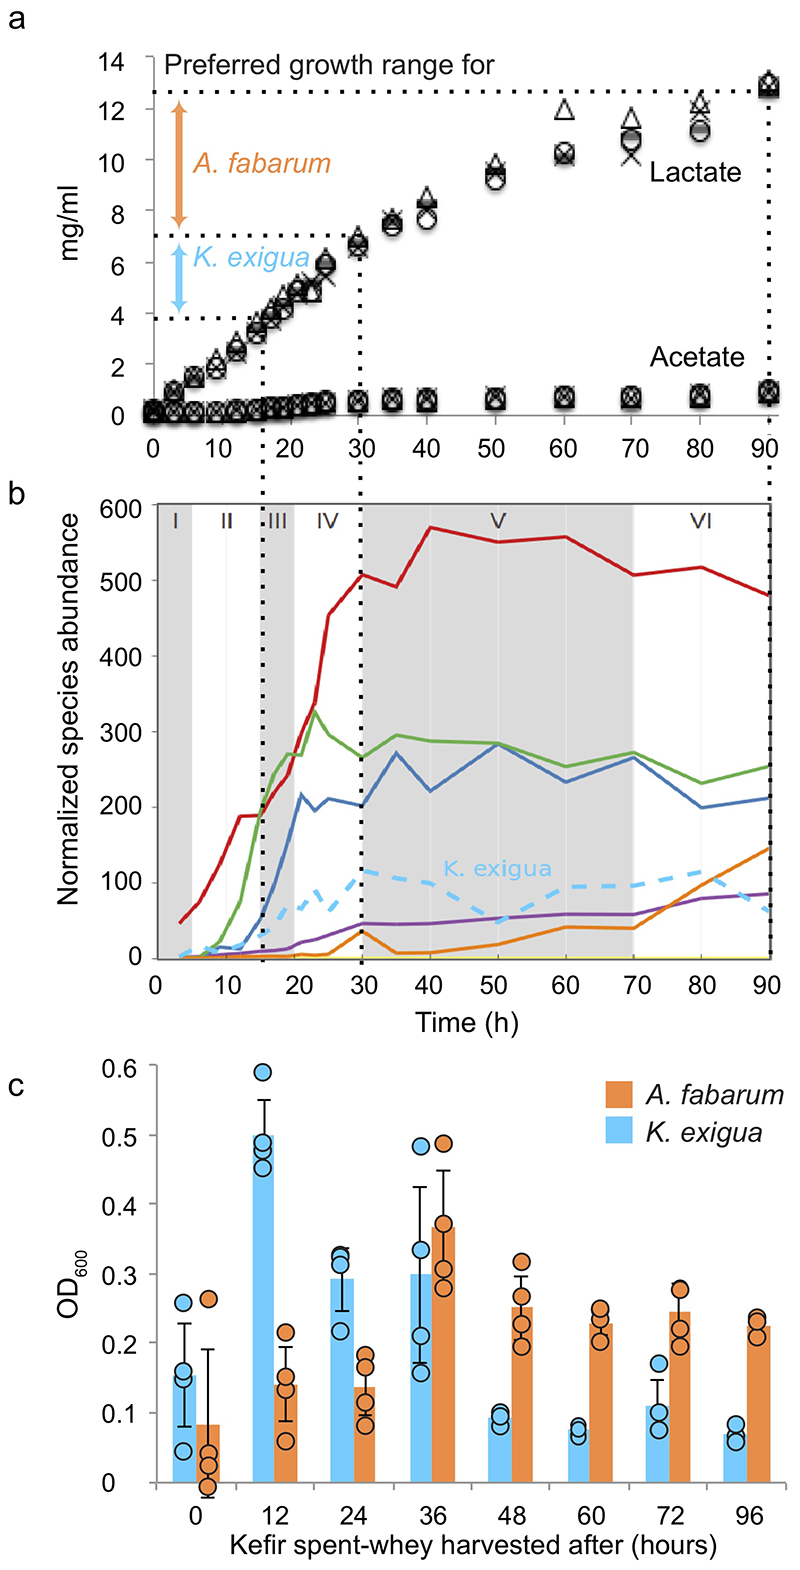
Extended Data Fig. 5. Lactate concentration shapes consecutive time-windows of growth of Kazachstania exigua (yeast) and Acetobacter fabarum .
a, Evolution of lactate and acetate concentration during kefir fermentation. Different symbols mark data from replicates (N=4). Colored block arrows indicate optimal lactate concentration ranges for the K. exigua and A. fabarum (Fig. 3d). Dotted lines connect the time-windows corresponding to these concentration ranges to the time-windows in panel B. b, Growth of kefir species over time with dotted lines marking the time-windows corresponding to the lactate concentration ranges from (a). c, Growth of K. exigua and A. fabarum in kefir spent whey harvested at different time points (N=4 biologically independent samples; error bars = SD). Data are presented as mean values +/- SD.
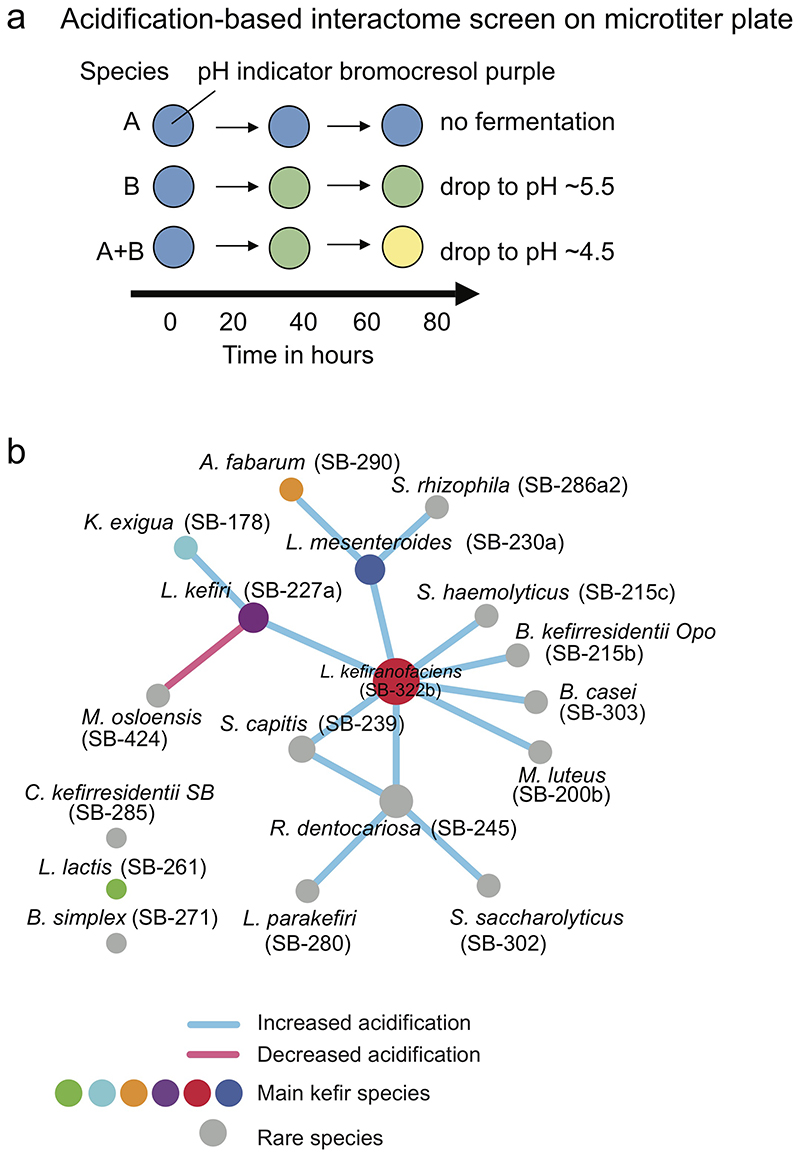
Extended Data Fig. 6. Interaction network between kefir species based on milk acidification assay.
a, Schematic depiction of the method used to map metabolic interactions based on fermentation acidification kinetics. Species were grown in 96-well plates alone or in pairs; acidification of milk was assessed with a soluble pH-indicator. Positive interactions were identified as those that showed increased acidification in co-culture compared to mono-cultures, while negative interactions as those that showed decreased acidification in co-culture. b, Network of metabolic interactions between kefir species (Interaction calling based on N = 6; 3 biological and 2 technical replicates). Node sizes indicate number of interactions. Raw R-values extracted from scan images are provided in Supplementary Table 24.
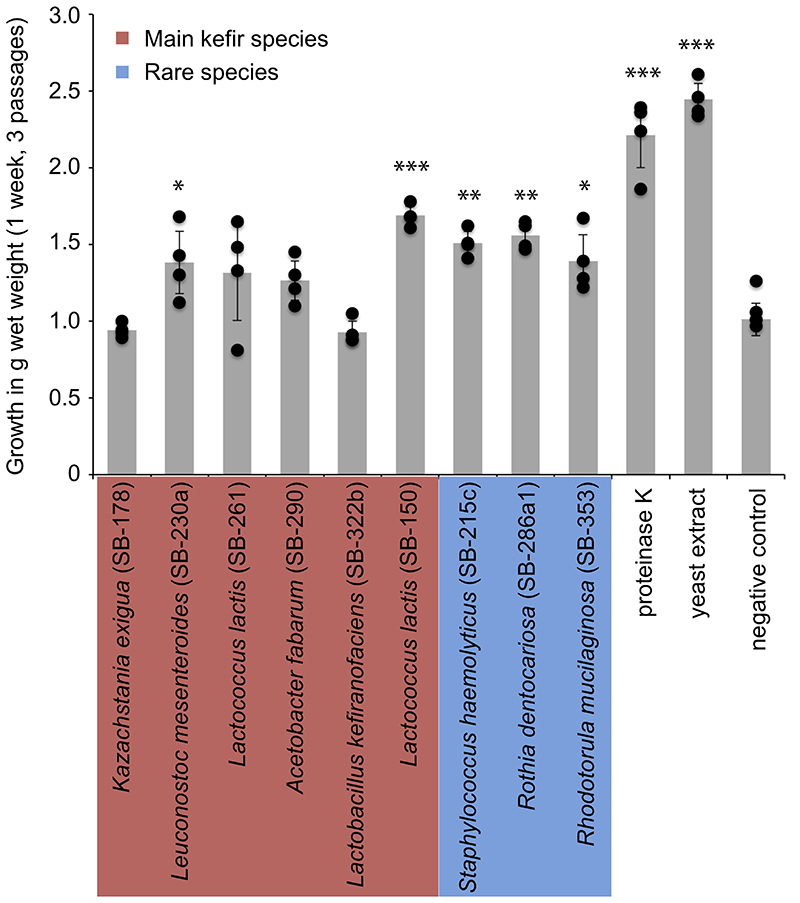
Extended Data Fig. 7. Kefir grain growth profits from rare species and supplements.
Different kefir species were supplemented to the UHT-milk used for kefir propagation in this study (Methods). This suspension was then used as a medium to grow kefir grains in. The gain in wet-weight after 3 passages (circa 1 week) was then compared to kefir grains grown in milk and milk supplemented with proteinase K and yeast extract, respectively. Compared to the negative control, many rare species and few main kefir species supported the growth of the kefir grain. However, the effect of addition of proteinase K and yeast extract to the milk medium had the biggest effect on grain growth. Significance estimated by using two-sided t-test, p-values: * <0.05, ** <0.01, *** <0.001. N=4 biologically independent samples, data are presented as mean values +/- SD. P-values: L. mesenteroides, 0,045; L. lactis (SB-150), 0,00034; S. haemolyticus, 0,0026; R. dentocariosa, 0,0012; Rhodotorula, 0,033; proteinase K, 0,00018; yeast extract, 8,83351E-07.
Extended Data Fig. 8. Contrast between the prevalence of positive and negative interactions between kefir species in milk (Liquid) and on milk plates (Solid).
Extended Data Fig. 9. Integrated view of metabolite cross-feeding between, left: L. kefiranofaciens and L. mesenteroides, and right: L. lactis and A. fabarum, based on genome-scale metabolic modeling, gene expression data and metabolite measurements.
The colored metabolic maps connected to species mark reactions in the metabolic network that are assessed to be up- or down-regulated in co-cultures.
Extended Data Fig. 10. Kefir community shift when passaged using kefir fermented milk as an inoculum instead of the kefir grain.
Supplementary Material
Acknowledgments
We thank the EMBL Genecore facility for help with (meta-)genomic sequencing; O. Ponomarova for help in collecting kefir grains, advice on cultivation, and for feedback on the manuscript; and K. Zirngibl for feedback on the manuscript. This work was sponsored by the German Ministry of Education and Research (BMBF, grant nr. 031A601B) as part of the ERASysAPP project SysMilk; and by the Innovation Fund Denmark through project Food Transcriptomics (grant nr. 6150-00033A).
Footnotes
Author contributions
S.B. and Y.K. conceived the project, designed and performed experiments, analyzed the data, and wrote the paper. R.M. performed untargeted metabolomics experiments plus data analysis, and quantitative analysis of aspartate and proline. E.K. and M.M. performed GC-MS and ion chromatography analysis. V.B. contributed to amplicon, metagenome, and mRNA sequencing. J.N. and B.T. contributed to experimental design. R.N. oversaw the targeted metabolomics analysis. D.M. contributed to amino acid profile analysis and interpretation. A.M., D.M., and G.Z. analyzed RNA-seq data. U.S. oversaw the exo-metabolome analysis. K.R.P. conceived the project, designed the experimental approach, oversaw the project, and wrote the paper.
Competing interests
The authors declare no competing interests.
Data availability
All data generated or analyzed during this study are included in this published article (and its supplementary information files). Genomes of isolated kefir species are available in the NCBI database (https://www.ncbi.nlm.nih.gov/) under the accession: PRJNA375758 (bioproject ID: 375758). Metatranscriptomic sequencing reads can be accessed from ENA (www.ebi.ac.uk/ena) under the project id PRJEB37001. Metabolomics data is available at Metabolights database (www.ebi.ac.uk/metabolights/); accession numbers: MTBLS1823, MTBLS1829, and MTBLS1830. Genome-scale metabolic models for kefir bacteria can be found at github.com/cdanielmachado/kefir_models.
Code availability
Custom scripts, models and databases used for metatranscriptomics analysis and genome-scale metabolic modeling are available at: github.com/cdanielmachado/kefir_paper/. All other computer code used in data analysis is available from the corresponding author upon reasonable request.
References
- 1.Mueller DB, Vogel C, Bai Y, Vorholt JA. The Plant Microbiota: Systems-Level Insights and Perspectives. 2016 doi: 10.1146/annurev-genet-120215-034952. [DOI] [PubMed] [Google Scholar]
- 2.Palleja A, et al. Recovery of gut microbiota of healthy adults following antibiotic exposure. Nat Microbiol. 2018;3 doi: 10.1038/s41564-018-0257-9. [DOI] [PubMed] [Google Scholar]
- 3.Faith JJ, et al. The Long-Term Stability of the Human Gut Microbiota. Science. 2013;340 doi: 10.1126/science.1237439. [DOI] [PMC free article] [PubMed] [Google Scholar]
- 4.Shade A, et al. Lake microbial communities are resilient after a whole-ecosystem disturbance. ISME J. 2012;6:2153–2167. doi: 10.1038/ismej.2012.56. [DOI] [PMC free article] [PubMed] [Google Scholar]
- 5.Allesina S, Tang S. Stability criteria for complex ecosystems. Nature. 2012;483:205–208. doi: 10.1038/nature10832. [DOI] [PubMed] [Google Scholar]
- 6.Fyodorov YV, Khoruzhenko BA. Nonlinear analogue of the May − Wigner instability transition. 2016;113 doi: 10.1073/pnas.1601136113. [DOI] [PMC free article] [PubMed] [Google Scholar]
- 7.Pennekamp F, et al. Biodiversity increases and decreases ecosystem stability. Nature. 2018 doi: 10.1038/s41586-018-0627-8. 101038/s41586-018-0627-8. [DOI] [PubMed] [Google Scholar]
- 8.Friedman J, Higgins LM, Gore J. Community structure follows simple assembly rules in microbial microcosms. Nat Publ Gr. 2017;1:1–7. doi: 10.1038/s41559-017-0109. [DOI] [PubMed] [Google Scholar]
- 9.Blasche S, Kim Y, Oliveira AP, Patil KR. Model Microbial Communities for Ecosystems Biology. Curr Opin Syst Biol. 2017;6:51–57. [Google Scholar]
- 10.Dubey GP, Ben-Yehuda S. Intercellular nanotubes mediate bacterial communication. Cell. 2011;144:590–600. doi: 10.1016/j.cell.2011.01.015. [DOI] [PubMed] [Google Scholar]
- 11.Ponomarova O, et al. Yeast creates a stable niche for symbiotic lactic acid bacteria through nitrogen overflow. Cell Syst. 2017 doi: 10.1016/j.cels.2017.09.002. [DOI] [PMC free article] [PubMed] [Google Scholar]
- 12.Wintermute EH, Silver PA. Emergent cooperation in microbial metabolism. Mol Syst Biol. 2010;6:407. doi: 10.1038/msb.2010.66. [DOI] [PMC free article] [PubMed] [Google Scholar]
- 13.Alessi AM, et al. Biotechnology for Biofuels Defining functional diversity for lignocellulose degradation in a microbial community using multiomics studies. 2018:1–16. doi: 10.1186/s13068-018-1164-2. [DOI] [PMC free article] [PubMed] [Google Scholar]
- 14.Rosenthal AZ, Matson EG, Eldar A, Leadbetter JR. RNA-seq reveals cooperative metabolic interactions between two termite-gut spirochete species in co-culture. ISME J. 2011;5:1133–1142. doi: 10.1038/ismej.2011.3. [DOI] [PMC free article] [PubMed] [Google Scholar]
- 15.Enke TN, Leventhal GE, Metzger M, Saavedra JT, Cordero OX. Microscale ecology regulates particulate organic matter turnover in model marine microbial communities. Nat Commun. 2018 doi: 10.1038/s41467-018-05159-8. [DOI] [PMC free article] [PubMed] [Google Scholar]
- 16.Ratzke C, Gore J. Modifying and reacting to the environmental pH can drive bacterial interactions. PLOS Biol. 2018;16:e2004248. doi: 10.1371/journal.pbio.2004248. [DOI] [PMC free article] [PubMed] [Google Scholar]
- 17.Baran R, et al. Exometabolite niche partitioning among sympatric soil bacteria. Nat Commun. 2015;6 doi: 10.1038/ncomms9289. 8289. [DOI] [PMC free article] [PubMed] [Google Scholar]
- 18.Yuan C, Chesson P. The relative importance of relative nonlinearity and the storage effect in the lottery model. Theor Popul Biol. 2015;105:39–52. doi: 10.1016/j.tpb.2015.08.001. [DOI] [PubMed] [Google Scholar]
- 19.Embree M, Nagarajan H, Movahedi N, Chitsaz H, Zengler K. Single-cell genome and metatranscriptome sequencing reveal metabolic interactions of an alkane-degrading methanogenic community. ISME J. 2014;8:757–767. doi: 10.1038/ismej.2013.187. [DOI] [PMC free article] [PubMed] [Google Scholar]
- 20.Venturelli OS, et al. Deciphering microbial interactions in synthetic human gut microbiome communities. 2018:1–19. doi: 10.15252/msb.20178157. [DOI] [PMC free article] [PubMed] [Google Scholar]
- 21.Wolfe BE, Button JE, Santarelli M, Dutton RJ. Cheese rind communities provide tractable systems for in situ and in vitro studies of microbial diversity. Cell. 2014;158:422–433. doi: 10.1016/j.cell.2014.05.041. [DOI] [PMC free article] [PubMed] [Google Scholar]
- 22.Goyal A, Dubinkina V, Maslov S. Multiple stable states in microbial communities explained by the stable marriage problem. ISME J. 2018:2823–2834. doi: 10.1038/s41396-018-0222-x. [DOI] [PMC free article] [PubMed] [Google Scholar]
- 23.Konopka A, Lindemann S, Fredrickson J. Dynamics in microbial communities: unraveling mechanisms to identify principles. ISME J. 2015;9:1488–1495. doi: 10.1038/ismej.2014.251. [DOI] [PMC free article] [PubMed] [Google Scholar]
- 24.Bourrie BCT, Willing BP, Cotter PD. The microbiota and health promoting characteristics of the fermented beverage kefir. Front Microbiol. 2016;7:1–17. doi: 10.3389/fmicb.2016.00647. [DOI] [PMC free article] [PubMed] [Google Scholar]
- 25.Motaghi M, et al. Short Communication: Kefir production in Iran. World J Microbiol Biotechnol. 1997;13:579–582. [Google Scholar]
- 26.Marsh AJ, Sullivan O, Hill C, Ross RP, Cotter PD. Sequencing-Based Analysis of the Bacterial and Fungal Composition of Kefir Grains and Milks from Multiple Sources. PLoS One. 2013;8 doi: 10.1371/journal.pone.0069371. [DOI] [PMC free article] [PubMed] [Google Scholar]
- 27.Gao J, Gu F, Abdella NH, Ruan H, He G. Investigation on Culturable Microflora in Tibetan Kefir Grains from Different Areas of China. J Food Sci. 2012;77 doi: 10.1111/j.1750-3841.2012.02805.x. [DOI] [PubMed] [Google Scholar]
- 28.Garofalo C, et al. Bacteria and yeast microbiota in milk kefir grains from different Italian regions. Food Microbiol. 2015;49:123–133. doi: 10.1016/j.fm.2015.01.017. [DOI] [PubMed] [Google Scholar]
- 29.Yang Y, et al. Proteomics evidence for kefir dairy in Early Bronze Age China. J Archaeol Sci. 2014;45:178–186. [Google Scholar]
- 30.Prado MR, et al. Milk kefir: Composition, microbial cultures, biological activities, and related products. Front Microbiol. 2015;6:1–10. doi: 10.3389/fmicb.2015.01177. [DOI] [PMC free article] [PubMed] [Google Scholar]
- 31.Farnworth ER. Handbook of Fermented Functional Foods. 2008 [Google Scholar]
- 32.Link H, Fuhrer T, Gerosa L, Zamboni N, Sauer U. Real-time metabolome profiling of the metabolic switch between starvation and growth. Nat Methods. 2015;12 doi: 10.1038/nmeth.3584. [DOI] [PubMed] [Google Scholar]
- 33.Ponomarova O, et al. Yeast Creates a Niche for Symbiotic Lactic Acid Bacteria through Nitrogen Overflow Article Yeast Creates a Niche for Symbiotic Lactic Acid Bacteria through Nitrogen Overflow. 2017:345–357. doi: 10.1016/j.cels.2017.09.002. [DOI] [PMC free article] [PubMed] [Google Scholar]
- 34.Dols M, Chraibi W, Remaud-Simeon M, Lindley ND, Monsan PF. Growth and energetics of Leuconostoc mesenteroides NRRL B-1299 during metabolism of various sugars and their consequences for dextransucrase production. Appl Environ Microbiol. 1997;63:2159–2165. doi: 10.1128/aem.63.6.2159-2165.1997. [DOI] [PMC free article] [PubMed] [Google Scholar]
- 35.Linares DM, et al. Factors influencing biogenic amines accumulation in dairy products. Front Microbiol. 2012;3:1–10. doi: 10.3389/fmicb.2012.00180. [DOI] [PMC free article] [PubMed] [Google Scholar]
- 36.Schönfeldt HC, Hall NG, Smit LE. The need for country specific composition data on milk. 2011:1–7. [Google Scholar]
- 37.Park YW. Impact of goat milk and milk products on human nutrition. Perspect Agric Vet Sci Nutr Nat Resour. 2007 doi: 10.1079/PAVSNNR20072081. [DOI] [Google Scholar]
- 38.Apelblat A. Citric acid. Springer; 2014. [DOI] [Google Scholar]
- 39.Law J, Haandrikman A. Proteolytic Enzymes of Lactic Acid Bacteria. Intr Dairy Jorunal. 1997;7:1–11. [Google Scholar]
- 40.Marty-Teysset C, Lolkema JS, Schmitt P, Diviès C, Konings WN. The citrate metabolic pathway in leuconostoc mesenteroides: Expression, amino acid synthesis, and α-ketocarboxylate transport. J Bacteriol. 1996;178:6209–6215. doi: 10.1128/jb.178.21.6209-6215.1996. [DOI] [PMC free article] [PubMed] [Google Scholar]
- 41.Samaržija D, Antunac N, Havranek JL. Taxonomy, physiology and growth of Lactococcus lactis: a review. Mljekarstvo. 2001;51:35–48. [Google Scholar]
- 42.Blasche S, Kim Y, Patil KR. Draft Genome Sequence of Corynebacterium kefirresidentii SB, Isolated from Kefir. Genome Announc. 2017;5:16–17. doi: 10.1128/genomeA.00877-17. [DOI] [PMC free article] [PubMed] [Google Scholar]
- 43.Kim Y, Blasche S, Patil KR. Draft Genome Sequences of Three Novel Low-Abundance Species Strains Isolated from Kefir Grain. Genome Announc. 2017;5:57–58. doi: 10.1128/genomeA.00869-17. [DOI] [PMC free article] [PubMed] [Google Scholar]
- 44.Bellengier P, Richard J, Foucaud C. Nutritional requirements of Leuconostoc mesenteroides subsp. mesenteroides and subsp. dextranicum for growth in milk. J Dairy Res. 1997;64:95–103. [Google Scholar]
- 45.Davies DT, White JCD. The use of ultrafiltration and dialysis in isolating the aqueous phase of milk and in determining the partition of milk constituents between the aqueous and disperse phases. J Dairy Res. 1960;27:171–190. [Google Scholar]
- 46.Hache C, et al. Influence of Lactose-Citrate Co-metabolism on the Differences of Growth and Energetics in Leuconostoc lactis, Leuconostoc mesenteroides ssp. mesenteroides and Leuconostoc mesenteroides sspcremoris. 1999;513:507–513. doi: 10.1016/S0723-2020(99)80002-2. [DOI] [PubMed] [Google Scholar]
- 47.Lacroix N, St-Gelais D, Champagne CP, Vuillemard JC. Gamma-aminobutyric acid-producing abilities of lactococcal strains isolated from old-style cheese starters. Dairy Sci Technol. 2013;93:315–327. [Google Scholar]
- 48.Adler P, et al. The key to acetate: Metabolic fluxes of acetic acid bacteria under cocoa pulp fermentation-simulating conditions. Appl Environ Microbiol. 2014;80:4702–4716. doi: 10.1128/AEM.01048-14. [DOI] [PMC free article] [PubMed] [Google Scholar]
- 49.Hom EFY, Murray AW. Niche engineering demonstrates a latent capacity for fungal-algal mutualism. Science. 2014;345:94–98. doi: 10.1126/science.1253320. [DOI] [PMC free article] [PubMed] [Google Scholar]
- 50.Goldford JE, et al. Emergent simplicity in microbial community assembly. Science. 2018;361:469–474. doi: 10.1126/science.aat1168. [DOI] [PMC free article] [PubMed] [Google Scholar]
- 51.Thaiss CA, et al. Article Transkingdom Control of Microbiota Diurnal Oscillations Promotes Metabolic Homeostasis. Cell. 2014;159:514–529. doi: 10.1016/j.cell.2014.09.048. [DOI] [PubMed] [Google Scholar]
- 52.Fuhrer T, Heer D, Begemann B, Zamboni N. High-throughput, accurate mass metabolome profiling of cellular extracts by flow injection-time-of-flight mass spectrometry. Anal Chem. 2011;83:7074–7080. doi: 10.1021/ac201267k. [DOI] [PubMed] [Google Scholar]
- 53.Kowalczyk M, Kolakowski P, Radziwill-Bienkowska JM, Szmytkowska A, Bardowski J. Cascade cell lyses and DNA extraction for identification of genes and microorganisms in kefir grains. J Dairy Res. 2011;79:26–32. doi: 10.1017/S0022029911000677. [DOI] [PubMed] [Google Scholar]
- 54.Kim D-H, et al. Rapid detection of Lactobacillus kefiranofaciens in kefir grain and kefir milk using newly developed real-time PCR. J Food Prot. 2015;78:855–8. doi: 10.4315/0362-028X.JFP-14-329. [DOI] [PubMed] [Google Scholar]
- 55.Zimmermann M, et al. Dynamic exometabolome analysis reveals active metabolic pathways in non-replicating mycobacteria. Environ Microbiol. 2015;17:4802–4815. doi: 10.1111/1462-2920.13056. [DOI] [PMC free article] [PubMed] [Google Scholar]
- 56.Kanani HH, Klapa MI. Data correction strategy for metabolomics analysis using gas chromatography-mass spectrometry. Metab Eng. 2007;9:39–51. doi: 10.1016/j.ymben.2006.08.001. [DOI] [PubMed] [Google Scholar]
- 57.Corradini C, Cavazza A, Bignardi C. High-Performance Anion-Exchange Chromatography Coupled with Pulsed Electrochemical Detection as a Powerful Tool to Evaluate Carbohydrates of Food Interest: Principles and Applications. Int J Carbohydr Chem. 2012;2012 [Google Scholar]
- 58.Mullin WJ, Emmons DB. Determination of organic acids and sugars in cheese, milk and whey by high performance liquid chromatography. 1997;30:147–151. [Google Scholar]
- 59.Martin M. Cutadapt removes adapter sequences from high-throughput sequencing reads. 2011:1–3. doi: 10.14806/ej.17.1.200. [DOI] [Google Scholar]
- 60.Zhang J, Kobert K, Flouri T, Stamatakis A. PEAR: A fast and accurate Illumina Paired-End reAd mergeR. Bioinformatics. 2014;30:614–620. doi: 10.1093/bioinformatics/btt593. [DOI] [PMC free article] [PubMed] [Google Scholar]
- 61.Callahan BJ, et al. DADA2: High-resolution sample inference from Illumina amplicon data. Nat Methods. 2016;13:581–583. doi: 10.1038/nmeth.3869. [DOI] [PMC free article] [PubMed] [Google Scholar]
- 62.Rognes T, Flouri T, Nichols B, Quince C, Mahé F. VSEARCH: a versatile open source tool for metagenomics. PeerJ. 2016;4:e2584. doi: 10.7717/peerj.2584. [DOI] [PMC free article] [PubMed] [Google Scholar]
- 63.Bokulich NA, et al. Optimizing taxonomic classification of marker-gene amplicon sequences with QIIME 2’s q2-feature-classifier plugin. Microbiome. 2018;6:1–17. doi: 10.1186/s40168-018-0470-z. [DOI] [PMC free article] [PubMed] [Google Scholar]
- 64.McDonald D, et al. An improved Greengenes taxonomy with explicit ranks for ecological and evolutionary analyses of bacteria and archaea. ISME J. 2012;6:610–618. doi: 10.1038/ismej.2011.139. [DOI] [PMC free article] [PubMed] [Google Scholar]
- 65.Kõljalg U, et al. Towards a unified paradigm for sequence-based identification of fungi. Mol Ecol. 2013;22:5271–5277. doi: 10.1111/mec.12481. [DOI] [PubMed] [Google Scholar]
- 66.Klindworth A, et al. Evaluation of general 16S ribosomal RNA gene PCR primers for classical and next-generation sequencing-based diversity studies. Nucleic Acids Res. 2013;41:1–11. doi: 10.1093/nar/gks808. [DOI] [PMC free article] [PubMed] [Google Scholar]
- 67.Milanese A, et al. Microbial abundance, activity and population genomic profiling with mOTUs2. Nat Commun. 2019 doi: 10.1038/s41467-019-08844-4. [DOI] [PMC free article] [PubMed] [Google Scholar]
- 68.Seemann T. Prokka: rapid prokaryotic genome annotation. Bioinformatics. 2014;30:2068–2069. doi: 10.1093/bioinformatics/btu153. [DOI] [PubMed] [Google Scholar]
- 69.Love MI, Huber W, Anders S. Moderated estimation of fold change and dispersion for RNA-seq data with DESeq2. Genome Biol. 2014:1–21. doi: 10.1186/s13059-014-0550-8. [DOI] [PMC free article] [PubMed] [Google Scholar]
- 70.Machado D, Herrg MJ, Rocha I. Stoichiometric Representation of Gene – Protein – Reaction Associations Leverages Constraint-Based Analysis from Reaction to Gene-Level Phenotype Prediction. PLoS Comput Biol. 2016:1–24. doi: 10.1371/journal.pcbi.1005140. [DOI] [PMC free article] [PubMed] [Google Scholar]
- 71.Huerta-cepas J, et al. Fast Genome-Wide Functional Annotation through Orthology Assignment by eggNOG-Mapper. Mol Biol Evol. 2017;34:2115–2122. doi: 10.1093/molbev/msx148. [DOI] [PMC free article] [PubMed] [Google Scholar]
- 72.Machado D, Andrejev S, Tramontano M, Patil KR. Fast automated reconstruction of genome-scale metabolic models for microbial species and communities. 2018;46:7542–7553. doi: 10.1093/nar/gky537. [DOI] [PMC free article] [PubMed] [Google Scholar]
Associated Data
This section collects any data citations, data availability statements, or supplementary materials included in this article.
Supplementary Materials
Data Availability Statement
All data generated or analyzed during this study are included in this published article (and its supplementary information files). Genomes of isolated kefir species are available in the NCBI database (https://www.ncbi.nlm.nih.gov/) under the accession: PRJNA375758 (bioproject ID: 375758). Metatranscriptomic sequencing reads can be accessed from ENA (www.ebi.ac.uk/ena) under the project id PRJEB37001. Metabolomics data is available at Metabolights database (www.ebi.ac.uk/metabolights/); accession numbers: MTBLS1823, MTBLS1829, and MTBLS1830. Genome-scale metabolic models for kefir bacteria can be found at github.com/cdanielmachado/kefir_models.
Custom scripts, models and databases used for metatranscriptomics analysis and genome-scale metabolic modeling are available at: github.com/cdanielmachado/kefir_paper/. All other computer code used in data analysis is available from the corresponding author upon reasonable request.


