Abstract
Epidemiological studies have identified many environmental agents that appear to significantly increase cancer risk in human populations. By analysis of tumour genomes from mice chronically exposed to one of 20 known or suspected human carcinogens, we reveal that most agents do not generate distinct mutational signatures or increase mutation burden, with most mutations, including driver mutations, resulting from tissue specific endogenous processes. We identify signatures resulting from exposure to cobalt and vinylidene chloride and link distinct human signatures (SBS19 and SBS42) with 1,2,3-Trichloropropane (TCP), a haloalkane and pollutant of drinking water, and find these and other signatures in human tumour genomes. We define the cross-species genomic landscape of tumours induced by an important compendium of agents with relevance to human health.
Keywords: Carcinogenesis, mutational signatures, cancer genomics, environmental exposures
Introduction
In recent years, new computational approaches applied to the analysis of human tumours have defined more than 49 mutational signatures; DNA sequence contexts in which mutations may accumulate in response to both endogenous processes and exogeneous exposures1,2. These signatures are usually represented as single nucleotide substitutions and the 5’ and 3’ bases that flank the change which provide a proximal sequence context. In addition to single nucleotide signatures, indel, dinucleotide, structural variant and copy number signatures have also been defined, each inferring that a mutational process has been operative1. Thus, mutational signatures chronicle the life history of a cell by recording the fingerprints of past exposures. Much of our current understanding of the causal role that exposures play in inducing cancer has come from model systems. In particular studies involving mice and rats have allowed the carcinogenic effects of a range of chemicals to be assessed. These in vivo models have proven to be hugely informative with the contribution of more than 30 important carcinogens, such as dichlorodiphenyltrichloroethane (DDT), vinyl chloride and formaldehyde, being identified in rodents before their contribution to human carcinogenesis had been defined3. Importantly, rodent models may be exposed to carcinogens or cancer-promoting agents over months or years, similar to environmental exposures in humans, and thus may provide a better representation of the carcinogenic activities of chemicals when compared to experiments performed in cell culture systems4.
In this study, we profile the DNA mutational signatures in mice exposed to 20 known or suspected human carcinogens found to accelerate tumorigenesis in mice. By sequencing lung and/or liver tumours induced by these agents, we identify carcinogen-associated mutational signatures and also endogenous processes operative in these tissues. Remarkably, we identify a definitive carcinogen-associated DNA mutational signature for only 3 chemicals and find that hotspot driver mutations are likely caused by endogenous processes, suggesting that many agents may function to enhance tumour growth rather than being directly mutagenic themselves, or exert their effects via other mechanisms. This is consistent with the discovery of potent driver mutations in normal tissues suggesting that it is not driver gene acquisition that is rate limiting in tumourigenesis but the clonal outgrowth of mutant cells, a phenotype that might be modified by specific exposures. Importantly, in addition to our analysis of mouse tumours, we performed a pan-cancer analysis of 4,645 whole genomes and 19,184 whole exomes1, revealing mutation profiles of specific chemicals in mice that are found in the mutation catalogue of human cancers, thus providing translation of our observations to humans with relevance to public health.
Results
Tumour collection and experimental design
Frozen tumours from B6C3F1_N mice that formed spontaneously due to aging or following chronic repeat dose exposure to chemical agents for 2 years were obtained from the tissue archives of the US National Toxicology Program (NTP) (Life Science Reporting Summary). B6C3F1_N mice are a classic murine cancer model developed in the 1960s5 and are an F1 hybrid between female C57BL_6N and male C3H_HeN, two highly-characterised inbred common laboratory strains6. This model has been described in detail and was originally selected because of its high sensitivity to hepatocellular tumours5,7. In total, we analysed tumours from mice exposed to 20 chemicals (Table 1& Supplementary Table 1); for 9 chemicals we had both alveolar_bronchiolar (lung) and hepatocellular (liver) tumours, while for 11 chemicals we had liver tumours only. As a comparator, untreated (spontaneous) tumours (originating in lung or liver) were also analysed. As described below we also analysed renal cell (kidney) tumours induced by vinylidene chloride (VDC) and forestomach (squamous cell carcinomas) tumours induced by 1,2,3-Trichloropropane (TCP). For each tissue and chemical, we sequenced on average 5-6 whole tumour genomes; 188 tumours in total (Supplementary Table 2). Aged-matched normal control tissues (germline genomes) from 29 mice (9 matched_20 unmatched) were also sequenced to allow us to identify somatic variants (see Methods). There were several notable features of our tumour collection. Firstly, all of the chemicals used to treat mice were known, probable or possible carcinogens as defined by the International Agency for Research on Cancer (IARC) with IARC designations 1, 2A or 2B, the exception being pentabromodiphenyl ether mixture (DE-71), a flame retardant, and sodium tungstate dihydrate which is used in fire and water proofing of fabrics. All compounds were nominated for testing by the NTP due to public health concerns about their potential carcinogenicity (Table 1 & Supplementary Table 1). Secondly, the chemicals used to induce the tumours we sequenced (16_20) had significantly increased tumour incidence in mice in the NTP bioassay protocol4, a two-year chronic toxicology and carcinogenicity exposure assay, with clear/some evidence of tumorigenicity, thus increasing the chances that chemical exposure had directly precipitated tumour induction or progression. More specifically, the NTP defined these chemicals as showing either a statistically significant dose-related (i) increase of malignant neoplasms, (ii) increase of a combination of malignant and benign neoplasms, or (iii) a marked increase of benign neoplasms if there is an indication that these tumours can progress to malignancy. Finally, 6 chemicals had previously been defined as mutagenic in the classical Ames test, which assesses genotoxicity by scoring for bacterial growth under selective conditions8, and 13 had not, while Nickel subsulfide was equivocal. The tumours we analysed covered a wide chemical space with multiple modes of action reflective of the broad range of agents known to induce cancer.
Table 1. The tumour collection analysed in this study.
A full list of all experimental details can be found in the National Toxicology Programme (NTP) technical reports (second column). Further details on each chemical are provided in Supplementary Tables 1 & 2.
| Chemicals | NTP technical report # | IARC Classification | Administration route | Lung | Liver | Kidney | Forestomach | NTP Bioassay Result | Ames Test |
|---|---|---|---|---|---|---|---|---|---|
| Spontaneously arising in controls | N/A | N/A | 12 | 11 | N/A | N/A | |||
| ANTIMONY TRIOXIDE | NTP TR 590 | 2B | Inhalation | 5 | 6 | Clear evidence | Negative | ||
| ISOBUTYL NITRITE | NTP TR 448 | 2B | 6 | 6 | Some evidence | Positive | |||
| COBALT METAL | NTP TR 581 | 2B | 6 | 5 | Clear evidence | Positive | |||
| NICKEL OXIDE | NTP TR 451 | 1 | 5 | 4 | Equivocal evidence | Negative | |||
| NICKEL SUBSULFIDE | NTP TR 453 | 1 | 4 | 3 | No Evidence | Equivocal | |||
| NICKEL SULFATE HEXAHYDRATE | NTP TR 454 | 1 | 6 | 6 | No Evidence | Negative | |||
| SODIUM TUNGSTATE DIHYDRATE | N/A | N/A | Drinking water | 6 | 6 | In progress | Negative | ||
| VANADIUM PENTOXIDE | NTP TR 507 | 2B | Inhalation | 3 | 6 | Clear evidence | Negative | ||
| VINYLIDENE CHLORIDE | NTP TR 582 | 2B | 5 | 7 | 6 | Clear evidence | Negative | ||
| 1,2,3-TRICHLOROPROPANE | NTP TR 384 | 2A | Gavage | 4 | 5 | Clear evidence | Positive | ||
| ANTHRAQUINONE | NTP TR 494 | 2B | Feed | 5 | Clear evidence | Negative | |||
| BROMOCHLOROACETIC ACID | NTP TR 549 | 2B | Drinking water | 5 | Clear evidence | Positive | |||
| CUMENE | NTP TR 542 | 2B | Inhalation | 5 | Clear evidence | Negative | |||
| DIETHANOLAMINE | NTP TR 478 | 2B | Topical application | 5 | Clear evidence | Negative | |||
| FURAN | NTP TR 402 | 2B | Gavage | 5 | Clear evidence | Negative | |||
| GINKGO BILOBA EXTRACT | NTP TR 578 | 2B | 3 | Clear evidence | Positive | ||||
| OXAZEPAM | NTP TR 443 | 2B | Dosed-feed | 5 | Clear evidence | Negative | |||
| INDIUM PHOSPHIDE | NTP TR 499 | 2A | Inhalation | 5 | Clear evidence | Negative | |||
| PRIMACLONE | NTP TR 476 | 2B | Dosed-feed | 5 | Clear evidence | Positive | |||
| DE-71 (PENTABROMODIPHENYL ETHER MIXTURE) | NTP TR 589 | N/A | Gavage | 5 | Clear evidence | Negative |
Single nucleotide variant calling and mutational frequencies
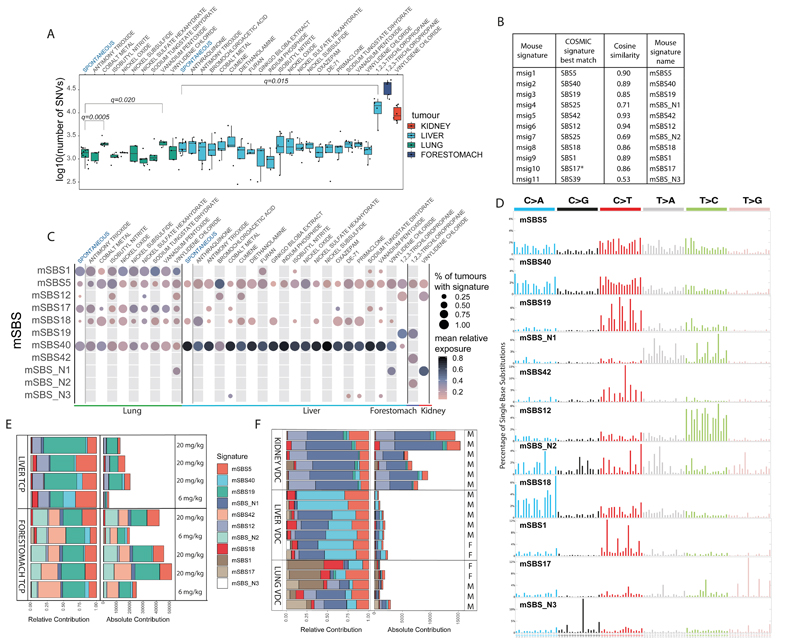
Since many cancer-associated agents are known to alter DNA at the nucleotide level, we first analysed the frequency of somatic SNVs. Remarkably, of the 20 chemicals we analysed only three significantly increased the mutation number; 1,2,3-trichloropropane (TCP) in liver tumours, and cobalt and vanadium pentoxide in lung tumours (q-value<0.05, Mann-Whitney U-test). Forestomach tumours induced by TCP and kidney tumours induced by vinylidene chloride (VDC) had more than two-fold the number of mutations of the other tumours in the collection and up to 10-fold more in several cases (Fig. 1A). For VDC, a chemical widely used in the 1980-90s for the manufacture of plastic film (Saran wrap), our initial analysis was performed on lung tumours with the subsequent sequencing of liver and kidney tumours from mice treated with this compound showing an increased mutation burden in the kidney (Fig. 1A). The difference in mutation load observed in different tissues may be attributed to tissue specific differences in toxicokinetics, or DNA repair. It was notable that the agents primaclone, Ginkgo biloba extract and isobutyl nitrite, which have previously been defined as Ames test positive did not appear to show more mutations than chemicals previously defined as Ames test negative (Table 1 & Supplementary Table 1). Similarly, spontaneous tumours had, on average, the same number of mutations as tumours from most chemically treated mice. Thus, our survey of human carcinogens in mice suggests that most do not increase mutation burden, even though they do enhance tumorigenesis.
Fig. 1.
The landscape of Mouse Single Base Substitution (mSBS) signatures induced by chemical exposures and endogenous mutagenic processes. A, Mutational burden across the collection of lung, liver, kidney and forestomach tumours sequenced in this study. The central line represents the median, the lower line is the first quantile (Q1) and the upper line is the third quantile (Q3). The upper whisker extends from Q3 to 1.5 times the inter-quartile range (IQR), the lower whisker extends from Q 1to 1.5 times the IQR. Cobalt and vanadium pentoxide in lung and TCP in liver have significantly more substitutions than the corresponding spontaneous tumours (FDR-corrected one-sided Mann-Whitney U-test). B, Comparison of mouse substitution signatures to human signatures. *SBS17=SBS17a and SBS17b. C, Contribution of mSBS signatures across lung, liver, kidney and forestomach tumours, grouped by chemical exposure. The size of the dots corresponds to the percentage of samples in each category having a minimal contribution level of 10% from the signature. The colour represents the mean relative contribution for the samples where the signature contribution is ≥10%. Of note, mSBS_N3 was detected in a spontaneous liver tumour just below this threshold. D, Profile of the catalogue of mSBS Signatures. E, Common and unique mutational signatures in liver and forestomach tumours from mice exposed to TCP. mSBS19 (dark green) is present in liver and forestomach tumours. mSBS42 and mSBS_N2 (light green) are present only in forestomach tumours. Treatment dose is shown. F, Common and unique mutational signatures in lung, liver and kidney tumours from mice exposed to vinylidene chloride (VDC). The mutational burden varied greatly based on tissue. For clarity, mSBS5 (light red) is shown at the top of the stacked bars and mSBS18 (dark red) towards the bottom. M and F refer to male and female, respectively.
Endogenous and chemically-induced mutational signatures
To further explore the genetic effects of the collection of agents analysed in this study, we performed de novo mutational signature extraction using a Hierarchical Dirichlet Process (HDP, https://github.com/nicolaroberts/hdp) on 181 of the whole tumour genomes. Results were replicated using SigProfilerExtractor1 (see Methods). Seven tumours (7_188) were not included in this analysis because they had fewer than 200 SNVs, a figure close to the predicted genome-wide false positive SNV rate (Supplementary Table 3). HDP analysis revealed 11 trinucleotide mutational signatures (Fig. 1B-D). We decomposed these 11 mouse signatures, which we called msig1-msig11, into the 49 distinct single base substitution signatures (SBS) recently defined in human cancer genomes1 (Fig. 1B & Supplementary Table 4) so as to identify mouse single base substitution signatures (mouse SBS_mSBS) that aligned with the human COSMIC signature catalogue, where the aetiology of each signature has been proposed1. In this way we identified 8 signatures that could be explained as known human signatures, having a cosine similarity higher than 0.85 with a COSMIC signature (we designated these mSBS1, 5, 12, 17, 18, 19, 40, 42; Fig. 1B & D). In general, these signatures co-occurred with the flat signature SBS40 and in one case with SBS5. As part of this analysis we also identified 3 signatures (mSBS_N1, mSBS_N2 and mSBS_N3) that had a cosine similarity lower than 0.85 with any of the known COSMIC signatures and could not be decomposed using a maximum of 3 human signatures (Fig. 1B & Supplementary Table 4). One of these signatures, mSBS_N2, was present only in forestomach tumours induced with TCP. Although this signature showed highest similarity to SBS25, albeit with a cosine of only 0.69, we noted that its T>A spectra was similar to SBS22 (cosine similarity 0.94).
Our analysis of mutational signatures had several notable features. Firstly, four signatures were exclusively observed in animals exposed to a chemical and were thus specific exogenous signatures (Fig.1C). Namely, mSBS19 was caused by exposure to TCP, while mSBS42 and mSBS_N2 were also caused by exposure to TCP but these signatures were only present in forestomach tumour samples (Fig. 1C & E). Notably, SBS42 (cosine similarity of 0.93 with mSBS42) has previously been described as associated with exposure to haloalkanes9, a chemical class of which TCP is a member (CAS No. 96-18-4). Our analysis also revealed that mSBS_N1 was associated with vinylidene chloride (VDC) exposure with this signature showing a predominance of T>A and T>C nucleotide changes. Intriguingly, for many chemical treatments we could not identify a specific mutational signature and it remains possible that we did not have the resolving power to compute a signature, or that these agents contribute to tumour formation via mechanisms that are not associated with either mutagenesis or a distinct mutational signature in the tissues we examined. Analyses to identify signatures in the pentanucleotide context, to link mutations resulting from chemical exposures with histone marks, open chromatin, strand asymmetry (Supplementary Table 5) or mutation clustering did not reveal any statistically significant associations (Extended Data Fig. 1 & 2).
We noted that the HDP algorithm defined a number of tissue-enriched signatures. For example, mSBS1 and mSBS17 were prominent signatures in lung, while signature mSBS40 was stronger in liver (p-value<0.001, Mann-Whitney U-test) (Fig. 1C). Since mSBS1, mSBS5, mSBS12, mSBS17, mSBS18 and mSBS40 were also found in the spontaneous tumours we sequenced and show a high cosine similarity to human mutational signatures identified from both tumour and normal tissue sequencing1, they are most likely endogenous, spontaneously arising signatures caused by conserved metabolic and_or cellular processes. Interestingly, mSBS1 and mSBS5, with high cosine similarity to human signatures 1 and 5, have been defined as “clock-like”_age-associated signatures and have previously been observed in human lung and liver cancers10. It is intriguing that these signatures have accumulated in tissues from a mouse whose lifespan had not exceeded two years, suggesting species differences in the rate of signature accumulation. It is also notable that mSBS_N3, previously identified in cultures of murine embryonic fibroblasts and believed to be a tissue culture-associated artefact11,12, was identified in vivo in our study. This signature is associated with mutations in our liver tumour collection, including a spontaneous liver tumour, suggesting that it likely represents an endogenous signature. To further explore the signatures across our tumour collection we clustered individual tumours based on their signature profiles (Extended Data Fig. 3) and noted spontaneous tumours did not cluster, with mutations from these tumours appearing to be primarily the result of the abovementioned endogenous signatures. Contrary to what has been described in human tumours1, we identified mSBS12 (cosine similarity of 0.94 with SBS12) in lung cancer samples at low levels, including spontaneous lung cancers(Fig. 1C & Extended Data Fig. 3). Consequently, mSBS12 appears to be an endogenous signature without evidence of being liver specific.
In sequencing our tumour collection, we had first analysed tumours from lung and noted a signature associated with VDC exposure. We replicated this signature by sequencing both liver and kidney tumours again seeing a large proportion of the mutation catalogue for these tumours dominated by signature mSBS_N1, in addition to the tissue specific signatures noted above (Fig. 1F). While all kidney samples exposed to VDC showed a strong mSBS_N1 signature, the presence of this signature was not statistically significant in 2 out of 7 liver cancers and in 1 out of 5 lung cancers. Thus, tissue-specific metabolism or the metabolic activation of the chemical in vivo may influence the presence of this exogenous signature. Notably, Cytochrome P450 CYP2E1 has been suggested to be involved in VDC activation in mice and is primarily expressed in liver, lung and kidney with expression in pre-malignant lesions also observed13. Expression of Cyp2e1 has been shown to be sexually dimorphic which potentially explains why male mice show a higher incidence of renal tumours in the NTP bioassay14.
Relationship between DNA mutations and genome topography
To further explore our mutation catalogue, we computed the transcriptional strand bias, which we define here as the difference in mutation occurrence between transcribed and untranscribed strands(Fig. 2A, Supplementary Table 6). This analysis revealed a strong transcriptional strand bias for mSBS19, mSBS42, mSBS_N1 and mSBS_N2, a result consistent with their exogenous nature and the repair of DNA adducts by transcription-coupled nucleotide excision repair15. Interestingly, we also observed a significant transcriptional strand bias for mSBS5 and mSBS12 in liver but not in lung. These analyses were replicated per sample and per signature (Supplementary Table 6A&B). Transcription strand biases were most prominent in those samples with a high mutational load, for example mSBS_N1 in kidney VDC samples (Fig. 2A&B), but no apparent bias in lung or liver samples induced with the same chemical.
Fig. 2.
Transcriptional strand bias and replication timing of mutations in mouse lung, liver, kidney and forestomach tumours. A, Transcriptional strand bias for signatures in different tumour tissues. The size of the dots represents significance (FDR-corrected two-sided binomial test) while the colour represents log2 of the enrichment. For lung and liver, we report all signatures. For kidney and forestomach, we selected only signatures with a significant transcriptional strand bias. All data are available in Supplementary Table 6. B, Difference in the number of substitutions on the transcribed and untranscribed strand in tumours induced with VDC in kidney and TCP in liver. C, Replication timing bias for signatures in tumours from different tissues. The size of the dots represents significance (FDR-corrected two-sided binomial test) while the colour represents log2 of the enrichment. For lung and liver, we report all signatures. We selected the same samples as in A. All data are available in Supplementary Table 7. D, Two liver tumours where mSBS_N3, which is generally present at low levels in other tumours, is prominent. E, Mutation of WGCC motifs in samples with mSBS_N3 altering the underlined nucleotide C>G and C>T.
We next examined the difference in the number of SNVs in relation to mSBS signatures and to replication timing domains (RTDs). To do this we considered the difference in the number of mutations in the first 3 deciles (early-replicating) compared to the last 3 deciles (late-replicating) with these regions defined by repli-chip analysis of mouse endodermal cells16 (see Methods). In this way, we could identify a statistically significant enrichment (q-value<0.01, binomial test) of mutations in late-replicating regions for almost all the signatures (Fig.2C, Supplementary Table 7A&B) consistent with previous studies in human cancers17-19. mSBS_N3 was the only exception, where mutations were biased towards early replicating regions (Fig. 2C). Of note, the enrichment of mutations in early replicating regions has been reported in human tumours in association with the APOBEC mutational signatures20 and although the aetiology of mSBS_N3 is presently unclear we also observed mSBS_N3-associated mutations had a high discrete probability of being located in TCT and GCC sequences, which are typical APOBEC3 and AID hotspots21. A or T mutations (82% and 73%) at the 5’-end of both the G[C>G]C and G[C>T]C context of GCC sequences were significantly more common (p-value<2.2e-16, binomial test) in the presence of mSBS_N3 (Fig. 2D). Collectively, these observations are in keeping with previous findings in human tumours and are of relevance for mouse models of human carcinogenesis.
Dinucleotide and indel mutational signatures
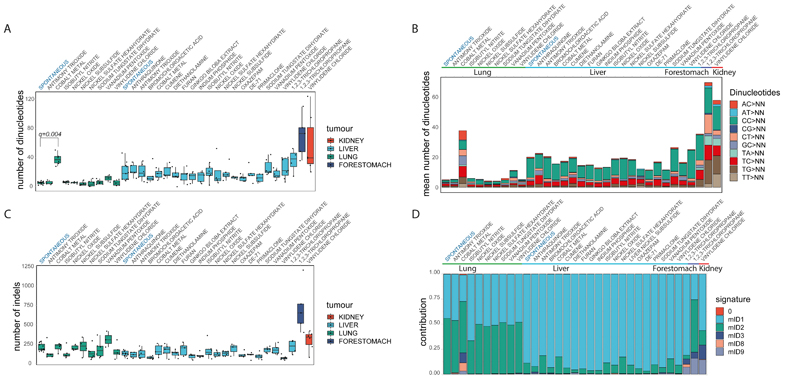
Dinucleotide mutations had a lower frequency compared to SNVs in our mutation catalogue, while a significantly higher number of mutant dinucleotides were found in liver tumours when compared to lung tumours (p-value<1x10-11, two-sided Mann-Whitney U-test, Fig. 3A). The number of dinucleotides varied depending on the tissue type largely independent of the chemical exposure. In lung tumours from cobalt exposed mice we observed a higher number of dinucleotides (q-value< 0.01, one-sided Mann-Whitney U-test) (Fig. 3B) and a specific dinucleotide signature that was evident after de novo signature extraction (Extended Data Fig. 4).
Fig. 3.
Doublet/dinucleotide Base Substitution and Indel Signatures. A, Number of dinucleotide substitutions across the collection of lung, liver, kidney and forestomach tumours. Liver tumours have, in general, a higher number of dinucleotide substitutions than lung tumours (two-sided Mann-Whitney U-test). Cobalt induced lung tumours have a significant higher number of altered dinucleotides compared to the other lung tumours (FDR-corrected one-sided Mann-Whitney U-test). The central line represents the median, the lower line is the first quantile (Q1) and the upper line is the third quantile (Q3). The upper whisker extends from Q3 to 1.5 times the inter-quartile range (IQR), the lower whisker extends from Q 1to 1.5 times the IQR. B, Median number and types of doublet base substitutions per tumour tissue and chemical exposure. C, Number of indels in lung, liver, kidney and forestomach tumours. Lung tumours have, in general, a higher number of indels than liver tumours (two-sided Mann-Whitney U-test). Boxes and line are as described in A. D, Relative contribution of COSMIC indel Signatures. The types of indels are mainly driven by tissue type, with lung tumours having an higher mID2 activity (two-sided Mann-Whitney U-test). Signature 0 (red) represents background. More details are provided in Extended Data Fig. 5.
In general, lung samples were characterized by a higher number of indels compared to liver samples (p-value<1x10⁻⁴, two-sided Mann-Whitney U-Test, Fig. 3C). Using HDP with priors (indel signatures identified in human cancer genomes) we identified 6 indel signatures (mID), comprising a background signature 0 and 5 indel signatures (mID1, 2, 3, 8, 9) that have previously been described in the genomes of human tumours1 (Fig. 3D & Extended Data Fig. 5). mID8 has been associated with DNA double strand break (DSB) repair by DNA end-joining mechanisms1 and was significantly present only in lung tumours from mice exposed to cobalt, which has been suggested to be a clastogen capable of inducing chromosomal breaks22.
The driver gene landscape of mouse lung and liver tumours
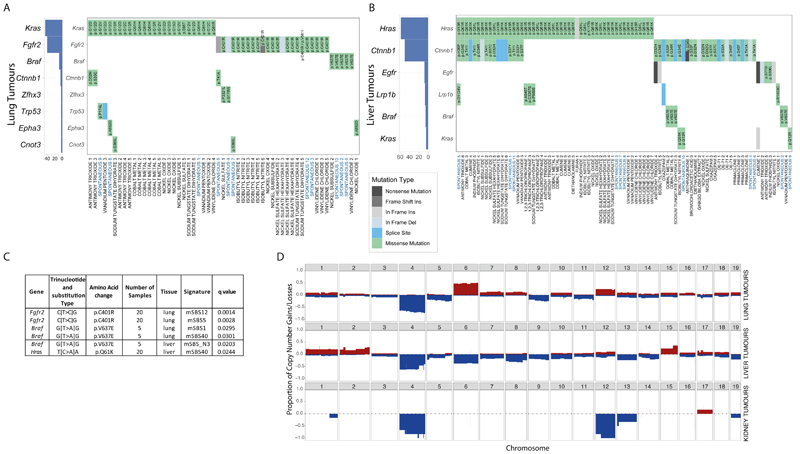
Mutations in driver genes can illuminate biological pathways that promote cancer. We first identified mouse orthologues of the 299 human driver genes reported in Bailey et al.,23 and of the COSMIC cancer gene census Tier 1 list. Next, we determined the consequences of somatic mutations in these genes on the protein sequence. In lung tumours we identified Kras, Fgfr2 and Braf, as mutually exclusive and recurrently mutated genes in 45%, 40% and 9% of tumours, respectively (Fig. 4A). In lung tumours from cobalt treated mice, we observed Krascodon 61 mutations, while Krasmutations in tumours induced with other chemicals were generally in codons 12 and 13 (p-value =0.044, Fisher’s exact test). Liver tumours were found to have mutually exclusive mutations in Hras(45%), Egfr(6%), Braf(4%) and Kras(4%) (Fig. 4B). Ctnnb1 mutations were frequent both with and without co-mutation of Hras.
Fig. 4.
Driver genes, the association between specific hotspot mutations and SBS signatures, and copy number variant profiles. A, Driver genes detected in at least 3% of lung tumours. Kras, Fgfr2and Brafmutations are mutually exclusive. B, Driver genes in at least 3% of liver tumours. Hras, Egfrand Brafmutations are mutually exclusive. C, Significant associations between specific hotspot mutations in driver genes and mSBS signatures (FDR-corrected one-sided Mann-Whitney U-test). The identified mSBSs were classified as endogenous signatures because they were present in spontaneous tumours within the collection. Further details are provided in Supplementary Table 9. D, Frequency of copy number gains (shown in red) _losses (shown in blue) in lung, liver and kidney tumours.
We next tested if there were any associations between driver genes and exposure to specific chemicals (Supplementary Table 8) revealing that lung tumours from cobalt exposed mice had a higher frequency of Kras mutations than tumours induced by other chemicals and that isobutyl nitrite exposed mice had more Fgfr2 mutations (q-value<0.05, Fisher’s exact test). We could not find any association between exposures and the driver genes in the liver tumour genomes we sequenced.
To assess the relationship between the acquisition of driver gene mutations and mutational processes, we first identified driver positions where there were more than 5 samples showing a specific hotspot mutation in tumours from the same tissue. We next used two statistical approaches, a Mann-Whitney U-test to test the link between the level of signature exposure and the presence of a hotspot driver mutation and a Maximum likelihood (ML)-based approach to determine the signature most likely to be response for a mutation based on the mutation type and trinucleotide context. This approach computes an association using the repertoire of signatures found in each sample. Using the Mann-Whitney U-test we determined that signatures mSBS5, mSBS12, mSBS_N3, mSBS1 and mSBS40 are most likely to explain the hotspot mutations in the genes Fgfr2, Braf and Hras(Fig. 4C, Supplementary Table 9). The ML-based approach yielded largely similar results (Supplementary Table 10A&B) with both methods overwhelmingly associating hotspot driver mutations with endogenous mutational processes.
The copy-number landscape of chemically-induced tumours
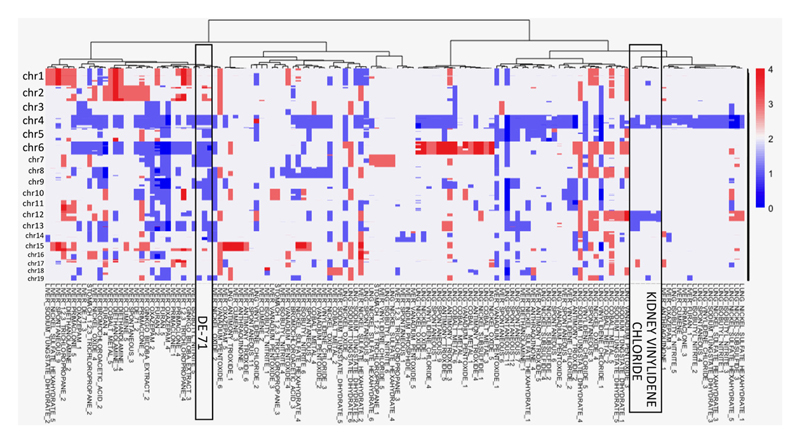
In addition to evaluating mutations in driver genes, we also examined the distribution of copy number variants (CNVs) across liver, lung and kidney tumours sequenced as part of our study (Fig. 4D). Strikingly, all kidney VDC-exposed samples had a near identical CNV landscape and were grouped together after hierarchical clustering (Extended Data Fig. 6). In addition, DE-71-exposed liver tumour samples clustered together, as they were characterized by the loss of chromosomes 4, 6, 7 and 9. An analysis of structural variants identified four tumours with notable features (Extended Data Fig. 7A). Two lung samples, one exposed to VDC and one exposed to vanadium pentoxide, showed chromothripsis. In addition, two liver samples (a spontaneous tumour and an oxazepam exposed tumour) had many inversions distributed all over the genome. Excluding these four samples from the analysis, we saw no difference in the number or type of SVs in the other samples and no difference between tumours from chemically treated mice and spontaneous tumours (Extended Data Fig. 7B).
Mouse and human tumour signature comparisons
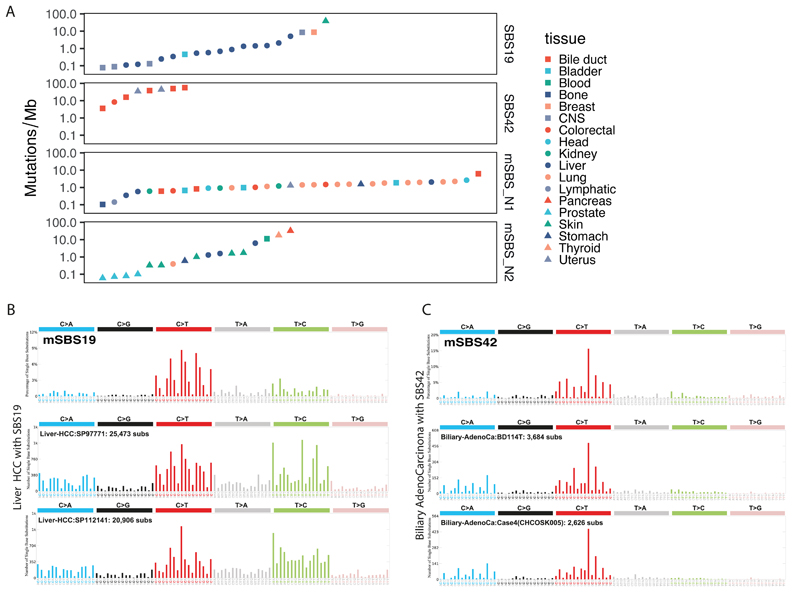
In order to understand the relevance of the identified mouse signatures to human health, we decided to focus our attention on the study of exposure-associated signatures and in particular of mSBS19 and mSBS42, which correspond to SBS19 and SBS42 in human cancers, and the signatures mSBS_N1 and mSBS_N2. To do this we used a collection of human cancer genomes comprising 4,645 WGS and 19,184 WES cases and the R package SignatureEstimation24, performing 10,000 bootstraps of the mutational catalogue of each tumour to identify 76 tumours whose mutation catalogue had >5% contribution from one of these signatures (Fig. 5A, Supplementary Table 11-12). Using a Fisher’s exact test, we next identified a significant (q-value<0.01) association between SBS19 and liver tumours and pilocytic astrocytomas (low-grade gliomas), SBS42 with cholangiocarcinoma, while mSBS_N1 was associated with lung squamous cell carcinoma and bladder transitional cell carcinoma (Supplementary Table 11-12).SBS42 is a rare signature previously described in cholangiocarcinomas from print workers who were exposed to haloalkanes9 (Fig. 5). Our mouse data provide experimental evidence further linking exposure to haloalkanes and the generation of this signature. However, mSBS42 was tissue specific, found only in forestomach but not in liver tumours from TCP treated mice (Fig. 1A, 1E). In TCP tumours we also saw mSBS19. Few human tumours have SBS19 and the highest proportion of these are liver hepatocellular carcinomas (HCC) (Fig. 5) where it is found in 2% of cases, with less support for this signature in other tumour types. Thus, in addition to similarities between mouse and human endogenous signatures, our analysis links chemical exposures in mice to signatures observed in human tumours, suggesting these chemicals or related agents may shape the mutational landscape of human cancers.
Fig. 5. Identification of human tumours with signatures related to mSBS19, mSBS42, mSBS_N1 and mSBS_N2.
A, Mutational burden and tissue types of the human cancers where we detected the signatures under evaluation with a minimum contribution level of 5%. B, Shown is mSBS19 and two spectra of human hepatocellular carcinomas where SBS19 was identified. C, Shown is mSBS42 and two spectra of human liver cholangiocarcinomas where SBS42 was detected (full dataset in Supplementary Table 11).
Discussion
While many agents have been associated with cancer risk in humans, establishing causal relationships is challenging. Here we link TCP treatment with signatures mSBS19 and mSBS42, and thus provide experimental evidence that haloalkanes may be responsible for these signatures observed in human tumours. This observation is of direct relevance to human health since these chemicals are both environmental pollutants and also occupational exposures.
Notably, only 3 out of 20 chemicals in our study had specific carcinogen-induced genomic signatures (i.e. TCP, VDC and cobalt), while vanadium pentoxide modestly increased the mutation load, suggesting that most play other roles in tumorigenesis. Possible modes of action of these agents could include alteration of the immune microenvironment/inflammation or the tumour cell niche, and the chemicals described here represent molecular probes to explore this biology. In keeping with our observation that many agents are not directly mutagenic, we show that key driver mutations are likely to be acquired through endogenous mutagenic processes rather than by the direct action of chemical exposures on the genome.
As part of our analysis we were able to identify mutational signatures that were endogenous and tissue enriched such as mSBS40 in liver and mSBS1 and mSBS17 in lung. The effect of mutagenic agents on the genome was also found to be influenced by tissue. For example, administration of cobalt caused a dinucleotide signature in the lung that was absent from liver samples suggesting tissue specific differences in how mutagens act on the genome and how the damage they induce is repaired. In the same way furan, the only chemical in common with a recent iPS cell mutagenesis study25, where it was found to generate a signature, did not appear to do so in our study. Notably, in general, we observed more dinucleotide substitutions in liver than in lung, while more indels in lung than in liver. Strikingly, there were vast differences in the mutational load of tumours induced with VDC when comparing lung, liver and kidney tumours and also in signature proportions between tissues. Importantly, while some chemicals such as TCP increased the mutational load, an increase in mutation number was not requisite for inducing a shift in the mutational signature profile. For example, VDC in liver was found to associate with mSBS_N1 but was indistinguishable from other chemicals or from spontaneous tumours when comparing the mutational load. It was also notable that a negative result in the classical Ames test did not ensure that an agent was non-mutagenic in vivo, as was clear from our analysis of VDC, a result in keeping with the important role that metabolism plays in the action and activation of carcinogens. Intriguingly, isobutyl nitrate, Ginkgo biloba extract and primaclone were all Ames test positive but did not exhibit a specific mutational signature in our study. Thus, our study validates the important and complementary role of in vivo models of cancer in assessing oncogenicity and mutational signatures.
Online Methods
Samples and DNA extraction
Hybrid C57BL_6N _ C3H_HeN F1 (B6C3F1_N) mice were exposed to test chemicals over a two-year period at the NTP4 and were sacrificed when they became moribund or at two years. Spontaneous tumours from controls were collected at the two-year timepoint. Further details, including the doses of chemicals used and administration routes, are provided in Supplementary Table 1 & 2. Details of each tumour sample (including a histopathological diagnosis) are provided in Supplementary Table 2. All tumours were reviewed by a board-certified pathologist to ensure at least 90% tumour cellularity and lack of haemorrhage, necrosis or autolysis. DNA was extracted using Qiagen Gentra Puregene tissue kits using standard procedures. Further details are provided in the Life Science Reporting Summary.
Sequencing
We performed whole genome sequencing of 188 tumour samples and 29 normal age-matched samples on the Illumina HiSeq X Ten platform generating 151 base pair paired-end reads. Sequence reads were aligned to the mouse reference genome (GRCm38) using BWA-MEM26. Sequence coverage was 26.5-47.9x (median 39.5) after duplicate removal.
Variant calling
The variant calling algorithms of the Cancer Genome Project, Wellcome Sanger Institute, were used with default setting: cgpCaVEMan27 for base substitutions; cgpPindel28 for indels; and BRASS (https://github.com/cancerit/BRASS) for structural variants. We performed additional post-processing steps to eliminate false positive calls due to technology specific artefacts and germline variants. First, we created an unmatched normal panel of genomes which included 15 C57BL_6J, 2 C57BL_6N, 16 B6C3F1 and 2 C3H/HeN F1 genomes (available at ftp:ftp://ftp-mouse.sanger.ac.uk/other/da1/). Second, we removed base-substitutions with a median alignment score of mutation-reporting reads (ASMD) < 140 and we removed complex indels. Lastly, to perform our signature analysis, we filtered out variants present in multiple tumours, in order to decrease the likelihood of contaminating SNPs. This filter was not used for the driver gene analysis. Since matched normal control genomes for 9 tumours were available, we compared our somatic calls for these tumour-germline pairs to the calls made using the unmatched normal panel. For base substitutions, we obtained an average precision of 0.87 and an average recall of 0.94 (Supplementary Table 3). The cosine similarity for the mutational signature obtained when comparing the profile of somatic SNVs identified using the matched normal vs the unmatched control panel was 0.99. The precision and recall for indels was lower when comparing the profile of somatic indels identified using the matched normal vs an unmatched normal followed by filtering. However, the mutational spectra obtained was almost identical (the cosine similarity is 0.97) and the number of mutations was very similar.
Extraction of mutational signatures
We used SigProfilerMatrixGenerator29 to categorize mutations into classes and to plot mutational spectra. De novo substitution signatures were extracted using the HDP package (https://github.com/nicolaroberts/hdp) which implements hierarchical Bayesian Dirichlet process and SigprofilerExtractor1 (https://github.com/AlexandrovLab/SigProfilerExtractor), which is based on a non-negative matrix factorization method. Before comparing the extracted mouse mutational signatures to COSMIC SBS signatures, we performed a normalization, multiplying signatures by the human mutational opportunity (hg19) and dividing them by the mouse mutational opportunity (mm10). We developed a method to decompose mutational signatures extracted from mouse data into the minimum number of known COSMIC (SBS) signatures. The same algorithm was used to analyse indels and doublet/dinucleotide base substitution signatures. We extracted de novo substitution signatures using SigprofilerExtractor1 (https://pypi.org/project/sigproextractor/). Comparison of the results obtained with the two methods for SBSs are reported in Extended Data Fig. 8 and Extended Data Fig. 9. We also used SigprofilerExtractor for de novo signature analysis in the pentanucleotide context (Extended Data Fig. 1C). In our HDP analysis, the component zero, which contains the proportion of the dataset with uncertain clustering behaviour, has cosine similarity >0.9 with SBS5. This component probably represents a background signature, as recently observed30. For indels, we used HDP with the COSMIC ID signatures as priors. We identified 4 known indel signatures (ID1, 3, 8, 9) and another signature whose cosine similarity was ≥0.85 with ID2, thus we called it mID2 (Extended Data Fig. 5).
Topography of mutational signatures
We used the SigProfilerMatrixGenerator29 transcription strand bias BED files for mm10, which contain transcriptional strand information for each genomic region. To understand the accumulation of mutations in relation to mouse replication timing signals, we downloaded Repli-chip data of mouse endodermal cell line data from ENCODE31 (ENCSR000AXY) selecting the endodermal dataset because lung and liver are derived from endoderm. We used LiftOver (https://genome.ucsc.edu/cgi-bin/hgLiftOver) to map Repli-chip regions from mm9 to mm10. The Repli-chip data32 were then split into deciles. We then used bedtools33 to annotate the substitutions present in different replication timing regions and in transcribed or untranscribed regions. We used the maximum likelihood algorithm to associate specific mutations with signatures32 with a probability threshold of 0.5. We used two different methodologies: first we tested transcription strand bias and differences in replicating timing per signature, independently of sample, and second we tested the transcription strand bias and differences in replicating timing in each sample, splitting the mutations by signature. We used a two-sided binomial test to calculate the statistical significance of enrichment or depletion. Since for some of the tests we had a low number of mutations, we decided to consider only those conditions where we had at least 50 mutations for analysis. We corrected for false discovery rate (FDR) using Benjamini-Hochberg correction. We removed regions with length ≤10Kb to map only large transitions. We tested replication strand asymmetry with a two-sided Poisson test to calculate the statistical significance of the enrichment of mutations in leading or lagging strand regions with the MutationalPatterns package34 and corrected these values for the FDR. To explore the clustering of mutations, we generated “rainfall plots” for every tumour in our collection, dividing C>N and T>N mutations from A>N and G>N mutations.
Analysis of mutation colocalization with histone marks and open chromatin
We used ENCODE data to look for possible associations with histone marks or open chromatin. For the open chromatin DNase-seq analysis, only one suitable dataset was found for lung (ENCSR000CNM); containing 3 isogenic replicates. No suitable DNase-seq datasets were available for liver. For the histone marks, data for H3K27ac, H3K27me3, H3K36me3, H3K79me2, and H3K9ac was available (ENCSR000CDH, ENCSR000CEN, ENCSR000CEO, ENCSR000CEP, and ENCSR000CEQ) for liver tissue; while only H3K4me3 and H3K4me1 were available for lung (ENCSR000CAR and ENCSR000CAQ). All data used were mapped to the UCSC mm10 reference genome. All data were processed using the MutationalPatterns package34. We used the complete genome as the surveyed region list. The genomic_distribution test within the MutationalPatterns package was used to determine enrichment or depletion. After plotting, the differences in Observed/Expected ratios for each mark/tissue pair was assessed using an un-paired Mann-Whitney test. False-discovery rate p-value correction was applied to all p-values.
Driver gene analysis
We intersected CaVEMan and Pindel filtered calls against the orthologues of a previously published list of 299 driver genes in human cancers23. To this list, we added cancer genes present in Tier1 of the cancer gene census list classified as somatic and having nonsense, missense, splice site or frameshift mutations35. In total we considered 397 mouse genes. We selected substitutions or indel changes that altered coding sequence: missense, nonsense, splice site mutations, start lost or stop lost substitutions; complex substitutions, frameshifts, inframe events and indels that disrupted start sites. We used a Fisher’s exact test to test the association between driver genes and chemical exposure (Supplementary Table 8). We performed a Mann-Whitney U-test to define the association between specific missense mutations in driver genes and mouse single base substitution (SBS) signatures. We corrected p-values for false discovery rate (FDR) using the Benjamini-Hochberg method (Supplementary Table 9). In an attempt to explore the link between drivers and signatures, we used the maximum likelihood approach32 to associate specific mutations in driver genes with signatures (Supplementary Table 10). We expanded this analysis by considering all the driver genes identified in the entire cohort, using a probability threshold of 0.5 to the maximum likelihood (Supplementary Table 10).
Identification of somatic DNA copy number alterations
Copy number calls were derived from whole genome sequence data using Theta236 and were reported for the autosomes. We used matched normal controls for 9 samples and selected unmatched normal controls for the rest of the samples. We first made sure that using unmatched control genomes vs matched control genomes yielded the same copy number profiles. All copy number variants were visually inspected by viewing the LogR ratio and the B allele frequency to confirm the presence of the alteration.
Identification of mouse signatures in the human mutational catalogue
We searched a collection of 4,645 whole genome sequences and 19,184 exomes1 for the presence of the signatures mSBS42, mSBS19, mSBS_N1 and mSBS_N2. The tumours in this collection were derived from a pan-cancer analysis that included renal cell carcinoma, hepatocellular carcinoma and alveolar_bronchiolar adenocarcinoma. We detected mutations linked to SBS19, SBS42, and the normalized mSBS_N1 and mSBS_N2 signatures in human cancers with confidence using the R package SignatureEstimation24, performing 10000 bootstraps of the mutational catalogue of each tumour. Analysis was performed on the WGS and WES data where sequencing had identified at least 200 mutations1. Next, we identified the tumour samples having a minimal contribution level of 5% of at least one of the 4 signatures under study (with p-value<2.2×10⁻¹⁶, see Supplementary Table 11) resulting in a list of 76 tumours of different tumour types. Using a FDR-corrected Fisher’s exact test, we identified the significant association (q-value<0.01) between each tumour type and specific substitution signatures.
Statistics and Reproducibility
All comparisons were between biologically independent samples. No data was excluded except for 7 samples from signature calling because these samples appeared to have only 200 somatic SNVs. Further details are provided in the Reporting Summary.
Extended Data
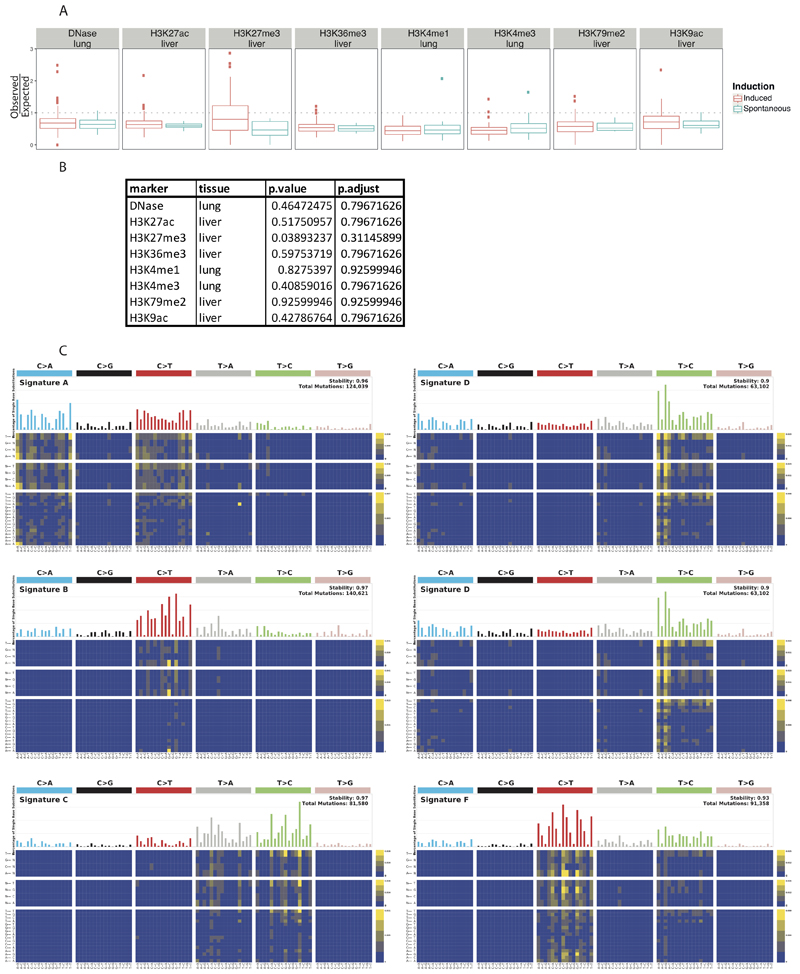
Extended Data Figure 1. The comparative landscape of spontaneous and chemically induced tumours with genomic features.
A, Comparison of the colocalization of substitutions with histone marks and open chromatin in spontaneous and chemically induced tumours. Each point is a single replicate (for the induced these points are aggregated across multiple chemicals). For each point, we plot the observed/expected data from the MutationalPatterns software. The box plots show the Tukey statistics: The box shows the 1st — 3rd quartiles, with a line at the median. The whiskers extend from the 1st and 3rd quartiles to the largest value no more than 1.5*IQR from the relevant quartile (See Source Data for sample numbers in each comparison). B, Table reporting the adjusted p values for the comparisons in A. A two-sided Mann-Whitney U-test was used to calculate the false-discovery rate corrected p values. C, Signatures identified using sigProfiler in the pentanucleotide context.
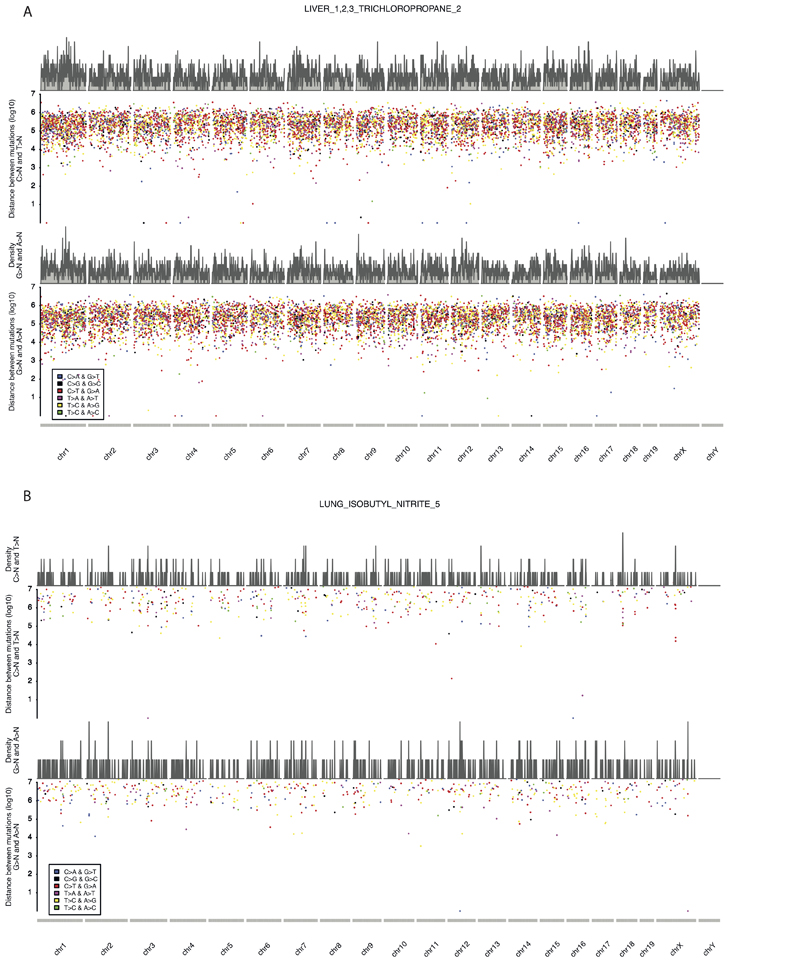
Extended Data Figure 2. Strand coordinated clustering along the genome.
A, a liver tumour from a mouse exposed to TCP and B, a lung tumour from a mouse exposed to Isobutyl Nitrate.
Extended Data Figure 3. Hierarchical clustering of the contribution of mSBS signatures across the collection of lung, liver, kidney and forestomach tumours sequenced in this study.
The profile of mutational signatures across the tumour collection. The signature profiles are shown in Figure 1.
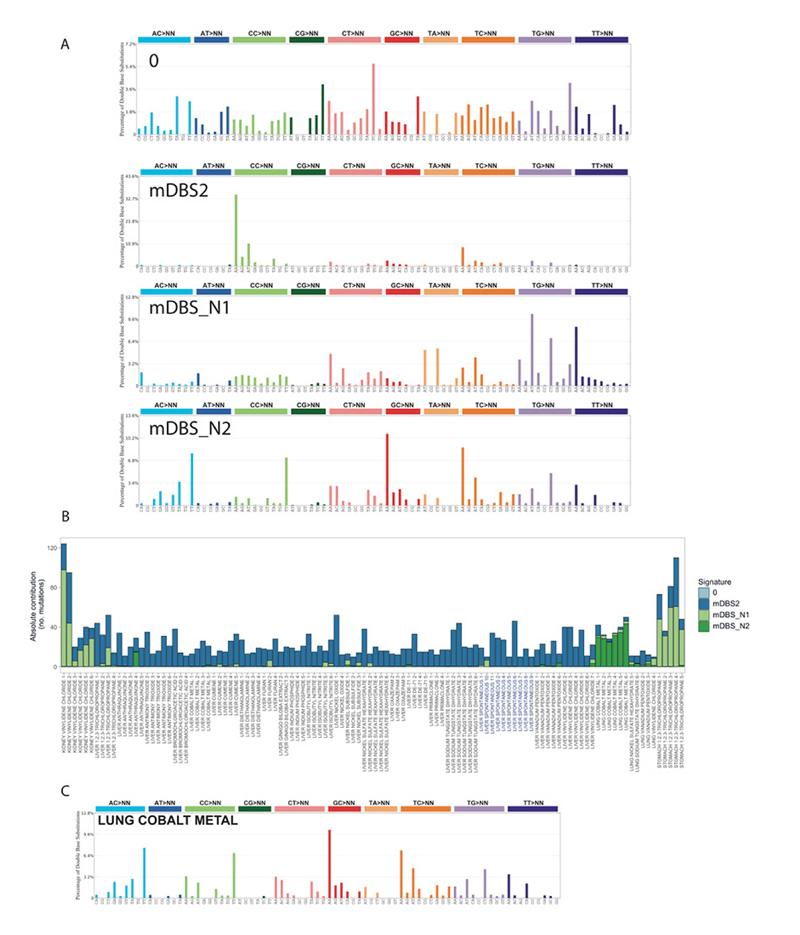
Extended Data Figure 4. Supplementary Fig. 4: The landscape of Mouse Doublet Base Substitution (mDBS) Signatures induced by chemical exposures and endogenous mutagenic processes.
A, The catalogue of mouse doublet base substitution (mDBS) signatures. mDBS_N1 and mDBS_N2 are new DBS signatures. B, Number of mutations for each mDBS signature across the collection of lung, liver, kidney and forestomach tumours. Component 0 accounts for very few mutations and represents background/unassigned mutations. C, The DBS spectrum obtained by normalizing and averaging the DBS spectra of the six lung tumours exposed to cobalt. This profile is almost identical to mDBS_N2.
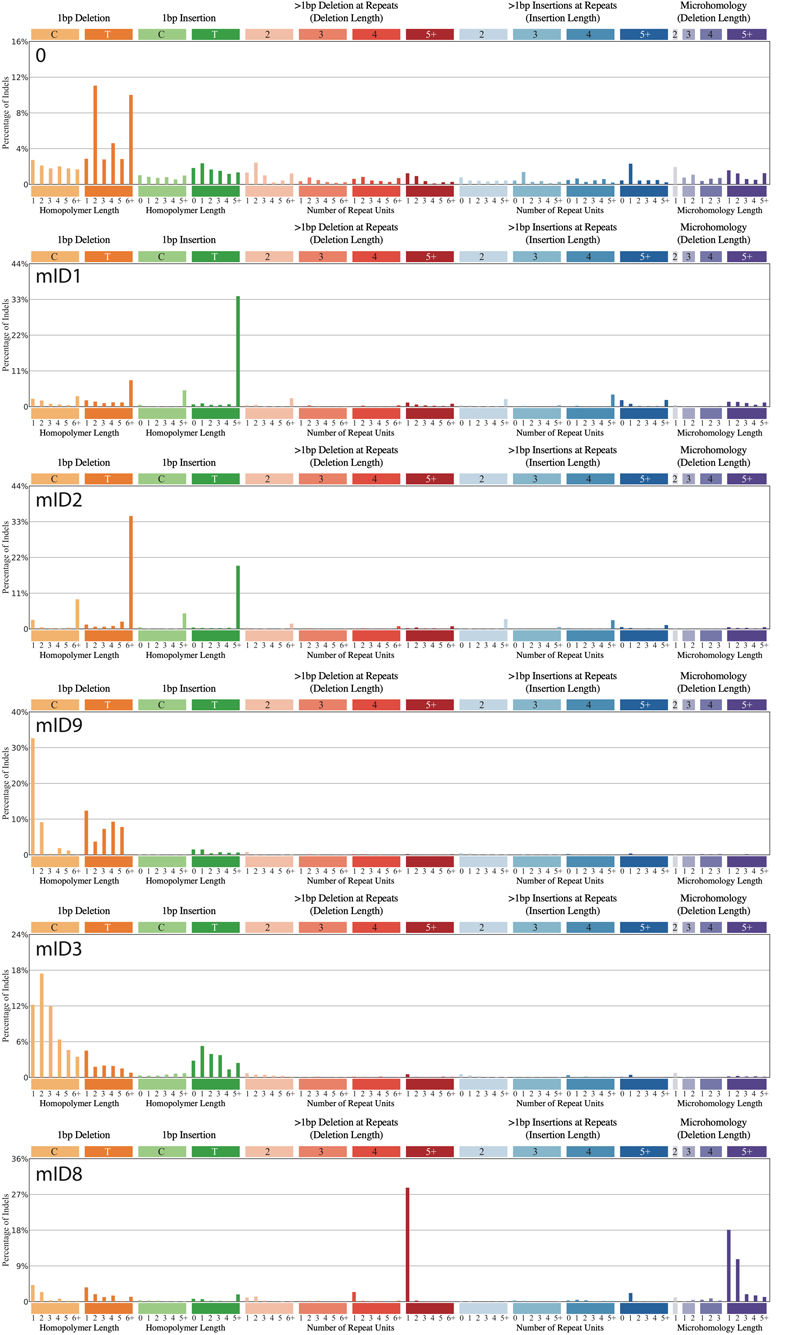
Extended Data Figure 5. The catalogue of mouse indel substitution (mID) signatures.
Shown are the indel signatures that were computed from the whole genome sequence data generated in this study.
Extended Data Figure 6. Hierarchical clustering of copy number variants across the tumour collection.
Copy number events were called as described in the Methods. Notable clustering for tumours from mice exposed to DE-71 and vinylidene chloride are shown. The scale indicates copy number.
Extended Data Figure 7. Structural variants in spontaneous and chemical induced tumours.
Structural variants of two lung tumours showing chromothripsis and two liver tumours with many inversion events. B, Structural variants in the other samples (excluding the samples in A) across the collection of lung, liver, kidney and forestomach tumours.
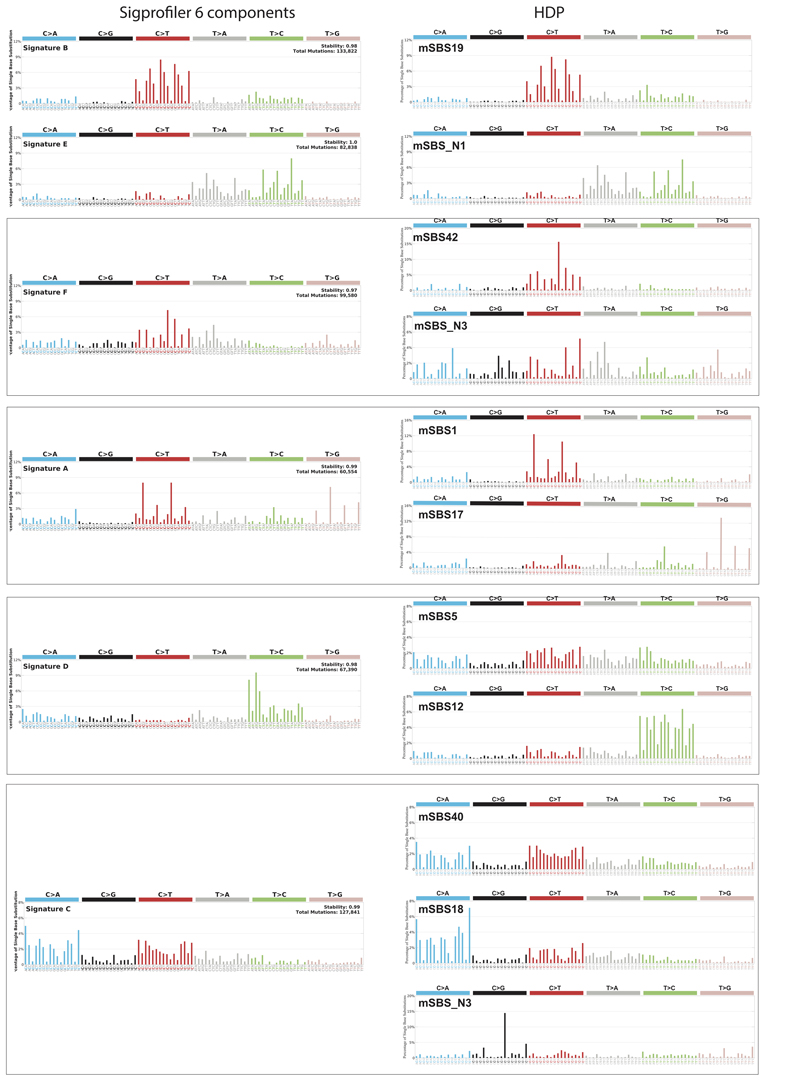
Extended Data Figure 8. Comparison of signatures computed with HDP to those computed with SigProfiler with 6 components (default result).
Shown are the signatures identified using HDP and corresponding signatures identified using the SigProfiler algorithm. For this comparison SigProfiler was run with 6 components.
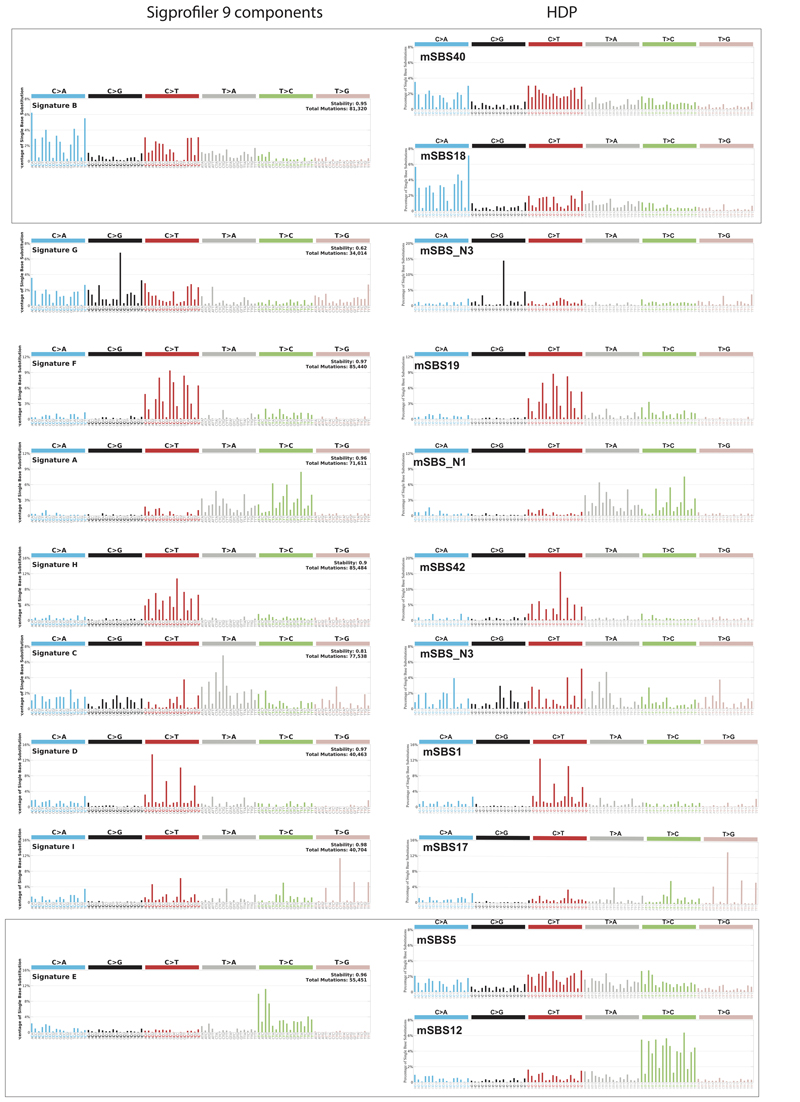
Extended Data Figure 9. Comparison of signatures computed with HDP to those computed with SigProfiler with 9 components.
Shown are the signatures identified using HDP and corresponding signatures identified using the SigProfiler algorithm. For this comparison SigProfiler was used with 9 components.
Supplementary Material
Acknowledgements
This work was funded by grants to DJA from the Wellcome Trust, Cancer Research UK (with AB), the CRUK Mutographs Project Work Package 3 (to AB), and the European Research Council under the European Union’s Seventh Framework Programme (FP7_ 2007–2013) _ERC synergy grant agreement n° 319661 COMBATCANCER. AB acknowledges support from NCI grant R35CA210018. AD is supported by a UKRI Fellowship (MR_S00386X_1). We acknowledge the ENCODE Consortium and the ENCODE production laboratories. We appreciate the support provided by the staff at the National Toxicology Program tissue archives for this study. We also thank Michael Stratton, Arnoud Boot, Steven Rozen, Steve Jackson and David Phillips for helpful discussions.
Footnotes
Competing interest Statement
The authors have no competing interests to declare.
Author contributions
The study was conceived by AB and RCS. RCS, AB and DJA designed and supervised the project. Tumours were collected/generated by ARP, RAH, RCS and the NTP. Computational analyses were performed by LR, YRL, AD, MAQ, PJC, VI, RS, and LBA. Histopathology evaluation and sequencing were performed by ARP and JH, respectively. The manuscript was written by LR and DJA, with contributions from all other authors.
Data availability
The raw sequencing data are available for download from the European Nucleotide Archive under study accession numbers: ERP021985 (Lung tumour sequence data), ERP104478 & ERP106735 (Liver tumour sequence data), ERP110807 (Liver tumour methylation data), ERP106734 (Kidney tumour sequence data), ERP115196 (Stomach tumour sequence data). All other data is available in the Supplementary Tables and in the Source Data File.
Code availability
All the code used in this manuscript has been made available at https://github.com/team113sanger/mouse-mutatation-signatures
References
- 1.Alexandrov LB, et al. The repertoire of mutational signatures in human cancer. Nature. 2020;578:94–101. doi: 10.1038/s41586-020-1943-3. [DOI] [PMC free article] [PubMed] [Google Scholar]
- 2.Alexandrov LB, et al. Signatures of mutational processes in human cancer. Nature. 2013;500:415–21. doi: 10.1038/nature12477. [DOI] [PMC free article] [PubMed] [Google Scholar]
- 3.Kemp CJ. Animal Models of Chemical Carcinogenesis: Driving Breakthroughs in Cancer Research for 100 Years. Cold Spring Harb Protoc. 2015;2015:865–74. doi: 10.1101/pdb.top069906. [DOI] [PMC free article] [PubMed] [Google Scholar]
- 4.Bucher JR. The National Toxicology Program rodent bioassay: designs, interpretations, and scientific contributions. Ann N Y Acad Sci. 2002;982:198–207. doi: 10.1111/j.1749-6632.2002.tb04934.x. [DOI] [PubMed] [Google Scholar]
- 5.Innes JR, et al. Bioassay of pesticides and industrial chemicals for tumorigenicity in mice: a preliminary note. J Natl Cancer Inst. 1969;42:1101–14. [PubMed] [Google Scholar]
- 6.Keane TM, et al. Mouse genomic variation and its effect on phenotypes and gene regulation. Nature. 2011;477:289–94. doi: 10.1038/nature10413. [DOI] [PMC free article] [PubMed] [Google Scholar]
- 7.Maronpot RR. Biological Basis of Differential Susceptibility to Hepatocarcinogenesis among Mouse Strains. J Toxicol Pathol. 2009;22:11–33. doi: 10.1293/tox.22.11. [DOI] [PMC free article] [PubMed] [Google Scholar]
- 8.Ames BN, Durston WE, Yamasaki E, Lee FD. Carcinogens are mutagens: a simple test system combining liver homogenates for activation and bacteria for detection. Proc Natl Acad Sci U S A. 1973;70:2281–5. doi: 10.1073/pnas.70.8.2281. [DOI] [PMC free article] [PubMed] [Google Scholar]
- 9.Mimaki S, et al. Hypermutation and unique mutational signatures of occupational cholangiocarcinoma in printing workers exposed to haloalkanes. Carcinogenesis. 2016;37:817–826. doi: 10.1093/carcin/bgw066. [DOI] [PMC free article] [PubMed] [Google Scholar]
- 10.Alexandrov LB, et al. Clock-like mutational processes in human somatic cells. Nat Genet. 2015;47:1402–7. doi: 10.1038/ng.3441. [DOI] [PMC free article] [PubMed] [Google Scholar]
- 11.Olivier M, et al. Modelling mutational landscapes of human cancers in vitro. Sci Rep. 2014;4 doi: 10.1038/srep04482. 4482. [DOI] [PMC free article] [PubMed] [Google Scholar]
- 12.Nik-Zainal S, et al. The genome as a record of environmental exposure. Mutagenesis. 2015;30:763–70. doi: 10.1093/mutage/gev073. [DOI] [PMC free article] [PubMed] [Google Scholar]
- 13.Renaud HJ, Cui JY, Khan M, Klaassen CD. Tissue distribution and gender-divergent expression of 78 cytochrome P450 mRNAs in mice. Toxicol Sci. 2011;124:261–77. doi: 10.1093/toxsci/kfr240. [DOI] [PMC free article] [PubMed] [Google Scholar]
- 14.Vinylidene chloride. IARC Monogr Eval Carcinog Risks Hum. 1999;71(Pt 3):1163–80. [PMC free article] [PubMed] [Google Scholar]
- 15.Alexandrov LB, et al. Mutational signatures associated with tobacco smoking in human cancer. Science. 2016;354:618–622. doi: 10.1126/science.aag0299. [DOI] [PMC free article] [PubMed] [Google Scholar]
- 16.Woodfine K, et al. Replication timing of the human genome. Human Molecular Genetics. 2003;13:191–202. doi: 10.1093/hmg/ddh016. [DOI] [PubMed] [Google Scholar]
- 17.Haradhvala NJ, et al. Mutational Strand Asymmetries in Cancer Genomes Reveal Mechanisms of DNA Damage and Repair. Cell. 2016;164:538–49. doi: 10.1016/j.cell.2015.12.050. [DOI] [PMC free article] [PubMed] [Google Scholar]
- 18.Stamatoyannopoulos JA, et al. Human mutation rate associated with DNA replication timing. Nat Genet. 2009;41:393–5. doi: 10.1038/ng.363. [DOI] [PMC free article] [PubMed] [Google Scholar]
- 19.Lawrence MS, et al. Mutational heterogeneity in cancer and the search for new cancer-associated genes. Nature. 2013;499:214–218. doi: 10.1038/nature12213. [DOI] [PMC free article] [PubMed] [Google Scholar]
- 20.Kazanov MD, et al. APOBEC-Induced Cancer Mutations Are Uniquely Enriched in Early-Replicating, Gene-Dense, and Active Chromatin Regions. Cell Rep. 2015;13:1103–1109. doi: 10.1016/j.celrep.2015.09.077. [DOI] [PMC free article] [PubMed] [Google Scholar]
- 21.Rebhandl S, Huemer M, Greil R, Geisberger R. AID/APOBEC deaminases and cancer. Oncoscience. 2015;2:320–33. doi: 10.18632/oncoscience.155. [DOI] [PMC free article] [PubMed] [Google Scholar]
- 22.Lison D, van den Brule S, Van Maele-Fabry G. Cobalt and its compounds: update on genotoxic and carcinogenic activities. Crit Rev Toxicol. 2018;48:522–539. doi: 10.1080/10408444.2018.1491023. [DOI] [PubMed] [Google Scholar]
- 23.Bailey MH, et al. Comprehensive Characterization of Cancer Driver Genes and Mutations. Cell. 2018;173:371–385.e18. doi: 10.1016/j.cell.2018.02.060. [DOI] [PMC free article] [PubMed] [Google Scholar]
- 24.Huang X, Wojtowicz D, Przytycka TM. Detecting presence of mutational signatures in cancer with confidence. Bioinformatics. 2018;34:330–337. doi: 10.1093/bioinformatics/btx604. [DOI] [PMC free article] [PubMed] [Google Scholar]
- 25.Kucab JE, et al. A Compendium of Mutational Signatures of Environmental Agents. Cell. 2019;177:821–836.e16. doi: 10.1016/j.cell.2019.03.001. [DOI] [PMC free article] [PubMed] [Google Scholar]
- 26.Li H. Toward better understanding of artifacts in variant calling from high-coverage samples. Bioinformatics. 2014;30:2843–51. doi: 10.1093/bioinformatics/btu356. [DOI] [PMC free article] [PubMed] [Google Scholar]
- 27.Jones D, et al. cgpCaVEManWrapper: Simple Execution of CaVEMan in Order to Detect Somatic Single Nucleotide Variants in NGS Data. Curr Protoc Bioinformatics. 2016;56 doi: 10.1002/cpbi.20. 15.10.1-15.10.18. [DOI] [PMC free article] [PubMed] [Google Scholar]
- 28.Raine KM, et al. cgpPindel: Identifying Somatically Acquired Insertion and Deletion Events from Paired End Sequencing. Curr Protoc Bioinformatics. 2015;52 doi: 10.1002/0471250953.bi1507s52. 15.7.1-12. [DOI] [PMC free article] [PubMed] [Google Scholar]
- 29.Bergstrom EN, et al. SigProfilerMatrixGenerator: a tool for visualizing and exploring patterns of small mutational events. BMC Genomics. 2019;20:685. doi: 10.1186/s12864-019-6041-2. [DOI] [PMC free article] [PubMed] [Google Scholar]
- 30.Ramazzotti D, et al. De novo mutational signature discovery in tumour genomes with SparesSignatures. BioRxiv. doi: 10.1101/384834. [DOI] [PMC free article] [PubMed] [Google Scholar]
- 31.Davis CA, et al. The Encyclopedia of DNA elements (ENCODE): data portal update. Nucleic Acids Res. 2018;46:D794–d801. doi: 10.1093/nar/gkx1081. [DOI] [PMC free article] [PubMed] [Google Scholar]
- 32.Morganella S, et al. The topography of mutational processes in breast cancer genomes. Nat Commun. 2016;7 doi: 10.1038/ncomms11383. 11383. [DOI] [PMC free article] [PubMed] [Google Scholar]
- 33.Quinlan AR, Hall IM. BEDTools: a flexible suite of utilities for comparing genomic features. Bioinformatics. 2010;26:841–2. doi: 10.1093/bioinformatics/btq033. [DOI] [PMC free article] [PubMed] [Google Scholar]
- 34.Blokzijl F, Janssen R, van Boxtel R, Cuppen E. MutationalPatterns: comprehensive genome-wide analysis of mutational processes. Genome Med. 2018;10:33. doi: 10.1186/s13073-018-0539-0. [DOI] [PMC free article] [PubMed] [Google Scholar]
- 35.Tate JG, et al. COSMIC: the Catalogue Of Somatic Mutations In Cancer. Nucleic Acids Res. 2019;47:D941–d947. doi: 10.1093/nar/gky1015. [DOI] [PMC free article] [PubMed] [Google Scholar]
- 36.Oesper L, Satas G, Raphael BJ. Quantifying tumor heterogeneity in whole-genome and whole-exome sequencing data. Bioinformatics. 2014;30:3532–40. doi: 10.1093/bioinformatics/btu651. [DOI] [PMC free article] [PubMed] [Google Scholar]
Associated Data
This section collects any data citations, data availability statements, or supplementary materials included in this article.
Supplementary Materials
Data Availability Statement
The raw sequencing data are available for download from the European Nucleotide Archive under study accession numbers: ERP021985 (Lung tumour sequence data), ERP104478 & ERP106735 (Liver tumour sequence data), ERP110807 (Liver tumour methylation data), ERP106734 (Kidney tumour sequence data), ERP115196 (Stomach tumour sequence data). All other data is available in the Supplementary Tables and in the Source Data File.
All the code used in this manuscript has been made available at https://github.com/team113sanger/mouse-mutatation-signatures


