Abstract
Cancers accumulate mutations that lead to neoantigens, novel peptides that elicit an immune response, and consequently undergo evolutionary selection. Here we establish how negative selection shapes the clonality of neoantigens in a growing cancer, by constructing a mathematical model of neoantigen evolution. The model predicts that, without immune escape, tumor neoantigens are either clonal or at low frequency, and hyper-mutated tumors can only establish following the evolution of immune escape. Moreover, the site frequency spectrum of somatic variants under negative selection appears more neutral as the strength of negative selection increases, consistent with classical neutral theory. These predictions are corroborated by the analysis of neoantigen frequencies and immune escape in exome and RNA sequencing data from 879 colon, stomach and endometrial cancers.
Introduction
Mutations accrue throughout tumor development and provide ‘fuel for the fire’ of cancer evolution. However, mutations can also hinder tumor evolution if they lead to an anti-tumor immune response, via the generation of neoantigens, novel peptides presented on the cell’s surface and recognized as ‘non-self’ by cells of the adaptive immune system1,2. The immune system is a major determinant of tumor evolution, most starkly demonstrated by the prognostic value of immune-infiltration3 and the success of immunotherapy4,5.
The landscape of neoantigenic mutations is shaped by ecological and evolutionary interactions between a tumor and its microenvironment1,6,7. In the absence of an immune system, neoantigens accumulate as a ‘side-effect’ of mutation acquisition8, and are expected to follow neutral evolutionary dynamics9. Immuno-editing refers to immune-cell killing of antigenic cells1 and so represents a negative selective pressure6. Tumor cells can also experience positive selection upon the evolution of mechanisms to inhibit the immune system’s ability to recognize or react to neoantigens. These are termed immune escape mechanisms7,8,10. Cancer evolution in response to immune control is a ‘hallmark of cancer’11 and it is well-recognized that the tumor-specific immune microenvironment shapes the neoantigenic repertoire found in tumors12–14.
Therapies that (re)activate the immune response following escape have achieved exceptional success (reviewed in ref15), especially in cancers of high mutational load16–18. Neoantigen-profiling is predictive of treatment response19 and long-term survival20. However, a significant number of patients do not respond to immunotherapy regardless of a high mutational load and the presence of molecular markers of immune escape21, and there is a need to better predict the likelihood of treatment response.
The evolutionary dynamics of tumor development can be partially decoded from the pattern of intra-tumor genetic heterogeneity22. Positive and negative selection, respectively, cause the expansion and contraction of subclones. Consequently, the site frequency spectrum of mutations, as measured by variant allele frequencies (VAF)9,23 from genome sequencing data, and cohort-wide mutation frequencies (e.g. dN/dS analysis) can be used to infer the evolutionary dynamics that shaped the mutational landscape24–28. Population genetics has long been concerned with the dynamics of negative selection in constant population sizes29–33, which has been extended for expanding populations with rare mutations 34,35. However, cancer evolution represents a distinct evolutionary regime because neoantigens are common, making negative selection pervasive, immune escape can diminish selection; and tumors are growing populations. Therefore, the dynamics resulting from negative selection acting on neoantigens in a growing tumor remain to be determined.
Here we use stochastic modelling to study how the clonal structure and immunological phenotype of growing tumors is shaped by negative selection in response to neoantigenic mutations. We establish the dynamics expected under different selective environments and tumor mutator phenotypes. We characterize the emerging VAF distribution under pervasive negative selection, and determine power to identify negative selection from genomics data. We compare our modelling predictions with whole-exome sequencing and RNA sequencing data from human cancers of the colon, stomach and endometrium.
Results
Modelling predicts antigen-hot and antigen-cold tumors
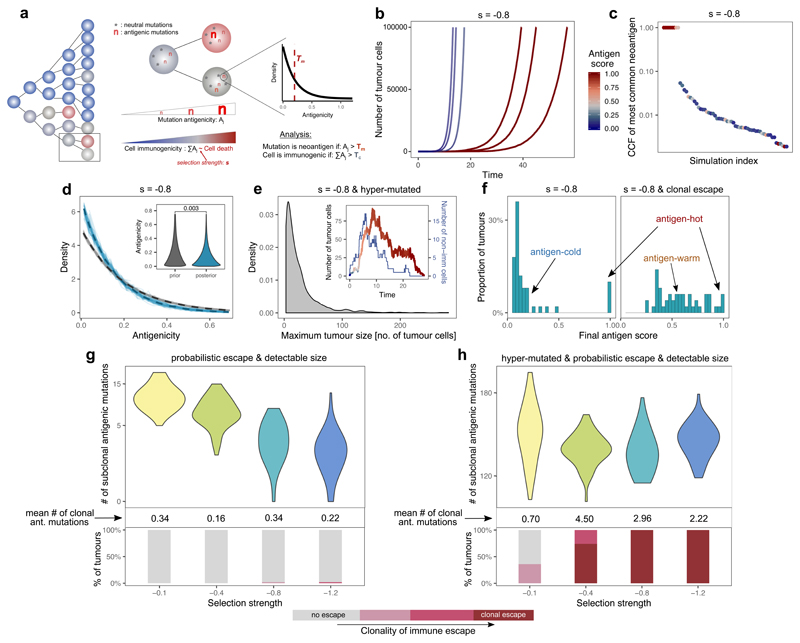
We created a mathematical model of neoantigen evolution during tumor growth, based on a stochastic branching process (Fig. 1a and Methods). At each step, tumor cells of lineage i produced two surviving offspring at birth rate b=1 per unit time and offspring accumulated mutations at rate μ, which had antigenicity drawn from a pre-specified distribution. Cells died with death rate determined by the strength of negative selection, s, against the cumulative antigenicity of neoantigens in the lineage. s can be interpreted as the effectiveness of immune predation against an antigen: s=0 indicates no selection pressure (neutral evolution), and s<<0 strong negative selection (following ref34). Tumor growth was simulated until the tumor reached a predefined population size (analogous to a clinically detectable size) or until a sufficiently long time elapsed without the tumor reaching detectable size.
Figure 1. Tumor growth model predicts two distinct types of immune phenotypes and the necessity of immune escape.
(a) Schematic representation of the model. Left panel: tumor growth for four generations. Filled circles represent cells, colored by immunogenicity. Related cells are connected with lines. Middle panel: cell division/mutation process. Right panel: prior distribution of newly generated neoantigenicities. For details, see Methods. (b) Growth curve of six simulated tumors at s=-0.8. Line color shows the antigen score of the tumor population over time. (c) Cancer cell fraction (CCF) of the most common antigenic mutation of n=100 tumors at the final time-point. (d) Distribution of antigenicity values of all neoantigens generated (grey) and only neoantigens present in >10 surviving cells (blue). Thin lines: individual simulations; thick dashed line: ensemble mean. Inset: Mann-Whitney two-sided test. (e) Distribution of maximum tumor size reached by hyper-mutated tumors at s=-0.8. Inset: growth curve of a single tumor colored by antigenic score as in (b), blue line: number of non-immunogenic cells. (f) Neoantigen scores in n=100 tumors at s=-0.8, without (left) and with (right) clonal immune escape. (g-h) Number of detectable neoantigens (read depth ~50x) in n=50 simulated tumors as a function of negative selection strength. Middle panel: mean clonal neoantigen burden. Bottom panel: clonality of immune escape. Only non-hyper-mutated (g) and hyper-mutated (h) tumors that reached a detectable size are shown. Violin widths represent raw data density.
We first examined the temporal neoantigen burden in simulated tumors. We defined the ‘antigen score’ of a tumor as the proportion of tumor cells carrying cumulative antigenicity ≥Tc. Tumors simulated with identical parameters separated into two distinct groups due to the stochasticity of neoantigen accrual: ‘antigen-hot’ and ‘antigen-cold’. Antigen-hot tumors had an antigen score close to 1, corresponding to every tumor cell in the population being highly antigenic, whereas in antigen-cold tumors the majority of cells lacked immunogenic mutations (Fig. 1b–c). The proportion of antigen-hot tumors depended on the negative selection strength (Extended Data Fig. 1a): increased negative selection for neoantigens decreased the probability of observing antigen-hot tumors. In antigen-cold tumors, the proportion of neoantigen-carrying cells also decreased inversely with the strength of negative selection.
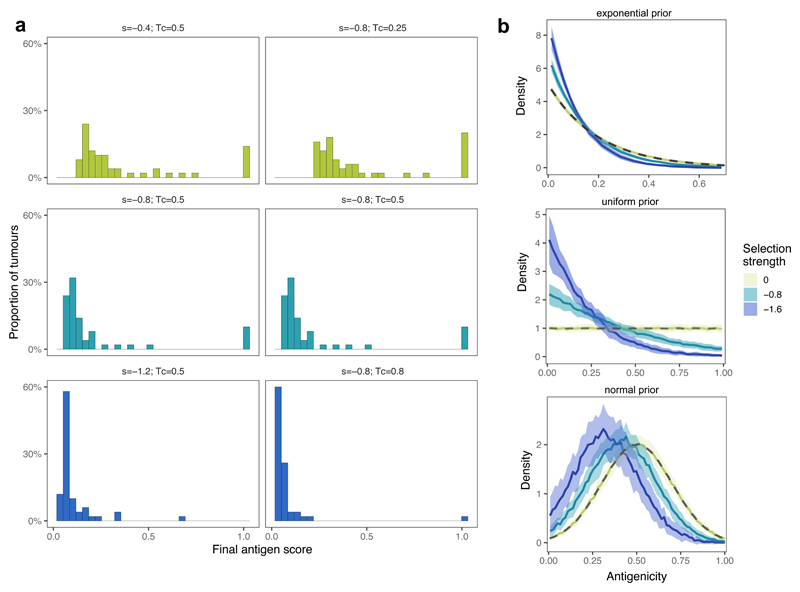
In the simulations, the antigenicity of newly accrued neoantigens was sampled from a ‘prior’ pre-specified distribution. Regardless of the shape of the prior distribution, surviving lineages always showed enrichment for low-antigenicity alterations with an exponential-like distribution of final antigenicity values (Fig. 1d and Extended Data Fig. 1b).
We next simulated hyper-mutated tumors that generated a high number of mutations per cell division, causing lineages to rapidly accrue antigenicity. Consequently, most lineages rapidly became neoantigen-hot and were eradicated by negative selection (Fig. 1e). In rare tumors that survived to detectable size, high-frequency neoantigens were absent (Extended Data Fig. 2a-b and Supplementary Note).
Overall, we observed that negative selection prevented subclonal neoantigens rising to high frequency in a tumor, and this effect was exacerbated at higher mutation rates.
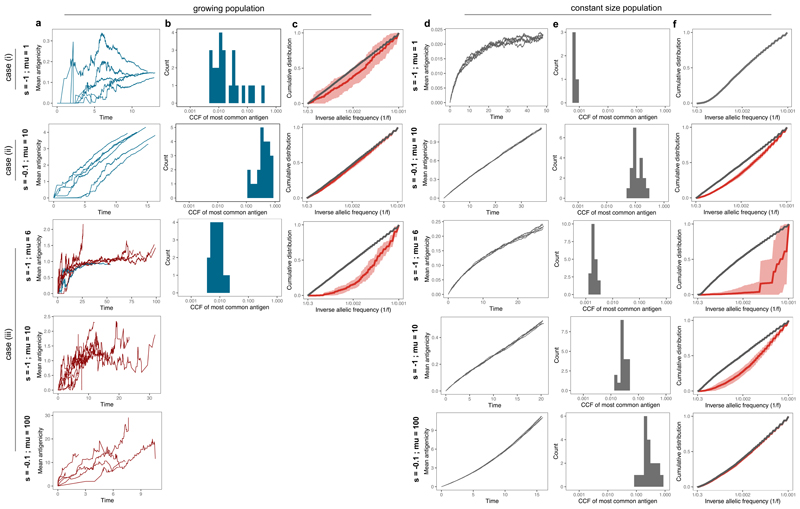
We compared the dynamics observed in our model to the dynamics of neoantigen accrual in a constant size population (Supplementary Note). Models of negative selection with constant population size29–32 can lead to a broad range of evolutionary dynamics as the mutation rate and strength of negative selection are varied. In contrast, here we observed that allowing the population size to vary led to broadly consistent dynamics across the parameters space (Extended Data Fig. 2). We considered three scenarios: (i) High s, low μ. When negative selection was strong and mutations rare, selection operated efficiently in a constant population rendering it devoid of neoantigenic mutations, but was attenuated in a variable-sized population due to population expansion decreasing the efficiency of selection, as previously reported for positive selection23. (ii) Low s, high μ. Due to weak selection, only lineages with multiple mutations experienced non-negligible selection. As in the previous case, population growth attenuated the influence of selection relative to the constant-sized population model. (iii) High s, high μ. In constant size populations, the population could not go extinct, and dynamics were determined by the relative strength of negative selection between lineages all accruing neoantigenic mutations. The additive effect of any single mutation on fitness was proportionally diminished as mutation burden increased due to a Muller’s Ratchet-like effect33, leading to weakly selected dynamics. In a variable-sized population the dynamics were markedly different: populations where all lineages were strongly negatively selected went extinct, and surviving populations consisted of the ‘lucky’ lineages that had not accrued neoantigens (Extended Data Fig. 2a,d). These extinction-driven dynamics persisted in the growing population even in the special case of extremely high μ and low s, while the constant population became effectively neutral.
Modelling shows immune escape leads to antigen-warm tumors
We next simulated immune escape alterations acquired by one cell that renders descendants less susceptible to immune predation36,37. Specifically, we set the death rate of immune escaped cells to the baseline non-immunogenic death rate irrespective of the cell’s burden of antigenic mutations.
If the founder cell of the tumor contained an escape mutation (clonal escape), tumors with a continuum of antigenicity scores emerged (Fig. 1f). We termed these tumors ‘antigen-warm’ as they contained strong high-frequency and/or several subclonal neoantigens.
We then simulated tumors that could acquire immune escape at a random time (probabilistic escape) and evaluated the detectable neoantigen load in the emerging tumors (Methods). When the mutation rate was low, tumors that reached detectable size had rarely evolved immune escape, and the strength of negative selection imposed on growth was inversely correlated with the subclonal neoantigen burden observed in the final tumor (Fig. 1g). When the mutation rate was high, lineages rapidly accrued neoantigens and were driven to extinction by negative selection (Fig. 1e). Tumors only grew to detectable frequency if the founder lineage stochastically acquired immune escape to ‘rescue’ them. Consequently, at high mutation rates, detectable tumors were exclusively immune escaped and had a high burden of high-frequency neoantigens (Fig. 1h).
Taken together, these results suggest that there is a non-linear relationship between the levels of immune surveillance in the microenvironment and the magnitude of immuno-editing seen in tumors of detectable size. Moving from low to moderate negative selection, the dynamics increasingly depart from strictly neutral dynamics as expected, and correspondingly the clonal and subclonal neoantigen burden is progressively decreased. At strong negative selection, detectable tumors are those that have stochastically accrued immune escape, and consequently show a high proportion of neoantigen-warm and –hot cases and evolve effectively-neutrally. We also note that the mutation rate is a determinant of the strength of negative selection experienced by a lineage: at high mutation rates a lineage is likely to accrue multiple negatively selected variants and so experience stronger negative selection.
Immune-infiltrated cancers are antigen-hot and escaped
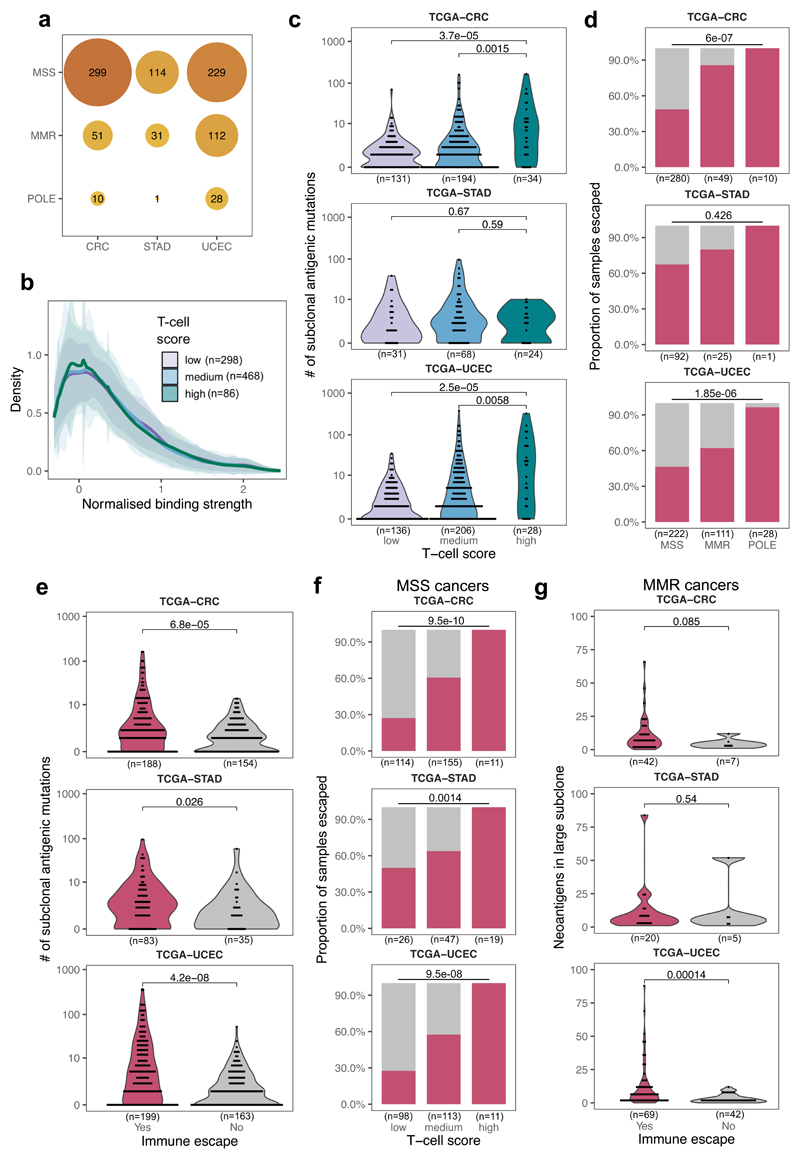
To compare model predictions to experimentally measured neoantigen landscapes, we analyzed neoantigens in 363 colorectal, 146 stomach and 370 endometrial cancers (CRC, STAD and UCEC, respectively) from The Cancer Genome Atlas (TCGA) (Fig. 2a). We focused on these cancer types because of the prevalence of mutator phenotypes, namely cancers with: polymerase-ε mutation (POLE – very high mutation rate), mismatch repair deficiency (MMR – high mutation rate, often responding well to immunotherapy18,38), and microsatellite stable tumors (MSS – lower mutation rate). Therefore, they provide a good model to explore the effect of different tumor-immune dynamics. TCGA samples filtered for high sequencing depth and purity were first HLA-typed in silico 39, and their neoantigens called and filtered19 using the NeoPredPipe pipeline40 (see Methods). We also evaluated T-cell infiltration from paired RNA-seq data41 as a measure analogous to negative selection strength s experienced by neoantigens.
Figure 2. Colorectal, stomach and endometrial tumors from TCGA are antigen-hot and enriched for immune escape.
(a) Cancer type and mutator subtype of the TCGA cancers analyzed. The size and shade of each circle represent the number of tumors (also shown) in that sub-category. (b) Distribution of normalized binding strength of neoantigens in TCGA cancers with low, medium and high immune infiltration. The thick line shows the mean density of all distributions from tumors in each category, the shaded regions represent ±1 standard deviation around this mean. (c) Distribution of the number of subclonally detected (in <60% of the tumor) neoantigen-associated mutations in cancers according to immune infiltration (T-cell average) score. Two-sided Mann-Whitney tests are reported on each plot. (d) Prevalence of immune escape in MSS, MMR and POLE samples. Two-sided chi-squared test is indicated on top of each panel. (e) Distribution of the number of subclonal antigenic mutations in cancers with and without immune escape (magenta and grey, respectively) Two-sided Mann-Whitney test is reported on each panel. (f) Prevalence of immune escape in MSS cancers according to their immune infiltration level. Two-sided chi-squared test is indicated on top of each panel. (g) Number of antigenic mutations present in large subclones (>30% and <60% of cells) in MMR samples with and without immune escape. One-sided Mann-Whitney test is reported above each plot. Violin widths in (c), (e) & (g) represent raw data density with binned individual data points overlaid on top.
The vast majority of tumors (90%) had clonal neoantigens (Supplementary Table 1), and so were defined as ‘antigen-hot’. We observed that the mutation-antigenicity distribution of tumors (see Methods) was enriched for low binding neoantigens irrespective of the level of T-cell infiltrate, but still contained a tail of high-scoring neoantigens (Fig. 2b). Subclonal neoantigen burden varied significantly between cancers: cancers with low or medium T-cell infiltration (putative small or moderate s) had proportionally fewer subclonal neoantigens than high T-cell infiltrate tumors (high s) (Fig. 2c), suggesting a critical role of immune escape in early evolution. Interestingly, this trend was absent in STAD tumors, suggesting a more homogeneous evolution due to either widespread or rare immune escape.
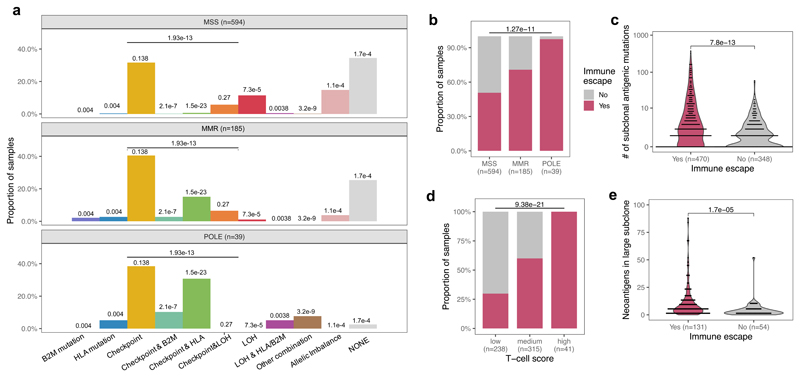
We therefore sought evidence of immune escape in the cancers: namely alterations in antigen presentation and over-expression of immune checkpoint genes (Methods). Overall, 57% of all cancers showed evidence of at least one escape mechanism, with increased prevalence of escape in MMR (71%) and POLE (98%) cases and significantly different patterns of immune escape (Fig. 2d and Extended Data Fig. 3a), in agreement with previous studies18,41,42. STAD cancers in particular had a high proportion of immune escaped cancers – potentially a result of strong early immune predation. Further work is needed to confirm that these differences between mutational subtypes arose from differential selective pressures for immune escape.
Consistent with the predictions and previous studies43, tumors with immune escape had a higher neoantigen burden, and the majority of highly antigenic tumors (neoantigen burden >100) were immune-escaped (Fig. 2e). Increased immune infiltration level was strongly associated with immune escape, even in non-hyper-mutated (MSS) samples (Fig. 2f). We expected neoantigen-associated mutations to be most under-represented amongst high-cancer cell fraction (CCF) subclonal mutations, as selection had the longest time to act on these mutations. Therefore, we compared the number of neoantigens at high CCF (present in 30%-60% of cells) between MMR cases with and without immune escape, and found greater depletion in non-escaped cancers (Fig. 2g), consistent with immuno-editing shaping the clonal structure of hyper-mutated tumors without immune escape. The above phenomena were also observed in a meta-cohort that combined the three cancer types (Extended Data Fig. 3).
Together, these data suggest that these cancer types usually evolve in the face of stringent immune-selective pressures (analogous to the moderate/high s regime in simulated tumors) and consequently immune-escape is frequently selected for at the onset of tumor growth, permitting the development of tumors with high and clonal neoantigen load.
Subclonal immune escape shapes local neoantigen evolution
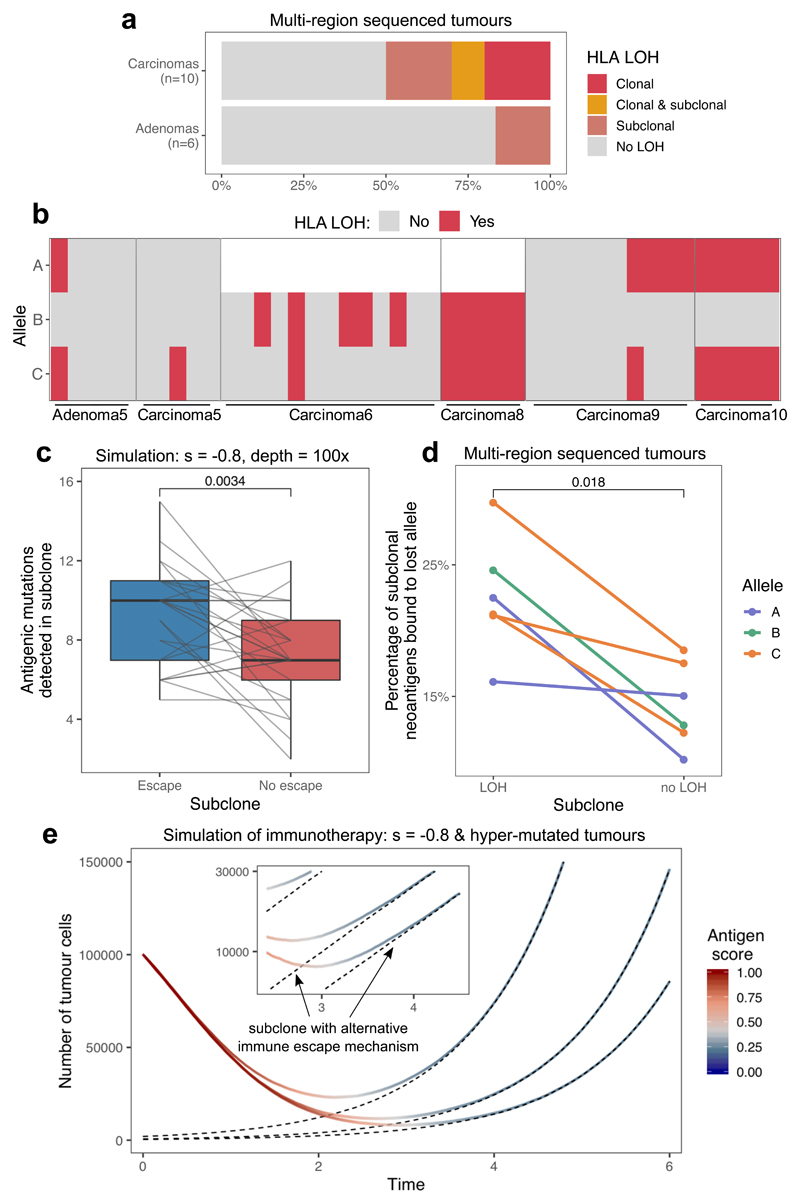
Next, we explored the evidence for subclonal immune escape in a previously published multi-region sequenced colorectal tumor dataset44. Overall, loss of heterozygosity (LOH) at HLA loci, called with the LOHHLA tool37, was found in 5/10 (50%) carcinomas and 1/6 (17%) adenomas (Fig. 3a–b). HLA-LOH was subclonal in at least one allele in 4/6 cases (Fig. 3a–b).
Figure 3. Subclonal immune escape shapes neoantigen landscape and tumor growth after therapy.
(a) Immune escape through loss of heterozygosity (LOH) at an HLA locus in the multi-region sequenced colorectal cohort. LOH events are divided up according to whether the alteration is detected in all (clonal) or not all (subclonal) biopsies. (b) HLA LOH in individual biopsies in tumors with at least one subclonal or clonal loss event. Unfilled boxes represent homozygous HLA alleles. (c) The number of antigenic mutations detected in two distinct (with and without immune escape) subclones of n=25 simulated tumor. Antigenic mutations are detected at simulated read depth of 100x. Visual elements of the boxplot correspond to the following summary statistics: centre line, median; box limits, upper and lower quartiles; whiskers, 1.5x inter-quartile range. (d) The proportion of all neoantigens binding to the HLA allele lost in the LOH event in the colorectal tumors that show subclonal HLA LOH (n=6). One-sided Wilcoxon signed-rank tests are reported on (c) and (d). (e) Growth curve of simulated tumors following anti-PD-L1-type immunotherapy. The tumors have previously developed active immune escape, but also harbor a small subclone with different escape mechanism. Black dashed lines show the number of cells in this subclone over time. The inset shows growth around the point when the subclone takes over, on a logarithmic scale.
Simulations of subclonal immune escape in our model predicted that subclones should become proportionally enriched for neoantigens following escape (Fig. 3c), consistent with previous observations37. In our primary tumor data, a significantly higher proportion of predicted neoantigens were associated with the lost allele in escaped clones than in clones without LOH (Fig. 3d). These results confirm that heterogeneous immune-mediated negative selection pressures can shape individual subclones inside a tumor.
To study how subclonal immune escape mechanisms can influence the efficiency of therapy, we extended our simulations to model immunotherapy. We introduced two different types of escape stochastically during tumor growth, active and passive, that notionally represented reversible escape mechanisms affecting interactions with the microenvironment (e.g. expression of PDL1) and irreversible cell-intrinsic escape (e.g. genomic loss of an HLA allele) respectively (Methods). After the tumor population grew up to detectable size, we simulated immunotherapy by cancelling the effect of active immune escape, and also increasing the negative selection pressure s against neoantigens. The clonal population(s) with active escape rapidly shrank, but clones with passive-type escape continued growing (Fig. 3e). Neoantigens were progressively pruned from the expanding clone, typically leading to an immune-cold tumor. Thus, the immune landscape of a tumor post-immunotherapy is predicted to be distinct from the original tumor (consistent with observations45,46), with potential implications for the choice of the next line of therapy.
Negative selection leads to a neutral VAF distribution
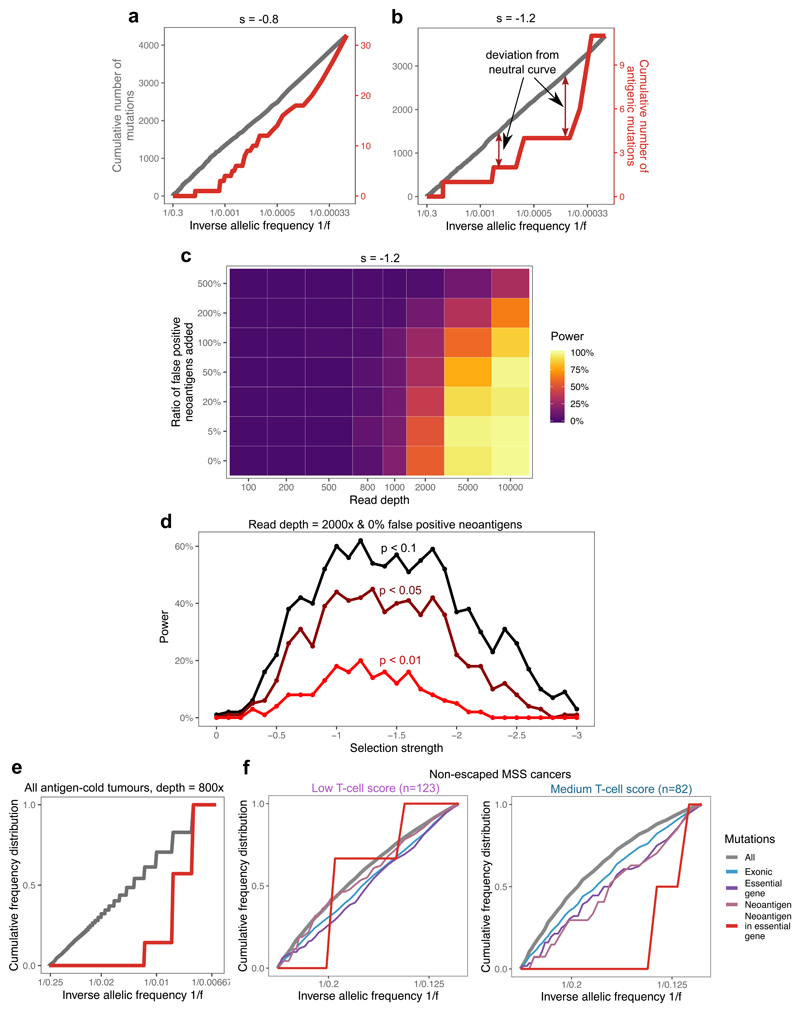
We sought to explore how negative selection shapes the distribution of subclonal mutation frequencies within an individual cancer. We considered the VAF distribution in simulated tumors with moderate and high negative selection. Evidence for positive selection in the VAF distribution is provided by an over-abundance of passenger mutations at high-frequency that are within the expanding clone23, whereas under pervasive negative selection, antigenic clones are continually depleted and so rarely grow to a large size (rarely reach high VAF). Thus, the vast majority of higher-VAF mutations are neutral passengers, that evolve according to neutral dynamics and so exhibit a characteristic 1/f2 dependence (leading to a 1/f dependence of the cumulative VAF distribution, Fig. 4a)9. As negative selection strength increases, the phenomenon is exacerbated: antigenic subclones are more rapidly depleted and so more neutral-like VAF distributions are observed (Fig. 4b). We note that pervasive negative selection was part of the original neutral theory47, and our observations are consistent with this classical theory.
Figure 4. Negative selection leads to characteristic depletion of neoantigens and effectively-neutral overall VAF distributions.
(a-b) Cumulative number of mutations as a function of the inverse of the frequency for all mutations (grey, left axis) and neoantigen-associated mutations (red, right axis) harbored in at least 30 cells in (a) a tumor with s=-0.8; (b) a tumor with s=-1.2. (c) Power to detect negative selection from the VAF distribution as a function of sequencing read depth (x axis) and false neoantigen rate (y axis). Power is the proportion of 100 simulated tumors with significant difference (two-sided Kolmogorov-Smirnov test, α=0.1) between the distribution of all mutations and neoantigen-associated mutations. (d) Power (in n=100 tumors) to identify negative selection as a function of selection strength (x axis) and the stringency of the two-sided Kolmogorov-Smirnov test used for detection (α=0.1, α=0.05, and α=0.01, shown in black, maroon and red, respectively). (e) Cumulative VAF distribution as a function of the inverse of the frequency for all (in grey) and neoantigen-associated mutations (in red) detected with a sequencing depth of 800x in antigen cold tumors from a simulated set of n=100. The y axis shows proportion of mutations. The mutation-antigenicity threshold 0.2 is used in all cases in (a)-(e). (f) Cumulative VAF distribution of mutations detected in any low- and medium-immune infiltrated TCGA MSS cancers without immune escape. The distribution is shown for all mutations (grey), exonic mutations (blue), exonic mutations in essential genes (purple), antigenic mutations (pink) and neoantigen-associated mutations in essential genes (red).
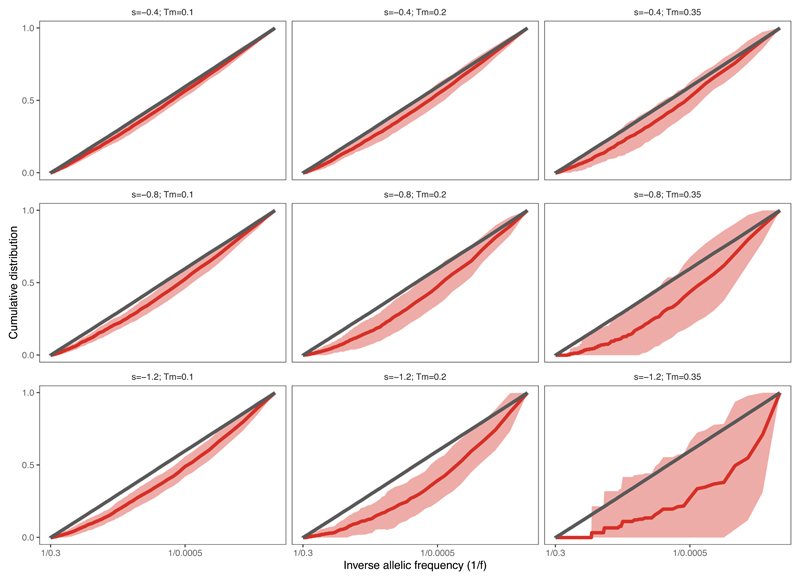
The VAF distribution computed of solely neoantigens shows depletion relative to the neutral expectation (red lines in Fig. 4a–b), consistent with population genetics theory of constant-sized models29,34 (Extended Data Fig. 2c,f). The magnitude of deviation from the neutral curve depends on the strength of negative selection, which means that, in theory, negative selection could be detected from neoantigen-VAF distributions (Extended Data Fig. 4). However, in practice, the few persisting neoantigens are at very low VAFs and so are problematic to measure accurately48, severely hindering the power to quantify negative selection strength directly from neoantigen VAF distributions.
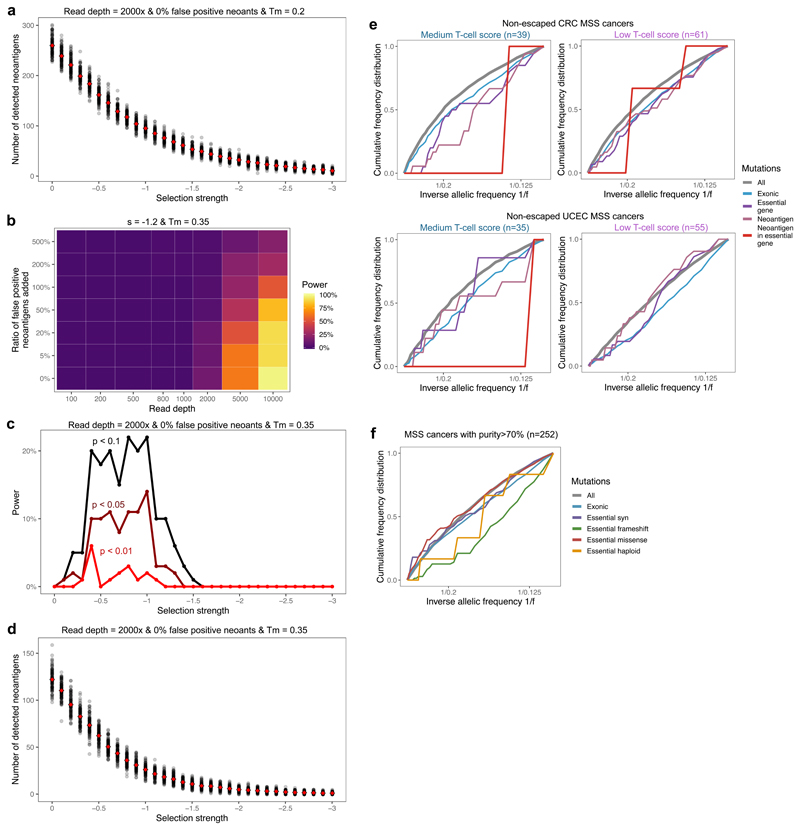
We performed in silico sequencing on simulated tumors, and explored the effect of read depth and false-positive neoantigen identification49 on the identifiability of negative selection in individual tumors (see Methods). The simulations predicted that very high depth sequencing was required to robustly call negative selection from VAF distributions, and the efficacy strongly depended on the strength of selection against neoantigens (Fig. 4c–d). Erroneously labelling neoantigens also had substantial impact on the power, but could be mitigated by very high-depth sequencing. Detection was mostly limited by the tumors retaining too few neoantigens to reliably evaluate their VAF distribution, a phenomenon further exacerbated when concentrating on strongly immunogenic mutations alone (Extended Data Fig. 5a–d).
In order to overcome the technical issues of limited sequence depth and low antigen numbers, we pooled mutations from groups of identically simulated and comparable TCGA tumors (Methods) and considered their combined VAF distribution (Fig. 4e), in a similar manner to how cohort-wide positive selection by dN/dS analysis is evaluated24,25. In the pooled TCGA cohort, we investigated essential genes50 that are expected to be constitutively expressed and under selection25,51. In cancers with medium T-cell score and no evidence of immune escape, there was a depletion of all neoantigens and neoantigens in essential genes compared to other genomic regions (Fig. 4f). In contrast, there was no neoantigen depletion in cancers with low T-cell score and no evidence of immune-escape. Neoantigens in CRC and UCEC cancers individually, as well as frameshift and nonsense mutations in essential genes, showed similar trends (Extended Data Fig. 5e–f), suggesting a more stringent selection in moderately infiltrated tumors and on essential genes.
Proportional neoantigen burden measures negative selection
Depletion of neoantigens relative to the overall non-synonymous mutation burden is a well-established signature of immuno-editing52,53. We investigated the relationship between the degree of neoantigen depletion and strength of negative selection experienced by neoantigens.
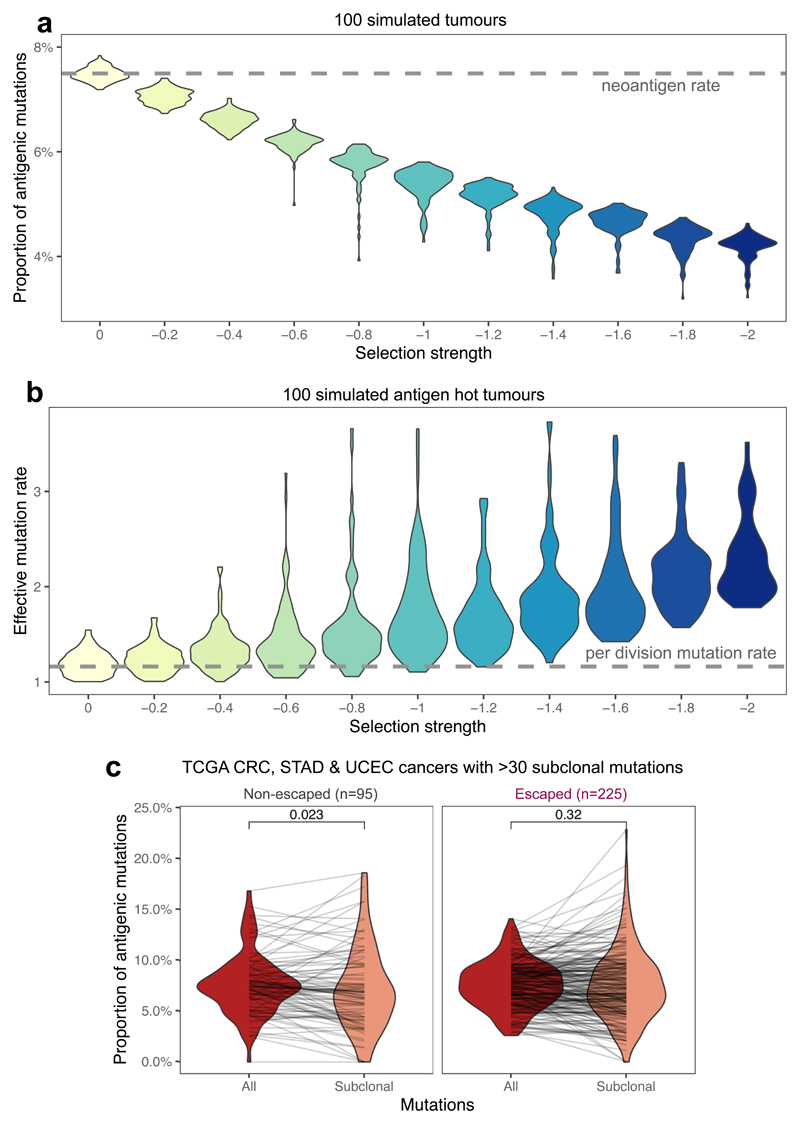
First, we simulated tumors with a known neoantigen production rate (pa=0.075 per non-synonymous mutation, Supplementary Note ) to evaluate how the proportion of immunogenic to non-synonymous mutations changed with negative selection strength. As expected, stronger negative selection led to proportionally fewer observed neoantigens in the final tumor (Fig. 5a). We also measured the effective mutation rate (the ratio of the per cell division mutation and survival rate), derived from the linear slope of the neutral VAF curve9, as a function of increasing negative selection for neoantigens (Supplementary Note). Stronger negative selection caused higher effective mutation rates in antigenic tumors (Fig. 5b), as a consequence of increased death rate. We suggest that the higher cell death rate inferred in hyper-mutated tumors54 is likely to be, at least in part, a direct consequence of immuno-editing.
Figure 5. Proportional neoantigen burden as a measure of selection.
(a) The proportion of neoantigen-associated mutations (the percentage of all mutations) as a function of negative selection pressure, computed from n=100 tumors each, with a simulated read depth of 200x. The expected value of antigens per mutation is indicated with a horizontal dashed line. The mutation-antigenicity threshold of 0.2 is used. (b) Effective mutation rate (per cell division mutation rate divided by per cell division death rate) computed from the VAF distribution of mutations in antigen-hot tumors as a function of negative selection pressure. Read depth = 200x. Colors in (a) & (b) indicate selection strength also shown on x axis (c) Proportional neoantigen burden of escaped and non-escaped TCGA samples, computed from all mutations (red) and only subclonal mutations (CCF<0.6, colored salmon). Lines connect total and subclonal proportional burdens measured in the same sample. Paired two-sided Wilcoxon test is reported above the violin plots. Violin widths represent raw data density with individual data points in (c) also indicated by end-points of connecting lines.
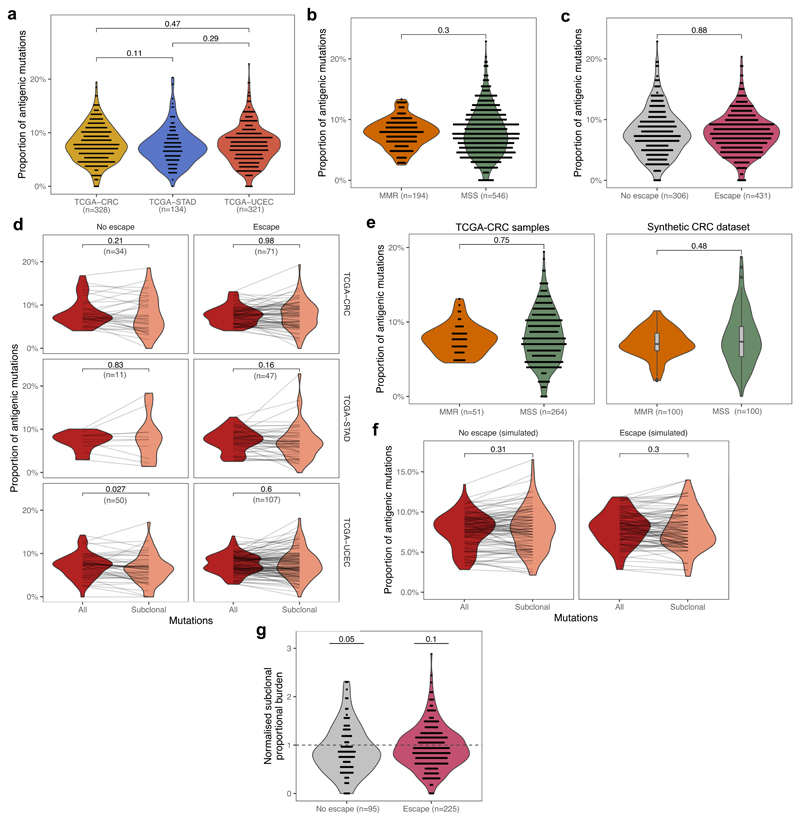
Next, we examined the proportional neoantigen burden in TCGA CRC, STAD and UCEC cancers stratified by cancer type and predicted immune escape status. We observed no difference in overall proportional neoantigen burden according to cancer type (Extended Data Fig. 6a), and so combined all data into a single meta-cohort. We detected no significant difference in overall proportional burden between MSS and MMR, and immune escaped or non-escaped cancers (Extended Data Fig. 6b–c). The observed uniformity in overall proportional burden across the cohort is consistent with the lack of neoantigen depletion signal reported in ref52. The majority of mutations considered in these analyses were clonal, and so were likely accrued prior to tumor expansion and acquisition of immune escape. To better delineate the decrease in negative selection expected following immune escape, we computed subclonal proportional neoantigen burden for mutations with CCF<0.6. Comparing total and subclonal proportional burden (considering all tumors with >30 subclonal mutations) showed a lower subclonal proportional burden in non-escaped cancers, but no shift was detected in cancers with immune escape (Fig. 5c), consistent with immune-mediated negative selection operating in non-escaped cancers. When cancer types were considered independently, UCEC and CRC cancers showed a similar pattern, but no subclonal depletion was evident in STAD cancers (Extended Data Fig. 6d).
To examine the potential confounding effect of different mutational processes, we generated synthetic cohorts analogous to real tumors (Methods). Comparing the synthetic cohorts matching the overall mutation composition of CRCs showed no significant difference in proportional burden, suggesting that MMR-specific mutational processes (e.g. Signature 6 from ref55) are not strongly biased for neoantigen generation (Extended Data Fig. 6e). A synthetic matched cohort of Fig. 5c confirmed that the observed difference in subclonal proportional neoantigen burden was also independent of mutational processes (Extended Data Fig. 6f). Burden normalized to this synthetic cohort provided weak evidence of lower than random subclonal neoantigen burden (Extended Data Fig. 6g). These observations imply the presence of active immune surveillance when escape has not occurred, and highlight the high inter-patient variability in evolutionary dynamics.
Discussion
Here we have investigated the evolutionary dynamics of neoantigens and immune escape in growing tumors using a mathematical model of tumor evolution. Our analysis shows how negative selection by the immune system (immuno-editing) sculpts the clonal architecture of the tumor: the hallmark of negative selection is the lack of neoantigens at intermediate subclonal frequency within a tumor, and conversely, the presence of numerous neoantigens at intermediate frequency is a hallmark of immune escape. Moreover, strong negative selection for neoantigens inevitably provides a strong selective pressure for the evolution of immune escape. Consequently, the observation that many cancers are both (neo)antigenic and have immune escape points to a critical role for immune escape in the genesis of malignancy. Further work directly measuring the immune repertoire at the time invasion first occurs is required.
Our simulations show that under negative selection, the overall VAF distribution of a tumor will be effectively-neutral, as it will be dominated by the neutral passenger mutations that are able to spread through the tumor unimpeded by immune predation. In constant size models, neutral mutations linked to disadvantageous alterations show a pattern of background selection30–33, but in growing populations selection can only be observed on the selected mutations directly. The VAF distribution observable in cancer genome sequencing data becomes more neutral-like as the strength of negative selection increases, as negatively selected clones are pushed to harder-to-detect frequencies leaving only neutrally evolving lineages at high VAF. Furthermore, our analysis suggests that the majority of tumors with high mutational burden – where in theory VAF distributions and so evolutionary dynamics should be easier to resolve – are most likely to be immune escaped and so only exhibit effectively neutral dynamics. Consequently, we suggest that the lack of immune-related selection signal (e.g. as identified by ref52) could be due to unclassified immune escape or false-positive neoantigen calls that together mean the mutations studied are likely to be overall only very weakly negatively selected. Pooling data across cancers increases power to resolve clone size distributions and detect negative selection, and could be combined with dN/dS methods to evaluate selection of gene sets, such as natural HLA-binders52,56 and MHC-II presented peptides57.
Our modelling offers insight into the challenges of predicting immunotherapy response using tumour mutation burden (TMB) alone. Strong negative selection (effective immune surveillance) leads to a high rate of cell death, a corresponding increase in the effective mutation rate of tumors, and the net result of high TMB with severe neoantigen depletion. Thus, despite having high TMB, such tumors would be unlikely to respond to immune checkpoint blockade. Assessment of neoantigens should be more predictive: tumors with clonal or numerous subclonal neoantigens are very likely to have evolved immune escape – particularly if the patient’s immune system is highly predatory – and to respond to therapies reactivating immune predation. This is consistent with previous studies suggesting that clonal antigens predict sensitivity to immune checkpoint blockade43. We illustrate that immune therapies targeted against a specific neoantigen or immune mechanism are vulnerable to intra-tumor heterogeneity, as subclones in which this target is altered or lost (e.g. neoantigen depleted or HLA haplotype mutated) will experience net positive selection when the therapy is applied58–60. Relatedly, a subclone that escapes immune blockade therapy and reforms the tumor is predicted to have a different immune landscape due to the action of immune predation during clone emergence, with potential implications for additional lines of therapy.
In summary, our mathematical framework provides insights into the evolutionary dynamics of negatively selected neoantigens in growing tumors and the detectability of these dynamics in genomic data.
Methods
Mathematical model of tumor growth and mutation accumulation
We created a minimal stochastic branching process model to represent tumor growth and accumulation of mutations under selection pressure from the environment61. The model described the proliferation, death and mutation accumulation of tumor cells, and environmental factors (e.g. the level of T-cell infiltration) were described implicitly through parameters that quantified the strength of selection against tumor cells.
We made use of a rejection-kinetic Monte Carlo algorithm62 to permit efficient simulation of large populations of cells. Tumor evolution was initiated by a single transformed cell that produced two surviving offspring at birth rate b per unit time. Cells in clone i died at rate di per unit time, where the death rate increased with the neoantigen burden of the clone. Each time a cell divided, it acquired new unique mutations at overall rate μ (Poisson distribution), which were assigned as neoantigens at rate pa, or as passengers (evolutionary neutral) at rate 1-pa. Each antigenic mutation was assigned an antigenicity value (denoted Aj for the jth antigen in a given cell) sampled from an exponential distribution with the rate parameter set to 5 to produce a skewed distribution wherein >99% of antigenicity values fall between 0 and 1, and most neoantigens are only negligibly immunogenic (Fig. 1a). Neoantigens caused the death rate di of the lineage to increase from a basal rate of db=0.1 to a higher value determined by the strength of negative selection against each new neoantigen, controlled by the parameter s. The overall effect on the birth/death rate of cells was determined by the cumulative antigenicity of neoantigens harbored in the lineage, ΣAj. The death rate of a subclone was computed as:
| (1) |
And we defined the selective (dis)advantage of a subclone by its effective proliferation rate (the difference of its birth and death rate), as compared to a non-immunogenic clone:
| (2) |
where denotes the jth neoantigen in lineage i; s=0 stands for neutral evolution with no neoantigen-associated selection and negative selection is represented by s<0.
This antigenicity-dependent increase in the clone death rate represented an aggregate of the many stochastic factors that lead to the negative selection of neoantigens, including; (i) sufficient presentation of neoantigens on the cell surface; (ii) recognition of neoantigens by T-cell; (iii) antigen-mediated recruitment of further T-cells; and (iv) T-cell killing efficiency. We chose to integrate all variability into a single probabilistic rate to be able to observe general qualities of the tumor-immune interaction without the need for precise parametrisation. For details on the steps of in silico simulations, see Supplementary Note and code at https://zenodo.org/record/3601322#.XvKCGJJKii4.
We also modelled the acquisition of immune escape during tumor growth. Known immune escape mechanisms include mutations affecting the antigen presenting machinery and expression of immune checkpoint molecules36,37. Immune escape was modelled as a heritable property of a cell (representing e.g. copy number alteration of the PD-L1 or HLA gene). Immune escape occurred as a result of a mutation with probability pe per nonsynonymous mutation; or through manual introduction of the escape alteration at a pre-determined clone size to achieve clonal or subclonal immune escape. We considered two different types of escape mechanism: (i) active escape, which shields the clone from negative selection (decreasing the clone death probability to db) but does not decrease the neoantigen burden of the cell (corresponding to escape mechanisms such as PD-L1 overexpression); and (ii) passive escape, which renders a portion of neoantigenic mutations neutral (by rendering their antigenicity, Aj to 0; representing, for example, loss of a HLA allele that predicts a subset of neoantigenic peptides being presented).
We also incorporated therapeutic intervention in our model by time-dependently changing model parameters. The most commonly used agents in immunotherapy target and inhibit immune checkpoint pathways, helping the immune system to overcome immune escape achieved by checkpoint over-expression and re-activate immune predation of neoantigenic cancer cells. We simulated this effect by rendering active type immune escape ineffective (death rate of escaped cells is increased by antigenic load) and simultaneously increasing the negative selection strength s experienced by each neoantigen.
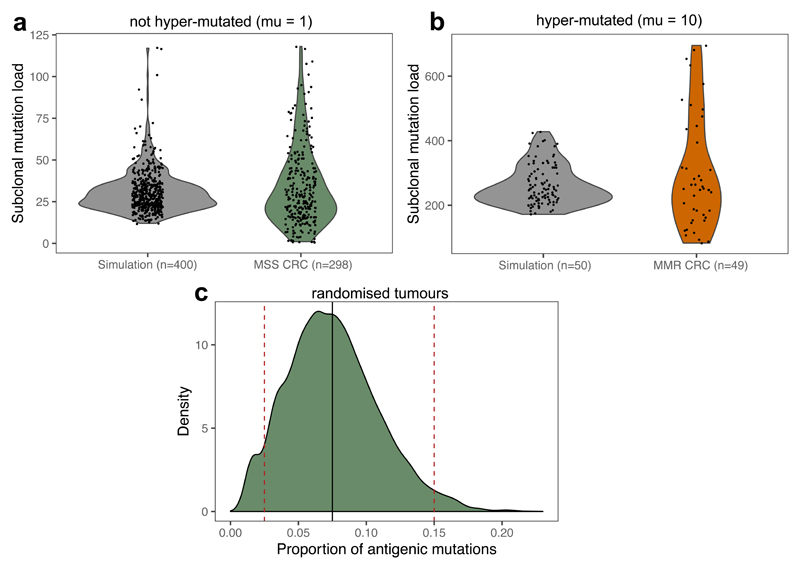
We chose model parameters to represent a wide range of possible tumor-immune environments, and correspond to phenotypic properties of real cancers (Extended Data Fig. 6). The following parameters were used in all simulations: b = 1; db = 0.1; μ = 1 (not hyper-mutated) and μ = 10 (hyper-mutated); −2 ≤ s ≤ 0 (as indicated in figures or in caption); pa = 0.075 and pe = 10−6 (where applicable). For analyses where cells and mutations were classified as antigenic or not, the cell- and mutation-antigenicity thresholds Tc = 0.5 and Tm = 0.2 were used, unless stated otherwise. For further discussion on the simplifications applied in the model, and the choices of simulation parameters and how they influence results, see the Supplementary Note and Extended Data Figs. 7–9.
Simulation of VAF/CCF distributions and power calculation
To evaluate the mutation spectrum of simulated tumors, mutations harbored in at least 10 cells out of 105 (0.01%) were collected at the end of each simulation and the number of carrier cells reported. Real sequencing data naturally introduces uncertainty about mutated allele frequency due to limited sequencing depth and several sources of sampling bias22. To account for imperfect measurements, CCF values were either computed by taking the raw frequency values or via a simulated sequencing step introducing noise to these frequencies with indicated read depth. For a given read depth, D, each frequency value, f, was substituted by a new frequency sampled from a binomial distribution with parameters D and f: ˜ Binom (D.f.)/D. We filtered for mutations with above 0, to discard mutations that are not picked up due to limited detection power.
In addition to sequencing limitations, neoantigen identification from DNA sequencing alone has a high rate of false-positive calls49, and therefore the VAF distribution of neoantigens is expected to be ‘contaminated’ with a large proportion of neutrally-evolving passenger mutations. To simulate this effect when evaluating the power of detecting selection, we randomly sampled non-antigenic mutations of simulated tumors (varied between 5% to 500% of the number of true neoantigens, Fig. 4c) that were falsely labelled as neoantigens and included in the neoantigen-based VAF distribution.
We computed the power to detect selection by comparing the distribution of all detected mutations to that of the neoantigen-labelled subset using a two-sample Kolmogorov-Smirnov test, and identified any samples as under selection in which the p-value of the test was below 0.1 (Fig. 4c) or a pre-defined value (Fig. 4d).
TCGA sample acquisition and processing
All samples from the TCGA COAD and READ (merged together as CRC), STAD and UCEC domains were retrieved through the NCI Genomics Data Commons (GDC) portal63 between 15/06/2018 and 13/11/2019. Only patients with matched germline (from blood samples) and primary tumor information available were considered. For each sample, purity (fraction of tumor cells in the sample) and overall ploidy were evaluated using ASCAT64 on Affymetrix SNP array data. Samples with purity below 0.4 and ploidy above 3.6 were excluded from the analysis, leaving 363 CRC, 146 STAD and 370 UCEC samples for which HLA typing and neoantigen calls were performed (Supplementary Table 1 and Fig. 2a).
For analyzing immune escape, the cohort was narrowed down to patients for whom gene expression data was available in GDC; and at least one pair of their HLA A/B/C alleles were heterozygous and distinct enough to allow for loss of heterozygosity calls (n(CRC) = 341, n(STAD)=118, n(UCEC)=362).
For each patient considered, the following information was downloaded: blood derived normal bam files; primary tumor bam files; unfiltered variant call (vcf) files processed with Mutect2; SNP array files; gene expression HTSeq counts (where available); and clinical information. We used the unfiltered controlled-access variant call format (vcf) files to avoid over-filtering and missing antigenic variants. The variants were filtered to only include variants that passed all filters of the vcf files and not present (allelic depth of 0 or 1 for bases covered with over 30 reads) in normal samples.
Samples were divided into MSS, MMR and POLE subtypes using data integrated from (i) clinical TCGA annotation65; (ii) calls retrieved from ref66 that used the computational tool MANTIS to analyze repetitions in tumor-normal sample pairs over microsatellite loci; (iii) and mutational signature activities computed using non-negative least squares regression26,55. Samples with a MANTIS score ≤ 0.5 and TCGA annotation of ‘MSI-H’ (‘microsatellite instability’, where available) were considered MMR, and those with MANTIS < 0.5 and ‘MSI-L’/’MSS’ were labelled MSS. In case the two sources of information contradicted each other, neither of the categories was assigned. Samples with at least 1,000 mutations inferred to originate from the characteristic POLE signature (signature 10 in ref55) were labelled as POLE tumors regardless of their MMR status.
Multi-region sequenced dataset processing
The multi-region sequenced colorectal dataset was accessed from Cross et al. 44 (raw data available from the European Genome-Phenome Archive (https://ega-archive.org/) at accession code: EGAS00001003066). Bam files with marked duplicates were used for HLA calling and HLA variant detection. As in the original work, variants were called using Platypus67, annotated by ANNOVAR68, and filtered to only contain somatic single nucleotide variations that were present in at least 1 tumor sample and in either 0 reads in the normal sample (for normal coverage <=30 reads) or in at most 1 read (for normal coverage above 30 reads).
HLA haplotyping and calling immune escape
HLA-A, -B and -C haplotyping was performed on blood derived normal bam files using POLYSOLVER39. As POLYSOLVER takes into account the individual’s race to compute the likelihood of each allele haplotype, we supplied ethnicity data, where available from clinical TCGA information, and ran haplotyping with race ‘Unknown’ otherwise.
Using exome and RNAseq data, we tested for the presence of three types of immune escape mechanisms: (i) somatic mutations in either one of the HLA alleles or in the B2M gene39,41; (ii) loss of an HLA haplotype through loss of heterozygosity (LOH) in the corresponding genomic locus37; and (iii) PD-L1 or CTLA-4 over-expression69.
Mutations in HLA alleles were called using the previously called HLA haplotypes and the corresponding functionality of POLYSOLVER39. Variant calling was run using default settings and HLA was considered mutated if at least one allele had a nonsynonymous somatic mutation located in an exon or at a splice-site. Mutations in B2M were called if the sample contained a nonsynonymous somatic mutation located inside one of the exons of the B2M gene, as annotated by ANNOVAR68 and confirmed using Variant Effect Predictor70. Loss of heterozygosity at the HLA locus was assessed using the software LOHHLA37, using blood derived normal, and tumor bam files were used. Tumor purity and ploidy estimates were derived from ASCAT (for TCGA data) and from Sequenza71 (for the multi-region sequenced colorectal tumors). A sample was considered to have Allelic Imbalance at an HLA locus if the corresponding p-value was below 0.01 and LOH if, in addition, the copy number prediction of that allele was below 0.5, with the confidence interval strictly below 0.7. Immune checkpoint over-expression was assessed using RNA-seq data. Normal expression values (in transcripts per million (TPM)) of PD-L1 and CTLA-4 were established for each cohort from TCGA based on RNA-seq counts of the two proteins in ‘solid tissue normal’ samples. Checkpoint over-expression was called if either PD-L1 or CTLA-4 expression in the tumor was higher than the mean plus two standard deviations of normal expression. Immune checkpoint over-expression could not be inferred for the multi-region sequenced dataset as only genomic data were available.
We note that the extent of the impact of these escape alterations is not always known – especially for mutations altering antigen presenting proteins – but we argued that nonetheless they represent a level of impairment in the tumor-immune interaction.
Immune infiltration levels were computed from RNA-seq data based on the method of Grasso et al.41: a signature of 12 genes (CCL2, CCL3, CCL4, CXCL9, CXCL10, CD8A, HLA-DOB, HLA-DMB, HLA-DOA, GZMK, ICOS, and IRF1) was extracted, and a continuous T-cell score derived as their log(TPM) average. The continuous score was then divided into three equal sized intervals (based on all cancers) to provide low, medium and high T-cell score levels.
Neoantigen prediction
Neoantigens were predicted from variant call tables and HLA types using NeoPredPipe40, a neoantigen prediction and evaluation pipeline designed for parallel analysis of single- and multi-region samples. We only evaluated single nucleotide variants leading to a single amino acid change, and novel peptides of 9 and 10 amino acids were considered. The pipeline was run with default analysis settings and preserving intermediate files (–p flag), using hg38 and hg19 ANNOVAR68 reference files for annotation of the TCGA and multi-region CRC samples, respectively. The analysis outputted a table of novel peptides binding the patient’s MHC-I molecules (considering all six alleles independently) and their respective recognition potential calculated from their MHC-binding affinity and similarity to pathogenic peptides, as described in ref19. For evaluating the recognizability (R) part of the recognition potential, we used the parameter values derived in ref19. Unless stated otherwise, we labelled a peptide as neoantigen if its recognition potential was >= 10−1 (with respect to any of the patient’s HLA types) to focus on antigens with the highest predicted probability of eliciting an immune response: both similar to known pathogens and similar or stronger MHC-binders than their wild-type counterpart. A mutation was considered (neo)antigenic if there was at least a single peptide produced from the mutated base that got labelled as neoantigen.
To evaluate the antigenicity distribution of tumors, we used the predicted percentile rank of neoantigens that ranks a putative antigen against a large set of random substrates to the same HLA molecule, and thus eliminates bias introduced by structural properties of HLA alleles72, that might be present in plain binding affinity values (considered in the recognition potential pipeline). We inverted this value to obtain a normalized binding score that correlates with the importance ranking of peptides, where values above ~1.3 represented strong putative antigens.
Computation of VAF and CCF values
For each mutation, we calculated the VAF as the number of mutant reads spanning the position, divided by the number of total reads of the position. The proportion of cancer cells carrying a particular mutation (CCF) was calculated from the VAF of the mutation, sample purity (tumor content), and copy number (CN) of the mutation’s genomic locus as: (VAF * CN)/purity. CCF values above 1 (arising from sequencing noise and copy-neutral loss-of-heterozygosity events) were assumed to be 1. We only considered a mutation as subclonal if it had CCF<0.6, to account for the possibility of ‘bleeding’ of clonal mutations into the subclonal frequency range because of the limited sequence depth of TCGA samples.
For pooling together VAF distributions of a cohort of samples (Fig. 4f), we first filtered the set of TCGA cancers: cancers with any evidence of immune escape (including allelic imbalance of HLA locus), MMR or POLE cancers and cancers with purity <50% were discarded. The remaining cancers were divided into low and medium immune infiltration groups (all highly T-cell score cancers were immune escaped and previously discarded). Total and neoantigen-associated cumulative VAF distributions were computed from all mutations detected at subclonal frequencies in the two groups. In a similar manner, TCGA MSS cancers with purity >70% (to ensure more accurate VAF and ploidy calls) were combined into a cohort to study mutations in essential genes (Extended Data Fig. 5f). Essential genes, and antigenic mutations located in essential genes were identified using the list of shared genes in ref50.
Synthetic cohorts
In order to evaluate the antigen-producing capacity of different mutational processes, we generated synthetic tumor cohorts matching the mutation number and tri-nucleotide composition of real cancers. We measured the average composition (as measured by 96-channel-composition55) of the real cohort (e.g. TCGA CRCs, Extended Data Fig. 6d), and randomly sampled a matching number of exonic mutations at probability specified by the respective channel intensities. Six HLA haplotypes were also randomly sampled from the complete list of alleles in the real cohort. Sampling was repeated independently 100 times to generate a synthetic cohort.
Statistical analysis
Details of statistical analysis performed are summarized in the Life Science Reporting Summary. All data processing and statistical tests were performed in R (version 3.5.0) using built-in functions. The tests and functions used were as follows: Figs. 1d, 2c,e, Extended Data Figs. 3c, 6a,b,c,e: Mann-Whitney U-test/ Wilcoxon sum-rank test (wilcox.test, default settings). Figs. 2d,f and Extended Data Fig. 3a,b,d: Chi-squared test (chisq.test). Fig. 2g and Extended Data Fig. 3e: One-sided Mann-Whitney U-test (wilcox.test with option alternative=‘greater’). Fig. 3c–d: One-sided paired Wilcoxon signed-rank test (wilcox.test with options paired=TRUE and alternative=‘greater’). Fig. 4c–d and S5b-c: Kolmogorov-Smirnov test (ks.test) between the raw VAF distribution of neoantigens and all mutations. The two distributions were deemed with significance level p<0.1 or as indicated in Fig. 4c–d and Extended Data Fig. 5b–c. Fig. 5c and Extended Data Fig. 6d,f: Paired Wilcoxon signed-rank test (wilcox.test, option paired=TRUE). Extended Data Fig. 6g: Students t-test against mean of 1 (t.test, mu=1).
All violin plots were generated with automatic smoothing bandwidth value of geom_violin. Individual observations for TCGA samples are shown on top of violins, generated with geom_dotplot.
Extended Data
Extended Data Fig. 1. Population-level statistics under varying levels of selection.
(a) Distribution of neoantigen scores of tumour cell populations when reaching 105 cells, for increasing selection strengths (left column, top to bottom) and cell-antigenicity threshold (Tc) used analysis (right column). n=100 tumours were simulated for each parameter combination. (b) The distribution of antigenicity values of all neoantigens present in at least 10 cells in the final tumour population simulated with exponential, uniform and normal prior neoantigen distributions. The thick line shows the mean density of 50 simulated distributions at no, moderate and high selection pressure (s = 0 (yellow), s = −0.8 (teal), s= −1.6 (blue), respectively), the shaded regions represent ±1 standard deviation around this mean. Priors are shown with a grey dashed line.
Extended Data Fig. 2. Dynamics of the growing population compared to a constant size population model.
Tumours simulated using our tumour growth model (growing population, (a)-(c)) and a death-birth Moran process (constant size population, (d)-(f)) at different selection strength and mutation rate regimes, as indicated in each row and detailed in the main text. Simulations were run for a final population of 10,000 cells in the growing population model and for 50,000 steps in the constant size model. (a)&(d) The mean antigenicity of the tumour for 6 individual simulations. Tumours that reached detectable size are shown in blue, eradicated tumours (cell count reaches 0) are in red, the constant size tumours are invariably in grey. (b)&(e) Distribution of CCF values of the most common neoantigen computed from 20 tumours. For the growing population, only tumours that did not go extinct are shown, and consequently no graph is included for the last two rows. (c)&(f) Cumulative VAF distribution of all mutations (grey) and neoantigens (red). The thick line shows the mean of 20 simulated cumulative distributions, the shaded regions represent ±1 standard deviation around this mean. Note that in the first row, there are no neoantigens in the studied frequency range (no red line), while in the last row the grey and red curves overlap.
Extended Data Fig. 3. Immune escape and antigenicity in TCGA CRC, STAD and UCEC samples.
(a) Prevalence of the individual immune escape mechanisms considered in the combined cohort of CRC, STAD and UCEC samples. P-values shown on top of each bar indicate the result of chi-squared test for that mechanism, corrected for multiple comparisons using the Holm-Bonferroni method. An additional test comparing the presence/absence of any immune checkpoint escape is also indicated above the checkpoint columns. (b-e) Antigen landscape and immune escape characteristics of a combined cohort from TCGA. Figures correspond to Figures 2d–g. Two-sided chi-squared test is indicated on top of (b) and (d). Mann-Whitney tests (c: two-sided, e: one-sided) are reported above (c) and (e). No adjustment for multiple comparisons was made. Violin widths in (c) & (e) represent raw data density with binned individual data-points overlaid on top.
Extended Data Fig. 4. VAF distribution of neoantigens under different selection strengths and mutation-antigenicity thresholds.
Cumulative VAF distribution as a function of the inverse of the frequency, for all mutations (grey) and antigenic mutations (red) at increasing selection strengths (top to bottom) and mutation-antigenicity threshold (Tm) applied to label mutations as antigenic (left to right). The thick line shows the mean of 100 simulated cumulative distributions, the shaded regions represent ±1 standard deviation around this mean.
Extended Data Fig. 5. Detection of negative selection in variant allele frequency distribution.
(a) Number of detected (true) neoantigens in n=100 simulated tumours for each selection strength between s=0 and s=-3. The mean number detected at each selection value is shown in red. (b-d) Power (detection rate) to identify negative selection using two-sided Kolmogorov-Smirnov test (b-c) and number of detected neoantigens (d) as a function of read depth, false positive neoantigens amongst antigenic mutations and selection strength, when only mutations above the mutation-antigenicity threshold (Tm) of 0.35 are analysed as antigenic, instead of 0.2 (c.f. Figures 4c–d, Extended Data Figs. 4 & 5a). n=100 simulated tumours are used in the computation. (e) Cumulative VAF distribution of mutations detected in low and medium immune infiltrated CRC (upper panel) and UCEC (lower panel) MSS cancers without immune escape. VAF distributions of STAD sample could not be established due to low sample and mutation numbers. (f) Cumulative VAF distributions of mutations detected in essential genes in all TCGA MSS cancers with good tumour cellularity (above 70%). The curves show synonymous (purple), frameshift and nonsense (green), missense (red) and hemizygous (located in haploid regions of the genome, yellow) mutations found in essential gene exons.
Extended Data Fig. 6. Proportional burden of TCGA tumours.
(a) Inter-tumour distribution of the antigenic proportion of missense mutations across CRC, STAD and UCEC cancers with >30 missense mutations. (b) Inter-tumour distribution of proportional burden in MSS and MMR cancers of the meta-cohort combining CRC, STAD and UCEC cancers with >30 missense mutations. (c) Inter-tumour distribution of proportional burden in escaped and non-escaped cancers of the meta-cohort. Two-sided Wilcoxon test p-values are reported on a-c (d) Proportional burden computed for all (red) and subclonal (salmon) mutations in immune-escaped and non-escaped samples of each TCGA cohort. Lines connect values computed from the same cancer. (e) Inter-tumour distribution of proportional burden in real CRC samples stratified by MSS/MMR status (left) and synthetic samples matching the mutational composition of real samples (right), with two-sided Wilcoxon-test reported on top. (f) Total and subclonal proportional antigen burden computed on a matched synthetic cohort of n=100 tumours (cf. Fig. 5c). The p-value of paired two-sided Wilcoxon test is reported on (d) & (f). (g) Normalised proportional subclonal burden computed by dividing subclonal burden of the meta-cohort by average subclonal burden of the synthetic cohort of n=100. P-value of a one-sample two-sided t-test against null-hypothesis of mean=1 is reported above each violin. Violin widths represent raw data density with binned individual data-points overlaid on top in (a-d) & (g) and indicated by the end-points of connecting lines in (e-f). Visual elements of boxplots in (d) correspond to the following summary statistics: centre line, median; box limits, upper and lower quartiles; whiskers, 1.5x inter-quartile range; additional points, outliers outside of 1.5x inter-quartile range.
Extended Data Fig. 7. Values of μ and pa based on TCGA CRCs.
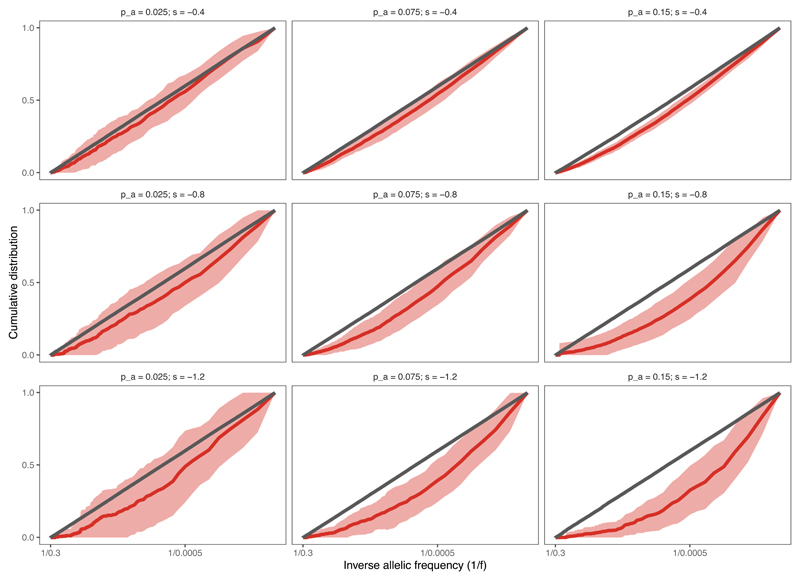
(a-b) The number of subclonal (CCF < 0.6) missense mutations in MSS (a) and MMR (b) CRC samples; shown together with the subclonal mutation count of ‘normal’ (a) and hyper-mutated (b) simulated tumours sequenced at a depth of 30-60x (sequencing depth sampled randomly in the range). Violin widths represent raw data density with individual data-points (of exact y values) scattered on top. (c) The distribution of the proportion of antigenic mutations in a randomised TCGA MSS colon dataset, where patient mutation load and HLA types were extracted from the data and the proportion of antigenic mutations calculated by sampling randomly from missense mutations found in TCGA CRCs. The thick solid black line shows pa=0.075, the values used for simulations presented in main figures. Dashed red lines show pa=0.025 and pa=0.15 used in Extended Data Fig. S9.
Extended Data Fig. 8. Immune properties of tumours at different basal death rates.
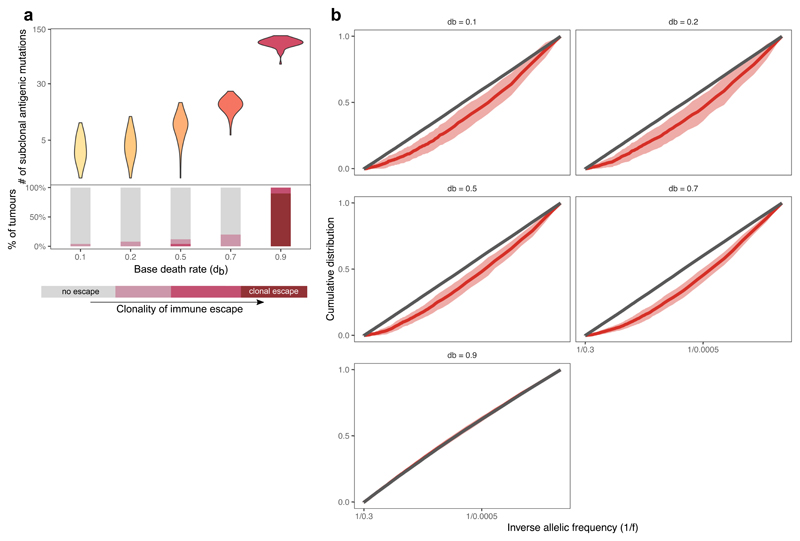
(a) The number of detectable neoantigen-associated mutations (at simulated sequencing depth of ~50x) in n=50 simulated tumours with increasing base (non-immunogenic) death rate. The bottom panel shows the ratio of tumours with different levels of immune escape. Violin widths represent raw data density. (b) Cumulative VAF distribution as a function of the inverse of the frequency, for all mutations (grey) and antigenic mutations (red) at increasing base death rate, db. The thick line shows the mean of n=100 simulated cumulative distributions, the shaded regions represent ±1 standard deviation around this mean. At very high base death (last panel), the VAF distribution of neoantigens and neutral mutations overlaps as tumours are exclusively immune-escaped and evolve neutrally.
Extended Data Fig. 9. VAF distribution of neoantigens under different selection strengths and antigen-generation probabilities.
Cumulative VAF distribution as a function of the inverse of the frequency, for all mutations (grey) and antigenic mutations (red) at increasing selection strengths (top to bottom) and antigen-generation probability, pa (left to right). The thick line shows the mean of n=100 independently simulated cumulative distributions, the shaded regions represent ±1 standard deviation around this mean.
Supplementary Material
Acknowledgements
This work was supported by the Wellcome Trust (202778/B/16/Z to A.S.; 202778/Z/16/Z to T.A.G.; 105104/Z/14/Z to the Centre for Evolution and Cancer, Institute of Cancer Research; 108861/7/15/7 to R.O.S.; 097319/Z/11/Z to C.P.B.) and Cancer Research UK (A22909 to A.S.; A19771 to T.A.G. supporting E.L.). A.R.A.A. and C.G, and A.S and T.A.G. received support from the US National Institutes of Health National Cancer Institute (grant no. U54CA143970) and (U54 CA217376) respectively. R.O.S. was also supported by the Wellcome Centre for Human Genetics (grant no. 203141/7/16/7). B.W. was supported by the Geoffrey W. Lewis Postdoctoral Training fellowship. L.Z. is supported by the European Union’s Horizon 2020 research and innovation programme under the Marie Skłodowska-Curie Research Fellowship scheme (846614).
Footnotes
Author Contributions
E.L., A.R.A.A., A.S. and T.A.G. conceptualized the study. A.R.A.A., A.S and T.A.G. acquired funding for the project. E.L., A.S. and T.A.G. led the investigation, analysed data, and wrote the original manuscript. E.L., M.J.W., W.C.H.C., B.W., R.O.S., C.G., J.H., L.Z., M.R.T., and C.P.B. contributed to the mathematical model, computational framework and bioinformatics analysis. All authors reviewed and approved the final manuscript.
Competing Interests
The authors declare no competing interests.
Data Availability
The datasets analyzed during the current study are available from the NCI Genomics Data Commons Portal (https://portal.gdc.cancer.gov) COAD, READ, STAD and UCEC domains, and from the European Genome-Phenome Archive (https://ega-archive.org/) at accession code: EGAS00001003066.
Code Availability
Julia (https://julialang.org/, version 0.5+) code implementing simulations of the tumor growth model is available from Zenodo (doi: 10.5281/zenodo.3601322)61.
References
- 1.Schumacher TN, Schreiber RD. Neoantigens in cancer immunotherapy. Science (80-) 2015;348:69. doi: 10.1126/science.aaa4971. [DOI] [PubMed] [Google Scholar]
- 2.Lu Y-C, Robbins PF. Cancer immunotherapy targeting neoantigens. Semin Immunol. 2016;28:22–27. doi: 10.1016/j.smim.2015.11.002. [DOI] [PMC free article] [PubMed] [Google Scholar]
- 3.Galon J, et al. Towards the introduction of the ‘Immunoscore’ in the classification of malignant tumours. J Pathol. 2014;232:199–209. doi: 10.1002/path.4287. [DOI] [PMC free article] [PubMed] [Google Scholar]
- 4.Sharma P, Allison JP. The future of immune checkpoint therapy. Science (80-) 2015;348:56–61. doi: 10.1126/science.aaa8172. [DOI] [PubMed] [Google Scholar]
- 5.Larkin J, et al. Combined Nivolumab and Ipilimumab or Monotherapy in Untreated Melanoma. N Engl J Med. 2015;373:23–34. doi: 10.1056/NEJMoa1504030. [DOI] [PMC free article] [PubMed] [Google Scholar]
- 6.Milo I, et al. The immune system profoundly restricts intratumor genetic heterogeneity. Sci Immunol. 2018;3:eaat1435. doi: 10.1126/sciimmunol.aat1435. [DOI] [PubMed] [Google Scholar]
- 7.Dunn GP, Bruce AT, Ikeda H, Old LJ, Schreiber RD. Cancer immunoediting: from immunosurveillance to tumor escape. Nat Immunol. 2002;3:991–998. doi: 10.1038/ni1102-991. [DOI] [PubMed] [Google Scholar]
- 8.DuPage M, Mazumdar C, Schmidt LM, Cheung AF, Jacks T. Expression of tumour-specific antigens underlies cancer immunoediting. Nature. 2012;482:405–409. doi: 10.1038/nature10803. [DOI] [PMC free article] [PubMed] [Google Scholar]
- 9.Williams MJ, Werner B, Barnes CP, Graham TA, Sottoriva A. Identification of neutral tumor evolution across cancer types. Nat Genet. 2016;48:238–244. doi: 10.1038/ng.3489. [DOI] [PMC free article] [PubMed] [Google Scholar]
- 10.Koebel CM, et al. Adaptive immunity maintains occult cancer in an equilibrium state. Nature. 2007;450:903–907. doi: 10.1038/nature06309. [DOI] [PubMed] [Google Scholar]
- 11.Hanahan D, Weinberg RA. Hallmarks of Cancer: The Next Generation. Cell. 2011;144:646–674. doi: 10.1016/j.cell.2011.02.013. [DOI] [PubMed] [Google Scholar]
- 12.Koebel CM, et al. Adaptive immunity maintains occult cancer in an equilibrium state. Nature. 2007;450:903. doi: 10.1038/nature06309. EP- [DOI] [PubMed] [Google Scholar]
- 13.Marty R, et al. MHC-I Genotype Restricts the Oncogenic Mutational Landscape. Cell. 2017;171:1272–1283 e15. doi: 10.1016/j.cell.2017.09.050. [DOI] [PMC free article] [PubMed] [Google Scholar]
- 14.Rosenthal R, et al. Neoantigen-directed immune escape in lung cancer evolution. Nature. 2019;567:479–485. doi: 10.1038/s41586-019-1032-7. [DOI] [PMC free article] [PubMed] [Google Scholar]
- 15.Yarchoan M, Johnson BA, III, Lutz ER, Laheru DA, Jaffee EM. Targeting neoantigens to augment antitumour immunity. Nat Rev Cancer. 2017;17:209–222. doi: 10.1038/nrc.2016.154. [DOI] [PMC free article] [PubMed] [Google Scholar]
- 16.Rizvi NA, et al. Mutational landscape determines sensitivity to PD-1 blockade in non--small cell lung cancer. Science (80-) 2015;348:124–128. doi: 10.1126/science.aaa1348. [DOI] [PMC free article] [PubMed] [Google Scholar]
- 17.Lennerz V, et al. The response of autologous T cells to a human melanoma is dominated by mutated neoantigens. Proc Natl Acad Sci U S A. 2005;102:16013–16018. doi: 10.1073/pnas.0500090102. [DOI] [PMC free article] [PubMed] [Google Scholar]
- 18.Le DT, et al. Mismatch repair deficiency predicts response of solid tumors to PD-1 blockade. Science (80-) 2017;357:409–413. doi: 10.1126/science.aan6733. [DOI] [PMC free article] [PubMed] [Google Scholar]
- 19.Łuksza M, et al. A neoantigen fitness model predicts tumour response to checkpoint blockade immunotherapy. Nature. 2017;551:517–520. doi: 10.1038/nature24473. [DOI] [PMC free article] [PubMed] [Google Scholar]
- 20.Balachandran VP, et al. Identification of unique neoantigen qualities in long-term survivors of pancreatic cancer. Nature. 2017;551:512. doi: 10.1038/nature24462. [DOI] [PMC free article] [PubMed] [Google Scholar]
- 21.Gibney GT, Weiner LM, Atkins MB. Predictive biomarkers for checkpoint inhibitor-based immunotherapy. Lancet Oncol. 2016;17:e542–e551. doi: 10.1016/S1470-2045(16)30406-5. [DOI] [PMC free article] [PubMed] [Google Scholar]
- 22.Turajlic S, Sottoriva A, Graham T, Swanton C. Resolving genetic heterogeneity in cancer. Nat Rev Genet. 2019;20:404–416. doi: 10.1038/s41576-019-0114-6. [DOI] [PubMed] [Google Scholar]
- 23.Williams MJ, et al. Quantification of subclonal selection in cancer from bulk sequencing data. Nat Genet. 2018;50:895–903. doi: 10.1038/s41588-018-0128-6. [DOI] [PMC free article] [PubMed] [Google Scholar]
- 24.Ostrow SL, Barshir R, DeGregori J, Yeger-Lotem E, Hershberg R. Cancer Evolution Is Associated with Pervasive Positive Selection on Globally Expressed Genes. PLOS Genet. 2014;10:e1004239. doi: 10.1371/journal.pgen.1004239. [DOI] [PMC free article] [PubMed] [Google Scholar]
- 25.Martincorena I, et al. Universal Patterns of Selection in Cancer and Somatic Tissues. Cell. 2017;171:1029–1041 e21. doi: 10.1016/j.cell.2017.09.042. [DOI] [PMC free article] [PubMed] [Google Scholar]
- 26.Temko D, Tomlinson IPM, Severini S, Schuster-Böckler B, Graham TA. The effects of mutational processes and selection on driver mutations across cancer types. Nat Commun. 2018;9 doi: 10.1038/s41467-018-04208-6. 1857. [DOI] [PMC free article] [PubMed] [Google Scholar]
- 27.Cannataro VL, Gaffney SG, Townsend JP. Effect Sizes of Somatic Mutations in Cancer. JNCI J Natl Cancer Inst. 2018;110:1171–1177. doi: 10.1093/jnci/djy168. [DOI] [PMC free article] [PubMed] [Google Scholar]
- 28.Williams MJ, et al. Measuring the distribution of fitness effects in somatic evolution by combining clonal dynamics with dN/dS ratios. Elife. 2020;9:e48714. doi: 10.7554/eLife.48714. [DOI] [PMC free article] [PubMed] [Google Scholar]
- 29.Cvijović I, Good BH, Desai MM. The Effect of Strong Purifying Selection on Genetic Diversity. Genetics. 2018;209:1235. doi: 10.1534/genetics.118.301058. [DOI] [PMC free article] [PubMed] [Google Scholar]
- 30.Good BH, Walczak AM, Neher RA, Desai MM. Genetic Diversity in the Interference Selection Limit. PLOS Genet. 2014;10:e1004222. doi: 10.1371/journal.pgen.1004222. [DOI] [PMC free article] [PubMed] [Google Scholar]
- 31.Neher RA, Hallatschek O. Genealogies of rapidly adapting populations. Proc Natl Acad Sci U S A. 2013;110:437–442. doi: 10.1073/pnas.1213113110. [DOI] [PMC free article] [PubMed] [Google Scholar]
- 32.Charlesworth B, Morgan MT, Charlesworth D. The effect of deleterious mutations on neutral molecular variation. Genetics. 1993;134:1289–1303. doi: 10.1093/genetics/134.4.1289. [DOI] [PMC free article] [PubMed] [Google Scholar]
- 33.Haigh J. The accumulation of deleterious genes in a population—Muller’s Ratchet. Theor Popul Biol. 1978;14:251–267. doi: 10.1016/0040-5809(78)90027-8. [DOI] [PubMed] [Google Scholar]
- 34.Kessler DA, Levine H. Scaling solution in the large population limit of the general asymmetric stochastic Luria-Delbrück evolution process. J Stat Phys. 2015;158:783–805. doi: 10.1007/s10955-014-1143-3. [DOI] [PMC free article] [PubMed] [Google Scholar]
- 35.Antal T, Krapivsky PL. Exact solution of a two-type branching process: models of tumor progression. J Stat Mech Theory Exp. 2011;2011 P08018. [Google Scholar]
- 36.Vinay DS, et al. Immune evasion in cancer: Mechanistic basis and therapeutic strategies. Semin Cancer Biol. 2015;35:S185–S198. doi: 10.1016/j.semcancer.2015.03.004. [DOI] [PubMed] [Google Scholar]
- 37.McGranahan N, et al. Allele-Specific HLA Loss and Immune Escape in Lung Cancer Evolution. Cell. 2017;171:1259–1271 e11. doi: 10.1016/j.cell.2017.10.001. [DOI] [PMC free article] [PubMed] [Google Scholar]
- 38.Kather JN, Halama N, Jaeger D. Genomics and emerging biomarkers for immunotherapy of colorectal cancer. Semin Cancer Biol. 2018;52:189–197. doi: 10.1016/j.semcancer.2018.02.010. [DOI] [PubMed] [Google Scholar]
- 39.Shukla SA, et al. Comprehensive analysis of cancer-associated somatic mutations in class I HLA genes. Nat Biotechnol. 2015;33:1152–1158. doi: 10.1038/nbt.3344. [DOI] [PMC free article] [PubMed] [Google Scholar]
- 40.Schenck RO, Lakatos E, Gatenbee C, Graham TA, Anderson ARA. NeoPredPipe: high-throughput neoantigen prediction and recognition potential pipeline. BMC Bioinformatics. 2019;20:264. doi: 10.1186/s12859-019-2876-4. [DOI] [PMC free article] [PubMed] [Google Scholar]
- 41.Grasso CS, et al. Genetic mechanisms of immune evasion in colorectal cancer. Cancer Discov. 2018;8:730–749. doi: 10.1158/2159-8290.CD-17-1327. [DOI] [PMC free article] [PubMed] [Google Scholar]
- 42.Xie T, et al. A Comprehensive Characterization of Genome-Wide Copy Number Aberrations in Colorectal Cancer Reveals Novel Oncogenes and Patterns of Alterations. PLoS One. 2012;7:e42001. doi: 10.1371/journal.pone.0042001. [DOI] [PMC free article] [PubMed] [Google Scholar]
- 43.McGranahan N, et al. Clonal neoantigens elicit T cell immunoreactivity and sensitivity to immune checkpoint blockade. Science (80-) 2016;351:1463–1469. doi: 10.1126/science.aaf1490. [DOI] [PMC free article] [PubMed] [Google Scholar]
- 44.Cross W, et al. The evolutionary landscape of colorectal tumorigenesis. Nat Ecol Evol. 2018;2:1661–1672. doi: 10.1038/s41559-018-0642-z. [DOI] [PMC free article] [PubMed] [Google Scholar]
- 45.Riaz N, et al. Tumor and Microenvironment Evolution during Immunotherapy with Nivolumab. Cell. 2017;171:934–949 e16. doi: 10.1016/j.cell.2017.09.028. [DOI] [PMC free article] [PubMed] [Google Scholar]
- 46.Anagnostou V, et al. Evolution of Neoantigen Landscape during Immune Checkpoint Blockade in Non-Small Cell Lung Cancer. Cancer Discov. 2017;7:264–276. doi: 10.1158/2159-8290.CD-16-0828. [DOI] [PMC free article] [PubMed] [Google Scholar]
- 47.Kimura M. The Neutral Theory of Molecular Evolution. Cambridge University Press; 1983. [DOI] [Google Scholar]
- 48.Stead LF, Sutton KM, Taylor GR, Quirke P, Rabbitts P. Accurately Identifying Low-Allelic Fraction Variants in Single Samples with Next-Generation Sequencing: Applications in Tumor Subclone Resolution. Hum Mutat. 2013;34:1432–1438. doi: 10.1002/humu.22365. [DOI] [PubMed] [Google Scholar]
- 49.Yadav M, et al. Predicting immunogenic tumour mutations by combining mass spectrometry and exome sequencing. Nature. 2014;515:572–576. doi: 10.1038/nature14001. [DOI] [PubMed] [Google Scholar]
- 50.Blomen VA, et al. Gene essentiality and synthetic lethality in haploid human cells. Science (80-) 2015;350:1092–1096. doi: 10.1126/science.aac7557. [DOI] [PubMed] [Google Scholar]
- 51.Van den Eynden J, Basu S, Larsson E. Somatic Mutation Patterns in Hemizygous Genomic Regions Unveil Purifying Selection during Tumor Evolution. PLOS Genet. 2016;12:e1006506. doi: 10.1371/journal.pgen.1006506. [DOI] [PMC free article] [PubMed] [Google Scholar]
- 52.Van den Eynden J, Jiménez-Sánchez A, Miller ML, Larsson E. Lack of detectable neoantigen depletion signals in the untreated cancer genome. Nat Genet. 2019;51:1741–1748. doi: 10.1038/s41588-019-0532-6. [DOI] [PMC free article] [PubMed] [Google Scholar]
- 53.Rooney MS, Shukla SA, Wu CJ, Getz G, Hacohen N. Molecular and genetic properties of tumors associated with local immune cytolytic activity. Cell. 2015;160:48–61. doi: 10.1016/j.cell.2014.12.033. [DOI] [PMC free article] [PubMed] [Google Scholar]
- 54.Werner B, et al. Measuring single cell divisions in human tissues from multi-region sequencing data. Nat Commun. 2020;11 doi: 10.1038/s41467-020-14844-6. 1035. [DOI] [PMC free article] [PubMed] [Google Scholar]
- 55.Alexandrov LB, et al. Signatures of mutational processes in human cancer. Nature. 2013;500:415–421. doi: 10.1038/nature12477. [DOI] [PMC free article] [PubMed] [Google Scholar]
- 56.Zapata L, et al. Negative selection in tumor genome evolution acts on essential cellular functions and the immunopeptidome. Genome Biol. 2018;19:67. doi: 10.1186/s13059-018-1434-0. [DOI] [PMC free article] [PubMed] [Google Scholar]
- 57.Marty Pyke R, et al. Evolutionary Pressure against MHC Class II Binding Cancer Mutations. Cell. 2018;175:e13. doi: 10.1016/j.cell.2018.08.048. [DOI] [PMC free article] [PubMed] [Google Scholar]
- 58.Kim JM, Chen DS. Immune escape to PD-L1/PD-1 blockade: seven steps to success (or failure) Ann Oncol. 2016;27:1492–1504. doi: 10.1093/annonc/mdw217. [DOI] [PubMed] [Google Scholar]
- 59.Sharma P, Hu-Lieskovan S, Wargo JA, Ribas A. Primary, Adaptive, and Acquired Resistance to Cancer Immunotherapy. Cell. 2017;168:707–723. doi: 10.1016/j.cell.2017.01.017. [DOI] [PMC free article] [PubMed] [Google Scholar]
- 60.Iorgulescu JB, Braun D, Oliveira G, Keskin DB, Wu CJ. Acquired mechanisms of immune escape in cancer following immunotherapy. Genome Med. 2018;10:87. doi: 10.1186/s13073-018-0598-2. [DOI] [PMC free article] [PubMed] [Google Scholar]
- 61.Lakatos E. CloneGrowthSimulation. 2020 doi: 10.5281/zenodo.3601322. [DOI] [Google Scholar]
- 62.Gillespie DT. A general method for numerically simulating the stochastic time evolution of coupled chemical reactions. J Comput Phys. 1976;22:403–434. [Google Scholar]
- 63.Grossman RL, et al. Toward a Shared Vision for Cancer Genomic Data. N Engl J Med. 2016;375:1109–1112. doi: 10.1056/NEJMp1607591. [DOI] [PMC free article] [PubMed] [Google Scholar]
- 64.Van Loo P, et al. Allele-specific copy number analysis of tumors. Proc Natl Acad Sci. 2010;107:16910–16915. doi: 10.1073/pnas.1009843107. [DOI] [PMC free article] [PubMed] [Google Scholar]
- 65.The Cancer Genome Atlas Network. Comprehensive molecular characterization of human colon and rectal cancer. Nature. 2012;487:330–337. doi: 10.1038/nature11252. [DOI] [PMC free article] [PubMed] [Google Scholar]
- 66.Kautto EA, et al. Performance evaluation for rapid detection of pan-cancer microsatellite instability with MANTIS. Oncotarget. 2016;8:7452–7463. doi: 10.18632/oncotarget.13918. [DOI] [PMC free article] [PubMed] [Google Scholar]
- 67.Rimmer A, et al. Integrating mapping-, assembly- and haplotype-based approaches for calling variants in clinical sequencing applications. Nat Genet. 2014;46:912–918. doi: 10.1038/ng.3036. [DOI] [PMC free article] [PubMed] [Google Scholar]
- 68.Wang K, Li M, Hakonarson H. ANNOVAR: functional annotation of genetic variants from high-throughput sequencing data. Nucleic Acids Res. 2010;38:e164. doi: 10.1093/nar/gkq603. [DOI] [PMC free article] [PubMed] [Google Scholar]
- 69.Alsaab HO, et al. PD-1 and PD-L1 Checkpoint Signaling Inhibition for Cancer Immunotherapy: Mechanism, Combinations, and Clinical Outcome. Front Pharmacol. 2017;8:561. doi: 10.3389/fphar.2017.00561. [DOI] [PMC free article] [PubMed] [Google Scholar]
- 70.McLaren W, et al. The Ensembl Variant Effect Predictor. Genome Biol. 2016;17:122. doi: 10.1186/s13059-016-0974-4. [DOI] [PMC free article] [PubMed] [Google Scholar]
- 71.Favero F, et al. Sequenza: allele-specific copy number and mutation profiles from tumor sequencing data. Ann Oncol Off J Eur Soc Med Oncol. 2015;26:64–70. doi: 10.1093/annonc/mdu479. [DOI] [PMC free article] [PubMed] [Google Scholar]
- 72.Jurtz V, et al. NetMHCpan-4.0: Improved Peptide--MHC Class I Interaction Predictions Integrating Eluted Ligand and Peptide Binding Affinity Data. J Immunol. 2017;199:3360–3368. doi: 10.4049/jimmunol.1700893. [DOI] [PMC free article] [PubMed] [Google Scholar]
Associated Data
This section collects any data citations, data availability statements, or supplementary materials included in this article.
Supplementary Materials
Data Availability Statement
The datasets analyzed during the current study are available from the NCI Genomics Data Commons Portal (https://portal.gdc.cancer.gov) COAD, READ, STAD and UCEC domains, and from the European Genome-Phenome Archive (https://ega-archive.org/) at accession code: EGAS00001003066.
Julia (https://julialang.org/, version 0.5+) code implementing simulations of the tumor growth model is available from Zenodo (doi: 10.5281/zenodo.3601322)61.


