Abstract
The efficient generation of germinal center (GC) responses requires the directed movement of B cells between distinct microenvironments underpinned by specialized B cell-interacting reticular cells (BRCs). How BRCs are reprogrammed to cater to the developing GC remains unclear and is largely hindered by the incomplete resolution of the cellular composition of the B cell follicle. Here, we utilized the genetic targeting of Cxcl13-expressing cells to define the molecular identity of the BRC landscape. Single-cell transcriptomic analysis revealed that BRC subset specification was predetermined in the primary B cell follicle. Further topological remodeling of light and dark zone follicular dendritic cells required the CXCL12-dependent cross-talk with B cells, and dictated GC output by retaining B cells in the follicle and steering their interaction with follicular helper T cells. Together, our results reveal that poised BRC-defined microenvironments establish a feed-forward system that determines the efficacy of the GC reaction.
Keywords: fibroblastic reticular cells, FRC; follicular dendritic cells, FDC; CXCL13; CXCL12; light zone, LZ; dark zone, DZ; germinal center, GC; B cells; follicular helper T cells; single cell RNA-sequencing
Introduction
The magnitude and quality of germinal center (GC) responses depend on the coordinated movement of B cells between distinct regions of the B cell follicle. Fibroblastic reticular cells (FRCs) stage these microenvironments by secreting a fibrous scaffold and soluble mediators that cater to the interaction of B cells with antigen and follicular helper T cells (TFH). While the mechanisms by which TFH instruct GC B cell-fate decisions are extensively studied1–5, reticular cells have also been shown to orchestrate both innate and adaptive immune responses across lymphoid tissues6–11, including antiviral B cell responses in the lymph node10, protective antibody responses against intestinal helminth infection11 and peritoneal Salmonella infection9. While B cell-interacting reticular cells (BRCs) can influence humoral immunity via the provision of survival factors10,12, concentrating antigen13–15 and establishing chemotactic gradients16,17, surprisingly little is known about the molecular identity of BRC subsets that undergo profound remodeling to accommodate the developing GC.
Follicular dendritic cells (FDCs) specialize in the capture and presentation of antigen, and are the reticular cell type most commonly associated with CXCL13 expression. Upon inflammation, the centrally distributed FDC network of the primary B cell follicle is reorganized to underpin the GC light zone (LZ), and a yet unknown reticular cell type is thought to mature to support the emerging GC dark zone (DZ). CXCL12-expressing reticular cells are suggested to support the DZ, yet this chemokine is predominately expressed in the T cell zone and medullary regions18. T-B border reticular cells co-expressing CXCL12 and the survival factor APRIL were recently proposed to support plasma cells exiting the GC12, making it unclear which CXCL12-expressing cells confine the DZ. Moreover, reticular cells marked by the CD21-Cre spatially overlap with the GC and T-B border19, raising the question as to how DZ reticular cells relate to FDCs. While single-cell transcriptomics have begun to reveal lymph node reticular cell subsets, the resolution of the BRC network remains underpowered20. Elucidating the molecular identity and inflammation-induced remodeling of the GC reticular cell network is critical to understanding the mechanisms by which BRCs govern GC segregation and B cell responses.
Here, we reveal that the Cxcl13-Cre–TdTomato mouse model21 targets all B cell follicle reticular cells and can be used to decipher their cellular composition, inflammation-induced remodeling and function. By combining single-cell RNA sequencing and cell-specific genetic perturbation, we unveil that the molecular identity of LZ and DZ FDC subsets is predetermined in the steady-state and spatially poised in such a manner to optimize B cell-TFH interaction and GC output.
Results
Cxcl13-Cre identifies B cell-interacting reticular cells
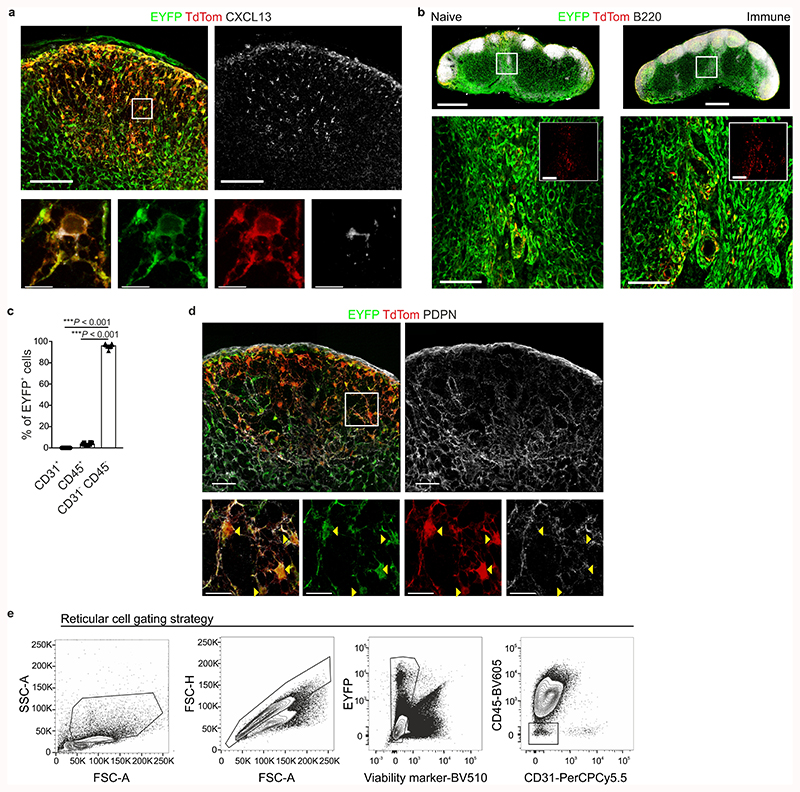
The chemokine CXCL13 orchestrates B cell clustering and follicle formation22. To dissect the cellular composition of reticular cells in the B cell follicle, we employed the Cxcl13-Cre/TdTomato R26R-EYFP (abbreviated as Cxcl13-Cre/TdTom EYFP) mouse model in which TdTomato and Cre recombinase expression are directed by the Cxcl13 promoter and cells that previously expressed or are the progeny of cells having expressed Cxcl13 are permanently marked by EYFP21. Confocal microscopy analysis confirmed the co-localization of CXCL13 protein expression with TdTomato and revealed that TdTomato+ cells were restricted to the areas of B cell accumulation - the B cell follicle and medullary cords (Fig. 1a,b and Extended Data Fig. 1a,b). CXCL13 expression remained confined to B cell areas following immunization with UV-inactivated vesicular stomatitis virus (VSV; Fig. 1c,d). As demonstrated previously21, Cxcl13-Cre transgene expression in lymph nodes was almost exclusively targeted to non-hematopoietic, non-endothelial cells (Extended Data Fig. 1c). High-resolution microscopy analysis revealed that virtually all Cxcl13-Cre-targeted cells expressed podoplanin (PDPN) (Extended Data Fig. 1d), which was confirmed by flow cytometry (Fig. 1e,f). Almost half of all transgene-targeted cells were TdTomato-positive, and TdTomato+ cells included mucosal vascular addressin cell adhesion molecule 1 (MAdCAM1)-positive marginal reticular cells (MRCs) and CD21/35+ FDCs, as well as other cells that could not be further defined based on common reticular cell markers (Fig. 1e-h). MAdCAM1-CD21/35- BRC constituted at least 50% of TdTomato+ cells in both naive and immunized conditions (Fig. 1i-j). Therefore, the Cxcl13-Cre/TdTom EYFP mouse model faithfully demarcates BRCs, and the cellular identity of most CXCL13-expressing reticular cells cannot be resolved with commonly used stromal cell markers.
Figure 1. Cxcl13 expression facilitates tracking of B cell-interacting reticular cells in murine lymph nodes.
a,b, Representative immunofluorescence images of inguinal lymph nodes from naive Cxcl13-Cre/TdTom EYFP+ mice. B220 (a) and IgD (b) immunostainings demarcate the primary B cell follicle. Scale bars, 500 μm (a), 100 μm (b). c,d, Representative immunofluorescence images of inguinal lymph nodes from day 12 VSV-immunized Cxcl13-Cre/TdTom EYFP+ mice. B220 immunostaining demarcates the B cell follicle (c) and IgD immunostaining demarcates the germinal center (d). Scale bars, 500 μm (c), 100 μm (d). e-h, Flow cytometric analysis of Cxcl13-Cre/TdTom transgene-targeted cells from naive (e,g) or day 12 VSV-immunized (f,h) mice. Relative expression levels of the indicated markers by EYFP+ cells from naive (g) and immunized (h) mice. Cells are gated on non-endothelial, non-hematopoietic cells. i, Overlay of TdTom+ EYFP+ subsets as gated in (e) and (g) on tSNE plots of total EYFP+ cells from naive and immunized Cxcl13-Cre/TdTom EYFP mice. j, Quantification of BRC subsets as demarcated by MAdCAM1 and CD21/35 expression in naive and immunized mice. (a-d) Images are representative of at least 10 mice per condition. (e-j) N= 14 naive and 19 VSV-immunized Cxcl13-Cre/TdTom EYFP+ mice, 6 independent experiments. (e,f,j) Mean and SEM are indicated. (j) P values as per one-way ANOVA with Tukey’s multiple comparisons test.
Molecular definition of BRC at a single-cell level
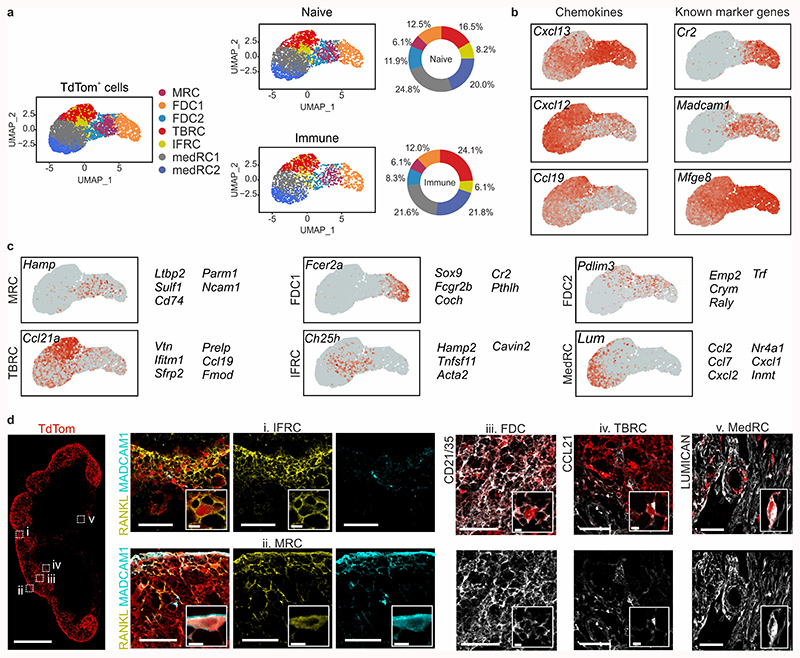
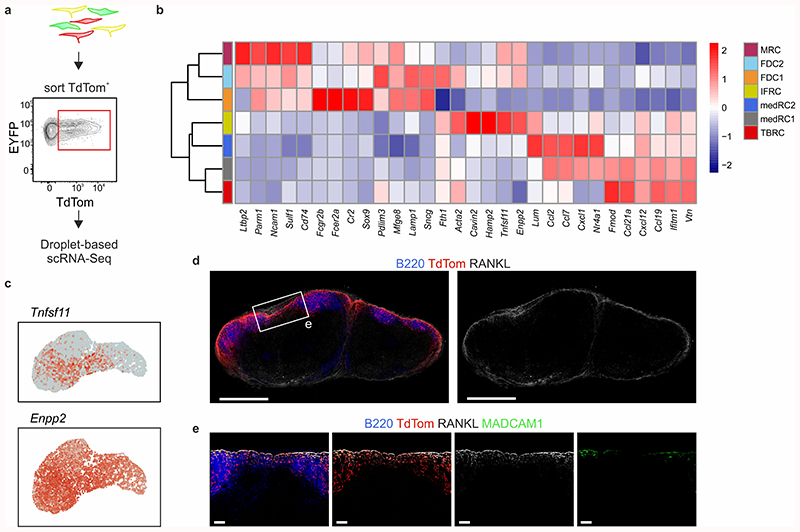
Since Cxcl13-Cre/TdTomato expressing reticular cells are confined to the B cell follicle and medullary cords, we took advantage of TdTomato expression to enrich for and analyze the lymph node BRC transcriptome from naive and VSV-immunized mice by single-cell RNA sequencing (scRNA-seq; Extended Data Fig. 2a). Unsupervised clustering revealed that seven distinct Cxcl13-expressing reticular cell subsets were present in naive and immunized lymph nodes (Fig. 2a). Cxcl13 was expressed in all subsets, but highest in subsets expressing Cr2 and Madcam1. Cxcl12 and Ccl19 transcripts were most abundant in subsets with low Cxcl13 expression, while Mfge8, a putative FDC marker, was highly expressed in all subsets (Fig. 2b). Computation of cluster-specific genes revealed transcriptional signatures consistent with: MRCs (Madcam1, Tnfsf11 – the gene encoding RANKL); two subsets of FDCs sharing high Cr2 gene expression; T-B border reticular cells (TBRCs) expressing Ccl21a, Ccl19, and Fmod; a subset expressing Tnfsf11 and Ch25h; and two subsets of medullary reticular cells (MedRCs) sharing expression of Lum, which encodes the extracellular matrix proteoglycan lumican (Fig. 2c and Extended Data Fig. 2b). Tnfsf11 and Ch25h were recently described to represent MRCs, although Madcam1 was not detected in this subset20. Our single-cell transcriptomic analysis resolved two subsets sharing high Tnfsf11 gene expression: Madcam1-expressing MRCs and Ch25h-expressing interfollicular reticular cells (IFRCs: Fig. 2b,c and Extended Data Fig. 2c). High-resolution microscopy analysis of RANKL and MAdCAM1 expression supported the distinction of two subsets; RANKL+ MAdCAM1+ MRCs were restricted to the B cell follicle, while RANKL+MAdCAM1– IFRCs lined the sub-capsular sinus at sites of lymphatic pervasion between follicles (Fig. 2d and Extended Data Fig. 2d,e). Moreover, the subset assignment of TdTomato+CD21/35+ FDCs, TdTomato+CCL21+ reticular cells at the T-B border and of TdTomato+ lumican+ reticular cells within the medullary cords was validated histologically (Fig. 2d). In sum, enriching for Cxcl13-Cre+ reticular cells enabled the hitherto unprecedented molecular and cellular resolution of the BRC landscape.
Figure 2. Single-cell transcriptomics analysis of lymph node BRC.
a, UMAP of TdTom-expressing lymph node reticular cells. The left-hand panel shows merged data from naive and immunized mice; condition-specific UMAP plots are depicted in the middle panel, and the relative subset abundances are depicted in the right-hand panel. b, Feature plots depicting the gene expression of chemokines and known FDC and MRC markers. c, Feature plots and top subset-specific marker genes for the indicated BRC clusters. d, Confocal microscopy analysis of the positioning and phenotype of BRC subsets in naïve Cxcl13-Cre/TdTom mice. Tissues were stained with the indicated subset-defining markers based on scRNA-seq analysis. Scale bars, 500 μm and 50 μm. Images are representative of at least three mice per marker. (a-c) ScRNA-seq data represents 5418 Cxcl13-Cre+ cells, N = 3 biological replicates, 2 independent experiments for naive BRC, N = 4 biological replicates, 3 independent experiments for BRC from immunized mice.
FDC-specification is predetermined in the naive state
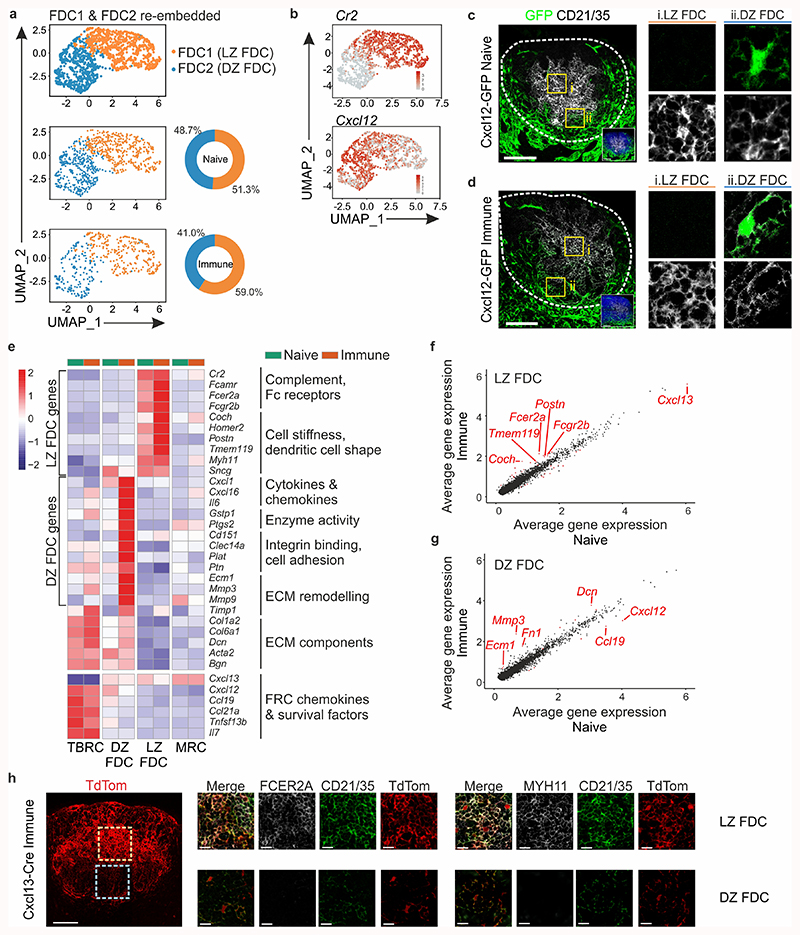
Global BRC transcriptomic analysis revealed that two FDC subsets were present under both naive and immunized conditions. To elucidate the identity of FDC1 and FDC2, we re-embedded these subsets and examined the expression of genes associated with the GC LZ and DZ18 (Fig. 3a,b). Cr2 transcripts were present in both subsets but elevated in FDC1, while FDC2 cells expressed Cxcl12, suggesting that FDC1 and FDC2 are LZ and DZ FDCs, respectively (Fig. 3b). A high-resolution quantification of TdTomato+ CD21/35+ cells by confocal microscopy suggested that the relative number of FDCs increased upon immunization (Extended Data Fig. 3a-c), although transcriptionally, the ratio of FDC1 and FDC2 remained relatively stable in both conditions (Fig. 3a). Since DZ FDCs could not be readily distinguished histologically in Cxcl13-Cre/TdTom EYFP mice, we examined lymph nodes from naive and VSV-immunized Cxcl12-GFP mice, confirming the presence of CD21/35hiGFP– LZ and CD21/35loGFP+ DZ FDC subsets in both conditions (Fig. 3c,d and Extended Data Fig. 3e,f).
Figure 3. Phenotypic adaptations of FDC subsets during infection-induced lymph node remodeling.
a, UMAP plot of re-embedded FDC1 and FDC2 subsets. The relative proportions of FDC1 and FDC2 are summarized in pie charts. Herein, FDC1 and FDC2 are referred to as LZ and DZ FDC, respectively. b, Feature plots of Cr2 and Cxcl12 gene expression in re-embedded FDC subsets. c,d, Representative immunofluorescence images of lymph node B cell follicles from naive or day 12 VSV-immunized Cxcl12-GFP mice. White boxes demarcate the position of GFP- CD21/35+ LZ FDC and GFP+ CD21/35+ DZ FDC; dotted line demarcates the perimeter of the B cell follicle. Scale bars, 100 μm. e, Heatmap of the scaled gene expression of LZ and DZ FDC FDC marker and curated genes including fibroblastic reticular cell (FRC) chemokines and survival factors, and extracellular matrix (ECM) components shown for TBRC, DZ and LZ FDC, and MRC. f,g, Scatterplot of the average scaled gene expression of genes expressed in naive or immunized LZ or DZ FDC subsets. Red dots indicate differentially expressed genes that have an adjusted p-value < 0.01 and an effect size (logFC) > 0.4. h, Confocal microscopy analysis of LZ FDC markers in secondary B cell follicles. Scale bars, 100 μm and 20 μm. Images are representative of five mice per marker in Cxcl13-Cre/TdTom mice. (a,b,e-g) N = 1233 cells. ScRNA-seq data is as per Fig. 2, representative of 3 biological replicates from 2 independent experiments for naive BRC, and 4 biological replicates from 3 independent experiments for BRC from immunized mice. (c,d) Images are representative of 4 naive and 2 VSV-immunized Cxcl12-GFP mice.
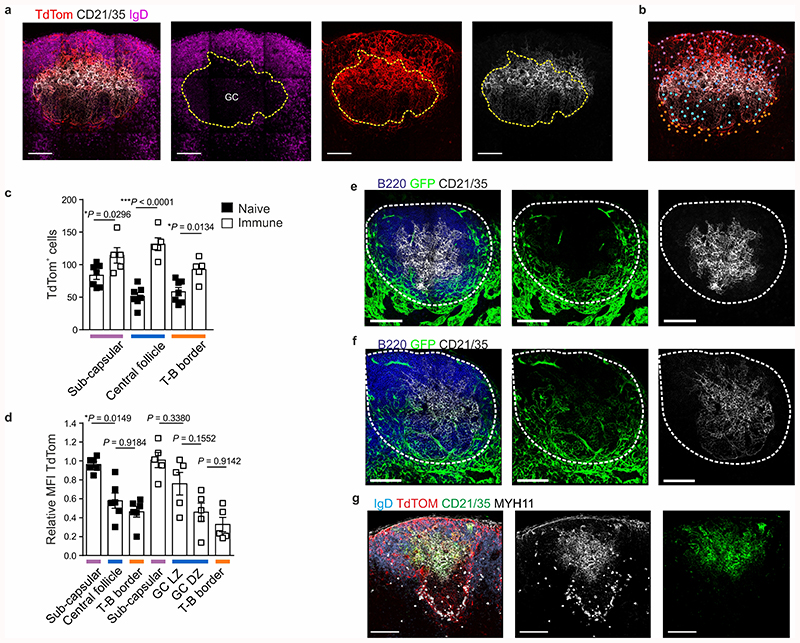
To further dissect the molecular identity of DZ and LZ FDCs in relation to each other and neighboring BRC subsets, we examined the expression of known FDC marker genes, chemokines and genes encoding cell shape, a definitive FDC feature (Fig. 3e). Consistent with histological analyses, LZ FDCs highly expressed Cxcl13 compared to DZ FDCs and TBRCs, but less compared to neighboring MRCs (Fig. 3e and Extended Data Fig. 3d). DZ FDCs expressed low amounts of Cr2 transcript and CD21/35 protein compared to LZ FDCs, and less Cxcl12 compared to TBRCs (Fig. 3c-e). LZ FDCs expressed Fc-binding receptors and genes supporting a dendritic morphology already in the steady-state, and many of these genes were significantly elevated upon inflammation (Fig. 3e,f). DZ FDC expressed low levels of genes encoding for intracellular stiffness and extra-cellular matrix components, exhibiting an intermediate phenotype between LZ FDC and TBRC (Fig. 3e,g). Upon inflammation, DZ FDCs elevated expression of the chemokines Cxcl1, Cxcl16, the cytokine Il6, as well as integrin binding and extracellular matrix remodeling proteins (Fig. 3e,f). Small but significant changes in gene expression of FRC chemokines were observed upon immunization, namely the downregulation of Cxcl13 transcripts in LZ FDCs, and of Cxcl12 and Ccl19 in DZ FDCs (Fig. 3e-g). Nevertheless, the protein expression of CXCL13 and CXCL12 did not appear to reflect marked down-regulation of either chemokine upon immunization (Extended Data Fig. 3d-f). The expression of FcεR2A and MYH11 in LZ but not DZ FDC in secondary B cell follicles was validated by confocal microscopy (Fig. 3h and Extended Data Fig. 3g). Collectively, these results suggest that subset specification of LZ and DZ FDCs is predetermined in the steady-state, yet additional transcriptional and topological maturation accompanies GC formation.
CXCL12 orchestrates BRC topology in the GC
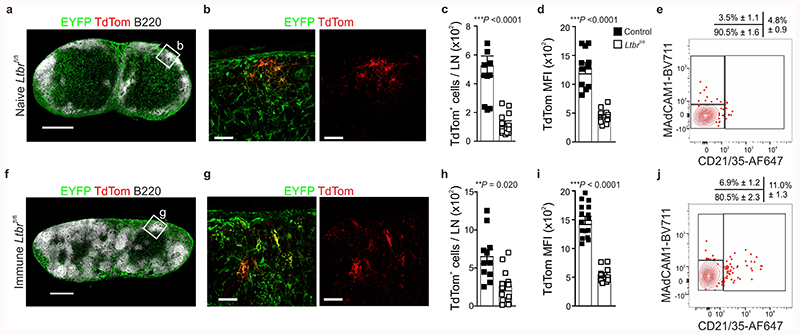
The lymphotoxin-beta receptor (LTβR) signaling pathway critically determines lymphoid tissue development, including reticular cell maturation23,24. To assess the molecular regulation of BRC maturation, we crossed Cxcl13-Cre/TdTom EYFP mice to Ltbr fl/fl mice. Cxcl13-Cre/TdTom EYFP Ltbr fl/fl mice lacked B cell follicles and the few remaining TdTomato+ reticular cells were unable to form a follicular BRC network, demonstrated by significantly lower CXCL13 expression (TdTomato MFI), and failed to mature into FDCs or MRCs (Extended Data Fig. 4a-e). The requirement of LTβR signaling for BRC maturation was not overridden by VSV immunization (Extended Data Fig. 4f-j). Therefore, cell-targeted genetic manipulation of a key regulator of reticular cell maturation is faithfully recapitulated in the Cxcl13-Cre/TdTom EYFP mouse model.
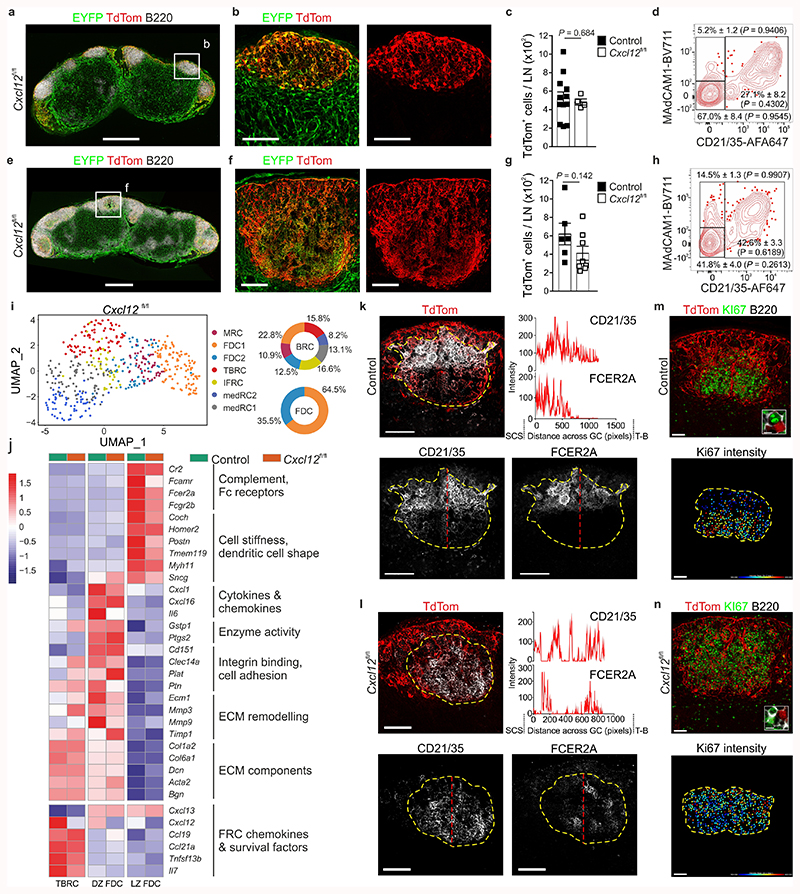
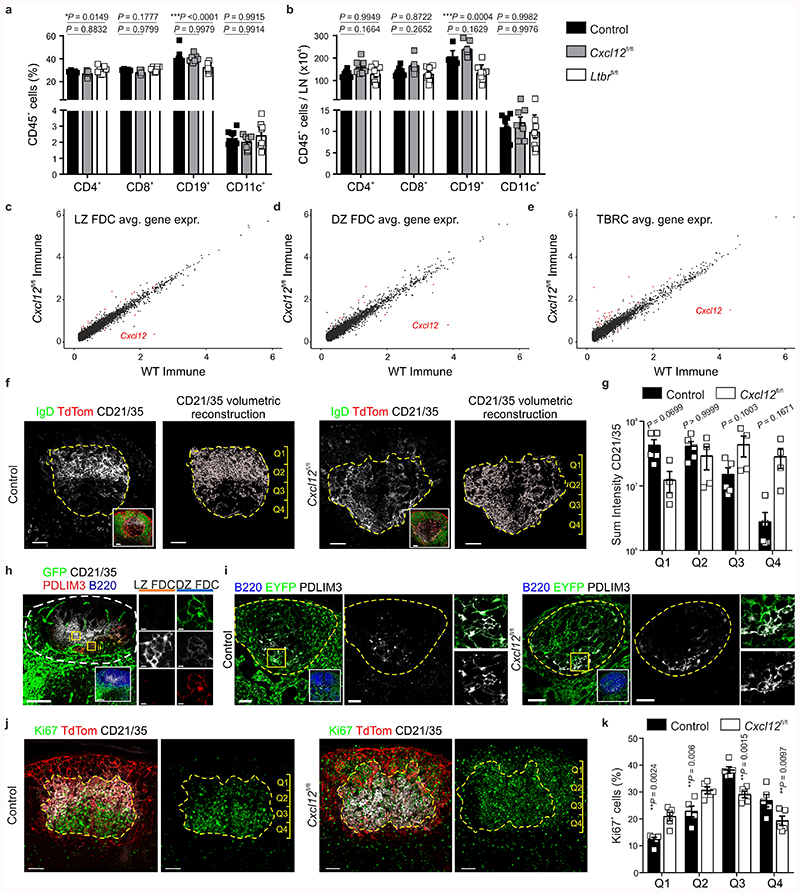
CXCL12 is important for the chemotactic polarization of GC B cells16,25, yet the functional relevance of a poised chemokine gradient in the primary B cell follicle is unclear. To assess this, we genetically ablated Cxcl12 from Cxcl13-Cre-expressing cells by crossing Cxcl13-Cre/TdTom EYFP mice to Cxcl12 fl/fl mice. Naive lymph nodes from Cxcl13-Cre/TdTom EYFP Cxcl12 fl/fl mice demonstrated normal development and hematopoietic cell composition (Fig. 4a and Extended Data Fig. 5a,b), B cell follicle formation (Fig. 4b), TdTomato+ reticular cell numbers and FDC and MRC maturation were unchanged compared to Cxcl13-Cre/TdTom EYFP counterparts (Fig. 4c,d). Following immunization, B cell follicle formation remained intact, yet topological organization of the GC BRC network was markedly altered compared to Cxcl13-Cre/TdTom EYFP mice (Fig. 4e,f). Flow cytometric analysis revealed no significant difference in TdTomato+ cell numbers, or percentage of FDCs and MRCs in Cxcl13-Cre/TdTom EYFP Cxcl12 fl/fl mice compared to controls (Fig. 4g,h). To determine whether the absence of Cxcl12 expression altered the maintenance of FDC subsets, we assessed the molecular identity of TdTomato+ reticular cells from VSV-immunized Cxcl13-Cre/TdTom EYFP Cxcl12 fl/fl mice. All BRC subsets were present in Cxcl12 fl/fl mice (Fig. 4i). Apart from Cxcl12, relatively few genes were differentially expressed within FDC and TBRC subsets between Cxcl12-deficient and Cxcl12-proficient mice (Fig. 4j and Extended Data Fig. 5c-e), suggesting that the altered BRC topology in Cxcl13-Cre/TdTom EYFP Cxcl12 fl/fl mice reflects impaired spatial positioning rather than maturation defects. To investigate the altered BRC topology in Cxcl13-Cre/TdTom EYFP Cxcl12 fl/fl mice, we examined the distribution of LZ FDC markers CD21/35 and FcεR2A by confocal microscopy. In control Cxcl13-Cre/TdTom EYFP mice, a high intensity of CD21/35 immunofluorescence was concentrated in the LZ and decreased progressively along the length of the GC towards the T-B border (Fig. 4k and Extended Data Fig. 5f,g). FcεR2A fluorescence intensity exhibited a similar pattern (Fig. 4k). In contrast, the distribution and fluorescence intensity of CD21/35 were evenly distributed across the GC in Cxcl13-Cre/TdTom EYFP Cxcl12 fl/fl mice; however, FcεR2A remained a reliable marker for LZ FDCs and revealed a dispersal of LZ FDCs throughout the GC in these mice (Fig. 4l and Extended Data Fig. 5f,g). The appearance of CD21/35+FcεR2A– DZ FDCs intermingled throughout the GC is distinct from the collapsed network of CXCL12-expressing cells following pharmacological CXCR4 blockade25.
Figure 4. Transcriptional and topological changes in Cxcl13-Cre/TdTom Cxcl12 fl/fl lymph nodes.
a,b, Representative lymph node (a) and B cell follicle (b) overview in naive Cxcl13-Cre/TdTom EYFP Cxcl12 fl/fl mice (Cxcl12 fl/fl). Scale bars, 500 μm (a), 100 μm (b). N = 4. c, TdTom+ cell enumeration in naive Cxcl13-Cre/TdTom EYFP control or Cxcl12 fl/fl mice. N = 12 control Cxcl13-Cre/TdTom EYFP mice and 4 Cxcl12 fl/fl mice, 2 independent experiments. d, Representative flow cytometry plot of MAdCAM1 and CD21/35 expression by TdTom+ cells from naive Cxcl12 fl/fl mice. N = 12 Cxcl12 fl/fl mice, 3 independent experiments. e,f, Representative lymph node (e) and B cell follicle (f) overview from VSV-immunized Cxcl12 fl/fl mice. Scale bars, 500 μm (e), 100 μm (f). N = 8 mice, 3 independent experiments. g, TdTom+ cell enumeration in immunized control or Cxcl12 fl/fl mice. N = 6 control, 8 Cxcl12 fl/fl mice, 2 independent experiments. h, Representative flow cytometry plot of MAdCAM1 and CD21/35 expressing BRCs from immunized Cxcl12 fl/fl mice. N = 9 Cxcl12 fl/fl mice, 2 independent experiments. i, UMAP plot and relative BRC subset abundance of TdTom+ cells from immunized Cxcl12 fl/fl mice. j, Scaled gene expression of FDC marker and curated genes in immunized control and Cxcl12 fl/fl mice. k,l, Representative images of CD21/35 and FCER2A in control and Cxcl12 fl/fl mice. Dotted yellow lines indicate the GC perimeter and dotted red lines indicate the axis of CD21/35 and FCER2A intensity measurement. Scale bars, 100 μm. m,n, Representative images of Ki67+ B220+ cells in control or Cxcl12 fl/fl mice. Scale bars, 50 μm. (c,g) Mean percentages and SEM are indicated; P values as per two-tailed Mann Whitney Test. (d,h) Mean percentages and SEM are indicated; P values as per one-way ANOVA with Tukey’s multiple comparisons test. (i,j) scRNA-Seq represents 487 Cxcl12 fl/fl BRC; 3 independent experiments. (k-n) Images are representative of 5 mice per group.
To rule out that DZ FDCs were already displaced in primary follicles of Cxcl12 fl/fl mice, we examined the positioning of PDLIM3+ cells, a marker of DZ FDCs identified in the scRNA-Seq analysis. In both naïve CXCL12-GFP and Cxcl13-Cre/TdTom EYFP mice, PDLIM3-expressing cells were localized to the lower portion of the B cell follicle (Extended Data Fig. 5h,i). Similar positioning of PDLIM3+ cells was observed in primary follicles of Cxcl13-Cre/TdTom EYFP Cxcl12 fl/fl mice (Extended Data Fig. 5i), suggesting that topological disorganization occurred with inflammation. We reasoned that the CXCL12-dependent topological remodeling of the GC was most likely mediated through the interaction with CXCR4+ GC B cells. Thus, we examined the spatial distribution and fluorescence intensity of Ki67, which served as a proxy for proliferating GC B cells. While Ki67hi cells were enriched in the GC DZ of control mice, Ki67hi cells were interspersed throughout the GC of Cxcl13-Cre/TdTom EYFP Cxcl12 fl/fl mice (Fig. 4m,n and Extended Data Fig. 5j,k). Taken together, these observations suggest that the topological remodeling of the BRC network in the GC is mediated by a CXCL12-dependent crosstalk between B cells and reticular cells.
BRC maturation and positioning determine GC efficacy
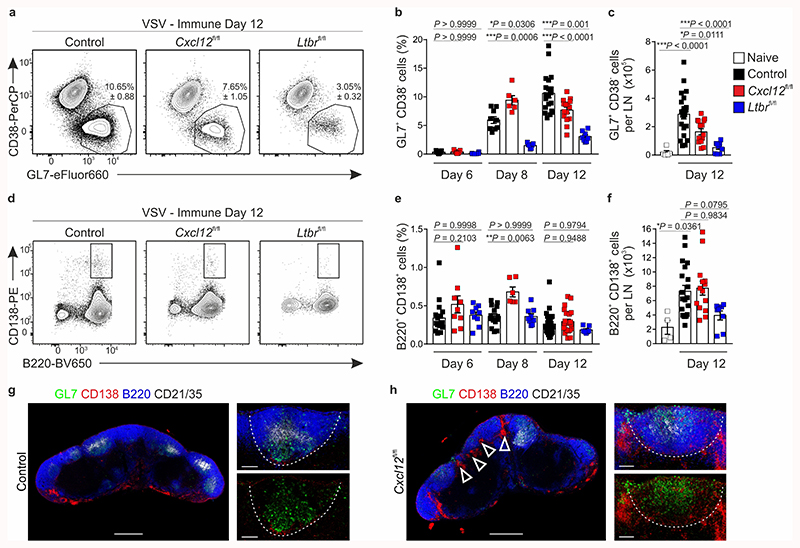
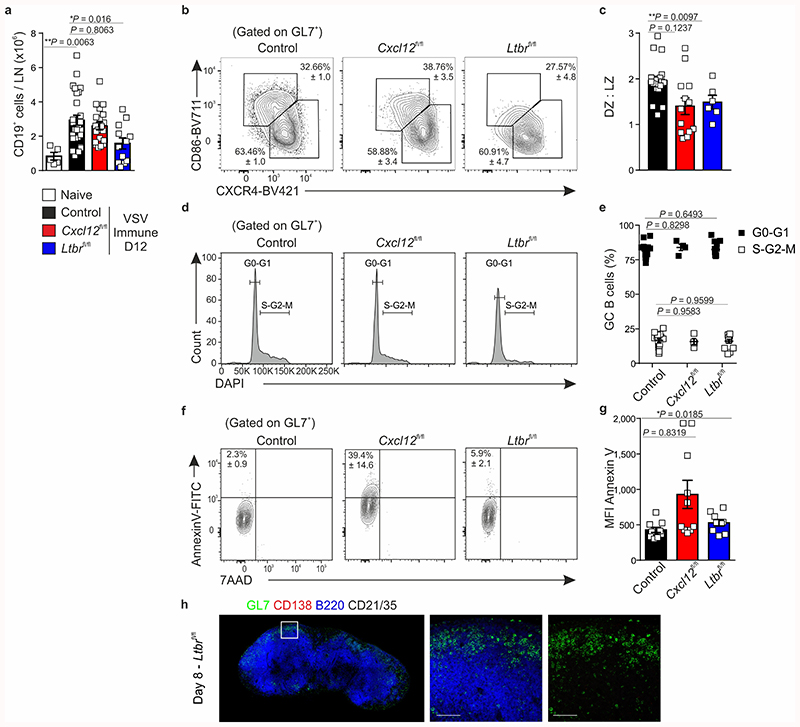
Since Cxcl13-Cre/TdTom EYFP Cxcl12 fl/fl mice demonstrated a perturbed positioning of LZ and DZ FDCs in the GC, we sought to use this setting to examine how BRC topology impacts on GC output. To benchmark the most extreme conditions of impaired BRC maturation, we included Cxcl13-Cre/TdTom EYFP Ltbr fl/fl mice. Flow cytometric analysis of the GC response in control mice revealed that GL7+CD38– GC B cells expand between days 6 and 8 and their frequency peaks on day 12-post immunization. In contrast, the frequency of GC B cells in Cxcl13-Cre/TdTom EYFP Cxcl12 fl/fl mice peaked on day 8 but collapsed early, resulting in a two-fold reduction in GC B cell numbers on day 12, despite equal numbers of CD19+ cells (Fig. 5a-c and Extended Data Fig. 6a). Both the frequency and number of GC B cells were further attenuated in Cxcl13-Cre/TdTom EYFP Ltbr fl/fl mice (Fig. 5a-c). Of the GC B cells that were present in Cxcl12 fl/fl and Ltbr fl/fl mice, the proportion of DZ B cells was underrepresented compared to controls (Extended Data Fig. 6b,c). Although no differences in cell-cycle state were observed (Extended Data Fig. 6d,e), the percentage of apoptotic B cells was increased in Cxcl12 fl/fl mice compared to controls (Extended Data Fig. 6f,g).
Figure 5. The magnitude of germinal center B cell responses is attenuated in mice with Ltbr or Cxcl12 deficiency in Cxcl13-Cre+ cells.
a, Representative flow cytometric plots of GL7 and CD38 expression on CD19+ cells from day 12 VSV-immunized littermate control, Cxcl13-Cre/TdTom Cxcl12 fl/fl mice (Cxcl12 fl/fl), or Cxcl13-Cre/TdTom Ltbr fl/fl (Ltbr fl/fl) mice. b, Quantification of the frequency of GL7+CD38+CD19+ cells from control, Cxcl12 fl/fl or Ltbr fl/fl mice at the indicated time points. c, Enumeration of GL7+CD38+CD19+ cells per lymph node (LN). d, Representative flow cytometry plots of CD138 and B220 expression on CD19+ cells. e, Quantification of the frequency of B220+CD138+CD19+ cells from control, Cxcl12 fl/fl or Ltbr fl/fl mice at the indicated time points. f, Enumeration of B220+CD138+CD19+ cells per LN. g,h, GL7, CD138, B220 and CD21/35 immunostaining in lymph nodes from control or Cxcl12 fl/fl mice on day 8 post immunization. White dotted line indicates follicle boundaries, arrows point to extra-follicular CD138+ cells. Scale bars, 500 μm and 100 μm. Images are representative of 6 mice per group, 2 independent experiments. (a-f) Mean and SEM are indicated. (b,c) Naïve: N = 5; Day 6: N = 15 control, 9 Cxcl12 fl/fl, 9 Ltbr fl/fl mice, 3 independent experiments; Day 8: N = 9 control, 6 Cxcl12 fl/fl, 7 Ltbr fl/fl mice, 3 independent experiments; Day 12: N = 20 control mice, 5 independent experiments, 15 Cxcl12 fl/fl mice, 4 independent experiments, 9 Ltbr fl/fl mice, 3 independent experiments. (e,f) Naïve: N = 4; Day 6: N = 15 control, 9 Cxcl12 fl/fl, 9 Ltbr fl/fl mice, 3 independent experiments; Day 8: N = 14 control, 6 Cxcl12 fl/fl, 9 Ltbr fl/fl mice, 3 independent experiments; Day 12: N = 28 control mice, 5 independent experiments, 15 Cxcl12 fl/fl mice, 4 independent experiments, 7 Ltbr fl/fl mice, 3 independent experiments. (b,c,e,f) P values as per one-way ANOVA with Tukey’s multiple comparisons test.
In terms of antibody-secreting cells, the frequency and number of plasmablasts on day 12 were similar across genotypes, although Cxcl13-Cre/TdTom EYFP Cxcl12 fl/fl mice exhibited an increased frequency of CD138+ B220+ plasmablasts on day 8 (Fig. 5d-f). Intrigued by this early spike in GC B cells and plasmablasts in Cxcl13-Cre/TdTom EYFP Cxcl12 fl/fl mice, we examined the distribution of these cells by confocal microscopy. In control mice, GL7+ cells localized to GCs and apart from a few CD138+ cells lining the T-B border, most CD138+ cells accumulated in the medullary cords (Fig. 5g). In contrast, lymph nodes from day 8 Cxcl13-Cre/TdTom EYFP Cxcl12 fl/fl mice exhibited a pronounced inter-follicular accumulation of CD138+ cells (Fig. 5h). Consistent with the absence of defined B cell follicles in Cxcl13-Cre/TdTom EYFP Ltrb fl/fl mice, GL7+ cells were dispersed in a rim around the lymph node and few CD138+ cells were present (Extended Data Fig. 6h).
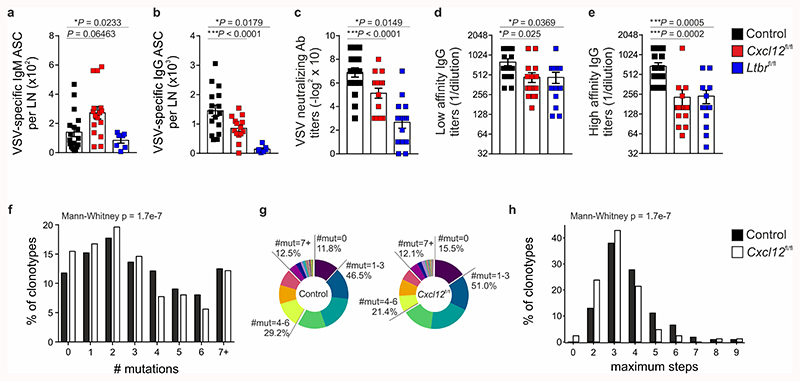
In the immune response to VSV, truncated GC responses, a skewing towards extra-follicular plasmablasts, reduced numbers of antibody-secreting cells and neutralizing titers suggest impaired T cell-dependent help26. To examine whether antigen-specific humoral immunity was dampened in Cxcl13-Cre/TdTom EYFP Cxcl12 fl/fl mice, we determined VSV-specific antibody-secreting cell numbers and serum titers on day 12 post-immunization. Cxcl13-Cre/TdTom EYFP Cxcl12 fl/fl mice exhibited increased numbers of VSV-specific IgM antibody-secreting cells and reduced numbers of class-switched IgG VSV-specific antibody-secreting cells compared to littermate controls. Both IgM and IgG antibody-secreting cell numbers were further attenuated in Cxcl13-Cre/TdTom EYFP Ltbr fl/fl mice (Fig. 6a,b). Neutralizing antibody titers, and total- and high-affinity VSV-specific IgG titers were also significantly reduced in Cxcl12 fl/fl and Ltbr fl/fl mice (Fig. 6c-e). Whereas neutralizing antibodies against VSV can be generated early, somatic hypermutation in activated B cells occurs upon GC formation27. To determine whether the attenuated antibody responses in Cxcl13-Cre/TdTom EYFP Cxcl12 fl/fl mice reflected a defect in somatic hypermutation, we sequenced B cell receptors from littermate control and Cxcl12 fl/fl mice. Somatic hypermutation analysis revealed that GC B cells in Cxcl13-Cre/TdTom EYFP Cxcl12 fl/fl mice harbored fewer mutations compared to B cells from control mice, and tended to have a limited clonal diversity as measured by the number of maximum steps in reconstructed B cell lineage trees (Fig. 6f–h and Extended Data Fig. 7a).
Figure 6. Impaired antigen-specific humoral immunity and somatic hypermutation in mice with Ltbr or Cxcl12 deficiency in Cxcl13-Cre+ cells.
a,b, Enumeration of VSV-specific IgM (a) and IgG (b) antibody secreting cells (ASC) per lymph node (LN) in control, Cxcl12 fl/fl or Ltbr fl/fl mice 12 days following VSV immunization. Mean and SEM are indicated. N = 16 littermate controls over 5 independent experiments, and 14 Cxcl12 fl/fl mice, 7 Ltbr fl/fl mice over 3 independent experiments. c, Quantification of VSV-specific neutralizing antibody titers in the sera of control, Cxcl12 fl/fl or Ltbr fl/fl mice on day 12 following immunization. Mean and SEM are indicated. N = 18 littermate controls, 16 Cxcl12 fl/fl mice, and 15 Ltbr fl/fl mice; 3 independent experiments. d,e, Quantification of low (d) and high (e) VSV-specific IgG serum titers in control, Cxcl12 fl/fl or Ltbr fl/fl mice on day 12 following immunization. Mean and SEM are indicated. N = 16 littermate controls, 17 Cxcl12 fl/fl mice and 13 Ltbr fl/fl mice; 3 independent experiments. f,g, Quantification of the relative abundance of GC B cell clonotypes with the indicated number of mutations for each control and Cxcl12 fl/fl mice, depicted as a histogram (f) and in a pie chart (g). h, Distribution of the relative abundance of GC B cell clonotypes with the indicated maximum number of steps in reconstructed clonal lineages. (a-e) Mean and SEM are indicated. P values as per one-way ANOVA with Tukey’s multiple comparisons test. (f-h) BCR scRNA-seq is representative of 4275 B cell clonotypes from littermate control mice and 3865 clonotypes from Cxcl13-Cre/TdTom EYFP Cxcl12 fl/fl mice. P values as per two-tailed Mann-Whitney.
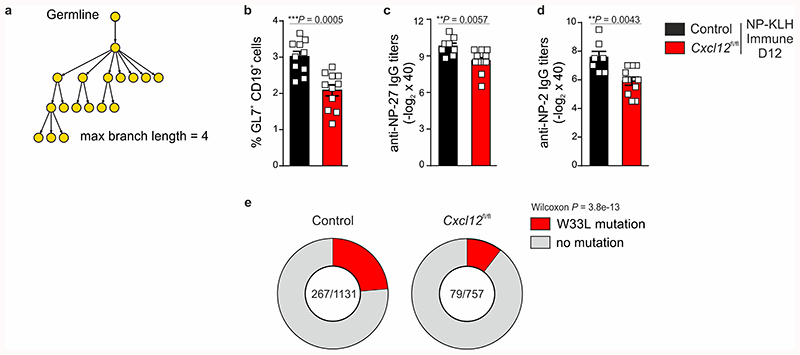
To corroborate our findings with a hapten model, we examined humoral immune responses to 4-hydroxy-3-nitrophenyl acetyl (NP) in control and Cxcl13-Cre/TdTom EYFP Cxcl12 fl/fl mice. On day 12 following NP-KLH immunization, Cxcl13-Cre/TdTom EYFP Cxcl12 fl/fl mice exhibited a reduced frequency of GC B cells in draining inguinal lymph nodes, and attenuated total and high affinity serum IgG antibody titers to NP (Extended Data Fig. 7b-d). Moreover, the proportion of B cells with the high-affinity W33L mutation was reduced in Cxcl13-Cre/TdTom EYFP Cxcl12 fl/fl mice compared to controls (Extended Data Fig. 7e). Collectively, these results suggest that BRC maturation and topology determine the magnitude and efficacy of antigen-specific GC responses to complex protein antigens and haptens by limiting extra-follicular B cell responses and impacting on GC-specific processes, such as somatic hypermutation.
FDC topology steers Tfh – B cell co-operation in the GC
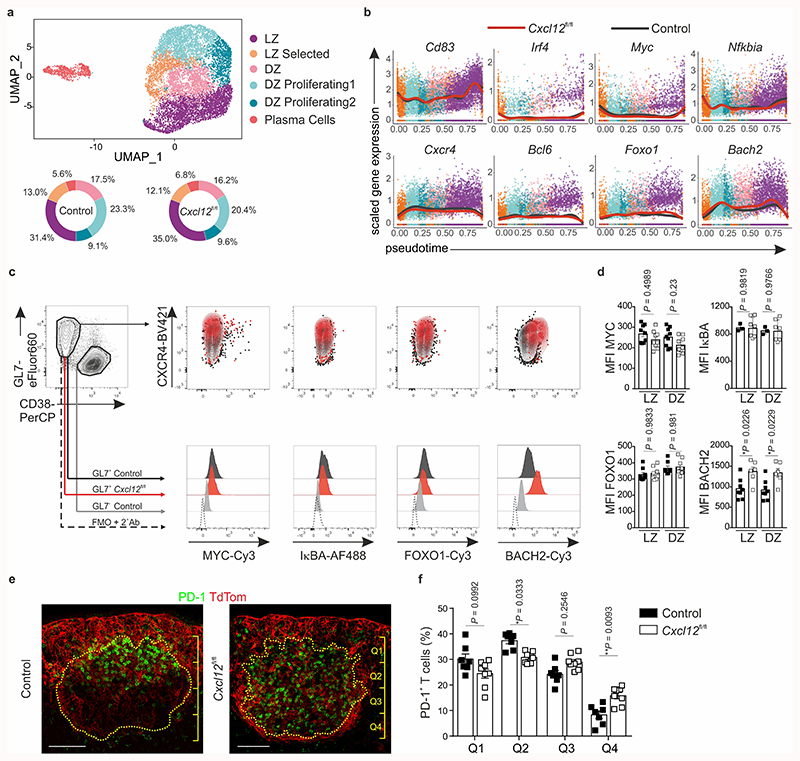
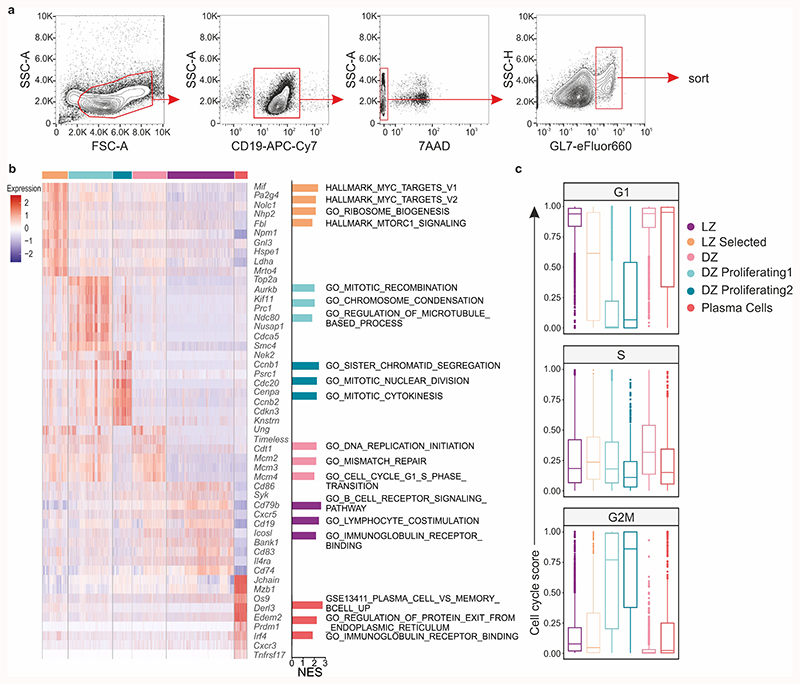
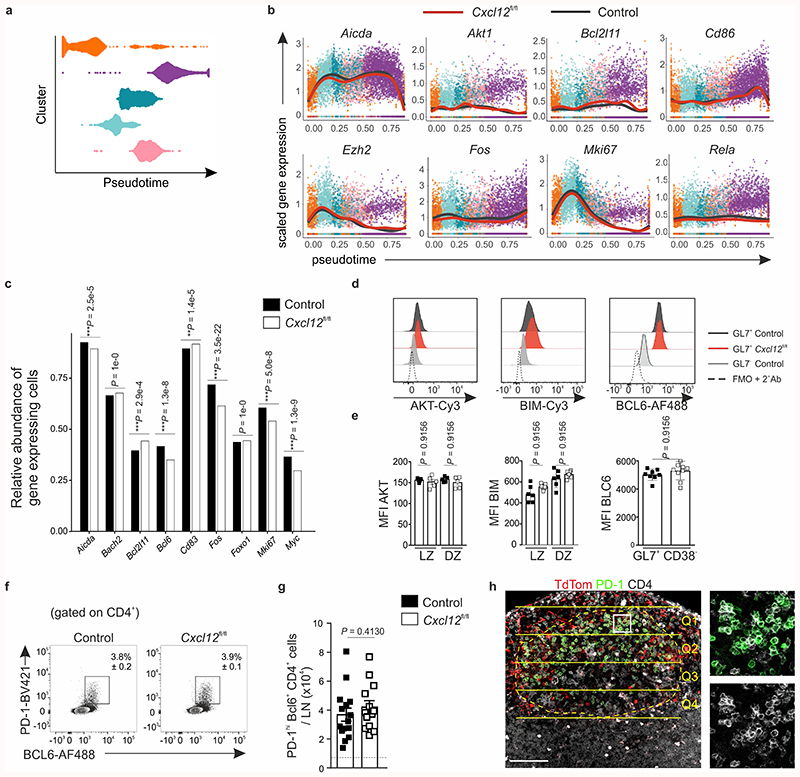
The observed attenuation of selection-dependent processes in Cxcl13-Cre/TdTom EYFP Cxcl12 fl/fl mice led us to query the requirement of CXCL12-dependent topological BRC organization on the transcriptional regulation of GC B cells. To this end, we performed scRNA-seq on sorted GL7+ B cells from VSV-immunized Cxcl13-Cre/TdTom EYFP Cxcl12 fl/fl and littermate control mice (Extended Data Fig. 8a). Unsupervised clustering based on normalized gene expression data elucidated the presence of six clusters that were present in both control and Cxcl12 fl/fl mice (Fig. 7a). Gene expression, gene set enrichment and cell cycle analyses revealed that the identity of these subsets corresponded to different states of the GC cycle: selected LZ B cells bearing Myc activation and ribosome biogenesis signatures28,29; two subsets of proliferating DZ B cells at earlier and later stages of the cell cycle; dark zone B cells in G1 with a mismatch repair gene signature; light zone B cells and a small population of plasma cells (Extended Data Fig. 8b,c). To examine the transcriptional program of GC B cells, we aligned cells in pseudotime (Extended Data Fig. 9a) and analyzed changes in gene expression of known markers corresponding to GC B cell states. GC B cells from both control and Cxcl13-Cre/TdTom EYFP Cxcl12 fl/fl mice demonstrated a similar evolution of gene expression for Cd83, Aicda, Ezh2, Cxcr4 and Mki67, suggesting a similar pseudotime ordering of LZ and DZ GC B cells (Fig. 7b and Extended Data Fig. 9b). Gene expression of key transcriptional regulators of the GC reaction, including Irf4, Bcl6, Myc, Nfkbia, Foxo1, Akt1 and Rela remained similar between control and Cxcl12 fl/fl counterparts, with the exception of Bach2, which appeared to be elevated in GC B cells from Cxcl12 fl/fl mice (Fig. 7b and Extended Data Fig. 9b,c). To determine whether small differences in average gene expression were reflected at the protein level, we validated the expression of these transcriptional regulators by flow cytometry. The abundance of Myc, IκBα, Foxo1, Akt, Bim, and Bcl-6 were unaltered in GC B cells from control and Cxcl12 fl/fl mice (Fig. 7c,d and Extended Data Fig. 9d,e). Nevertheless, BACH2 protein was significantly elevated in Cxcl12-conditionally deficient mice (Fig. 7c,d). Since Bach2 transcript abundance is reported to be inversely proportional to the magnitude of T cell help4, we reasoned that T and B cell interaction might be defective in topologically disrupted GCs. Although the frequency and number of Bcl-6+ PD-1+ CD4+ T cells were unchanged between Cxcl13-Cre/TdTom EYFP Cxcl12 fl/fl and control mice (Extended Data Fig. 9f,g), the positioning of TFH cells was altered in Cxcl13-Cre/TdTom EYFP Cxcl12 fl/fl mice. While in control Cxcl13-Cre/TdTom EYFP mice TFH cells were concentrated in the LZ, TFH cells were homogenously distributed throughout the GC in Cxcl12 fl/fl mice with significantly higher numbers in the quadrants that would correspond to the DZ in Cxcl12-proficient GCs (Fig. 7e,f and Extended Data Fig. 9h). Taken together, these data suggest that the CXCL12-dependent topological organization of LZ and DZ FDCs determines the efficacy of humoral immunity by steering the interaction of B and T cells in the GC.
Figure 7. Effect of Cxcl12-deficiency in Cxcl13-Cre+ cells on germinal center B and Th cells.
a, UMAP plot of GL7+cells from littermate control mice and Cxcl13-Cre/TdTom EYFP Cxcl12 fl/fl mice (Cxcl12 fl/fl) on day 12 following VSV. Pie charts depict the relative abundance of each cluster in control or Cxcl12 fl/fl mice. b, Average gene expression of key GC marker genes along inferred pseudotime for control mice (black line) and Cxcl12 fl/fl mice (red line). c, Representative flow cytometric plots of the indicated transcription factors in GL7+ CD38- GC B cells or GL7- CD38+ non-GC B cells. d, Quantification of the mean fluorescence intensity (MFI) of the indicated transcription factors in CD86+ CXCR4- LZ or CD86- CXCR4+ DZ GC B cells from control (black boxes) or Cxcl12 fl/fl (white boxes) mice. MYC: N = 9 mice per condition; IκBα: N = 3 control and 7 Cxcl12 fl/fl mice, FOXO1: N = 8 control and 9 Cxcl12 fl/fl mice; BACH2: N = 8 control and 6 Cxcl12 fl/fl mice; all over 2 independent experiments. e, Representative immunofluorescence images of PD1 staining within the TdTom-demarcated BRC network in lymph nodes from immunized control or Cxcl12 fl/fl mice. Scale bars, 100 μm. f, Quantification of the relative distribution of PD-1+ cells within the GC of immunized Cxcl13-Cre/TdTom control (black bars) or Cxcl12 fl/fl mice (white bars). Quadrants are counted starting from proximity to the sub-capsular sinus (Q1) to the T cell zone (Q4). N = 7 control Cxcl13-Cre/TdTom EYFP mice, 8 Cxcl12 fl/fl mice; 3 independent experiments. (a,b) scRNA-seq data is representative of 4140 cells from littermate control mice, and 4677 cells from Cxcl12 fl/fl mice; 2 biological replicates over 2 independent experiments. (d,f) Mean and SEM are indicated. (d) P values as per one-way Anova with Tukey’s multiple comparisons test. (f) P values as per two-way Anova with Tukey’s multiple comparisons test.
Discussion
The current view of GC formation predicts that inflammation-induced reticular cell reprograming occurs concomitant with early B cell activation to create on-demand micro-environmental niches that support GC responses. By employing the novel Cxcl13-Cre/TdTom genetic model, we thoroughly dissected the cellular composition of the BRC network and tracked the transcriptional and topological changes that precipitate GC maturation. Our data demonstrate that subset specification is predetermined in the steady-state, and rather than an on-demand evolution of specialized niches upon inflammation, poised BRC micro-environments accommodate GC formation. LZ and DZ FDCs underwent limited transcriptional maturation upon inflammation, and it was predominantly the CXCL12-orchestrated topological BRC remodeling that determined the efficacy of the GC response by limiting extra-follicular B cell responses and coordinating B and TFH cell interaction. Therefore, by isolating and manipulating the reticular cell network using cell-targeted genetic approaches, we revealed a previously unrecognized mechanism that secures efficient humoral immunity.
Our transcriptional and histological analyses demonstrate that primary and secondary B cell follicles are underpinned by MRCs, LZ and DZ FDCs, and TBRCs. LZ FDCs express high levels of complement and Fc-receptors and genes promoting intra-cellular stiffness, consistent with the mechanical properties that support antigen-sampling by GC B cells30. The cells underpinning the DZ are a discrete subset of FDCs that express low levels of Cr2 and exhibit a hybrid phenotype between LZ FDCs and TBRCs. FDC subsets underwent modest transcriptional maturation upon GC formation, with LZ FDCs further upregulating Fc-receptors and DZ FDCs upregulating inflammatory mediators, cell adhesion molecules and extra-cellular matrix remodeling proteins.
In addition to elucidating the molecular identity of reticular cells in primary and secondary B cell follicles, our study points to BRC subset specification and topology as the first order of hierarchy ensuring efficient GC responses. The poised expression of CXCL12 by BRCs ensures the efficacy of early and peak stages of the GC response by limiting extra-follicular GC responses and positioning proliferating cells at the T-B border, which in turn reciprocates on the competent remodeling of the BRC network. Constitutive CXCL13 and CXCL12 gradients extending past the GC may support the continued migration of B cells to the sub-capsular sinus to sample draining antigens as has been shown for memory B cells31, or ensure that recently activated B cells sufficiently engage T cells at the T-B border, a requirement for class-switch recombination32.
The homogenization of CXCL13, CD21/35 and FcεR2a expression in the GC has been previously reported in CXCR4-deficient mice16. Here we reveal that dissolving the topological remodeling of the FDC network by deleting Cxcl12 in Cxcl13-Cre-expressing cells attenuated GC responses by limiting the interaction of B cells with TFH cells. Our observations are at odds with earlier reports noting that LZ-DZ segregation has little impact on the magnitude of the GC response in a mixed Cxcr4-competent and Cxcr4-deficient setting18,33. It is likely that the frequency of GC B cells was not altered under experimental conditions where LZ and DZ spatial separation was intact18 and Cxcr4-deficient B cells could still simultaneously access highly concentrated antigen and TFH. Consistent with observations that the strength of T cell help is an important determinant of the GC response5,34, the displacement of TFH cells following topological BRC disruption effectively reduced their cell concentration in the LZ, mimicking the impaired GC output and affinity maturation predicted by limiting T cell help35. Therefore, by genetically manipulating the topology of LZ and DZ FDCs, our study resolves a long-standing question as to how spatial segregation impacts GC responses.
Taken together, our study unveils a conceptual shift regarding how the topology of the B cell follicle reticular cell network steers efficient GC output. Predetermined, BRC-defined microenvironments establish a feed-forward system that supports the dynamic movement of B cells to engage antigen and cognate T cells and optimize GC responses.
Methods
Mice
The generation of Cxcl13-Cre–TdTomato mice21 and Cxcl12-GFP mice36 was previously described. Cxcl12 fl/fl mice were obtained from Jackson37 and Ltbr fl/fl mice were provided courtesy of T. Hehlgans38. All animals were kept under conventional conditions in individually ventilated cages and experiments were performed with 6-10 week old mice (males and females). Experiments were performed in accordance with Swiss federal and cantonal guidelines (Tierschutzgesetz) under the permissions SG05/17, SG01/18, SG12/16 and SG14/18 granted by the Veterinary Office of the Canton of St. Gallen.
Vesicular stomatitis virus immunization
Mice were immunized subcutaneously in the flanks on day zero with 2 × 10⁷ PFU UV-inactivated VSV and again on day 4 with 5 × 10⁷ PFU UV-inactivated VSV. In all cases, serum and draining inguinal lymph nodes were collected on day 12 post-immunization.
Preparation of lymph node stromal and hematopoietic cells
For stromal cell preparation, lymph nodes were torn into small pieces and collected in RPMI 1640 medium containing 2% FCS, 20 mM HEPES pH 7.2 (Lonza), 0.375 mg/ml Collagenase P (Roche) and 25 μg/ml DNaseI (Applichem). Dissociated tissue was incubated at 37 °C for 60 min, with resuspension and collection of the supernatant every 15 min. Following enzymatic digestion, cell suspensions were filtered and washed with PBS containing 0.5% FCS and 10 mM EDTA. For cell-sorting experiments, stromal cells were enriched by depleting CD45+ hematopoietic cells and TER119+ erythrocytes using MACS microbeads (Miltenyi) as described previously7. Cell suspensions were directly used for staining with antibodies. For isolation of hematopoietic cells, lymph nodes were gently smashed across a 26-gauge wire mesh and washed with PBS. Cell suspensions were directly used for staining with antibodies or for ELISPOT assays.
Immunofluorescence and microscopy
Lymph nodes were fixed for 3-4 h at 19 °C in freshly prepared 4% paraformaldehyde (Merck Millipore) under agitation. Organs mice were embedded in 4% low-melting agarose (Invitrogen) in PBS and serially sectioned with a vibratome (Leica VT-1200). 40-μm thick sections were blocked in PBS containing 10% FCS, 1 mg/ml anti-Fcγ receptor (BD Biosciences) and 0.1% Triton X-100 (Sigma). Tissues were incubated overnight at 4 °C with the following antibodies: anti-GFP (Aves), anti-DsRed (Living Colors), anti-B220, anti-IgD, anti-CD21/35, anti-PD1 (all from Thermo), anti-CD4, anti-Madcam1, anti-FcεR2a, anti-PDPN (BioLegend), anti-CCL21, anti-Lumican, anti-TRANCE, anti-CXCL13 (R&D Systems). Unconjugated or biotinylated antibodies were detected with the following secondary antibodies: Cy3-conjugated anti-rabbit-IgG, AlexaFluor647-conjugated anti-goat IgG, Dylight649-conjugated anti-syrian hamster-IgG, Dylight649-conjugated Streptavidin (all from Jackson Immunotools), or with AlexaFluor488-conjugated anti-chicken-IgG (Invitrogen). All antibodies used for histology are listed in the Life Sciences Reporting Summary. Microscopy was performed using a confocal microscope (LSM-710, Carl Zeiss), and images were recorded and processed with ZEN 2010 software (Carl Zeiss). Imaris Versions 8 and 9 were used for image analysis.
VSV-specific antibody detection
Neutralizing VSV-specific antibody titers in sera were measured as described previously39. Briefly, IgG tiers were determined by incubating sera with 0.1 M 2-mercaptoethanol in PBS for 1 h at 19 °C before dilution. 1:2 dilutions of serum from naive or immunized mice was mixed with 50 PFU VSV in 96-well flat bottom tissue culture plates seeded with Vero cells and incubated for 24 h at 37 °C. Neutralizing titers were taken as the dilution that resulted in a 50% reduction of viral plaques. Affinity assays were performed as described previously40. Briefly, plates (Corning) were coated at either 106 (total IgG) or 104 (high-affinity IgG) PFU of VSV per well. This range of concentrations gave an optimal discrimination between high and low-affinity antibodies in pilot experiments. Total or high-affinity anti-VSV IgG antibody titers are given as 1/dilution. ELISPOT assays were performed following the manufacturer’s instructions (Mabtech AB). Plates coated with 107 PFU VSV were incubated for 24 h at 37 °C with 8 × 10⁶ lymphocytes from lymph nodes of naive or immunized mice. Plates were counted using an ELISPOT reader and analyzed with the software ELISPOT 3.1SR (AID). Values are expressed as the mean number of specific antibody-secreting cells.
NP-KLH immunization and NP-specific antibody detection
Mice were immunized subcutaneously in the flanks on day zero with 50 μg NP-KLH (Biosearch Technologies) emulsified in 100 μl Imject Alum (ThermoScientific). Serum and draining inguinal lymph nodes for flow cytometric analysis were collected on day 12 post-immunization. Affinity assays were performed as described previously29. Briefly, plates (Corning, New York, NY) were coated at with 10 μg/ml of either NP-27-BSA (total) or NP-2-BSA (high-affinity) per well (Biosearch Technologies). Antibody titers are given as –log2 dilution × 40. Positive titers were defined as three standard deviations (SD) above the mean values of the negative controls41.
Flow Cytometry
Cell suspensions were incubated for 20 min at 4 °C in PBS containing 1% FCS and 10 mM EDTA with the following antibodies: anti-CD45, anti-CD31, anti-PDPN, anti-CD21/35, anti-MadCam1, anti-CD19, anti-B220, anti-CD38, anti-GL7, anti-CD86, anti-CD4 (all from BioLegend), anti-PD-1 (BD Biosciences), and anti-CD4 (Thermo Fischer). Biotinylated antibodies were detected with streptavidin conjugated to BV711 (BioLegend). A complete list of antibodies and dilutions used for flow cytometry is provided in the Life Sciences Reporting Summary. For identification of TFH cells, B cell scRNA-Seq validation and cell cycle analysis, cells were fixed and permeabilized using the BD Biosciences mouse FoxP3 fixation and permeabilization set according to the manufacturer’s protocol. For TFH cells, intracellular staining was performed for 30 min at 4 °C using anti-Bcl-6 (BD Biosciences). The following antibodies were used for B cell scRNA-Seq validation: anti-AKT, anti-BIM, anti-FOXO1, anti-IκBα, anti-c-MYC (all from Cell Signaling Technology), and anti-Bach2 (Novus Biologicals). For cell cycle analysis, stained cell suspensions were incubated with 5 mg of RNAse (Sigma) for 30 min at 37 °C, and stained with DAPI (Molecular Probes) for 10 min. For pro-apoptotic cell analysis, AnnexinV–FITC (Biolegend) was added to stained cell suspensions 5 min prior to acquisition as per manufacturer’s instructions. Live/dead cell discrimination was performed either by using a fixable BV510 dead-cell staining kit (Molecular Probes) prior to antibody staining, or by adding 7-amino-actinomycin D (7AAD; Calbiochem) prior to acquisition. Cells were acquired with a LSR Fortessa (BD Biosciences) and analyzed using FlowJo (Version 10) software (Tree Star) following established guidelines42. For cell sorting, cells were sorted with a BioRad S3 Cell Sorter.
Droplet-based single-cell RNA sequencing analysis
Sorted TdTom+ EYFP+ reticular cells or GL7+ germinal center B cells were run using the 10x Chromium (10X Genomics) system43 and cDNA libraries were generated following the manufacturer’s recommendations (Chromium Single Cell 3′ Reagent Kit (v2 Chemistry)). Libraries were sequenced via Hiseq2500 rapid run or NovaSeq 6000 for Illumina sequencing at the Functional Genomic Center Zurich. Initial processing and gene expression estimation were run using CellRanger (v2.1.1;44) with Ensembl GRCm38.90 release as a reference to build index files for alignments. This pre-processing resulted in UMI counts for a total of 12,775 reticular cells and 11,117 B cells. Both datasets were analyzed separately and samples were pooled from multiple replicates from at least two independent experiments (reticular cells: naive Cxcl13-Cre/TdTom EYFP controls - 4 biological replicates, immunized Cxcl13-Cre/TdTom EYFP controls - 3 biological replicates, and immunized Cxcl12 fl/fl mice - 3 biological replicates; B cells: immunized littermate controls - 2 biological replicates, immunized Cxcl13-Cre/TdTom EYFP Cxcl12 fl/fl mice - 2 biological replicates) with batches spanning multiple conditions and all conditions represented by multiple batches. Each biological replicate represents a pool of independent mice. Subsequent quality control was performed using scater R/Bioconductor package (v1.12.2;45) running in R v3.6.0 and comprising the removal of cells with particular high or low UMI counts (more than 2 median absolute deviations from the median across all cells) or a large fraction of mitochondrial genes (more 2 median absolute deviations above the median across all cells). Furthermore, cells expressing the genes Lyve1, Hba-a1, Hba-a2, Krt18, Trac, Cd3d, Cldn5, Ly6c1, Egfl7, Ptprc, S100b, Cd79a, Cd79b or one of the cell cycle markers Top2a, Mki67, Cenpf or Pclaf were excluded from downstream analysis in order to remove contaminating T cells, erythrocytes, endothelial and epithelial cells as well as cycling cells. Samples sorted for B cells were filtered to remove cells expressing Cxcl13, Eyfp or Cd3e and only cells expressing at least one of the genes Cd79a or Cd79b were kept as B cells for downstream analysis. After quality control and removal of contaminants, 5905 reticular cells and 8817 B cells were retained for further processing using the Seurat package (v3.0.2;46). As data was collected and processed in multiple batches (5 batches reticular cells, 2 batches B cells), canonical correlation analysis (cca)43,47 was used to integrate data from different batches by running the following steps as implemented in Seurat: normalization of UMI counts, regression to remove the influence of UMI counts per cell and detection of highly variable genes per batch before data integration using the FindIntegrationAnchors and IntegrateData functions based on the first 9 correlation components (CCs).
Next, dimensional reduction and graph-based clustering were performed based on integrated data and clusters were characterized based on canonical BRC markers and known germinal center and cell cycle markers for B cells. Based on normalized expression values, marker genes for each cluster as well as differentially expressed genes between conditions were inferred by the Wilcoxon test as implemented in the FindMarker function of Seurat and gene signatures were visualized as row-wise scaled expression values using the pheatmap48 package.
Since the transition of GC B cells between different GC states is strongly associated with distinct cell cycle stages34,49, cell cycle scores were computed for each cell using the cyclone function of the scran R/Bioconductor package (v1.12.1:50). Finally, for each B cell cluster ranked gene lists were generated based on a signal-to-noise statistic that was calculated by comparing normalized expression values in cells within the cluster to all cells outside the cluster. Based on these ranked gene list GSEA-preranked was run within the GenePattern Notebook Environment51 to analyze for an enrichment of gene sets from the mSigDB (v6.2) collections C5, C7 and H downloaded from http://bioinf.wehi.edu.au/software/MSigDB/.
Pseudotime inference
Differentiation trajectories for B cell clusters were reconstructed using the slingshot function as implemented in the slingshot R/Bioconductor package (v1.3.1;52) running in R v3.6.1 and B cells were ordered based on the inferred pseudotime. Next, ordered cells were used to plot the expression of known marker genes along pseudotime compare changes between cells from control and Cxcl12 fl/fl samples. The relative abundance of gene expressing cells was calculated based on any expression of the gene on a per-cell basis.
B cell repertoire analysis
Sorted GL7+ CD38– germinal center B cells were run using the 10x Chromium (10X Genomics) System and cDNA libraries were generated following the manufacturer’s recommendations (Chromium Single Cell 5′ Library construction and Mouse B cell V(D)J Enrichment kit (V1.0 Chemistry)). Sequenced files were pre-processed using CellRanger V(D)J (v3.0.2;44) with Ensembl GRCm38 vdj reference provided by 10X Genomics (v2.2.0). For downstream analysis files were converted to Change-O format and analyzed using the Immcantation software suite (Change-O(v0.4.5), TIgGER(v0.4.0), SHazaM (v0.2.1), Alakazam(v0.3.0);53) including following steps: VDJ assignment against germline references from IGMT/GENE_DB using IgBlast, subset to functional and heavy chain sequences, genotyping, clonal diversity analysis and lineage tree construction. In total 4275 functional BCR sequences from littermate control mice and 3865 functional sequences from Cxcl12 fl/fl mice were analyzed for clonal diversity.
The same analysis pipeline was applied for W33L mutation analysis. Sequenced files from GL7+ B cells from NP-KLH immunized mice were pre-processed using CellRanger V(D)J and converted to Change-O format using the Immcantation software suite for VDJ assignment against the IGMT reference database. Sequences were filtered for the mouse germline IGHV1-72*01 allele, which is identical to the NCBI V186.2 gene and is known for the Trp to Leu mutation in codon 33 (W33L). The Alakazam (v.0.3.0) R package from the Immcantation framework was used to count mutations in codon 33 that is numbered aa38. Finally, the proportion of replacement mutations in codon 33 was compared between littermate control and Cxcll2 fl/fl samples.
Topological BRC and TFH analysis
B cell follicles from naïve or VSV-immunized Cxcl13-Cre/TdTom mice and immunized Cxcl13-Cre/TdTom Cxcl12 fl/fl mice were acquired by confocal microscopy at resolutions of approximately 0.115 × 0.115 × 1 μm (z-stacks). Single BRC were detected using the TdTom and EYFP expression and annotated manually using the Spots object generation tool in Imaris. IgD staining was used to demarcate B cell follicle borders and germinal centers in secondary B cell follicles. BRC populations were annotated based on their localization, morphology, TdTom intensity and presence or absence of CD21/35 immunostaining. MRC in the sub-capsular area were defined as TdTomhi CD21/35–, while TdTomlo CD21/35− reticular cells at the T-B border were annotated as TBRCs. In the central follicular area the FDC network was defined by CD21/35 staining, and in secondary B cell follicles LZ and DZ FDC were distinguished as TdTomint CD21/35+ or TdTomlo CD21/35lo cells within the IgD-negative region, respectively. The mean fluorescence intensity (MFI) of the BRC populations in each follicle region was calculated relative to the MFI of MRC in the respective z-stack.
Similarly, PD-1+ TFH cells were detected in equally high-resolution z-stacks from immunized Cxcl13-Cre/TdTom and Cxcl13-Cre/TdTom Cxcl12 fl/fl mice, and annotated manually using the Spots tool in Imaris. IgD staining was used to demarcate the borders of the GC, and each GC was divided into 4 equivalent rectangular quadrants (Q1 – Q4). The percentage of TFH cells in each quadrant was determined from the total number of TFH in the GC per z-stack. Likewise, the percentage of Ki-67+ cells was calculated for each quadrant in 2D from the total number of Ki-67+ in the GCs of immunized Cxcl13-Cre/TdTom and Cxcl13-Cre/TdTom Cxcl12 fl/fl mice.
Statistical analysis
Statistical analysis was performed using GraphPad Prism 7 software employing either an unpaired, two-tailed Mann-Whitney test, or a one-way or two-way analysis of variance (ANOVA) with multiple comparisons post-tests. The statistical methods used are indicated in the figure legends. Statistical significance was defined as P > 0.05.
Extended Data
Extended Data Fig. 1. The Cxcl13-Cre/TdTom transgene faithfully demarcates non-endothelial, non-hematopoietic, CXCL13-expressing cells.
a, Representative immunofluorescence images of EYFP, TdTom, and CXCL13 expression in naive Cxcl13-Cre/TdTom EYFP mice. Scale bars, 100 μm and 10 μm. b, Representative images of TdTom expression in the medullary cords of naive and day 12 VSV-immunized Cxcl13-Cre/TdTom EYFP mice. Scale bars, 500 μm and 100 μm. c, Quantification of the percentage of EYFP+ cells expressing CD31 or CD45 in naive Cxcl13-Cre/TdTom EYFP mice. Mean and SEM are depicted. d, Representative images of EYFP, TdTom and podoplanin (PDPN) expression in naive Cxcl13-Cre/TdTom EYFP mice. Arrows point to the cell body. Scale bars, 50 μm and 20 μm. e, Flow cytometric gating strategy of non-hematopoietic, non-endothelial reticular cells from Cxcl13-Cre/TdTom EYFP mice. (a,b,d) Images are representative of at least five mice. (c,e) N = 8 naive mice, 4 independent experiments; P values as per one-way ANOVA with Tukey’s multiple comparisons test.
Extended Data Fig. 2. Single cell transcriptomic analysis of B cell-interacting reticular cells.
a, Schematic representation of the experimental setup. b, Heatmap of the averaged gene expression of top cluster-specific genes across all BRC subsets. Hierarchical grouping based on cluster-specific marker genes is depicted in the left panel. c, Feature plots depicting the expression of the indicated genes. d, Representative overview of RANKL staining in naïve Cxcl13-Cre/TdTom mouse lymph nodes. e, The indicated interfollicular region from (d) stained for B220, RANKL and MAdCAM1. Images are representative of at least three mice.
Extended Data Fig. 3. Molecular and topological identity of light and dark zone FDC at a single cell level.
a,b, Strategy for demarcating distinct regions of the B cell follicle for topological BRC analysis using positioning, TdTom fluorescence intensity, and IgD and CD21/35 immunostaining. Each dot in (b) represents one cell body, color-coded according to the occupied region in the follicle. Scale bars, 100 μm. c, BRC enumeration per region of B cell follicle. d, Quantification of the mean fluorescence intensity (MFI) of TdTom in each region of the B cell follicle (according to color-code). e,f, Merged images and single channels corresponding to Fig. 3c,d. Scale bars, 100 μm. Images are representative of at least two mice per condition. g, Confocal microscopy analysis of IgD, TdTom, CD21/35 and MYH11 staining in secondary B cell follicles of Cxcl13-Cre/TdTom EYFP mice. Images are representative of at least 5 immunized Cxcl13-Cre/TdTom mice. (c,d). N = 7 naïve Cxcl13-Cre/TdTom mice, 3 independent experiments, N = 5 VSV-immunized Cxcl13-Cre/TdTom mice, 2 independent experiments. Mean and SEM are depicted. P values as per one-way ANOVA with Tukey’s multiple comparisons test.
Extended Data Fig. 4. LTβR signaling in Cxcl13-Cre+ cells governs BRC maturation.
a,b, Representative immunofluorescence images of EYFP, TdTom and B220 staining in lymph nodes (a) and regions underpinning B cell aggregates (b) in naive Cxcl13-Cre/TdTom Ltbr fl/fl mice (Ltbr fl/fl). c, Enumeration of TdTom+ EYFP+ cells per lymph node (LN) in naive Cxcl13-Cre/TdTom control or Ltbr fl/fl mice. d, Quantification of the mean fluorescence intensity (MFI) of TdTom on EYFP+ cells from naive control or Ltbr fl/fl mice. e, Representative flow cytometry plots of MAdCAM1 and CD21/35 on TdTom+ EYFP+ cells from naive Ltbr fl/fl mice. Mean percentages and SEM are indicated. N = 14 mice, 4 independent experiments. f,g, Representative immunofluorescence images of EYFP, TdTom and B220 staining in lymph nodes (f) and regions underpinning B cell aggregates (g) in day 12 VSV-immunized Ltbr fl/fl mice. h, Enumeration of TdTom+ EYFP+ cells per lymph node in immunized control or Ltbr fl/fl mice. i, Quantification of the MFI of TdTom on EYFP+ cells from lymph nodes of immunized control or Ltbr fl/fl mice. j, Representative flow cytometry plots of MAdCAM1 and CD21/35 on TdTom+ EYFP+ cells from immunized Ltbr fl/fl mice. Mean percentages and SEM are indicated. N = 13 Ltbr fl/fl mice, 5 independent experiments. (a,b,f,g) Images are representative of 6 Ltbr fl/fl per condition. (c,d) N = 11 control mice and 13 Ltbr fl/fl mice; 4 independent experiments. (h,i) N = 16 control mice and 11 Ltbr fl/fl mice, 4 independent experiments. (c,d,h,i) Mean and SEM are indicated. P values as per two-tailed Mann Whitney test.
Extended Data Fig. 5. CXCL12 expression in in Cxcl13-Cre+ cells governs BRC topological remodeling.
a,b, Percentage (a) and number (b) per lymph node (LN) of the indicated hematopoietic cell populations in naive Cxcl13-Cre/TdTom control, Cxcl12 fl/fl and Ltbr fl/fl mice. N = 9 control mice, 7 Cxcl12 fl/fl, and 8 Ltbr fl/fl mice; 2 independent experiments. c-e, Scaled gene expression of naive versus immunized LZ FDC (c), DZ FDC (d) or TBRC (e). Red dots indicate differentially expressed genes with an adjusted p-value < 0.01 and an effect size (logFC) > 0.4. f, Left hand panels depict representative images of CD21/35 staining in immunized control and Cxcl12 fl/fl mice. The yellow dotted line demarcates the GC perimeter according to IgD staining (inset). Right hand panels depict the volumetric reconstruction of CD21/35 fluorescence and the division of the GC into quadrants. g, Quantification of the volume of CD21/35 per GC quadrant in control and Cxcl12 fl/fl mice. N = 5 control and 4 Cxcl12 fl/fl mice. Mean and SEM are indicated. h, GFP, CD21/35, PDLIM3 and B220 staining in lymph nodes from naïve Cxcl12-GFP mice. Data is representative of 2 Cxcl12-GFP mice. i, Representative images of PDLIM3, B220 and EYFP in naïve Cxcl13-Cre/TdTom control or Cxcl12 fl/fl mice. N = 3 mice per condition. j, Left hand panels show representative images of Ki67, TdTom and CD21/35 staining in immunized control and Cxcl12 fl/fl mice. The yellow dotted line demarcates the GC perimeter. Right hand panels depict Ki67 staining and the demarcation of GC quadrants. k, Enumeration of Ki67+ cells per GC quadrant in control and Cxcl12 fl/fl mice. N = 5 control and 5 Cxcl12 fl/fl mice. (a,b,g,k) Mean and SEM are indicated. P values as per two-way Anova with Bonferroni multiple comparisons test.
Extended Data Fig. 6. CXCL12 production by Cxcl13-Cre+ cells is required for efficient humoral immunity.
a, Enumeration of CD19+ cells per lymph node (LN) in naive or VSV-immunized control mice, or immunized Cxcl13-Cre/TdTom Cxcl12 fl/fl (Cxcl12 fl/fl) and Cxcl13-Cre/TdTom Ltbr fl/fl (Ltbr fl/fl) mice. N = 5 naive mice; 27 littermate control mice, 5 independent experiments; 20 Cxcl12 fl/fl, 5 independent experiments; 12 Ltbr fl/fl mice, 4 independent experiments. b,c, Representative flow cytometry plots and quantification of CD86- CXCR4+ DZ and CD86+ CXCR4- LZ germinal center CD19+ cells in immunized control, Cxcl12 fl/fl mice or Ltbr fl/fl mice. N = 20 immunized littermate controls, 5 independent experiments; 13 Cxcl12 fl/fl and 9 Ltbr fl/fl mice, 3 independent experiments. d,e, Expression of DAPI in GL7+ B cells and quantification of GC B cells in the indicated cell cycle stages. N = 15 littermate control mice, 3 independent experiments; 4 Cxcl12 fl/fl mice, 2 experiments; 13 Ltbr fl/fl mice, 2 experiments. f, Representative flow cytometry plots of 7AAD and Annexin V incorporation by GL7+ B cells in immunized littermate control, Cxcl12 fl/fl mice or Ltbr fl/fl mice. g, Quantification of the mean fluorescence intensity (MFI) of Annexin V on GL7+ B cells from littermate control, Cxcl12 fl/fl mice or Ltbr fl/fl mice. (f,g) N = 10 littermate control mice, 10 Cxcl12 fl/fl mice and 9 Ltbr fl/fl mice per group; 2 independent experiments. h, GL7, CD138, B220 and CD21/35 staining of lymph nodes from Ltbr fl/fl mice on day 8 post VSV-immunization. Data is representative of 3 Ltbr fl/fl mice. (a,c,e,f,g) Mean and SEM are shown. P values as per one-way Anova with Tukey’s multiple comparisons test.
Extended Data Fig. 7. Cxcl12-proficient Cxcl13-Cre+ cells govern high-affinity humoral immunity to complex protein antigens and haptens.
a, An example of reconstructed clonal lineage trees based on B cell receptor sequencing for the quantification of maximum branch lengths. b, Quantification of the frequency of GL7+ CD19+ cells in draining lymph nodes of littermate control or Cxcl13-Cre/TdTom Cxcl12 fl/fl (Cxcl12 fl/fl) mice 12 day following NP-KLH immunization. N = 10 control mice and 11 Cxcl12 fl/fl mice; 2 independent experiments. c,d, Quantification of total (c) or high-affinity (d) NP-specific serum IgG titers from control or Cxcl12 fl/fl mice 12 days following NP-KLH immunization. N = 8 control mice and 11 Cxcl12 fl/fl mice; 2 independent experiments. e, Quantification of the proportion of GC B cells harboring the high-affinity W33L mutation in control and Cxcl12 fl/fl mice. (b-d) Mean and SEM are shown. P values as per two-tailed Mann-Whitney test. (e) Data is representative of two independent mice per condition; the number of clonotypes is indicated. P values as per two-tailed Wilcoxon test.
Extended Data Fig. 8. ScRNA-Seq of germinal center B cells from VSV immunized mice.
a, Sorting strategy for scRNA-seq of GC B cells. b, Top marker genes for each subset, and normalized expression scores (NES) of top GSEA pathways reflected by each subset’s marker genes. c, Median cell cycle scores. The middle line demarcates the median; box limits demarcate the upper and lower quartiles; whiskers depict the 1.5x interquartile range and points indicate outliers. (b-c) scRNA-seq data is representative of 4140 cells from littermate control mice and 4677 cells from Cxcl12 fl/fl mice; 2 biological replicates over 2 independent experiments.
Extended Data Fig. 9. CXCL12 regulates the gene expression profile of B cells and positioning of TFH within the GC.
a, Pseudotime ordering of GC B cells. Violin plots indicate the density distribution of cells. b, Average gene expression of GC marker genes along inferred pseudotime for littermate control (black line) and Cxcl13-Cre/TdTom Cxcl12 fl/fl (red line) mice. c, The relative abundance of cells expressing the indicated genes in control and Cxcl12 fl/fl mice. d, Representative flow cytometry plots of the indicated markers in GL7+ B cells from littermate control or Cxcl12 fl/fl mice, GL7- non-GC B cells and FMO controls. e, Quantification of the mean fluorescence intensity (MFI) of the indicated markers in CD86+ CXCR4- LZ and CD86- CXCR4+ DZ B cells from control (black boxes) or Cxcl12 fl/fl (white boxes) mice. AKT: N = 5 mice per condition; BIM: N = 6 control and 7 Cxcl12 fl/fl mice; Bcl6: N = 7 control and 9 Cxcl12 fl/fl mice; all over 2 independent experiments. f, Representative flow cytometry plots and mean percentage and SEM of PD-1+ Bcl6+ CD4+ cells in immunized control and Cxcl12 fl/fl mice. g, Enumeration of PD-1+ Bcl6+ CD4+ cells per lymph node (LN) in immunized control or Cxcl12 fl/fl mice. N = 15 control and 13 Cxcl12 fl/fl mice; 3 independent experiments. h, TdTom, PD-1 and CD4 staining in immunized Cxcl13-Cre/TdTom mice. The dotted line demarcates the GC perimeter, which is divided into four quadrants for manual PD-1+ cell enumeration. Scale bar, 100 μm. Images are representative of 2 mice. (a-c) scRNA-seq data is representative of 4140 cells from littermate control mice and 4677 cells from Cxcl12 fl/fl mice; 2 biological replicates over 2 independent experiments. (c) Statistical significance calculated using the Pearson’s Chi-squared test with Bonferroni multiple comparisons test. (e,g) Mean and SEM are shown. (e) P values as per one-way ANOVA with Tukey’s multiple comparisons test. (g) P values as per two-tailed Mann-Whitney.
Supplementary Material
Acknowledgements
This study received financial support from the Swiss National Science Foundation (grants 177208, 166500 and 159188 to B.L, grant 180011 to NP.) and Novartis Foundation for Biomedical Research. The funders had no role in study design, data collection and analysis, decision to publish, or preparation of the manuscript.
Footnotes
Author contributions
B.L. designed the study, discussed data and wrote the paper; N.B.P. designed the study, performed experiments, analyzed data and wrote the paper; U.M., C.G.-C., C.P.-S., M.N., H-W.C. and L.O. performed experiments, analyzed and discussed data; M.L. performed bioinformatics analyses and discussed data; M.A.L. provided reagents and discussed data; C.N.-A. and T.N. provided reagents.
The authors declare no competing interests.
Data availability statement
All scRNA-seq and BCR-seq datasets are available in ArrayExpress (accession numbers: E-MTAB-8445 (Cxcl13-Cre+ cell scRNA-seq), E-MTAB-8454 (B cell scRNA-seq and BCR-seq; VSV immunization), and E-MTAB-XXXX (BCR-seq; NP-KLH immunization). The data that support the findings of this study are available from the corresponding author.
References
- 1.Schwickert TA, et al. A dynamic T cell-limited checkpoint regulates affinity-dependent B cell entry into the germinal center. J Exp Med. 2011;208:1243–1252. doi: 10.1084/jem.20102477. [DOI] [PMC free article] [PubMed] [Google Scholar]
- 2.Sander S, et al. PI3 Kinase and FOXO1 Transcription Factor Activity Differentially Control B Cells in the Germinal Center Light and Dark Zones. Immunity. 2015;43:1075–1086. doi: 10.1016/j.immuni.2015.10.021. [DOI] [PubMed] [Google Scholar]
- 3.Dominguez-Sola D, et al. The FOXO1 Transcription Factor Instructs the Germinal Center Dark Zone Program. Immunity. 2015;43:1064–1074. doi: 10.1016/j.immuni.2015.10.015. [DOI] [PubMed] [Google Scholar]
- 4.Shinnakasu R, et al. Regulated selection of germinal-center cells into the memory B cell compartment. Nat Immunol. 2016;17:861–869. doi: 10.1038/ni.3460. [DOI] [PubMed] [Google Scholar]
- 5.Gitlin AD, Shulman Z, Nussenzweig MC. Clonal selection in the germinal centre by regulated proliferation and hypermutation. Nature. 2014;509:637–640. doi: 10.1038/nature13300. [DOI] [PMC free article] [PubMed] [Google Scholar]
- 6.Fletcher AL, et al. Lymph node fibroblastic reticular cells directly present peripheral tissue antigen under steady-state and inflammatory conditions. J Exp Med. 2010;207:689–697. doi: 10.1084/jem.20092642. [DOI] [PMC free article] [PubMed] [Google Scholar]
- 7.Chai Q, et al. Maturation of lymph node fibroblastic reticular cells from myofibroblastic precursors is critical for antiviral immunity. Immunity. 2013;38:1013–1024. doi: 10.1016/j.immuni.2013.03.012. [DOI] [PMC free article] [PubMed] [Google Scholar]
- 8.Gil-Cruz C, et al. Fibroblastic reticular cells regulate intestinal inflammation via IL-15-mediated control of group 1 ILCs. Nat Immunol. 2016;17:1388–1396. doi: 10.1038/ni.3566. [DOI] [PMC free article] [PubMed] [Google Scholar]
- 9.Perez-Shibayama C, et al. Fibroblastic reticular cells initiate immune responses in visceral adipose tissues and secure peritoneal immunity. Sci Immunol. 2018;3 doi: 10.1126/sciimmunol.aar4539. [DOI] [PubMed] [Google Scholar]
- 10.Cremasco V, et al. B cell homeostasis and follicle confines are governed by fibroblastic reticular cells. Nat Immunol. 2014;15:973–981. doi: 10.1038/ni.2965. [DOI] [PMC free article] [PubMed] [Google Scholar]
- 11.Dubey LK, et al. Lymphotoxin-Dependent B Cell-FRC Crosstalk Promotes De Novo Follicle Formation and Antibody Production following Intestinal Helminth Infection. Cell Rep. 2016;15:1527–1541. doi: 10.1016/j.celrep.2016.04.023. [DOI] [PubMed] [Google Scholar]
- 12.Zhang Y, et al. Plasma cell output from germinal centers is regulated by signals from Tfh and stromal cells. J Exp Med. 2018;215:1227–1243. doi: 10.1084/jem.20160832. [DOI] [PMC free article] [PubMed] [Google Scholar]
- 13.Suzuki K, Grigorova I, Phan TG, Kelly LM, Cyster JG. Visualizing B cell capture of cognate antigen from follicular dendritic cells. J Exp Med. 2009;206:1485–1493. doi: 10.1084/jem.20090209. [DOI] [PMC free article] [PubMed] [Google Scholar]
- 14.Barrington RA, Pozdnyakova O, Zafari MR, Benjamin CD, Carroll MC. B lymphocyte memory: role of stromal cell complement and FcgammaRIIB receptors. J Exp Med. 2002;196:1189–1199. doi: 10.1084/jem.20021110. [DOI] [PMC free article] [PubMed] [Google Scholar]
- 15.Heesters BA, et al. Endocytosis and recycling of immune complexes by follicular dendritic cells enhances B cell antigen binding and activation. Immunity. 2013;38:1164–1175. doi: 10.1016/j.immuni.2013.02.023. [DOI] [PMC free article] [PubMed] [Google Scholar]
- 16.Allen CD, et al. Germinal center dark and light zone organization is mediated by CXCR4 and CXCR5. Nat Immunol. 2004;5:943–952. doi: 10.1038/ni1100. [DOI] [PubMed] [Google Scholar]
- 17.Pereira JP, Kelly LM, Cyster JG. Finding the right niche: B-cell migration in the early phases of T-dependent antibody responses. Int Immunol. 2010;22:413–419. doi: 10.1093/intimm/dxq047. [DOI] [PMC free article] [PubMed] [Google Scholar]
- 18.Bannard O, et al. Germinal center centroblasts transition to a centrocyte phenotype according to a timed program and depend on the dark zone for effective selection. Immunity. 2013;39:912–924. doi: 10.1016/j.immuni.2013.08.038. [DOI] [PMC free article] [PubMed] [Google Scholar]
- 19.Mionnet C, et al. Identification of a new stromal cell type involved in the regulation of inflamed B cell follicles. PLoS Biol. 2013;11:e1001672. doi: 10.1371/journal.pbio.1001672. [DOI] [PMC free article] [PubMed] [Google Scholar]
- 20.Rodda LB, et al. Single-Cell RNA Sequencing of Lymph Node Stromal Cells Reveals Niche-Associated Heterogeneity. Immunity. 2018;48:1014–1028 e1016. doi: 10.1016/j.immuni.2018.04.006. [DOI] [PMC free article] [PubMed] [Google Scholar]
- 21.Onder L, et al. Lymphatic Endothelial Cells Control Initiation of Lymph Node Organogenesis. Immunity. 2017;47:80–92 e84. doi: 10.1016/j.immuni.2017.05.008. [DOI] [PubMed] [Google Scholar]
- 22.Ansel KM, et al. A chemokine-driven positive feedback loop organizes lymphoid follicles. Nature. 2000;406:309–314. doi: 10.1038/35018581. [DOI] [PubMed] [Google Scholar]
- 23.Mackay F, Browning JL. Turning off follicular dendritic cells. Nature. 1998;395:26–27. doi: 10.1038/25630. [DOI] [PubMed] [Google Scholar]
- 24.Wang X, et al. Follicular dendritic cells help establish follicle identity and promote B cell retention in germinal centers. J Exp Med. 2011;208:2497–2510. doi: 10.1084/jem.20111449. [DOI] [PMC free article] [PubMed] [Google Scholar]
- 25.Rodda LB, Bannard O, Ludewig B, Nagasawa T, Cyster JG. Phenotypic and Morphological Properties of Germinal Center Dark Zone Cxcl12-Expressing Reticular Cells. J Immunol. 2015;195:4781–4791. doi: 10.4049/jimmunol.1501191. [DOI] [PMC free article] [PubMed] [Google Scholar]
- 26.Fink K, et al. B cell activation state-governed formation of germinal centers following viral infection. J Immunol. 2007;179:5877–5885. doi: 10.4049/jimmunol.179.9.5877. [DOI] [PubMed] [Google Scholar]
- 27.Kalinke U, et al. The role of somatic mutation in the generation of the protective humoral immune response against vesicular stomatitis virus. Immunity. 1996;5:639–652. doi: 10.1016/s1074-7613(00)80277-0. [DOI] [PubMed] [Google Scholar]
- 28.Calado DP, et al. The cell-cycle regulator c-Myc is essential for the formation and maintenance of germinal centers. Nat Immunol. 2012;13:1092–1100. doi: 10.1038/ni.2418. [DOI] [PMC free article] [PubMed] [Google Scholar]
- 29.Ersching J, et al. Germinal Center Selection and Affinity Maturation Require Dynamic Regulation of mTORC1 Kinase. Immunity. 2017;46:1045–1058 e1046. doi: 10.1016/j.immuni.2017.06.005. [DOI] [PMC free article] [PubMed] [Google Scholar]
- 30.Spillane KM, Tolar P. B cell antigen extraction is regulated by physical properties of antigen-presenting cells. J Cell Biol. 2017;216:217–230. doi: 10.1083/jcb.201607064. [DOI] [PMC free article] [PubMed] [Google Scholar]
- 31.Moran I, et al. Memory B cells are reactivated in subcapsular proliferative foci of lymph nodes. Nat Commun. 2018;9 doi: 10.1038/s41467-018-05772-7. 3372. [DOI] [PMC free article] [PubMed] [Google Scholar]
- 32.Roco JA, et al. Class-Switch Recombination Occurs Infrequently in Germinal Centers. Immunity. 2019;51:337–350 e337. doi: 10.1016/j.immuni.2019.07.001. [DOI] [PMC free article] [PubMed] [Google Scholar]
- 33.Nie Y, et al. The role of CXCR4 in maintaining peripheral B cell compartments and humoral immunity. J Exp Med. 2004;200:1145–1156. doi: 10.1084/jem.20041185. [DOI] [PMC free article] [PubMed] [Google Scholar]
- 34.Gitlin AD, et al. T cell help controls the speed of the cell cycle in germinal center B cells. Science. 2015;349:643–646. doi: 10.1126/science.aac4919. [DOI] [PMC free article] [PubMed] [Google Scholar]
- 35.Pratama A, Vinuesa CG. Control of TFH cell numbers: why and how? Immunol Cell Biol. 2014;92:40–48. doi: 10.1038/icb.2013.69. [DOI] [PubMed] [Google Scholar]
- 36.Ara T, et al. Long-term hematopoietic stem cells require stromal cell-derived factor-1 for colonizing bone marrow during ontogeny. Immunity. 2003;19:257–267. doi: 10.1016/s1074-7613(03)00201-2. [DOI] [PubMed] [Google Scholar]
- 37.Greenbaum A, et al. CXCL12 in early mesenchymal progenitors is required for haematopoietic stem-cell maintenance. Nature. 2013;495:227–230. doi: 10.1038/nature11926. [DOI] [PMC free article] [PubMed] [Google Scholar]
- 38.Wimmer N, et al. Lymphotoxin beta receptor activation on macrophages induces cross-tolerance to TLR4 and TLR9 ligands. J Immunol. 2012;188:3426–3433. doi: 10.4049/jimmunol.1103324. [DOI] [PubMed] [Google Scholar]
- 39.Ludewig B, et al. Induction of optimal anti-viral neutralizing B cell responses by dendritic cells requires transport and release of virus particles in secondary lymphoid organs. Eur J Immunol. 2000;30:185–196. doi: 10.1002/1521-4141(200001)30:1<185::AID-IMMU185>3.0.CO;2-L. [DOI] [PubMed] [Google Scholar]
- 40.Cunningham AF, et al. Salmonella induces a switched antibody response without germinal centers that impedes the extracellular spread of infection. J Immunol. 2007;178:6200–6207. doi: 10.4049/jimmunol.178.10.6200. [DOI] [PubMed] [Google Scholar]
- 41.Cervantes-Barragan L, et al. TLR2 and TLR4 signaling shapes specific antibody responses to Salmonella typhi antigens. Eur J Immunol. 2009;39:126–135. doi: 10.1002/eji.200838185. [DOI] [PubMed] [Google Scholar]
- 42.Cossarizza A, et al. Guidelines for the use of flow cytometry and cell sorting in immunological studies (second edition) Eur J Immunol. 2019;49:1457–1973. doi: 10.1002/eji.201970107. [DOI] [PMC free article] [PubMed] [Google Scholar]
- 43.Macosko EZ, et al. Highly Parallel Genome-wide Expression Profiling of Individual Cells Using Nanoliter Droplets. Cell. 2015;161:1202–1214. doi: 10.1016/j.cell.2015.05.002. [DOI] [PMC free article] [PubMed] [Google Scholar]
- 44.Zheng GX, et al. Massively parallel digital transcriptional profiling of single cells. Nat Commun. 2017;8 doi: 10.1038/ncomms14049. 14049. [DOI] [PMC free article] [PubMed] [Google Scholar]
- 45.McCarthy DJ, Campbell KR, Lun AT, Wills QF. Scater: pre-processing, quality control, normalization and visualization of single-cell RNA-seq data in R. Bioinformatics. 2017;33:1179–1186. doi: 10.1093/bioinformatics/btw777. [DOI] [PMC free article] [PubMed] [Google Scholar]
- 46.Stuart T, et al. Comprehensive Integration of Single-Cell Data. Cell. 2019;177:1888–1902 e1821. doi: 10.1016/j.cell.2019.05.031. [DOI] [PMC free article] [PubMed] [Google Scholar]
- 47.Butler A, Hoffman P, Smibert P, Papalexi E, Satija R. Integrating single-cell transcriptomic data across different conditions, technologies, and species. Nat Biotechnol. 2018;36:411–420. doi: 10.1038/nbt.4096. [DOI] [PMC free article] [PubMed] [Google Scholar]
- 48.Kolde R. Pheatmap: pretty heatmaps. R package version. 2012;61 [Google Scholar]
- 49.Allen CD, Okada T, Tang HL, Cyster JG. Imaging of germinal center selection events during affinity maturation. Science. 2007;315:528–531. doi: 10.1126/science.1136736. [DOI] [PubMed] [Google Scholar]
- 50.Lun ATL, McCarthy DJ, Marioni JC. A step-by-step workflow for low-level analysis of single-cell RNA-seq data with Bioconductor [version 2] F1000Research. 2016;5 doi: 10.12688/f1000research.9501.1. [DOI] [PMC free article] [PubMed] [Google Scholar]
- 51.Reich M, et al. The GenePattern Notebook Environment. Cell Syst. 2017;5:149–151 e141. doi: 10.1016/j.cels.2017.07.003. [DOI] [PMC free article] [PubMed] [Google Scholar]
- 52.Street K, et al. Slingshot: cell lineage and pseudotime inference for single-cell transcriptomics. BMC Genomics. 2018;19:477. doi: 10.1186/s12864-018-4772-0. [DOI] [PMC free article] [PubMed] [Google Scholar]
- 53.Gupta NT, et al. Change-O: a toolkit for analyzing large-scale B cell immunoglobulin repertoire sequencing data. Bioinformatics. 2015;31:3356–3358. doi: 10.1093/bioinformatics/btv359. [DOI] [PMC free article] [PubMed] [Google Scholar]
Associated Data
This section collects any data citations, data availability statements, or supplementary materials included in this article.
Supplementary Materials
Data Availability Statement
All scRNA-seq and BCR-seq datasets are available in ArrayExpress (accession numbers: E-MTAB-8445 (Cxcl13-Cre+ cell scRNA-seq), E-MTAB-8454 (B cell scRNA-seq and BCR-seq; VSV immunization), and E-MTAB-XXXX (BCR-seq; NP-KLH immunization). The data that support the findings of this study are available from the corresponding author.


