Abstract
Spectrally separated fluorophores allow the observation of multiple targets simultaneously inside living cells, leading to a deeper understanding of the molecular interplay that regulates cell function and fate. Chemogenetic systems combining a tag and a synthetic fluorophore provide certain advantages over fluorescent proteins since there is no requirement for chromophore maturation. Here, we present the engineering of a set of spectrally orthogonal fluorogen activating tags based on the Fluorescence Activating and absorption Shifting Tag (FAST), that are compatible with two-color, live cell imaging. The resulting tags, greenFAST and redFAST, demonstrate orthogonality not only in their fluorogen recognition capabilities, but also in their one- and two-photon absorption profiles. This pair of orthogonal tags allowed the creation of a two-color cell cycle sensor capable of detecting very short, early cell cycles in zebrafish development, and the development of split complementation systems capable of detecting multiple protein-protein interactions by live cell fluorescence microscopy.
Introduction
Fluorescence imaging techniques allow one to follow the localization and activities of labeled biomolecules despite the crowded intracellular environment. The fluorescent labels can be entirely synthetic (e.g. organic fluorophores, quantum dots), entirely genetically encoded (e.g. fluorescent proteins) or a hybrid combination. While synthetic labels can be very bright and photostable, they are often difficult to target to a given biomolecule with high specificity. Genetically encoded fluorescent labels such as the green fluorescent protein (GFP)1 have become indispensable tools for biologists as they enable the facile generation of genetic fusions with virtually any protein of interest, however they suffer from slow (minutes to hours), oxygen-dependent maturation.
As an alternative, hybrid or chemogenetic systems have been proposed as a way to combine the advantages of synthetic labels2 with the targeting specificity of genetically encoded tags. Chemogenetic systems moreover often provide a great deal of experimental versatility through the ability to adapt the color of the fluorophore to the experimental conditions, simply by choosing a different cell-permeable and live-cell compatible molecule.
Chemogenetic systems can be generally classified by the nature of the interaction between the protein and the fluorophore. Halo-,3 SNAP-,4 and CLIP-tags5 are self-labeling tags that recognize their cognate ligands and catalyze their covalent attachment.5 In contrast, fluorogen activating proteins (FAPs) interact non-covalently with their cognate fluorogens to generate a fluorescent complex.6 Contrary to many self-labeling tags, the fluorogenic nature of these systems means that a fluorophore is initially in a non-fluorescent state, but become fluorescent upon binding. Separate washing steps to remove unbound dye are not required, and therefore dynamic processes can be followed more easily. A single FAP typically binds a variety of structurally similar fluorogens, providing a straightforward avenue to introduce color diversity by creating fluorogen derivatives. Multiple consecutive labeling steps with different fluorogens can also confer other benefits, such as enabling discrimination of the FAP moieties even in the presence of other fluorophores that emit in the same spectral region.7 However, the promiscuous nature of FAP binding severely limits multi-color imaging.
Our lab has recently developed a novel fluorogen activating protein, FAST (Fluorescence-Activating and absorption Shifting Tag), which is a 14 kDa monomeric protein that interacts rapidly and reversibly with a series of 4-hydroxybenzylidene rhodanine derivatives.8 The fluorogens that interact with FAST all do so with K Ds in the micromolar to sub-micromolar regime and fluoresce from 540 nm to 600 nm, depending on the derivative.7–9 We recently expanded this system to create splitFAST, a split fluorescent reporter that displays rapid and reversible complementation, and that can readily be used as an indicator for molecular interactions.10 SplitFAST is unique for its reversibility and the kinetics of its association and dissociation. Like its ancestor FAST and related proteins, this split system shares the property of fluorogen promiscuity allowing facile adaptation of the emission wavelength to the experimental context.
While the fluorogen promiscuity has clear advantages in terms of spectral flexibility, it also makes it very difficult to use FAST or splitFAST to label two or more distinct targets with different colors, essentially rendering conventional multicolor imaging based on only these systems impossible. In fact, multicolor labeling with non-covalent fluorogen activating proteins presents a specific instance of a broader ligand-recognition problem: engineered proteins often recognize multiple ligands indiscriminately due to similarities in ligand chemical structure and binding mode.11–13 Many natural proteins, in contrast, exhibit exquisite sensitivity to highly related molecules with important biological consequences, as is the case for hormone receptors14 or cyclic nucleotide binding proteins15,16. Unraveling the principles underlying the selectivity of ligand binding is crucial not only for our understanding of native signaling processes, but also for drug design17 and synthetic biology18.
Here, we present the development of orthogonal, color-selective FAST variants for multicolor imaging. The resulting variants show orthogonality in their selectivity for a particular fluorogen, resulting in labels that show selective green or orange/red emission. We demonstrate the usefulness of our constructs for both one and two-photon excitation fluorescence microscopy, two-color super-resolution imaging, and fluorescence lifetime imaging. We also demonstrate two-color fluorescence microscopy in both eukaryotic cell culture and zebrafish models, which allow the observation of very short cell cycles early in zebrafish development. Finally, we generated reversible split fluorescent reporters for the simultaneous detection of two transient protein-protein interactions. Our work supports the use of competitive selection schemes in directed evolution to obtain variants with orthogonal selectivity thus accelerating the development of novel, selective systems.
Results
Engineering of greenFAST and red FAST
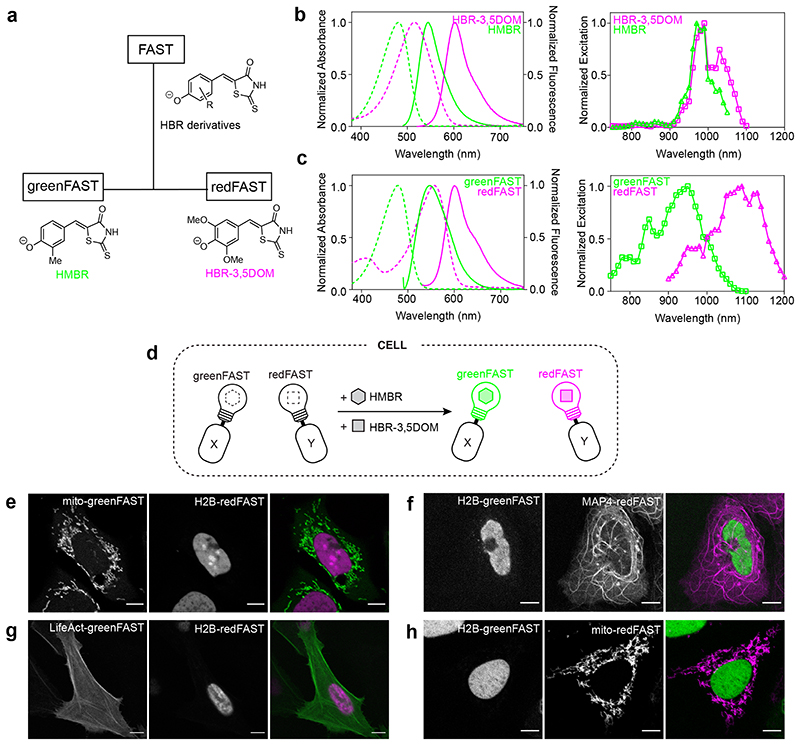
We chose to focus our efforts on the combination of FAST with the fluorogen HMBR, which forms a green fluorescent complex with a K D of 0.1 μM, and HBR-3,5DOM, which forms an orange-red fluorescent complex with a K D of 1 μM. Both fluorogens are structurally similar, differing only by their substituents modifying the 4-hydroxybenzyl moiety (3-methyl vs. 3,5-dimethoxy) (Figure 1a). As in many fluorogenic hybrid systems,19,20 these small substitutions allow the generation of various colors and thus many hybrid systems are comprised of a suite of structurally related fluorogens that interact with a single, genetically-encoded tag.
Figure 1. GreenFAST and redFAST enable spectrally orthogonal labeling of fusion proteins.
(a) FAST promiscuously binds HBR derivatives while greenFAST and redFAST were evolved to bind selectively HMBR or HBR-3,5DOM. (b) (left) Absorbance (dotted lines) and emission (solid lines) spectra of iFAST:HMBR (green) and iFAST:HBR-3,5DOM (magenta). (right) Two-photon excitation spectra of iFAST:HMBR (green) and iFAST:HBR-3,5DOM (magenta). (c) (left) Absorbance (dotted lines) and emission (solid lines) spectra of greenFAST:HMBR (green) and redFAST:HBR-3,5DOM (magenta). (right) Two-photon excitation spectra of greenFAST:HMBR (green) and redFAST:HBR-3,5DOM (magenta). (d-h) Two-color imaging of greenFAST and redFAST fusions in cells. (e) Representative micrograph (n= 4 from 1 experiment) of U2OS cells expressing mito-greenFAST and H2B-redFAST. (f) Representative micrograph (n = 10 from 2 experiments) of U2OS cells expressing H2B-greenFAST and MAP4-redFAST. (g) Representative micrograph (n = 16 from 3 experiments) of U2OS cells expressing LifeAct-greenFAST and H2B-redFAST. (h) Representative micrograph (n = 4 from 1 experiment) of U2OS cells expressing H2B- greenFAST and mito-redFAST. (e-h) Cells were labeled with 5 μM HMBR and 10 μM HBR-3,5DOM. Scale bars 10 μm.
We set out to develop orthogonal FAST:fluorogen systems with selectivity for HMBR or HBR-3,5DOM using a directed evolution strategy. A random library of FAST variants (106 mutants) was developed using error-prone PCR; yeast surface display coupled with FACS sorting allowed us to select for variants with orthogonal fluorogen selectivity (Extended Data Fig. 1). To select for HMBR-selective ‘green’ variants, FACS was performed in the presence of 1 μM HMBR and 10 μM HBR-3,5DOM, conditions in which most yeast cells are doubly labeled, given the K Ds of 0.1 μM for HMBR and 1 μM for HBR-3,5DOM observed with FAST. The ‘greenest’ cells in these conditions were selected to enrich for clones that preferentially bind HMBR. The selection of HBR- 3,5DOM-selective ‘red’ variants was more challenging given the higher affinity of FAST for HMBR, so FACS was performed in the presence of 5 μM HMBR and 5 μM HBR- 3,5DOM. These conditions allowed us to select for cells expressing clones with higher preference for HBR-3,5DOM despite competition with HMBR. Five rounds of selection were performed for the green (selective for HMBR) and red (selective for HBR-3,5DOM) orthogonal variants, respectively.
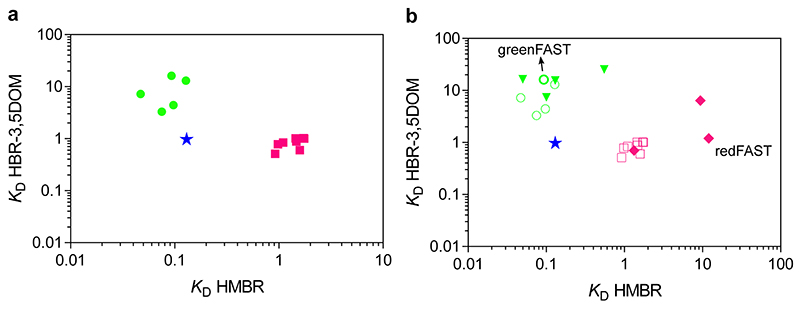
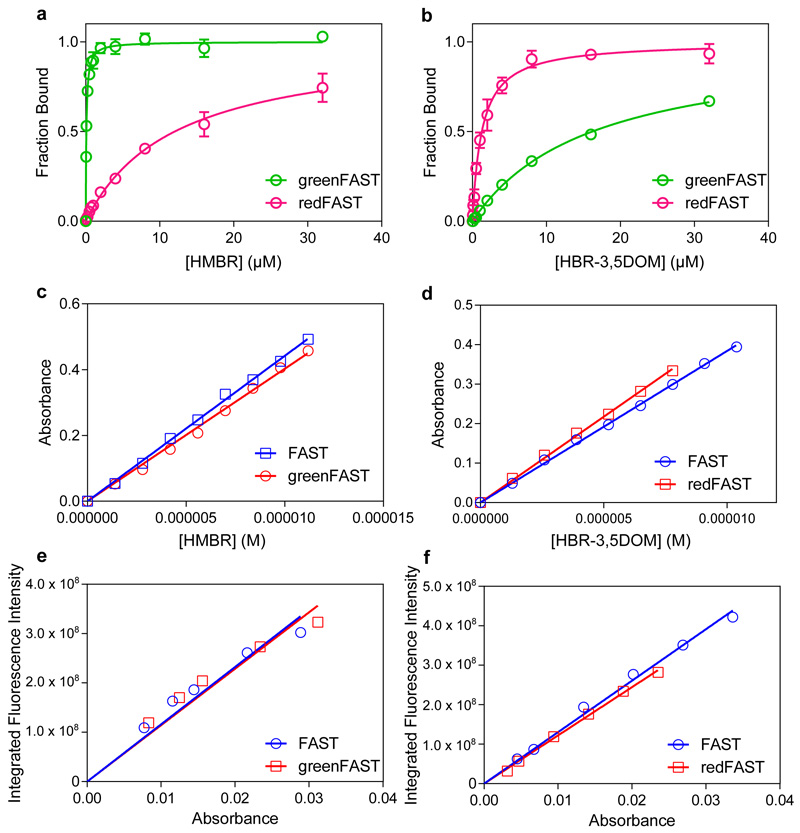
After the fifth round of selection, twenty-four clones were picked randomly and screened for selectivity using flow cytometry and sequenced. Nine individual sequences were found in the selection for the green variants, with certain sequences representing a high proportion of the total sequences (7 times)(Supplementary Table 1). The same analysis was performed for the red variants, resulting in eight individual sequences with certain ones also being highly represented (7 or 6 times) (Supplementary Table 2). Five of the nine green clones and all eight red clones were subcloned into a bacterial expression vector for purification and screening in vitro. The in vitro screening revealed that the green variants retained their affinity for HMBR while losing their affinity for HBR- 3,5DOM, in accordance with a gain of selectivity for HMBR (Supplementary Table 1). Most dramatically, the green clones 1 and 6 displayed an over 10-fold lower affinity for HBR-3,5DOM compared to native FAST (Extended Data Fig. 2a). Conversely, the red variants all retained their ability to bind HBR-3,5DOM while losing an order of magnitude in affinity for HMBR (Extended Data Fig. 2a, Supplementary Table 2).
The selectivity of a given construct can be estimated using the ratio of the binding constants of each fluorogen (K D,HBR-3,5DOM/K D,HMBR for the green variants and K D,HMBR/K D, HBR-3,5DOM for the red ones), which should be larger than ten for ensuring selectivity. The clones isolated by FACS screening for HBR-3,5DOM were not selective, despite displaying a 10-fold reduction in HMBR binding affinity. Indeed, the resulting equivalence of the two binding affinities (around 1 μM) resulted in a ratio of binding constants of ~1, and was thus insufficiently selective.
To screen for improved selectivity, highly repeated mutations isolated from the different clones were combined to try to introduce potential additive effects. Four new variants were generated for the green system, while three were developed for the red system (Extended Data Fig. 2b, Supplementary Table 3). However, none of the new green variants displayed brighter complexes with HMBR. Clone 1 from the original selection was retained and renamed greenFAST, which displays K Ds of 0.09 μM and 16.2 μM for HMBR and HBR-3,5DOM, respectively (Table 1, Extended Data Fig. 3). In the case of greenFAST, the three mutations present (G21E, P68T, G77R) confer selective binding of HMBR over HBR-3,5DOM. We similarly introduced two additional mutations (F28L and E46Q) that needed to be added to the red clone 10 so as to confer selectivity for HBR-3,5DOM, in order to generate a highly selective variant that displays a 100-fold lower affinity for HMBR as compared to FAST and a 10-fold higher selectivity for HBR- 3,5DOM vs HMBR (K Ds of 12 μM and 1.2 μM for HMBR and HBR-3,5DOM, respectively) (Table 1, Extended Data Fig. 3). This variant, now possessing a total of five mutations (F28L, E46Q, R52A, E81V, S99N), was retained and renamed redFAST. The mutation F28L reduced the affinity of the protein for both fluorogens (Supplementary Table 3), possibly through repacking of the N-terminal domain against the β sheet, which has previously been shown to modify the pKA of the chromophore of PYP.21 However, subsequent addition of E46Q rescued the affinity for HBR-3,5DOM, leaving the reduced affinity for HMBR relatively untouched and resulting in a favorable ratio K D,HMBR/K D,HBR-3,5DOM of 10 (Supplementary Table 3).
Table 1. Physicochemical characteristics of FAST, iFAST, greenFAST, and redFAST with HMBR and HBR-3,5DOM in PBS pH 7.4.
Abbreviations are as follows: λabs, wavelength of maximal absorption; λem, wavelength of maximal emission; ε, molar absorptivity at λabs; ϕ, fluorescence quantum yield; K D thermodynamic dissociation constant.
| (μM) | (nm) | (nm) | (mM–1cm–1) | (μM) | (nm) | (nm) | (mM–1cm–1) | ||||
|---|---|---|---|---|---|---|---|---|---|---|---|
| redFAST | 12 | 502 | 554 | ~0.18 | n.d. | 1.3 | 556 | 603 | 0.29 | 43 | 9.2 |
n.d. not determined
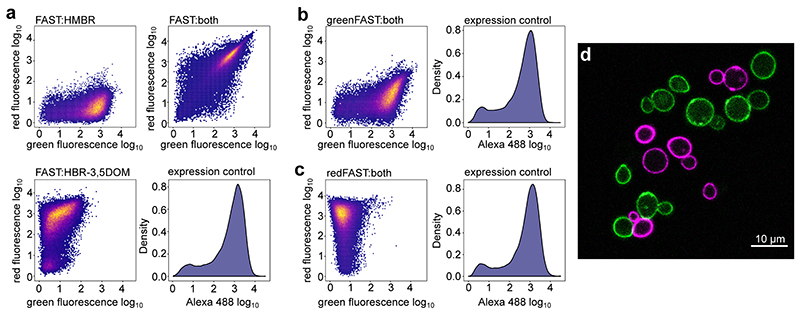
The high preference of greenFAST and redFAST for HMBR and HBR-3,5DOM respectively enables selective labeling using appropriate fluorogen concentrations. Labeling with a mixture of 5 μM of HMBR and 10 μM HBR-3,5DOM gives 99% of greenFAST labeled with HMBR and 95% of redFAST labeled with HBR-3,5DOM (see Online Methods for details). To experimentally demonstrate the orthogonality of the system, yeast cells expressing FAST, greenFAST, and redFAST at the cell surface were analyzed by flow cytometry (Extended Data Fig. 4). FAST-expressing clones in the presence of 5 μM HMBR and 10 μM HBR-3,5DOM predictably bind both fluorogens and display both green and red fluorescence (Extended Data Fig. 4a). In comparison, under the same conditions greenFAST and redFAST show remarkably similar fluorescence profiles to FAST labeled with only one of these fluorogens, demonstrating their selective binding profiles (Extended Data Fig. 4b,c). Two-color imaging using confocal microscopy allowed us to easily distinguish the two cell populations, visually confirming the flow cytometry results (Extended Data Fig. 4d). The successful engineering of these orthogonally selective tags demonstrates the strength of a competitive selection scheme, which enabled us to identify key mutations governing the affinity of the protein scaffold for a particular fluorogen. Given the structural similarity of the two ligands, a wholly rational approach focused on the ligand binding pocket itself to design specificity would be impeded by the difficulty of identifying distal interactions that nonetheless affect ligand binding.
Spectral characteristics of greenFAST and redFAST
A more detailed examination of the absorption and emission spectra of greenFAST and redFAST revealed an unexpected spectral orthogonality, which improves their performance for two-color applications. HBR-3,5DOM complexes with FAST and iFAST (an improved FAST variant) are most efficiently excited at 516 nm and exhibit broad absorption spectra7,9 (Figure 1b), making cross-excitation by a 488 nm laser possible. Thus, a system that is simply orthogonal in terms of binding affinity could still suffer from crosstalk excitation of both fluorogens at the same wavelength. However, the absorption of redFAST is redshifted by nearly 40 nm, placing it squarely in a spectral region where excitation by 543 nm and 561 nm lasers is more optimal (Figure 1c). This shift can be ascribed to the mutations of E46 and R52, two residues that are known for their role in hydrogen bonding to the chromophore in PYP, the parent protein of FAST. Mutational analysis in PYP has shown that these mutations result in a red-shifted PYP chromophore absorption spectrum similar to what we observed in redFAST.21 It is worth noting that at least one of these two mutations is present in every clone isolated after FACS screening, which is likely due to the selective pressure imposed by the laser and filter sets used for screening. Indeed, while the absolute molecular brightness of redFAST is lower than that of both iFAST:HBR-3,5DOM and mCherry, the good spectral match in excitation wavelength means that redFAST is 1.7 brighter than iFAST9 and 1.2 times brighter than mCherry22 when excited at 561 nm. Interestingly, this trend extends to two-photon excitation. The two photon excitation spectra of iFAST with HMBR and HBR-3,5DOM display strong overlap (Figure 1b), while the spectra of redFAST and greenFAST are red-shifted and blue-shifted, respectively, resulting in orthogonal excitation profiles in two-photon mode (Figure 1c).
Two color confocal microscopy of greenFAST and redFAST
The selectivity and spectral orthogonality of greenFAST and redFAST make them ideal for two color microscopy applications. To test their performance as cellular markers, greenFAST and redFAST were fused to a number of proteins with various subcellular localizations (Figure 1d-h). Co-expression of greenFAST and redFAST fusions localized to different subcellular structures in mammalian cells demonstrated that the two proteins could be used together for two-color imaging applications and that fusion of the tags did not interfere with the expected localization.
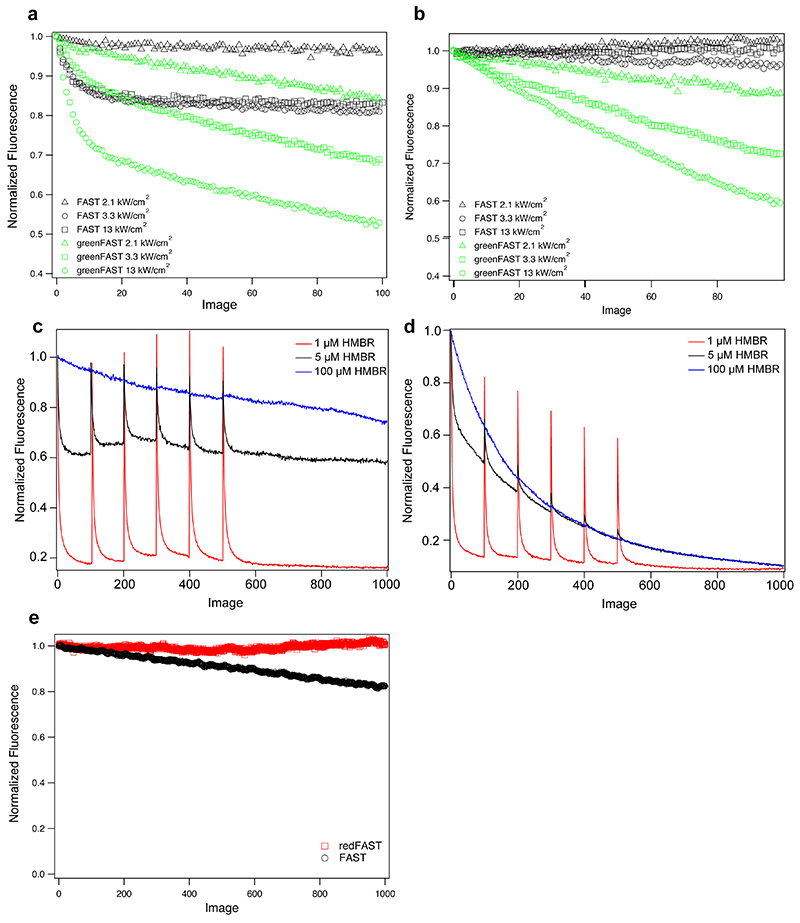
Photobleaching measurements revealed that redFAST exhibited greater photostability than FAST or iFAST (Extended Data Fig. 5), despite forming a complex with HBR-3,5DOM with largely equivalent photophysical characteristics (absorptivity, fluorescence quantum yield, fluorescence lifetime). In contrast, the three mutations introduced into greenFAST induce a dramatic difference in photostability, being much more sensitive to photobleaching (Extended Data Fig. 5). This effect was investigated at multiple illumination intensities and acquisition rates (Extended Data Fig. 5a,b), as well as at multiple fluorogen concentrations (Extended Data Fig. 5c,d). Both FAST and greenFAST exhibit partially reversible, biphasic behavior as has been observed previously due to photoisomerization of the chromophore and destruction of one or both components of the fluorescent complex23. We have previously observed that while FAST systems do undergo photodestruction, they benefit from chromophore renewal due to the reversibility of the protein:fluorogen interaction23. The data reported here can be described by a three-state model based on the previously published models23 comprised of (irreversibly) photodamaged protein, free protein, and (reversible) protein:fluorogen complex. At high fluorogen concentrations the contribution of the reversible component is abrogated as protein is re-bound instantaneously and the irreversible photobleaching process dominates. Given the nature of the mutations introduced in greenFAST (G21E, P68T, G77R), it is not immediately obvious why greenFAST might be more sensitive to photodamage, but it is reasonable to hypothesize that this might be due to altered folding around the binding pocket, perhaps allowing greater solvent access. Nevertheless, imaging conditions can be chosen to optimize the signal — namely lower light intensities and lower total acquisitions.
Fluorescence Lifetime Imaging of greenFAST and redFAST
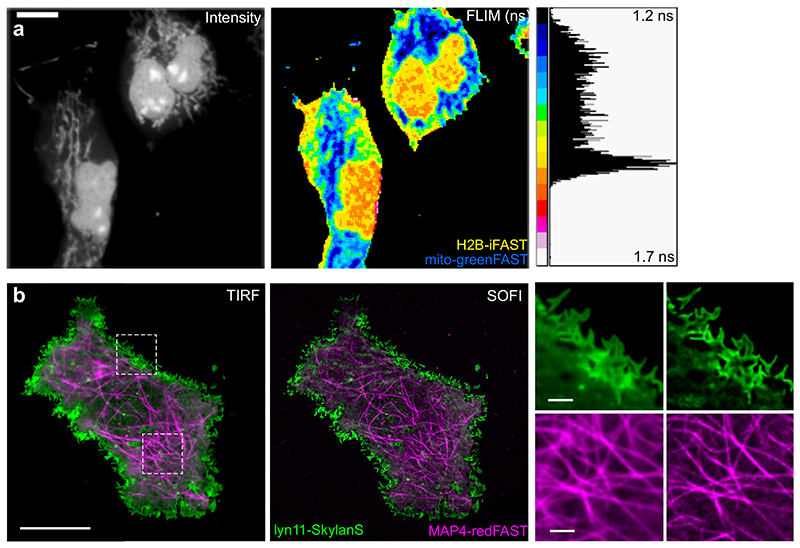
We also characterized the excited-state lifetimes of redFAST, greenFAST, and iFAST using fluorescence lifetime imaging microscopy (FLIM)24 on live COS-7 cells expressing H2B fusion proteins. Similar to many fluorescent proteins, the fluorescence decays of FAST-based complexes are best fit with a biexponential function (Supplementary Tables 4-10). The slow lifetime component of redFAST:HBR-3,5DOM was similar to that of iFAST:HBR-3,5DOM (2.48 ± 0.07 ns n = 17 vs. 2.77 ± 0.05 ns, n = 15) (Supplementary Table 4). In contrast, the greenFAST:HMBR and iFAST:HMBR complexes displayed distinguishable slow lifetime components (1.18 ± 0.09 ns, n = 15 vs. 1.70 ± 0.02 ns, n = 20), (Supplementary Table 4), which could be used to selectively image both labels in live cells using FLIM (Figure 2a). Furthermore, imaging greenFAST and redFAST in the presence of both fluorogens did not change the measured lifetime (Supplementary Table 4).
Figure 2. GreenFAST and redFAST enable FLIM and SOFI imaging in live cells.
(a) Representative regular and FLIM micrographs (n = 6 from 1 experiment) of COS-7 cells expressing mito-greenFAST and H2B-iFAST labeled with 5 μM HMBR. Scale bars 5 μm. (b) Representative averaged TIRF (left) and pcSOFI (right) micrographs (n = 17 from 8 experiments) of COS-7 cells expressing lyn11-Skylan-S and MAP4-redFAST. Cells were labeled with 5 μM HBR-3,5DOM. Scales bars 10 μm (left) and 1 μm (right).
Two color superresolution microscopy
Finally, we tested the performance of greenFAST and redFAST for one modality of super-resolution fluorescence microscopy, namely super-resolution optical fluctuation imaging SOFI25–27. SOFI provides diffraction-unlimited spatial resolution by relying on the analysis of spontaneous single-molecule ‘blinking’ of the fluorophores, and can operate under a broad range of conditions using any single-molecule sensitive wide-field microscope. COS-7 cells expressing greenFAST and stained with 5 μM HMBR did not show appreciable single-molecule intensity fluctuations and thus did not yield insightful images. However, redFAST did show single-molecule intensity fluctuations suitable for SOFI imaging. Two-color SOFI imaging could be achieved using live mammalian cells co-expressing microtubule-targeted redFAST (stained with HBR- 3,5DOM) and membrane-targeted Skylan-S,28 a green fluorescent protein that was showed to be robustly well-performing in pcSOFI29 (Figure 2b). Second-order pcSOFI analysis showed the background rejection and two-fold gain in spatial information intrinsic to the method.30 This result illustrates redFAST’s fitness for multicolor SOFI.
Cell cycle reporters using greenFAST and redFAST
Green/red FAST labelling seems particularly promising for dynamic recording in vivo. We thus decided to apply greenFAST and redFAST to the FUCCI (fluorescence ubiquitination cell cycle indicator) technology.31 FUCCI is a technique for delineating cell cycle phases via the use of a red and a green fluorescent protein fused to the N-terminal domains of Cdt1 and geminin, two cell cycle regulators whose levels show biphasic cycling during the cell cycle. However, the analysis of very short cell cycles as found in early fish or amphibian embryos is not possible due to the time limitations imposed by the slow maturation of typical GFP-like fluorescent proteins. For example, the zFUCCI system adapted to zebrafish, though better at delineating the G1/S transition, was not able to track cell cycle phases earlier than the 6 somite stage (12 hpf).32 A more recent improvement of the FUCCI system33 allowed analysis of the shortest cell cycles in mouse embryonic stem cells dividing in culture, lasting 9-10 h. These advances still precluded the analysis of the very fast cell cycles occurring in zebrafish early embryos, where cells may divide every 15-18 min34–36 before the mid-blastula transition (MBT) and for which G1 and G2 pattern and tempo of appearance are still unknown.
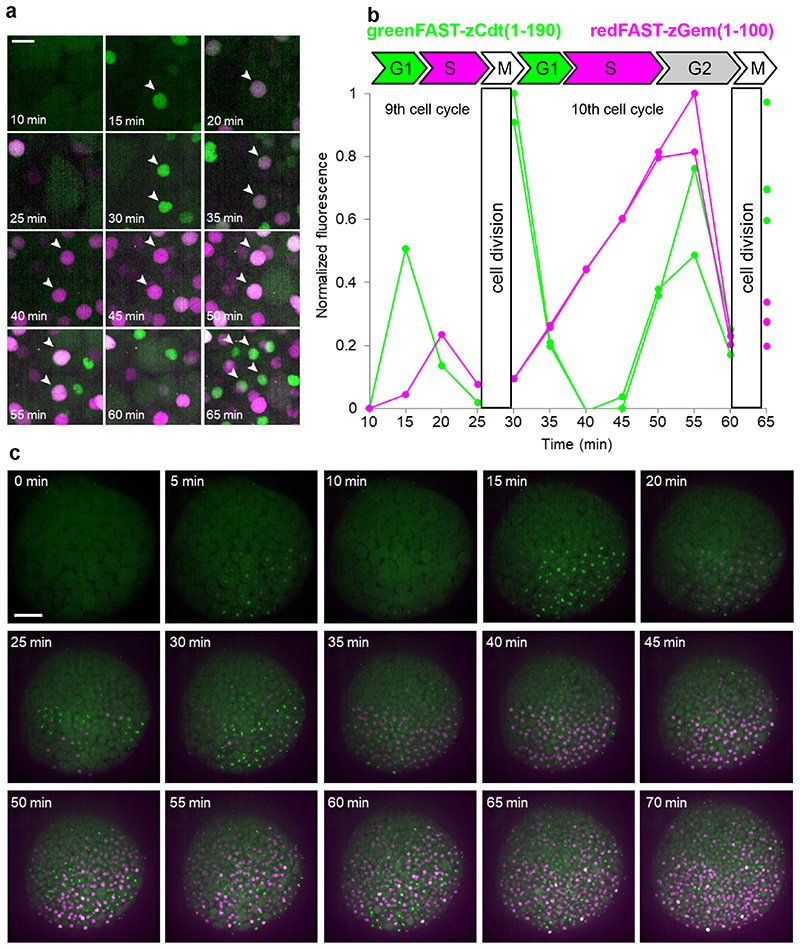
A stable mammalian cell line expressing a FAST-based FUCCI, consisting of redFAST fused to the N-terminal domain of Cdt1 and greenFAST fused to the N-terminal domain of geminin, enabled the observation of multiple cell cycles over long time-lapse acquisitions (24-28 hrs) (Extended Data Fig. 6). We thus decided to use the same ubiquitin ligase domains which had previously proved useful in zebrafish, zCdt1(1-190) and zGeminin(1-100) and fused them with greenFAST and redFAST, respectively. The mRNA coding both proteins was injected into a zebrafish embryo at the one-cell stage and time-lapse imaging was performed starting from 256-cell stage embryos with one image every 5 minutes. The first cycle gave faint signals, as expected for very short cycles with quite reduced G1 or G2 phases, but the two following cycles (9th and 10th) gave excellent signals allowing individual nuclei to be monitored over time (Figure 3a,b, Supplementary Video 1). The 9th cell cycle displayed a clear G1/S transition and lasted 15 min. The 10th cycle was longer (30 min) and a well-demarcated G2 phase appeared. Indeed, all phase transitions (M/G1, G1/S, S/G2 and G2/M) were clearly visible in our system, which benefits from the absence of fluorescence maturation in greenFAST and redFAST because of the almost-instantaneous fluorogen binding. Interestingly, zCdt1(1- 190) is targeted for degradation by CUL4,32 which is normally turned-on and turned-off at the beginning and end of S phase.33 This should give zCdt1(1-190) a biphasic accumulation regime (first during G1 phase, with an abrupt disappearance during S phase, then during G2), which is indeed what was observed during the 10th cycle (Figure 3a,b). It is also noteworthy that during this cycle, the G1/S, S/G2 and G2/M transitions were all perfectly synchronous in the two sister cells (Figure 3a,b).
Figure 3. Cell cycle sensors based on greenFAST and redFAST.
Zebrafish embryos were injected with redFAST-zGem(1-100)-P2A-greenFAST-zCdt1(1-190) mRNA at one-cell stage, and time-lapse imaging was performed starting from 256-cell stage on embryos incubated with 5 μM HMBR and 5 μM HBR-3,5DOM. (a) Representative timelapse (n = 3 from 3 independent embryos) of single cells at high magnification. Scale bar 20 μm. (b) Corresponding quantification of fluorescence signal over time (cells with white arrows in the panel a). (c) Representative timelapse (n = 3 from 3 independent embryos) of the whole embryo (see also Supplementary Video 2). Scale bar 100 μm.
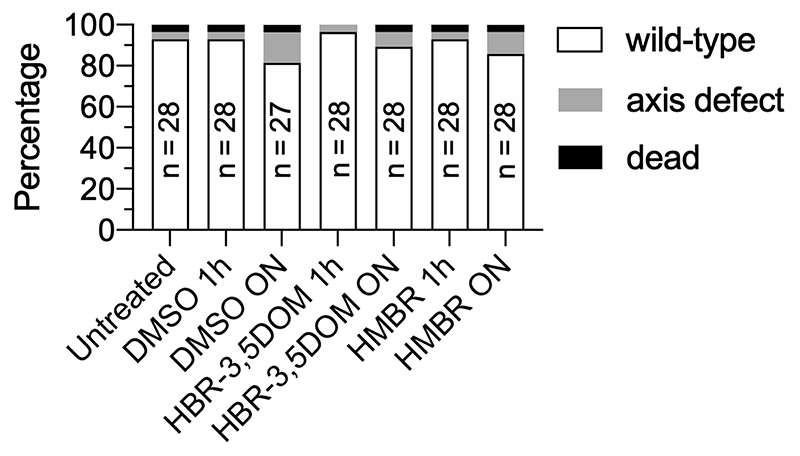
In addition, fluorescence recording over the whole embryo revealed proliferation patterns and asynchronic division as early as 256 cells (Figure 3c, Supplementary Video 2). These patterns were previously described in either fixed embryos37 or in live embryos analyzed by label-free non-linear microscopy, though these did not give access to individual phases of the cell cycle36. Note that unbound fluorogens do not appear to exhibit any major effects on cell functions. No deleterious effects were observed at 48 hpf in zebrafish embryos incubated with 5 μM HMBR or 5 μM HBR- 3,5DOM during 1 hour at 50% epiboly, or overnight from 50% epiboly to 24 hpf (Extended Data Fig. 7). In addition, as FAST functions through a dynamic exchange between the protein and ligand, the model system is constantly exposed to fluorogen. After degradation of the target protein, the fluorogen is then re-liberated to the cellular milieu and is thus available for rebinding. Our approach is the first dynamic study of all phase transitions in the cell cycles at the mid-blastula transition in zebrafish embryogenesis,38 highlighting the strength of multicolor chemogenetic reporters with rapid labeling kinetics. Indeed, reaching the detailed analysis of cell cycles as short as 15 min (as compared to 9-10 h in recent studies33) and as early as 3.5 hpf (as compared to 12 hpf as reported earlier32) is only possible by using fluorescent labels with quasi-instantaneous fluorescence maturation as the ones developed here.
Two color protein-protein interaction reporters
SplitFAST is the only reversible fluorescence complementation reporter with rapid association and dissociation kinetics.10 We reasoned that greenFAST and redFAST could also be used for the design of split reporters, provided that they retained these characteristics as well as their orthogonality, which would open the possibility for the readout of multiple interactions. Especially promising in this regard would be the facile readout of multiple or sequential protein interactions as the appearance of fluorescence combined with the reversibility inherent to the splitFAST system provide good contrast and temporal resolution, the combination of which is currently impossible to achieve.
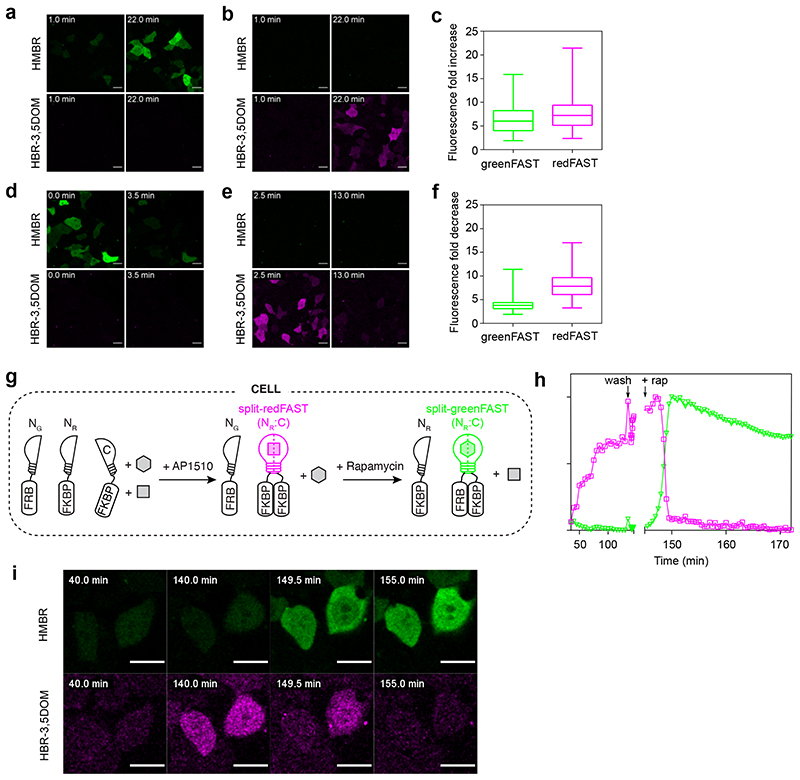
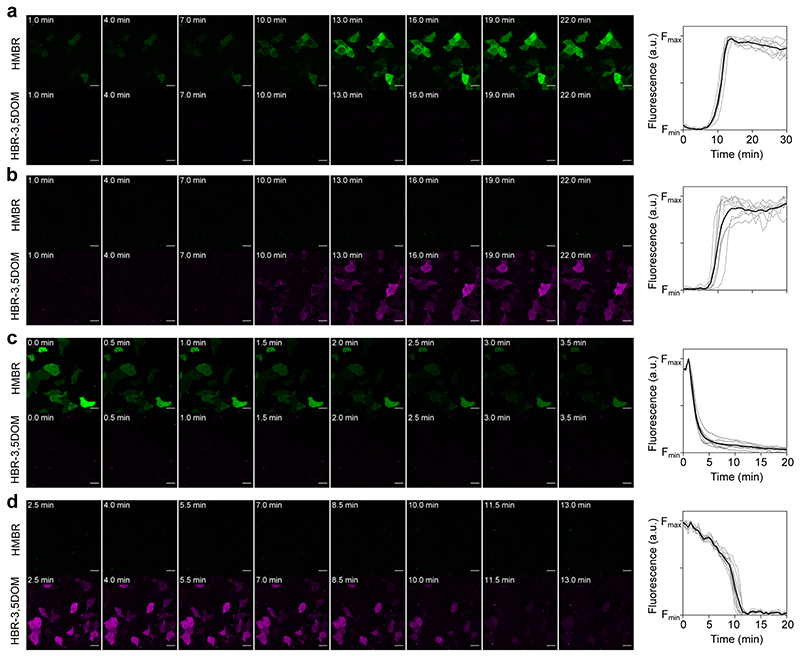
GreenFAST and redFAST were split into N-terminal and C-terminal fragments at the same site used to create splitFAST from FAST and fused to the FK506-binding protein (FKBP) and the FKBP-rapamycin-binding domain of mammalian target of rapamycin (FRB) that interact together in the presence of rapamycin. All the mutations that confer selectivity to greenFAST and redFAST occur in the N-terminal fragments (named greenNFAST and redNFAST respectively), meaning that the C-terminal fragment (named CFAST11) is the same for the two split systems. Split-greenFAST and split-redFAST were assessed directly in mammalian cells by confocal microscopy. We measured the association of the split constructs by inducing the formation of heterodimers of FRB and FKBP with rapamycin (Figure 4a,b,c). Upon addition of 500 nM rapamycin, split-redFAST and split-greenFAST rapidly reassembled into their cognate fluorogen:protein complex in the presence of both fluorogens with an average 6- and 8-fold increase in fluorescence (Figure 4c). Furthermore, the fluorescence time course revealed that split-greenFAST and split-redFAST show similarly rapid kinetics (seconds-minutes) as has previously been observed for splitFAST (Extended Data Fig. 8a,b).
Figure 4. Orthogonal reporters of protein-protein interactions.
(a,b) Representative micrographs (n = 3 from 3 experiments) of HEK293T cells co-expressing FKBP-CFAST11 and FRB fused to either greenNFAST (a) or redNFAST (b) were labeled with both 5 μM HMBR and 10 μM HBR-3,5DOM, and imaged before and after addition of 500 nM rapamycin. (c) Fluorescence fold increase upon FRB-FKBP association for split-greenFAST and split-redFAST. Box and whiskers with center lines show the medians; box limits indicate 25th and 75th percentiles as calculated by Prism 7 and whiskers extend to max and min values. Split-greenFAST: n = 157 cells from 3 experiments, split-redFAST: n = 125 cells from 3 experiments. (d,e) Representative micrographs (n = 3 from 3 experiments) of HEK293T cells co-expressing FKBP fused to CFAST11 and FKBP fused to either greenNFAST (d) or redNFAST (e) treated with 100 nM AP1510 and labeled with both 5 μM HMBR and 10 μM HBR-3,5DOM. Cells were then imaged before and after the addition of 1.1 μM rapamycin. (f) Fluorescence fold decrease upon FKBP-FKBP dissociation for split-greenFAST and split-redFAST. Box and whiskers with center lines show the medians; box limits indicate 25th and 75th percentiles as calculated by Prism 7 and whiskers extend to max and min values. Split-greenFAST: n = 174 cells from 3 experiments, split-redFAST: n = 135 cells from 3 experiments. (g) Exchange of AP1510-mediated FKBP-FKBP homodimer (red) to rapamycin-mediated FRB-FKBP heterodimer (green). (h,i) Representative traces and images (n = 10 from 10 experiments) showing the evolution of the fluorescence signals of split-redFAST and split-greenFAST during the experiment (see also Supplementary Video 3). Scale bars 10 μm.
In order to assess the reversibility of the complex, N-greenFAST (resp. N-redFAST) and CFAST11 were fused to FKBP. The disruption of an AP1510-mediated FKBP-FKBP homodimer by rapamycin was followed as a decrease in fluorescence (Figure 4d,e,f). The dissociation of split-greenFAST and split-redFAST upon rapamycin addition was likewise characterized by rapid kinetics similar to those observed for splitFAST (Extended Data Fig. 8c,d).
To test whether these two split systems can be used to measure two protein-protein interactions in the same cell, we monitored the exchange from FKBP-FKBP homodimer to FRB-FKBP heterodimer. Split-redFAST was used to detect the FKBP-FKBP homodimer, which was then dissociated by addition of rapamycin, triggering the concomitant association of FKBP and FRB, detected with split-greenFAST (Figure 4g,h,i). The association and dissociation of the two complexes occurred in the same kinetic regimes (seconds-minutes) as what has previously been observed with splitFAST for each interaction separately (Figure 4h,i, Supplementary Video 3). Both greenFAST and redFAST share a common C-terminal fragment when split, which enables the detection of switch-like protein-protein interactions that share a common partner, but also does not preclude the detection of two separate interactions with two C-terminal fragments fused to separate proteins.
Discussion
Hybrid systems have been long proposed as a way to combine the advantages of organic fluorophores with those of proteins, namely being able to genetically target tags to particular cell types and to fuse them to specific proteins. FAST, like many hybrid systems, is capable of using multiple organic fluorogens to form different colored complexes. Orthogonal FAST systems facilitate multicolor experiments that exploit the advantages of FAST, such as rapid labeling and protein-protein interaction detection.
Engineering the orthogonal system greenFAST and redFAST required introducing three and five mutations, respectively, into FAST. These mutations conferred selectivity towards either HMBR (in the case of greenFAST) or HBR-3,5DOM (in the case of redFAST) in media containing a mixture of the two fluorogens. The resulting proteins formed complexes with their cognate fluorogen with similar photophysical characteristics. However, certain differences are observable, namely in terms of photostability and the excitation wavelength of redFAST:HBR-3,5DOM, which can be attributed to the influence of the protein tag itself. Furthermore, given fluorophores can differ in brightness when conjugated with either Halotag or SNAP-tag, indicating that even in the case of these highly promiscuous self-labeling tags, the protein tag portion of hybrid systems may not be entirely innocent.39 Further development of hybrid systems will shed light on the role of the protein in complex formation and behavior.
In conclusion, we have developed two closely related chemogenetic systems that allow facile multicolor genetically-encoded labelling of living systems. Our systems offer a set of unique advantages that complement the suite of current imaging techniques, such as the straightforward observation of transient or rapidly cycling processes enabled by the absence of delays linked to chromophore maturation. They also display favorable optical properties for both one- and two-photon imaging and more advanced modalities such as FLIM or super-resolution imaging. We also showed that these proteins could be used for biosensing, by developing split reporters that report in situ interactions via rapid and reversible complementation, while offering straightforward readout by monitoring the appearance of fluorescence emission. We expect that our systems will strongly expand the range of questions that can be answered using fluorescence imaging.
Online Methods
General
Synthetic oligonucleotides used for cloning were purchased from Integrated DNA Technology. The sequences of oligonucleotides used in this study are provided in Supplementary Table 11. PCR reactions were performed with Q5 polymerase (New England Biolabs) in the buffer provided. PCR products were purified using QIAquick PCR purification kit (Qiagen). The products of restriction enzyme digests were purified by preparative gel electrophoresis followed by QIAquick gel extraction kit (Qiagen). Restriction endonucleases, T4 ligase, Phusion polymerase, Taq ligase, and Taq exonuclease were purchased from New England Biolabs and used with accompanying buffers and according to manufacturer protocols. Isothermal assemblies (Gibson assembly) were performed using homemade mix prepared according to previously described protocols.40 Small-scale isolation of plasmid DNA was done using QIAprep miniprep kit (Qiagen) from 2 mL of overnight culture. Large-scale isolation of plasmid DNA was done using the QIAprep maxiprep kit (Qiagen) from 150 mL of overnight culture. All plasmid sequences were confirmed by Sanger sequencing with appropriate sequencing primers (GATC Biotech). Please see Supplementary Table 12 for a list of all plasmids used in this study. The preparation of HMBR (4-hydroxy-3- methylbenzylidene rhodanine) and HBR-3,5DOM (4-hydroxy-3,5-dimethoxybenzylidene rhodanine) were previously described2,3. HMBR and HBR-3,5DOM are available from The Twinkle Factory under the name TFLime and TFCoral (thetwinklefactory.com).
Yeast Display
Library construction
The yeast display libraries of YFAST were constructed by error- prone PCR using the Genemorph II kit (Agilent) using primers ag216/ag217. The error rate of the PCR was varied by using either 1 or 10 ng template gene. The PCR reactions were mixed to achieve a mutation rate of 3.8 nt/gene and cloned into pCTCON2 using NheI and BamHI restriction sites. Large scale transformation into DH10B was performed, yielding 106 transformants. The DNA was maxiprepped and transformed into yeast strain EBY100 using a large-scale, high-efficiency protocol41 to yield 2 × 10⁶ transformants.
Selection
The library (1.5 x 10⁹ cells) was grown overnight at 30 °C in 1 L SD (20 g/L dextrose, 6.7 g/L yeast nitrogen base, 1.92 g/L yeast synthetic dropout without tryptophan, 7.44 g/L NaH2PO4, 10.2 g/L Na2HPO4−7H2O, 1% penicillin-streptomycin 10,000 U/mL). The following morning the culture was diluted to OD600nm in 1 L SD and grown at 30 °C until the OD600nm was between 2 and 5 at which point 5 × 10⁶ cells were pelleted and resuspended in SG (20 g/L galactose, 2 g/L dextrose, 6.7 g/L yeast nitrogen base, 1.92 g/L yeast synthetic dropout without tryptophan, 7.44 g/L NaH2PO4, 10.2 g/L Na2HPO4−7H2O, 1% penicillin-streptomycin 10,000 U/mL). The cultures were then grown for 36 h at 23 °C. 1.2 × 10⁹ cells were pelleted by centrifugation (2500 × g, 3 min), washed once with 10 mL DPBS + BSA (1 g/L) and incubated for 30 min at room temperature in 480 μL of a 1:250 dilution of chicken anti-c-myc IgY (Life Technologies) in DPBS-BSA. Cells were then centrifuged and washed with DPBS-BSA and incubated for 20 min on ice with a 1:150 dilution of secondary goat anti-chicken coupled to Alexa- Fluor 647. After centrifugation and washing with DPBS-BSA, the cells were resuspended in 10 mL DPBS-BSA supplemented with either 5 μM HMBR + 5 μM HBR-3,5DOM, or 1 μM HMBR + 10 μM HBR-3, 5DOM. The cells were sorted on a MoFlo Astrios (Beckman Coulter) equipped with 488 nm, 561 nm, and 640 nm laser. Sorted cells were collected in SD, grown over night at 30 °C, and plated on SD agar plates. The plates were incubated for 3 days at 30 °C and the resulting lawn was resuspended in SD supplemented with 20% glycerol. The resulting stock was either frozen or used directly for the next round as well as tested for viability by serial dilution and plating on SD plates. After 4-5 rounds of selection by FACS, 24 clones were screened by flow cytometry and their DNA was isolated using a miniprep kit (Qiagen), transformed into DH10B and re-isolated for sequencing.
Cloning
Selected clones were subcloned into a pET28a backbone for recombinant expression in E. coli by isothermal assembly using backbone fragments generated by PCR amplification of pAG878 using primers ag321/KanF and ag322/KanR and inserts amplified from the isolated yeast plasmids using primers ag354 and ag224. Site-directed mutagenesis was carried out using isothermal assembly of two overlapping PCR fragments with mutations encoded on primers. The plasmid pAG302 was generated by introduction of the V107M mutation by amplification of pAG263 with primers ag420/KanR and ag421/KanF. The plasmid pAG303 was generated by introduction of the P68T mutation by amplification of pAG265 with primers ag422/KanR and ag423/KanF. The plasmid pAG304 was generated by introduction of the T70K mutation by amplification of pAG303 with primers ag423/KanR and ag424/KanF. The plasmid pAG305 was generated by introduction of the V122I mutation by amplification of pAG265 with primers ag189/KanR and ag322/KanF. The plasmid pAG306 was generated by introduction of the I99N mutation by amplification of pAG2275 with primers ag426/KanR and ag427/KanF. The plasmid pAG307 was generated by introduction of the F28L mutation by amplification of pAG276 with primers ag428/KanR and ag429/KanF. The plasmid pAG308 was generated by introduction of the E46Q mutation by amplification of pAG307 with primers ag195/KanF and ag196/KanR. The plasmids pAG364 and pAG365 encoding greenFAST and redFAST were constructed by isothermal assembly from the plasmid pAG1048 (ref) encoding FAST. The sequences for the inserts encoding greenFAST and redFAST were amplified by PCR from pAG261 and pAG308 using primers ag356/ag357. The backbone was amplified using ag358/ag313 and ag311/ag314.
The plasmids pAG361 and pAG369 encoding lyn11-greenFAST and lyn11-redFAST, respectively, were constructed by isothermal assembly from the plasmid pAG1068 encoding lyn11-FAST. The sequences encoding for lyn11-greenFAST and lyn11-redFAST were amplified by PCR from pAG261 and pAG308 using primers ag554/ag356. The backbone of pAG106 was amplified using ag555/ag313.
The plasmids pAG372 and pAG373 were generated by digestion pAG364 and pAG365 with BglII and HindIII and insertion into pAG1568, which encodes for mito-FAST. The plasmids pAG374 and pAG375 encoding H2B-greenFAST and H2B-redFAST were constructed by isothermal assembly from the plasmid pAG109, which encodes for H2B-FAST. The sequences encoding for greenFAST and redFAST were amplified from pAG261 and pAG308 using primers ag491/ag356. The backbone was amplified using ag492/ag313.
The plasmids pAG551 and pAG552 encoding MAP4-greenFAST and MAP4-redFAST were constructed by isothermal assembly from pAG364 and pAG365 encoding greenFAST and redFAST. The sequence for MAP4 was amplified from plasmid ffDronpa-MAP4 42 using primers ag795/ag796. The backbones were amplified using ag528/ag313 and ag358/ag313.
The plasmids pAG469 and #1113 encoding LifeAct-redFAST and LifeAct-greenFAST were constructed by isothermal assembly from pAG365 and pAG364, respectively. The backbone was amplified from pAG364 and pAG365 encoding CMV-greenFAST and CMV-redFAST using primers ag679/ag314 and ag358/ag313 and assembled with ag677 and ag678.
The plasmid pAG477 encoding redFAST-Cdt(30-120)-P2A-greenFAST-Gem(1-120) was constructed in multiple steps by isothermal assembly from pAG14810. The sequence for redFAST was amplified from pAG308 using primers ag528/ag314. The backbone was amplified using ag527/ag313. The sequence for Cdt(30-120) was amplified from a synthesized fragment (Eurofins) using primers ag598/ag599. The backbone was amplified using primers ag550/ag314 and ag675/ag313 (pAG439). The sequences for greenFAST and Geminin(1-120) were amplified from pAG261 and a synthesized fragment (Eurofins) using primers ag532/ag530 and ag533/ag534. The backbone was amplified using primer ag599/ag313 and ag347/314.
The plasmids pAG460 and pAG461 encoding FRB-N-greenFAST and FRB-N-redFAST were generated by isothermal assembly from pAG149 encoding FRB-NFAST. The sequences encoding N-greenFAST and N-redFAST were amplified from pAG364 and pAG365 using ag175/ag472. The backbones were amplified using ag182/ag313 and ag347/314.
The plasmids pAG462 and pAG463 encoding FKBP-N-greenFAST and FKBP-N-redFAST were generated by isothermal assembly from pAG148 encoding FKBP-NFAST. The sequences encoding N-greenFAST and N-redFAST were amplified from pAG364 and pAG365 using ag175/ag472. The backbones were amplified using ag184/ag313 and ag347/314.
The plasmids pAG362, pAG646, and pAG647 were generated from the yeast display plasmid pCTCON2 by restriction enzyme cloning using NheI and BamHI. The inserts were amplified using ag216/ag217 from pAG308, pAG302, and pAG303.
Flow Cytometry
Flow cytometry was performed on a MACSQuant Analyzer equipped with 405 nm, 488 nm, and 561 nm lasers and eight filters and channels. To prepare samples for flow cytometry, small scale cultures were grown as for library expression (vide supra).
Briefly, 3 mL of SD were inoculated with a single colony and grown overnight at 30 °C. The following day, the cultures were diluted to a final OD600nm 1 in 5 mL of SD and grown until doubled. These cultures were used to inoculate 5 mL of either SD (non-induced) or SG (induced) to an OD of 0.5 and the cultures were grown for 36 h at 23°C. 1 × 10⁸ cells were pelleted and washed with 1× DPBS + BSA. Aliquots of each were labeled with chicken anti-myc antibody as for library preparation using a secondary goat anti-chicken coupled to Alexa-Fluor 488 to verify protein expression. Clones were finally resuspended in 1× DPBS + BSA supplemented with one of the following fluorogen conditions: 0 μM, 5 μM HMBR, 10 μM HBR-3,5DOM, 1 μM HMBR + 10 μM HBR- 3,5DOM, 5 μM HMBR + 5 μM HBR-3,5DOM, 5 μM HMBR + 10 μM HBR-3,5DOM. Data were analyzed in R (3.6.2) using RStudio with opencyto, flowCore, and ggcyto packages.
Protein Expression and purification
Expression vectors were transformed in Rosetta (DE3) pLysS E. coli (New England Biolabs). Cells were grown at 37°C in LB medium complemented with 50 μg/ml kanamycin and 34 μg/ml chloramphenicol to OD600nm 0.6. Expression was induced for 4 h by adding isopropyl β-D-1-thiogalactopyranoside (IPTG) to a final concentration of 1 mM. Cells were harvested by centrifugation (4,000 × g for 20 min at 4°C) and frozen. The cell pellet was resuspended in 1 × Tris-EDTA-sucrose (TES) buffer43 and incubated for 1 hr. The lysate was then diluted by three using 0.25 × TES buffer and incubated for 45 min. Cellular fragments were removed by centrifugation (9200 × g for 1.5 h at 4°C). The supernatant was incubated overnight at 4°C under gentle agitation with Ni-NTA agarose beads in phosphate buffered saline (PBS) (sodium phosphate 50 mM, NaCl 150 mM, pH 7.4) complemented with 10 mM imidazole. Beads were washed with ~20 volumes of PBS containing 20 mM imidazole, and with ~5 volumes of PBS complemented with 40 mM imidazole. His-tagged proteins were eluted with ~5 volumes of PBS complemented with 0.5 M imidazole. The buffer was exchanged to PBS (50 mM phosphate, 150 mM NaCl, pH 7.4) using PD-10 desalting columns. Purity of the proteins was evaluated using SDS-PAGE electrophoresis stained with Coomassie blue.
Physico-chemical Measurements
Steady state UV-Vis absorption spectra were recorded using a Cary 300 UV-Vis spectrometer (Agilent Technologies), equipped with a Versa20 Peltier-based temperature-controlled cuvette chamber (Quantum Northwest) and fluorescence data were recorded using a LPS 220 spectrofluorometer (PTI, Monmouth Junction, NJ), equipped with a TLC50TM Legacy/PTI Peltier-based temperature-controlled cuvette chamber (Quantum Northwest) operated with Felix GX software.
Thermodynamic dissociation constants and quantum yield measurements for HMBR or HBR-3,5DOM were determined as previously described using either FAST:HMBR or FAST:HBR-3,5DOM as a reference7–9. Thermodynamic dissociation constants were determined with a Spark 10M plate reader (Tecan) and fit in Prism 6 to a one-site specific binding model. Quantum yield measurments were determined by reciprocal dilution with protein solution so as to keep the protein concentration constant at 40 μM and varying the concentration only of the protein:fluorogen complex. Absorption coefficients were determined by forward titration of fluorogen into a 40 μM protein solution using FAST as standard for the concentration of the fluorogen solution. Spectra were processed in Spectragryph 1.2.
Selection of labelling conditions
At equilibrium, the fraction of greenFAST:HMBR complex in presence of HMBR and HBR-3,5DOM is
where [HMBR] and [HBR-3,5DOM] are the concentrations of HMBR and HBR-3,5DOM and and are the thermodynamic dissociation constants D,HMBRD,HBR-3,5DOM of the greenFAST:HMBR and greenFAST:HBR-3,5DOM complexes.
The fraction of redFAST:HBR-3,5DOM complex in presence of HMBR and HBR-3,5DOM is
where [HMBR] and [HBR-3,5DOM]are the concentrations of HMBR and HBR-3,5DOM and and are the thermodynamic dissociation constants D,HMBRD,HBR-3,5DOM of the redFAST:HMBR and redFAST:HBR-3,5DOM complexes.
In most experiments, HMBR and HBR-3,5DOM are in excess, and thus, at equilibrium, [HMBR]≈[HMBR]0 and [HBR-3,5DOM]≈[HBR-3,5DOM]0, where [HMBR]0 and [HBR-3,5DOM]0 are the initial concentrations of fluorogens. Thus, from these equations, using the thermodynamic dissociation constants displayed in Table 1, it is possible to estimate the fractions of greenFAST and redFAST correctly labeled with HMBR and HBR-3,5DOM respectively. Accordingly, labeling with a mixture of 5 μM HMBR and 10 μM HBR-3,5DOM gives 99% of greenFAST labeled with HMBR and 95% of redFAST labeled with HBR-3,5DOM.
Note that as long as greenFAST and redFAST fusions have similar expression profiles, the fraction of mislabeled proteins is not an issue as it leads to very little signal. Care should be taken when one of the two fusions is in excess, as in that case mislabeled proteins can generate a signal with similar magnitude as that of the other fusion (correctly labeled).
Mammalian cell culture
HEK 293T and COS-7 cells were cultured in Dulbecco’s Modified Eagle Medium (DMEM) supplemented with phenol red, Glutamax I, and 10% (vol/vol) fetal calf serum (FCS), at 37°C in a 5% CO2 atmosphere. U2OS cells were cultured in McCoy’s 5A medium supplemented with phenol red and 10% (vol/vol) fetal calf serum. For imaging, cells were seeded in μDish IBIDI (Biovalley) coated with poly-L-lysine. Cells were transiently transfected using Genejuice (Merck) or Lipofectamine 2000 (Invitrogen) according to the manufacturer’s protocol for 24 h prior to imaging.
To generate stable cells lines, a kill curve was first determined using G418 (Gibco). Cells were transfected using Lipofectamine 2000 and were exposed to the chosen concentration of G418 after 24 h. The cells were monitored and the media was changed every 24 to 48 h to ensure a constant concentration of G418.
Zebrafish
RedFAST-zGem(1-100)-P2A-greenFAST-zCdt1(1-190) mRNA (choice of fusion pair was arbitrary) was injected at a final concentration of 100 ng/μL in one-cell stage embryos. Starting from 4 to 8-cell stage, chorions were removed manually and embryos transferred in a glass beaker containing mineral Volvic water. HMBR and HBR-3,5DOM were then added to a final concentration of 5 μM (each), and embryos were incubated 30 to 60 min at 28°C in the dark. Experiments were performed using the standard AB wild-type strain. The embryos were incubated at 28°C. Developmental stages were determined and indicated as hours postfertilization (hpf). Fluorogen effect was evaluated by incubating embryos with 5 μM HPAR-3OM during 1 h at 50% epiboly or overnight from 50% epiboly to 24 hpf. Embryos with no defect, axis defects, or dead were scored at 48 hpf by brightfield microscopy. The animal facility obtained permission from the French Ministry of Agriculture for all the experiments described in this manuscript (agreement no. C 75-05-12).
Fluorescence microscopy
Confocal micrographs were acquired on a Zeiss LSM 710 Laser Scanning Microscope equipped with a Plan Apochromat 63×/1.4 NA oil DIC M27 immersion objective or a Plan Apochromat 40×/1.4 NA oil DIC immersion objective, heated stage, and XL-LSM 710 S1 incubation chamber for temperature and CO2 control. Images were acquired using ZEN software and processed in Fiji (ImageJ). Photobleaching measurements were acquired using 2.1 kW/cm2, 3.3 kW/cm2, and 13 kW/cm2 at 488 nm and 4.7 kW/cm2 at 541 nm. In all cases the pixel dwell was 1.27 μsec.
To image the split system, rapamycin was added to a final concentration of 500 nM to monitor the association of the FRB-FKBP homodimer. To measure the dissociation of the FKBP-FKBP homodimer, the cells were first pre-incubated with 100 nM AP1510 for ~2 h then rapamycin was added to a final concentration of 1.1 μM for dissociation. To measure multiple PPIs, the cells were treated in the same way as for the FKBP-FKBP homodimer and the association of the homodimer was either followed by imaging every 5 min or was allowed to incubate and the switch between FKBP-FKBP and FKBP-FRB complex was monitored by the addition of rapamycin.
Fluorescence lifetime imaging was performed using a Leica SP8-X-SMD confocal microscope (Mannheim, Germany) with a 63×/1.4 NA oil immersion objective. HMBR and HBR-3,5DOM were excited at 488 nm and 541 nm, respectively, using a ps-pulsed white light laser tuned at 40 MHz. Time-domain FLIM experiments were performed using a time-correlated single-photon counting system operated by an attached PicoHarp 300 module (PicoQuant, Berlin, Germany). Fluorescence emission was detected using two HyDs in photon counting mode at 470-520 nm and 560-595 nm. At least 1000 photon events per pixel were collected and the lifetime analysis was carried out using SymPhoTime software (PicoQuant, Berlin, Germany).
For SOFI imaging, COS7 cells were plated on glass-bottom 35 mm dishes (P35G-1.5- 4-C, MatTek) and transfected with pcDNA3-lyn-SkylanS29 and MAP4-redFAST using FuGene6 (Promega) according to the manufacturer’s protocol. The following day, cells were washed with 37°C HBSS and imaged in HBSS supplemented with 5 μM HBR- 3,5DOM. The microscope consisted of a Ti2 microscope body carrying a 100× CFI apo TIRF objective (both Nikon) and equipped with a ZT405/488/561/640rpcv2 dichroic and ET525/50m (SkylanS) and ET575lp (redFAST) emission filters (all Chroma). Excitation light was provided by a LBX-488-200-CSB and LBX-405-100-CSB laser operating at 20% and 1%, respectively, for SkylanS and a LCX-561S-100-CSB laser (all lasers Oxxius) operating at 100% for redFAST imaging. The light was fiber-coupled into the microscope body through a manual TIRF module (Nikon) that was aligned in TIRF mode. Images were acquired with a sCMOS camera (Hamamatsu Orca Flash4.0 v2) operating at 50 Hz. We recorded 1000 images in the red channel followed by 1000 images in the green channel. SOFI analysis was performed using the Localizer package44. For both the green and red images, the first 100 images were discarded and SOFI analysis was performed using the last 900 images, using “Few” pixel combinations.
For zebrafish imaging, embryos were embedded in low-melting agarose (0.8%) extemporaneously mixed with 5 μM final of HMBR and HBR-3,5DOM. Fluorogen solution was then added above the jellified agarose. Imaging was performed with a CSU-W1 Yokogawa spinning disk coupled to a Zeiss AxioObserver Z1 inverted microscope equipped with a sCMOS Hamamatsu camera and a 25× (Zeiss 0.8 Imm WD: 0.19mm) oil objective. DPSS 150 mW 491 nm and 100 mW 561 nm lasers were used with their corresponding 525/50 and 595/50 bandpass excitation filters to respectively acquire greenFAST and redFAST signal. Quantification was performed by measuring the nuclear signal on fluorescent cells over time. The background value was subtracted for each channel and values were normalized to the maximum value of each FAST signal.
Extended Data
Extended Data Fig. 1.
Extended Data Fig. 2.
Extended Data Fig. 3.
Extended Data Fig. 4.
Extended Data Fig. 5.
Extended Data Fig. 6.
Extended Data Fig. 7.
Extended Data Fig. 8.
Supplementary Material
Editorial Summary.
The fluorescent chemogenetic reporters greenFAST and redFAST were engineered by protein engineering. They display orthogonal fluorogen recognition and spectral properties allowing efficient multicolor imaging of proteins in live cells and organisms.
Acknowledgement
We thank K. D. Wittrup, for providing us with the pCTCON2 vector and the EBY100 yeast strain for the yeast display selection. We also thank the flow cytometry facility CISA (Cytométrie Imagerie Saint-Antoine) of UMS LUMIC at the Faculty of Medicine of Sorbonne University, and, more particularly, Annie Munier for her assistance. This work has been supported by the European Research Council (ERC-2016-CoG-724705 FLUOSWITCH to A.G., ERC StG 714688 NanoCellActivity to P.D., and ERC-2019- CoG-863869 FUSION to S.P-P.), the Wellcome Trust Core Award (203141 to S.P-P), and the Research Foundation-Flanders (G0B8817N to P.D. and 1514319N to B.M.)
Footnotes
Author Contributions
A.G.T. and A.G. conceived the project. A.G.T., B.M., M. T., M. V., S.P.-P., P. D., S.V. and A.G designed the experiments. A.G.T., B.M., M.T., I.C.A., D.B., M.V. and S.V. performed the experiments. A.G.T, B.M., M.T., I.C.A., M.V., S.P.-P., P.D., S.V. and A.G analyzed the experiments. A.G.T and A.G. wrote the paper with the help of all the authors.
Competing Financial Interests
The authors declare the following competing financial interest: A.G. is co-founder and hold equity in Twinkle Bioscience / The Twinkle Factory, a company commercializing the FAST technology.
Data Availability
All data generated during this study are included in this published article (and its Supplementary Information files) or are available from the corresponding author on reasonable request.
Code Availability
Script for plotting the flow cytometry analysis are available at https://github.com/agtebo/NCB-orthogonal. The Localizer scripts for Igor Pro 8 (SOFI acquisition and treatment) are available on the repository: https://bitbucket.org/pdedecker/localizer/
References
- 1.Tsien RY. Constructing and exploiting the fluorescent protein paintbox (Nobel Lecture) Angew Chem Int Ed Engl. 2009;48:5612–5626. doi: 10.1002/anie.200901916. [DOI] [PubMed] [Google Scholar]
- 2.Grimm JB, et al. A general method to improve fluorophores for live-cell and single-molecule microscopy. Nat Methods. 2015;12:244–250. doi: 10.1038/nmeth.3256. [DOI] [PMC free article] [PubMed] [Google Scholar]
- 3.Los GV, et al. HaloTag: A Novel Protein Labeling Technology for Cell Imaging and Protein Analysis. ACS Chem Biol. 2008;3:373–382. doi: 10.1021/cb800025k. [DOI] [PubMed] [Google Scholar]
- 4.Keppler A, et al. A general method for the covalent labeling of fusion proteins with small molecules in vivo. Nat Biotechnol. 2002;21:86–89. doi: 10.1038/nbt765. [DOI] [PubMed] [Google Scholar]
- 5.Gautier A, et al. An Engineered Protein Tag for Multiprotein Labeling in Living Cells. Chem Biol. 2008;15:128–136. doi: 10.1016/j.chembiol.2008.01.007. [DOI] [PubMed] [Google Scholar]
- 6.Gautier A, Tebo AG. Fluorogenic Protein-Based Strategies for Detection, Actuation, and Sensing. BioEssays. 2018;67:509–10. doi: 10.1002/bies.201800118. [DOI] [PubMed] [Google Scholar]
- 7.Li C, et al. Dynamic multicolor protein labeling in living cells. Chem Sci. 2017;8:5598–5605. doi: 10.1039/c7sc01364g. [DOI] [PMC free article] [PubMed] [Google Scholar]
- 8.Plamont M-A, et al. Small fluorescence-activating and absorption-shifting tag for tunable protein imaging in vivo. Proc Natl Acad Sci U S A. 2016;113:497–502. doi: 10.1073/pnas.1513094113. [DOI] [PMC free article] [PubMed] [Google Scholar]
- 9.Tebo AG, Pimenta FM, Zhang Y, Gautier A. Improved Chemical-Genetic Fluorescent Markers for Live Cell Microscopy. Biochemistry. 2018;57:5648–5653. doi: 10.1021/acs.biochem.8b00649. [DOI] [PubMed] [Google Scholar]
- 10.Tebo AG, Gautier A. A split fluorescent reporter with rapid and reversible complementation. Nat Commun. 2019;10 doi: 10.1038/s41467-019-10855-0. 2822. [DOI] [PMC free article] [PubMed] [Google Scholar]
- 11.Glasgow JE, Salit ML, Cochran JR. In Vivo Site-Specific Protein Tagging with Diverse Amines Using an Engineered Sortase Variant. J Am Chem Soc. 2016;138:7496–7499. doi: 10.1021/jacs.6b03836. [DOI] [PubMed] [Google Scholar]
- 12.Thomas F, et al. De Novo-Designed α-Helical Barrels as Receptors for Small Molecules. ACS Synth Biol. 2018;7:1808–1816. doi: 10.1021/acssynbio.8b00225. [DOI] [PubMed] [Google Scholar]
- 13.Obexer R, et al. Emergence of a catalytic tetrad during evolution of a highly active artificial aldolase. Nat Chem. 2017;9:50–56. doi: 10.1038/nchem.2596. [DOI] [PubMed] [Google Scholar]
- 14.Martínez L, et al. Gaining ligand selectivity in thyroid hormone receptors via entropy. Proc Natl Acad Sci U S A. 2009;106:20717–20722. doi: 10.1073/pnas.0911024106. [DOI] [PMC free article] [PubMed] [Google Scholar]
- 15.Das R, et al. Dynamically driven ligand selectivity in cyclic nucleotide binding domains. J Biol Chem. 2009;284:23682–23696. doi: 10.1074/jbc.M109.011700. [DOI] [PMC free article] [PubMed] [Google Scholar]
- 16.Pessoa J, Fonseca F, Furini S, Morais-Cabral JH. Determinants of ligand selectivity in a cyclic nucleotide-regulated potassium channel. J Gen Physiol. 2014;144:41–54. doi: 10.1085/jgp.201311145. [DOI] [PMC free article] [PubMed] [Google Scholar]
- 17.Brogi S, Tafi A, Désaubry L, Nebigil CG. Discovery of GPCR ligands for probing signal transduction pathways. Front Pharmacol. 2014;5:255. doi: 10.3389/fphar.2014.00255. [DOI] [PMC free article] [PubMed] [Google Scholar]
- 18.Engelowski E, et al. Synthetic cytokine receptors transmit biological signals using artificial ligands. Nat Commun. 2018;9 doi: 10.1038/s41467-018-04454-8. 2034. [DOI] [PMC free article] [PubMed] [Google Scholar]
- 19.Grimm JB, et al. A general method to fine-tune fluorophores for live-cell and in vivo imaging. Nat Methods. 2017;14:987–994. doi: 10.1038/nmeth.4403. [DOI] [PMC free article] [PubMed] [Google Scholar]
- 20.Chen X, et al. Visualizing RNA dynamics in live cells with bright and stable fluorescent RNAs. Nat Biotechnol. 2019;37:1287–1293. doi: 10.1038/s41587-019-0249-1. [DOI] [PubMed] [Google Scholar]
- 21.Philip AF, Nome RA, Papadantonakis GA, Scherer NF, Hoff WD. Spectral tuning in photoactive yellow protein by modulation of the shape of the excited state energy surface. Proc Natl Acad Sci U S A. 2010;107:5821–5826. doi: 10.1073/pnas.0903092107. [DOI] [PMC free article] [PubMed] [Google Scholar]
- 22.Shaner NC, et al. Improved monomeric red, orange and yellow fluorescent proteins derived from Discosoma sp. red fluorescent protein. Nat Biotechnol. 2004;22:1567–1572. doi: 10.1038/nbt1037. [DOI] [PubMed] [Google Scholar]
- 23.Pimenta FM, et al. Chromophore Renewal and Fluorogen-Binding Tags: A Match Made to Last. Sci Rep. 2017;7 doi: 10.1038/s41598-017-12400-9. 12316. [DOI] [PMC free article] [PubMed] [Google Scholar]
- 24.Padilla-Parra S, Audugé N, Tramier M, Coppey-Moisan M. Time-domain fluorescence lifetime imaging microscopy: a quantitative method to follow transient protein-protein interactions in living cells. Cold Spring Harb Protoc. 2015;2015:508–521. doi: 10.1101/pdb.top086249. [DOI] [PubMed] [Google Scholar]
- 25.Dertinger T, Colyer R, Iyer G, Weiss S, Enderlein J. Fast, background-free, 3D super-resolution optical fluctuation imaging (SOFI) Proc Natl Acad Sci U S A. 2009;106:22287–22292. doi: 10.1073/pnas.0907866106. [DOI] [PMC free article] [PubMed] [Google Scholar]
- 26.Dedecker P, Mo GCH, Dertinger T, Zhang J. Widely accessible method for superresolution fluorescence imaging of living systems. Proc Natl Acad Sci U S A. 2012;109:10909–10914. doi: 10.1073/pnas.1204917109. [DOI] [PMC free article] [PubMed] [Google Scholar]
- 27.Moeyaert B, Dedecker P. PcSOFI as a smart label-based superresolution microscopy technique. Methods Mol Biol. 2014;1148:261–276. doi: 10.1007/978-1-4939-0470-9_17. [DOI] [PubMed] [Google Scholar]
- 28.Zhang X, et al. Development of a Reversibly Switchable Fluorescent Protein for Super-Resolution Optical Fluctuation Imaging (SOFI) ACS Nano. 2015;9:2659–2667. doi: 10.1021/nn5064387. [DOI] [PubMed] [Google Scholar]
- 29.Moeyaert B, Vandenberg W, Dedecker P. SOFIevaluator: a strategy for the quantitative quality assessment of SOFI data. Biomedical Optics Express. 2020;11:636. doi: 10.1364/BOE.382278. [DOI] [PMC free article] [PubMed] [Google Scholar]
- 30.Vandenberg W, Leutenegger M, Duwé S, Dedecker P. An extended quantitative model for super-resolution optical fluctuation imaging (SOFI) Opt Express. 2019;27:25749–25766. doi: 10.1364/OE.27.025749. [DOI] [PubMed] [Google Scholar]
- 31.Sakaue-Sawano A, et al. Visualizing Spatiotemporal Dynamics of Multicellular Cell-Cycle Progression. Cell. 2008;132:487–498. doi: 10.1016/j.cell.2007.12.033. [DOI] [PubMed] [Google Scholar]
- 32.Sugiyama M, et al. Illuminating cell-cycle progression in the developing zebrafish embryo. Proc Natl Acad Sci U S A. 2009;106:20812–20817. doi: 10.1073/pnas.0906464106. [DOI] [PMC free article] [PubMed] [Google Scholar]
- 33.Sakaue-Sawano A, et al. Genetically Encoded Tools for Optical Dissection of the Mammalian Cell Cycle. Mol Cell. 2017;68:626–640.e5. doi: 10.1016/j.molcel.2017.10.001. [DOI] [PubMed] [Google Scholar]
- 34.Kimmel CB, Law RD. Cell lineage of zebrafish blastomeres. I. Cleavage pattern and cytoplasmic bridges between cells. Developmental Biology. 1985;108:78–85. doi: 10.1016/0012-1606(85)90010-7. [DOI] [PubMed] [Google Scholar]
- 35.Keller PJ, Schmidt AD, Wittbrodt J, Stelzer EHK. Reconstruction of zebrafish early embryonic development by scanned light sheet microscopy. Science. 2008;322:1065–1069. doi: 10.1126/science.1162493. [DOI] [PubMed] [Google Scholar]
- 36.Olivier N, et al. Cell lineage reconstruction of early zebrafish embryos using label-free nonlinear microscopy. Science. 2010;329:967–971. doi: 10.1126/science.1189428. [DOI] [PubMed] [Google Scholar]
- 37.Mendieta-Serrano MA, Schnabel D, Lomelí H, Salas-Vidal E. Cell Proliferation Patterns in Early Zebrafish Development. Anat Rec (Hoboken) 2013;296:759–773. doi: 10.1002/ar.22692. [DOI] [PubMed] [Google Scholar]
- 38.Langley AR, Smith JC, Stemple DL, Harvey SA. New insights into the maternal to zygotic transition. Development. 2014;141:3834–3841. doi: 10.1242/dev.102368. [DOI] [PubMed] [Google Scholar]
- 39.Erdmann RS, et al. Labeling Strategies Matter for Super-Resolution Microscopy: A Comparison between HaloTags and SNAP-tags. Cell Chem Biol. 2019;26:584–592.e6. doi: 10.1016/j.chembiol.2019.01.003. [DOI] [PMC free article] [PubMed] [Google Scholar]
- 40.Gibson DG, et al. Enzymatic assembly of DNA molecules up to several hundred kilobases. Nat Methods. 2009;6:343–345. doi: 10.1038/nmeth.1318. [DOI] [PubMed] [Google Scholar]
- 41.Gietz RD, Schiestl RH. High-efficiency yeast transformation using the LiAc/SS carrier DNA/PEG method. Nat Protoc. 2007;2:31–34. doi: 10.1038/nprot.2007.13. [DOI] [PubMed] [Google Scholar]
- 42.Duwé S, Vandenberg W, Dedecker P. Live-cell monochromatic dual-label sub-diffraction microscopy by mt-pcSOFI. Chem Commun. 2017;53:7242–7245. doi: 10.1039/c7cc02344h. [DOI] [PubMed] [Google Scholar]
- 43.Pardon E, et al. A general protocol for the generation of Nanobodies for structural biology. Nat Protoc. 2014;9:674–693. doi: 10.1038/nprot.2014.039. [DOI] [PMC free article] [PubMed] [Google Scholar]
- 44.Dedecker P, Duwé S, Neely RK, Zhang J. Localizer: fast, accurate, open-source, and modular software package for superresolution microscopy. J Biomed Opt. 2012;17 doi: 10.1117/1.JBO.17.12.126008. 126008. [DOI] [PMC free article] [PubMed] [Google Scholar]
Associated Data
This section collects any data citations, data availability statements, or supplementary materials included in this article.
Supplementary Materials
Data Availability Statement
All data generated during this study are included in this published article (and its Supplementary Information files) or are available from the corresponding author on reasonable request.
Script for plotting the flow cytometry analysis are available at https://github.com/agtebo/NCB-orthogonal. The Localizer scripts for Igor Pro 8 (SOFI acquisition and treatment) are available on the repository: https://bitbucket.org/pdedecker/localizer/


