Abstract
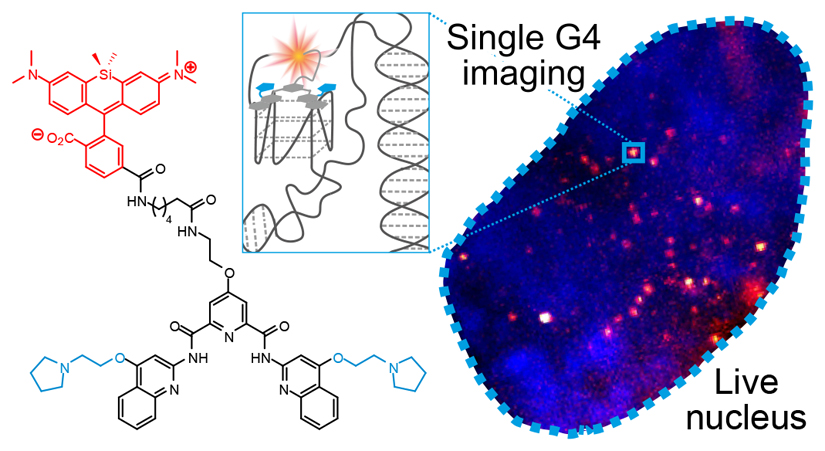
Substantial evidence now exists to support that formation of DNA G-quadruplexes (G4s) can alter gene-expression. However, approaches that allow to probe G4s in living cells without perturbing their folding dynamics are required to understand their biological roles in greater detail. Herein, we report a G4-specific fluorescent probe (SiR-PyPDS) that enables single-molecule and real-time detection of individual G4 structures in living cells. Live-cell single-molecule fluorescence imaging of G4s was carried out under conditions that use low concentrations of SiR-PyPDS (20 nM) to provide informative measurements representative of the population of G4s in living cells, without globally perturbing G4 formation and dynamics. Single-molecule fluorescence imaging and time-dependent chemical trapping of unfolded G4s in living cells, revealed that G4s fluctuate between folded and unfolded states. We also demonstrated that G4-formation in live cells is cell-cycle dependent and disrupted by chemical inhibition of transcription and replication. Our observations provide robust evidence in support of dynamic G4-formation in living cells.
G-quadruplexes (G4s) are non-canonical structures that can form within guanine-rich nucleic acid sequences (Fig. 1a)1,2. Sequencing of G4s in human genomic DNA (G4-Seq) revealed over 700,000 distinct sites that can form G4s, with notable G4-enrichment within gene promoters and at loci commonly amplified in cancers3. G4 structures have also been imaged ex vivo by immunofluorescence with G4-selective antibodies, both in fixed ciliates4 and, more recently, in fixed human cells5. The G4-selective antibody BG4 has been used in chromatin immuno-precipitation followed by sequencing (ChIP-Seq), showing that just ~1% of the G4s identified in purified DNA by G4-Seq could be detected within chromatin6. ChIP-Seq experiments rely on measurements integrated over millions of cells and therefore provide only an average view of G4-incidence at a given genomic loci. However, G4 homeostasis in cells is likely to be regulated by proteins, such as helicases, so ex vivo techniques that provide a snapshot of G4 distribution may hide important dynamic processes that can only be observed by live-cell imaging. Fluorogenic G4-binding probes for the detection of both RNA7,8 and DNA9,10 G4s in living cells have been reported. Generally, such probes are used at relatively high (μM) concentrations which can result in global induction of G4-structures, perturbation of endogenous G4-folding dynamics and cellular stress/toxicity through binding to G4s globally. Furthermore, some observational approaches require environmentally responsive probes which can pose limits on the quantitative study of specific G4-formation as well as the challenge of disentangling genuine G4-binding from environmental effects. We have pursued single-molecule fluorescence imaging of G4s in living cells to detect individual G4s in the nucleus of living cells at low nanomolar concentrations of fluorescent probe. The use of a G4-specific probe SiR-PyPDS (1) and a control probe SiR-iPyPDS (2), with poor affinity to G4s, together with ligand competition experiments, confirmed G4s specificity. Relatively low probe concentrations (nM) helps avoid global induction of G4s inherent in ensemble fluorescence methods. Specifically, only a small fraction (~4%) of G4s are bound by the probe, without perturbing global folding dynamics. Herein we report, for the first time, detection of individual G4s in the nucleus of living human cells by single-molecule fluorescence microscopy.
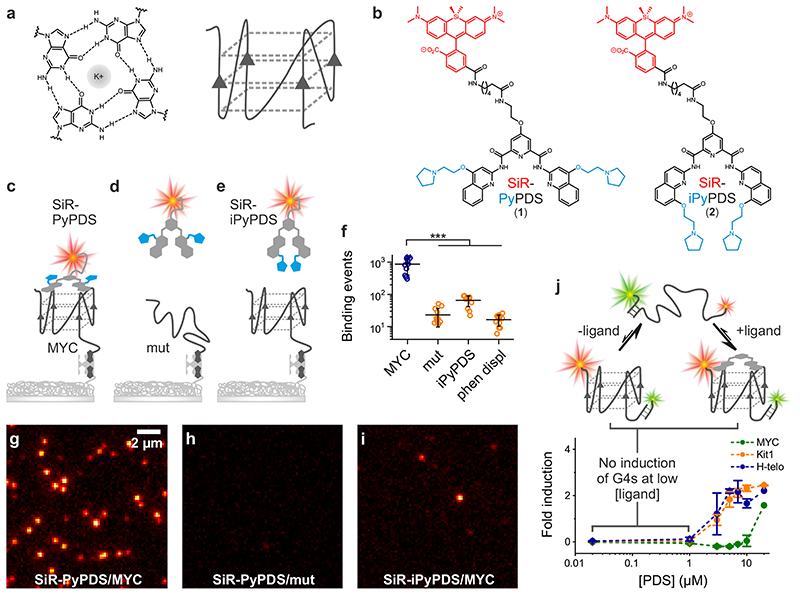
Figure 1. In vitro single-molecule fluorescence imaging of G-quadruplexes.
(a) Schematic representation of a G-tetrad (left) and a G4 structure (right). (b) Chemical structure of the selective G4-fluorogenic ligand SiR-PyPDS (1) and its inactive isomer, SiR-iPyPDS (2). (c) Schematic of methodology used for visualizing individual G4s. Pre-folded G4 MYC is attached to a coverslip via a biotin-neutravidin linker. The fluorescent G4-probe SiR-PyPDS (1) binds to G4 MYC, which can be visualized using single-molecule fluorescence imaging. (d) SiR-PyPDS will not bind single stranded mutated-MYC that cannot form a G4. (e) The inactive isomer SiR-iPyPDS (2) with its 10 times reduced binding affinity is less likely to bind G4 MYC. (f) Quantification of SiR-PyPDS (1) binding to the G4 MYC ii) SiR-PyPDS (1) binding to the mutated-MYC; iii) SiR-iPyPDS (2) binding to the G4 MYC; iv) SiR-PyPDS (1) binding to the G4 MYC in the presence of 10 μM unlabeled PhenDC3 competitor. Error bars indicate mean ± sd. *** P < 10-5, unpaired two sided t-test, n = 12 measurements form 3 independent replicates. (g) Representative images (500 ms exposure) of individual SiR-PyPDS (1) molecules (250 pM) binding to a surface coated with pre-folded MYC G4 oligonucleotide; individual fluorescent puncta indicate binding of single SiR-PyPDS (1) molecules. (H) SiR-PyPDS (1) (250 pM) binding to mutated-MYC. (i) SiR-iPyPDS (2) (250 pM) binding to pre-folded MYC. Experiments g-i were repeated 3 times independently with similar results. (j) Interactions of G4 ligands and G4s can alter the equilibrium between unfolded and folded G4s. Error bars indicate mean ± sd. n = 12 measurements, from 3 independent replicates. Changes in the FRET ratio can be observed at μM PDS concentrations for c-KIT1 and hTelo and larger concentrations for MYC, indicative of G4 induction, which does not occur at lower concentrations.
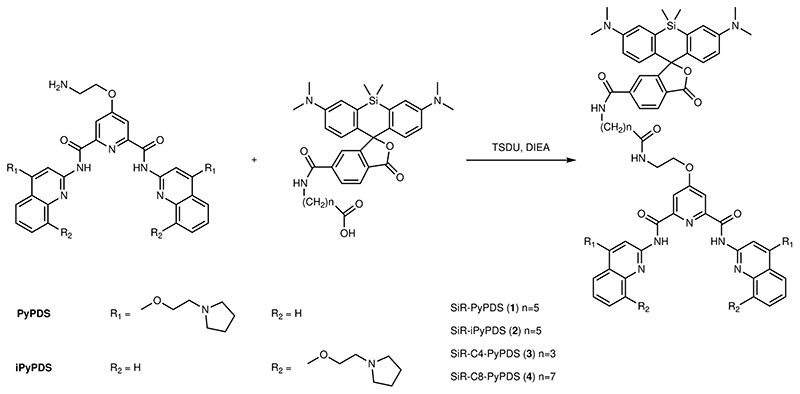
SiR-PyPDS (1) (Fig. 1b) was prepared by tethering the red fluorophore Silicon-Rhodamine (SiR)11 to an analogue of an established G4-ligand, pyridostatin12 (PyPDS), using linkers of different lengths (Extended Data Fig. 1). Upon binding to G4-folded oligonucleotides all SiR-PyPDS analogues (1, 3 and 4) (Supplementary Fig. 1) displayed a modest fluorescence increase (~4-fold), which is insufficient to confidently discriminate bound vs unbound probes in cells, but enabled evaluation of optimal linker length by fluorescence titrations. Binding titrations revealed the six carbon linker of SiR-PyPDS (1) (Fig. 1b) as being optimal for G4-binding selectivity of the PyPDS-scaffold, with good binding towards MYC, c-KIT1 and h-TELO G4s with Kd values of 0.63 (± 0.08) μM, 1.0 (± 0.1) μM and 2.0 (± 0.8) μM respectively, and no detectable binding to double- or single-stranded DNA (Supplementary Fig. 2). SiR-PyPDS (1) exhibited a quantum yield of 0.05 in solution that increases to 0.2 when the molecule is bound to MYC G4 (see Methods). We also designed and synthesized a novel PyPDS isomer (SiR-iPyPDS (2), Fig. 1b) that could act as a poor-G4 binding control in live cells experiments to support unambiguous identification of G4-binding events of SiR-PyPDS. Our control analogue SiR-iPyPDS (2) differs from SiR-PyPDS (1) simply for the position of the amino side-chains on the quinoline ring. We reasoned that the steric clash of the side-chains in SiR-iPyPDS (2) could prevent the molecule from adopting the flat conformation required for G-tetrad recognition. Fluorescence titrations confirmed a more than 10-fold lower G4-binding affinity of SiR-iPyPDS (2) compared to SiR-PyPDS (1) (Supplementary Fig. 3).
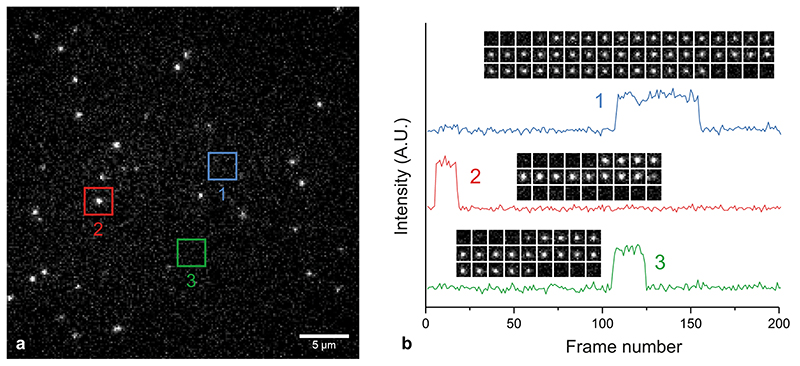
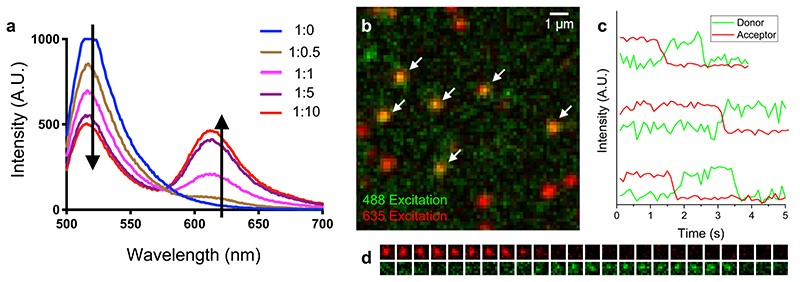
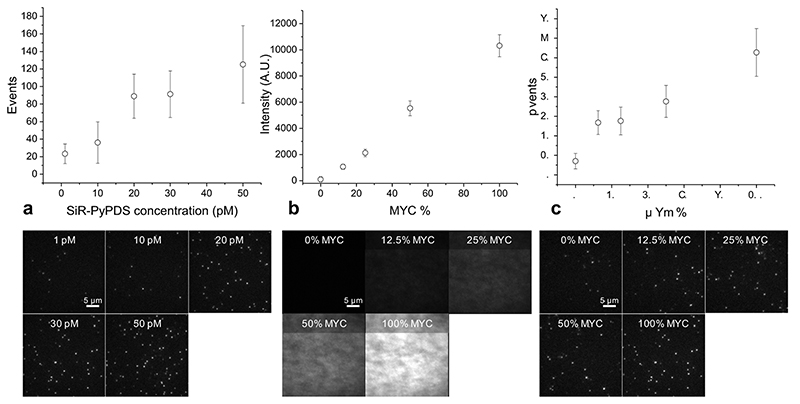
Given the promising results from ensemble binding experiments by SiR-PyPDS (1) and the negative control analogue SiR-iPyPDS (2), we decided to evaluate the suitability of these probes for single-molecule detection of G4s in vitro. To test this, we investigated the binding of SiR-PyPDS (1) or SiR-iPyPDS (2) to a G4-folded oligonucleotide, MYC, immobilized on a PEG/biotin-coated surface, by single-molecule imaging (Fig. 1c-e). We acquired images with a long exposure time (500 ms) to capture only relatively long-lived interactions. At a much lower ligand concentration than what was used in ensemble experiments (250 pM), we could detect on average 867 long-lived SiR-PyPDS (1) spots (Fig. 1f, Supplementary Video 1) in each field of view (Fig. 1g), but observed a ten-fold reduction in long-lived binding (66 events, P = 5×10⁻⁶) for the weaker G4 binder SiR-iPyPDS (2) (Fig. 1i, Supplementary Video 1). We confirmed that events represented binding of individual probes to MYC by observing single-step photobleaching (Extended Data Fig. 2). As the MYC sequence was also labelled with Alexa Fluor 488 we could use both FRET and single-molecule FRET (Extended Data Fig. 3) to visualize direct binding of our probe to MYC. Note that at 250 pM, the labelled fraction, θ, of G4s is about 0.05%, according to the Hill-Langmuir equation θ = [L]/(Kd+[L]), where [L] is the concentration of ligand and Kd is the dissociation constant for ligand binding to G4s. To further investigate if the number of SiR-PyPDS (1) binding event correlates with the density of G4 targets immobilized on the surface, we varied the surface coverage by mixing the biotinylated MYC G4 with a biotinylated single-stranded DNA strand that does not form a G4, at different ratios (see Methods). We observed a linear relationship between the number of SiR-PyPDS (1) binding events detected and the concentration of MYC G4 immobilised on the surface, confirming that the number of binding events is proportional to the number of G4s on the surface (Extended Data Fig. 4) and that this number can be used as a proxy for G4-density. We have also confirmed that the MYC sequence used is folded into a G4 structure as judged by circular dichroism spectroscopy (Supplementary Fig. 4). The observed number of binding events can therefore be used to assess the concentration of folded G4s on the surface. We next compared the binding of SiR-PyPDS (1) and SiR-iPyPDS (2) to different G4-folding oligonucleotides, including MYC, h-TELO and c-KIT1. Again, we observed a >20-fold increase in the number of binding events for SiR-PyPDS (1) when compared to the control probe SiR-iPyPDS (2) (Supplementary Fig. 5). These observations confirm that SiR-PyPDS (1) can be applied to single-molecule imaging of G4s and that the decreased binding affinity of the control analogue SiR-iPyPDS (2) causes a lower number of binding events observed.
To further validate that long-lived binding events observed with SiR-PyPDS (1) could be ascribed as G4-specific, we attempted to compete out SiR-PyPDS (1) binding to MYC G4 with an excess of the structurally unrelated G4-binding ligand PhenDC313. Gratifyingly, binding of SiR-PyPDS (1) to MYC was abrogated when an excess (10 μM) of the potent G4-ligand PhenDC3 was included as a competitor (16 events, P = 2×10⁻⁶, Fig. 1f, Supplementary Video 2). Furthermore, we measured the number of binding events displayed by SiR-PyPDS (1) when the G4-folding sequence of MYC was mutated to prevent G4-formation. SiR-PyPDS (1) binding was negligible (23 events, P = 2×10⁻⁶) for the immobilized single-stranded DNA control (MYC-mut, Fig. 1f, Supplementary Video 1), which is in agreement with what was observed for SiR-PyPDS (1) ensemble fluorescence titrations (Supplementary Fig. 2). Both the biotin-MYC and MYC-mut used in this experiment were also functionalized with an Alexa-488 fluorophore. We used the 488 emission to measure the total fluorescence on each coverslip functionalised with either MYC or MYC-mut to ensure comparable density of oligonucleotides on the surface between the different experiments (σ = 10% variation between coverslips, Extended Data Fig. 4). Therefore, differences observed in binding events were minimally affected by variations in G4 surface coverage, confirming the suitability of SiR-PyPDS (1) and SiR-iPyPDS (2) control as probes for the single-molecule detection of G4s.
We next sought to determine whether the conditions of relatively low probe concentrations used for single-molecule imaging caused global induction of G4-folding or perturbation of G4-folding dynamics. To investigate this, we used G4-folding oligonucleotides (MYC, h-TELO and c-KIT1) labelled with a Cy5 fluorophore at their 5’ end and having an overhang hybridised with a complementary oligonucleotide sequence containing a Cy3 fluorophore at its 3’ end. The oligonucleotides form a Cy3-Cy5 FRET system capable of assessing the fraction of folded G4s by measuring FRET efficiency between the two fluorophores14. When titrated with increasing concentrations of PyPDS, no significant FRET perturbation was observed for PyPDS concentrations below 3 μM (Extended Data Fig. 5). Therefore, there is no detectable global induction of G4s when imaging under low nanomolar concentrations (Fig 1j). We studied G4-unfolding dynamics using a FRET system with FAM/TAMRA labelled oligonucleotides that were annealed in 150 mM K+ to form a stable G4 structure (see Methods). We next added a 10-fold molar excess of DNA sequence complementary to the G4-folding sequence to irreversibly trap the unfolded G4 sequence as dsDNA. This allowed us to measure the unfolding kinetics by monitoring a concomitant decrease in the FRET fluorescence signal, as previously described14. We found that μM concentrations of SiR-PyPDS (1) are required to slow down the unfolding rate for the tested G4s structures and that low nM concentrations used for single-molecule experiments do not globally affect the unfolding rate of the tested G4-structures (Extended Data Fig. 6). Our data demonstrate that single-molecule imaging can be used to address the pervasive problem of current G4-detection strategies that use relatively high concentrations of affinity probes that might globally perturb G4 folding and dynamics.
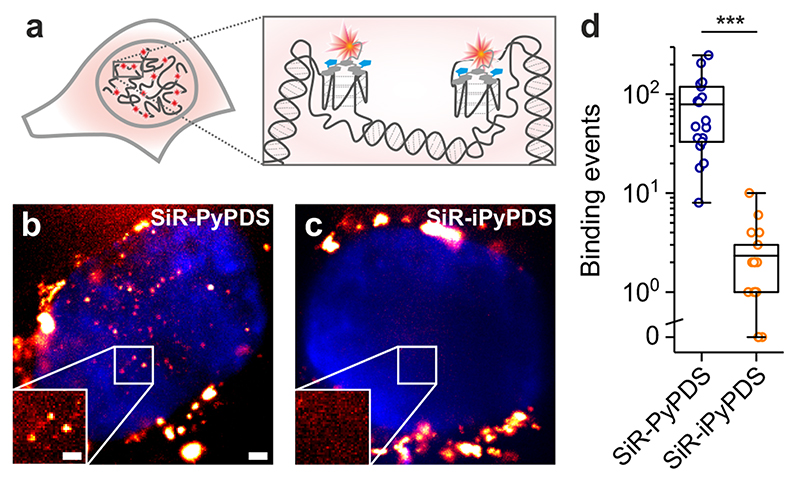
We next applied the fluorescent G4-ligands to single-molecule imaging of G4s in live cells (Fig. 2a). First, we investigated the toxicity of SiR-PyPDS (1) and SiR-iPyPDS (2) in U2OS cells over a 24 h treatment at different probe concentrations. Both SiR-PyPDS (1) and SiR-iPyPDS (2) did not elicit any cell death response at nM concentrations, as toxicity could only be observed at concentrations higher than 10 μM (Supplementary Fig. 6). Based on this, U2OS cells were treated for 30 min with 20 nM of SiR-PyPDS (1), which resulted in under-labeling of G4s at a density where individual fluorophores were spatially well separated (Fig. 2b). This allowed us to visualize individual probes (SiR-PyPDS (1) or SiR-iPyPDS (2)) binding to targets in the nucleus (Fig. 22-c, Supplementary Video 3) using single-molecule imaging (400 frames taken with 100 ms exposure using highly inclined laminated optical sheet (HILO) microscopy)15. Single step photobleaching provided evidence of binding events by individual probe molecules in the nucleus (Extended Data Fig. 7), in spite of the extra-nuclear lysosomal accumulation of SiR-PyPDS (1) (Extended Data Fig. 8). We first measured the number of binding events whereby a SiR-PyPDS (1) molecule remained stationary within a 300 nm radius for three or more consecutive frames (i.e. 300 ms), detecting an average of 79 binding events per nuclei over 40 s of imaging (Fig. 2d). Similarly to what was observed in vitro, treatment of U2OS cells with SiR-iPyPDS (2) (20 nM) revealed an average of only 2 long-lived binding events in the nucleus (Fig. 2d). To confirm that differences in the number of nuclear binding events between SiR-PyPDS (1) and SiR-iPyPDS (2) were not due to different cellular uptake of the two ligands, we used confocal microscopy and demonstrated that upon 10 μM ligand treatment the total nuclear fluorescence intensity measured was comparable between the SiR-PyPDS (1) and SiR-iPyPDS (2) treatments (Extended Data Fig. 9). These results are consistent with the in vitro observations (Fig. 1f) and corroborate the hypothesis that long-lived SiR-PyPDS (1) binding events could be ascribed to specific G4-binding in cells. To further support this hypothesis, we demonstrated that SiR-PyPDS (1) binding could be abrogated in the presence of 10 μM of the unlabeled competitor G4-ligands PDS12 or PhenDC313 (Extended Data Fig. 10, Supplementary Video 4), which is also consistent with what was observed in vitro.
Figure 2. Single-molecule fluorescence imaging of G-quadruplexes in living cells using the fluorescent probe SiR-PyPDS (1).
(a) Schematic of G4s in the cell nucleus with a zoom-in showing G4s stained by SiR-PyPDS (1). (b) Representative background-subtracted image (max projection of 100 frames with 200 ms exposure) of SiR-PyPDS (1) binding events in a living U2OS cell treated with 20 nM SiR-PyPDS (1) for 30 min before imaging; fluorescent puncta indicate binding of single SiR-PyPDS (1) molecules. Blue color corresponds to nuclear staining with Hoechst 33342. Scale bar is 2 μm. Inset scale bar is 1 μm. (c) Representative image of SiR-iPyPDS (2) staining in living U2OS cell treated with 20 nM SiR-PyPDS (1) for 30 min before imaging. Experiments b-c were repeated 3 times independently with similar results. (d) Quantification of the binding events within the nucleus lasting more than one frame (100 ms per frame) per cell for SiR-PyPDS (1) and SiR-iPyPDS (2). Center lines indicate the median; boxes show interquartile range; whiskers denote 5th and 95th percentiles. *** P = 3.5×10⁻⁷, two-sided Mann-Whitney U-test, n = 18 measurements from 6 cells each time in 3 independent replicates.
We next sought to estimate the fraction of G4-labelled by SiR-PyPDS (1) in living cells as we have done for the in vitro studies. To do so, we have assumed that the Kd of SiR-PyPDS (1) remains unchanged in the cellular environment and that the nuclear concentration of the probe is 20 nM. Based on these assumptions and using the relationship [L]/(Kd+[L]), the fraction of labelled G4s on a single U2OS cells is around 4%. Using this value for labelled G4 fraction, we have roughly estimated the total number of G4s present in a single cell. As we detect about 10 binding events on average in an image frame within a single focal plane (~1μm), there would be around 100 binding events in an entire U2OS nucleus of diameter ~10 μm. Therefore, considering we are labelling around 4% of the total number of targets, we can estimate a total number of G4s in a single cell of ~3000, which is in line with what has been detected in human chromatin (between 1,000 and 10,000 G4s) by G4-ChIP-Seq experiments.6
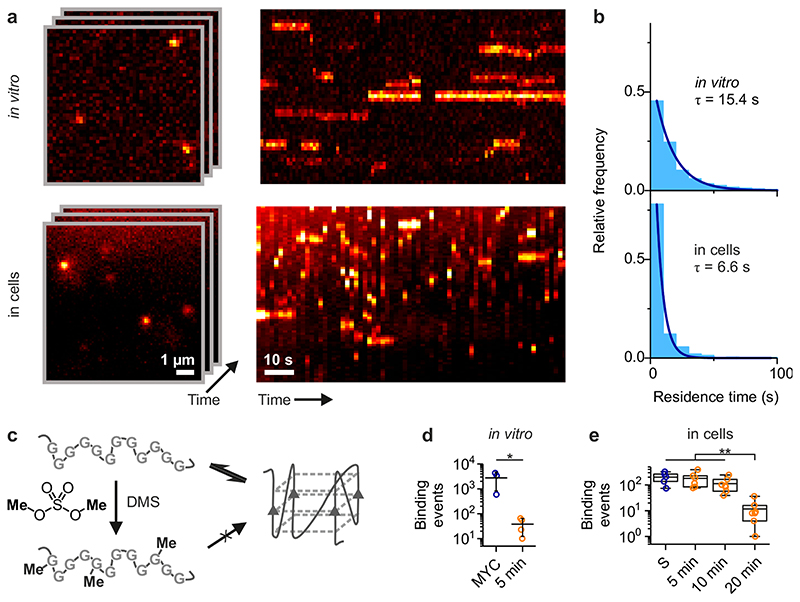
We then compared the temporal dynamics of the interaction between SiR-PyPDS (1) and G4s in vitro and in cells, to investigate if characteristic dwell times of SiR-PyPDS (1) binding to G4s in vitro could also be detected in cells. Time-lapse imaging was used to observe long-lived events (Fig. 3a, Supplementary Video 5). In vitro, an exposure time of 100 ms and interval of 2 s was used to avoid photobleaching effects (time constant τb = 923 s), whereas for cellular experiments a slightly longer interval (3 s, τb = 104 s) and also a longer exposure time (500 ms) were needed to limit contributions from unbound ligands16. The histogram of SiR-PyPDS (1) dwell times could be well fitted (R2 > 0.99) to a single exponential distribution, yielding a photobleaching-corrected binding lifetime of 6.6±0.5 s in cells (Fig. 3b), which is significantly shorter (~2.5-fold, P = 4×10⁻⁷, unpaired t-test) than that observed in vitro for binding (15.4±0.6 s) to MYC G4. To investigate further this apparent discrepancy, we carried out in vitro binding experiments with other G4-forming sequences. These experiments indicated that the dwell times for SiR-PyPDS (1) binding to hTelo and c-KIT1 were respectively 2.5 and 2 times shorter than MYC and were comparable to dwell times observed in living cells. These experiments suggested that the binding dynamics of SiR-PyPDS (1) to synthetic G4-forming oligonucleotides observed in vitro can be recapitulated in cells, further supporting that our assay can detect endogenous G4s.
Figure 3. G-quadruplexes in living cells undergo dynamic folding/unfolding.
(a) Single-molecule time-lapse imaging of SiR-PyPDS (1) in vitro (top) and in cells (bottom). Individual images from the time-lapse stack are shown on the left and kymographs on the right show the dynamic binding kinetics of SiR-PyPDS (1) to G4s. Experiments were repeated 3 times independently with similar results. (b) The histograms of dwell times for each experiment (3 positions on a cover slip for in vitro and 6 cells for the cell experiment) were fitted with a single-exponential fit to determine the binding lifetime in each condition. (c) Schematic of DMS-meditated chemical trapping of unfolded G4s. (d) Quantification of G4-binding events for untreated and 600 mM DMS-treated G4 MYC for 20 min. Error bars indicate mean ± sd. * P = 0.05, two-sided Mann-Whitney U-test. n = 3 (MYC) and n = 4 (DMS) measurements taken from 3 independent replicates. (e) Quantification of G4-binding events detected in living cells upon increased exposure to DMS (20 mM), showing a clear time-dependent depletion of G4s. Center lines indicate the median; boxes show interquartile range; whiskers denote 5th and 95th percentiles. ** P < 0.01, two-sided Mann-Whitney U-test. n = 5, 6, 7 and 8 cells for untreated, 5 min, 10 min and 20 min respectively, taken from 3 independent replicates.
To gain insight into G4-folding dynamics in living cells, we employed the DNA-methylating agent dimethyl-sulfate (DMS) to irreversibly trap the unfolded G4 state (Fig. 3c). The nucleophilic N7 atoms of guanines are exposed and can be methylated by DMS in single- and double-stranded DNA, but are protected in folded G4s by their participation in Hoogsteen hydrogen bonding (Fig 1A). Thus, transiently unfolded G4s can be methylated and irreversibly prevent further G4 re-folding by blocking Hoogsteen hydrogen bonding at N7s (Fig. 3c). First, we demonstrated that DMS could trap the unfolded G4 state in vitro by quantifying binding events of SiR-PyPDS (1) with MYC prior to (300 events) and after (40 events, P = 0.03) 20 min treatment with 640 mM (8%) DMS over 30 s of imaging (Fig. 3d). We then examined if a similar DMS-dependent G4 depletion could be recapitulated in living cells, while keeping the DMS concentration lower (20 mM, 0.25%) to prevent cell death. We observed a time-dependent decrease of SiR-PyPDS (1) binding events in U2OS cells within minutes after DMS treatment (Fig 3e, Supplementary Video 6), with a ~20-fold reduction (P = 0.006) in binding events after 20 min exposure. These results suggest that G4s naturally undergo structural fluctuations in cells. This, in turn, makes their specific detection by chemical methods, such as DMS-Seq17, ineffective, as they will inevitably trap the unfolded state (Fig. 3c).
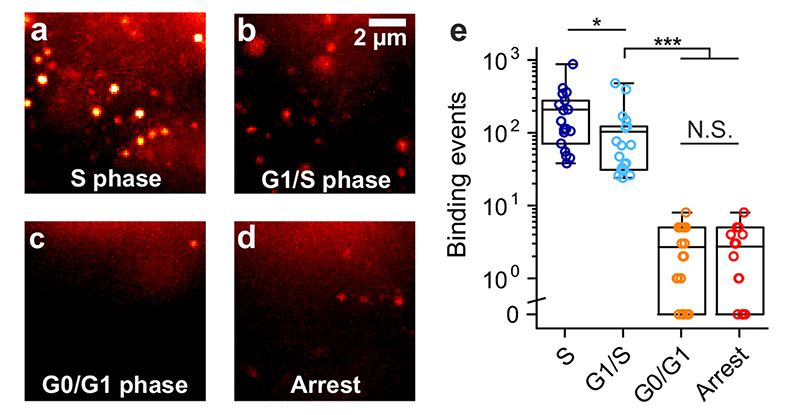
We further probed dynamic formation of G4s in live U2OS cells through different phases of the cell cycle to gain insights into changes in G4 prevalence during active DNA processing states, such as replication (S phase) and transcription (G1 phase). We first confirmed using confocal microscopy that under different conditions tested there were negligible differences in uptake of the fluorescent G4 ligand (Extended Data Fig. 9). This ensured that the lack of binding events observed under certain cycle phases or after DMS treatment could be confidently ascribed to a change in G4 prevalence. SiR-PyPDS (1) treated U2OS cells were synchronized to S, G1/S and G0/G1 phases using previously reported procedures4 and imaged using single-molecule fluorescence microscopy. During S phase, where the cell is undergoing active replication, significant (P < 10-6) binding events could be detected over 40 s of imaging (208 events, Fig. 4a, Supplementary Video 7). The number of binding events was slightly reduced (103 events, P = 0.01) when cells are preparing to initiate replication (G1/S phase) and transcription is active (Fig. 4b, Supplementary Video 7). There were negligible (P < 10-6) binding events during G0/G1 phase over 40 s of imaging (3 events, Fig. 4c, Supplementary Video 7), where cellular processes are quiescent. These results show that G4 formation is associated with both transcription and replication and is in agreement with previous observations reported in fixed cells4,18. To further confirm the suppression of G4s in the absence of actively processed DNA, we treated unsynchronized U2OS cells with a global replication inhibitor aphidicolin and also the global transcription inhibitor DRB as previously described17, in order to mimic the quiescent state that characterizes cells undergoing G0 phase. Upon transcription and replication arrest few binding events were detected over 40 s of imaging (3 events, P < 10-6), further demonstrating that actively processed DNA is pivotal for G4 formation in living cells (Fig. 4c-d, Supplementary Video 7).
Figure 4. The observation of G4s in live cells is altered by the cell cycle phase and transcription.
Representative single-molecule images of G4-binding events are shown for synchronized U2OS cells in (a) the S phase, (b) the G1/S phase, (c) the G0/G1 phase and (d) for unsynchronized cells treated with both the transcriptional inhibitor DRB and the replication inhibitor Aphidicolin. Experiments a-d were repeated 3 times independently with similar results. (e) Quantification of binding events lasting more than two frames (100 ms per frame) per cell in living U2OS cells at different cell-cycle phases and after transcription/replication arrest. Center lines indicate the median; boxes show interquartile range; whiskers denote 5th and 95th percentiles. *** P < 10-6, * P = 0.01, N.S P = 0.99, two-sided Mann-Whitney U test. n = 18, 19, 19 and 15 cells for S, G0, G1 and Arrest respectively, taken from 3 independent replicates.
We have used fluorescent probe molecules to visualise individual G4 structures in living cells, for the first time, using single-molecule fluorescence imaging. The sensitivity of single-molecule methods enabled us to image single binding events to G4 structures at probe concentrations orders of magnitude lower than normally used in biophysical and cellular experiments, thereby minimizing global perturbation of G4s. We applied our new imaging platform to demonstrate that G4 formation is cell-cycle dependent and that the presence of G4s is directly related to fundamental biological processes such as active transcription and replication, as chemical inhibition of these processes led to abrogation of detectable G4s in living cells. Trapping of unfolded G4s by means of DMS methylation revealed that G4s undergo dynamic fluctuations in live cells and that essentially all G4s are trapped in the unfolded state during the course of 20 min DMS treatment (0.25%, 20 mM). We anticipate that further application of this imaging platform will help unravel specific biological functions regulated by individual G4s within the human genome in real-time.
Methods
Detailed synthetic protocols and purification methodologies for the preparation of SiR-PyPDS (1), SiR-iPyPDS (2), SiR-C4-PyPDS (3) and SiR-C8-PyPDS (4), biophysical methods and more detailed protocols are described in supporting information.
Fluorescence titrations
Before every experiment, individual fresh 25 μM solutions of oligo (MYC, hTelo, c-KIT1, MYC-mutant and dsDNA) and a 200 nM solution of SiR-PyPDS (1) or SiR-iPyPDS (2) were prepared in the assay buffer (100 mM KCl and 50 mM KH2PO4, pH 7.4). Oligonucleotides were annealed by heating the solution in buffer at 95 °C for 10 min followed by slow cool down at room temperature. Annealed Oligos were then preserved at 4 °C overnight before being used for fluorescence titrations.
In a typical experiment 50 μL of a 25 μM oligo solution was placed in a 96-well black plate and diluted (1:1) through 11 of the 12 wells of the plate row. No oligo was added in the last well to act as negative control. Successively, 50 μL of the 200 nM SiR-PyPDS (1) analogue solution was added to every well. The wells were sealed with an adhesive foil, covered with aluminium foil and placed on an orbital plate shaker for gentle agitation at room temperature for 2 h. End-point fluorescence at 633 nm of each well was measured on a fluorescence plate reader (BMG PHERAstar Plus). The data are plotted as ratio of the fluorescence intensity emission of each SiR-compound (100 nM) measured at 633 nm at every titration point over the fluorescent emission measured at 633 nm for the same SiR-analogue (100 nM) in buffer only and normalised to the highest fluorescence emission value measured per oligonucleotide studied, which defines 100% molecule bound. Measurements were performed in triplicates.
Spectroscopic characterisation of SiR-PyPDS
20 μM SiR-PyPDS (1) solution was prepared in K+ buffer (50 mM KH2PO4, 100 mM KCl, 58 mM LiOH, pH 7.4) and its absorbance and fluorescence spectra were measured. Serial dilution and measurement cycles were repeated down to 0.63 μM concentration of SiR-PyPDS (1). Myc oligo was diluted to 10 μM solutions in K+ buffer and annealed at 95 °C for 10 min, then slowly cooled to room temperature and stored at 4 °C. 10 μM SiR-PyPDS (1) was prepared in K+ buffer with 10 μM Myc oligo and absorbance and fluorescence of the solution was measured. Serial dilution of SiR-PyPDS (1) and measurement cycles were repeated down to 1.3 μM concentration of SiR-PyPDS (1), keeping Myc oligo concentration constant at 10 μM.
Fluorescence excitation and emission spectra were recorded on Duetta Fluorescence and Absorbance Spectrometer from Horiba scientific at room temperature. Absorption was measured in 300-800 nm interval with 1 nm step size and 1 nm bandwidth. Fluorescence spectra were recorded by exciting at 625 nm and measuring 630-800 nm range with 5 nm excitation slit, 5 nm emission slit.
The fluorescence quantum yield (Φ) of SiR-PyPDS (1) and SiR-PyPDS (1) bound to Myc G4 was determined via the following model:
Where ΦR is the fluorescence quantum yield of Cresyl Violet, which was used as a standard. I and IR are the fluorescence intensities of SiR and Cresyl Violet respectively. A and AR are the absorbances of SiR and Cresyl Violet respectively. n is the refractive index of the K+ buffer used for SiR (1.33) and nR is the refractive index of ethanol (1.36).
SiR-PyPDS analogues G4-binding comparison
To compare the fluorescence “light-up” of the different SiR-PyPDS analogues (1, 3 and 4), we measured the fluorescence emission of SiR in the presence of different G4 folded oligonucleotides. In a typical experiment the fluorescence intensity at 633 nm was measured in presence of SiR-compunds and G4-oligo at final concentrations of 100 nM and 10 μM, respectively. The experiments were performed in 96-well black plate with a total volume of 100 μL and conducted in triplicates. The wells were sealed with an adhesive foil cover, covered with aluminum foil and placed on an orbital plate shaker for gentle agitation at room temperature for 2 hr. End-point fluorescence at 633 nm of each well was measured on a fluorescence plate reader (BMG PHERAstar Plus). The data are plotted as ratio of the fluorescence intensity emission of each SiR-compound (100 nM) measured at 633 nm in the presence of 10 μM G4-oligos (c-Myc, hTelo and c-KIT1), over the fluorescent emission measured at 633 nm for the same SiR-analogue (100 nM) in buffer only. Experiments were performed in triplicates.
G4 unfolding kinetics
Stock solutions of 2 μM FRET H-telo and c-KIT1 oligonucleotides and 20 μM H-telo and c-KIT1 complementary oligonucleotides were prepared separately in K+ buffer (50 mM KH2PO4, 100 mM KCl, 58 mM LiOH, pH 7.4) and annealed at 95 °C for 10 min, then slowly cooled to room temperature and stored in the dark at 4 °C. The samples were then mixed and excited at 493 nm wavelength via 5 nm excitation slit and emission was measured at 518 nm via 5 nm emission slit. Detector voltage was 570 V for H-telo FRET oligo and 650 V for c-KIT1 oligo. Data points were taken every 2 min for 20 h with 5 s of read averaging. Kinetic runs were initiated by mixing 50 μL of 2 μM FRET oligo with 50 μL of 20 μM complimentary trap oligo at t = 0 min and oligo unfolding progression was followed by the increase of FAM fluorescence signal at 518 nm. Kinetics data was recorded using Cary Kinetics software and analysed using Prism. Kinetics curves were fitted with a two-phase association model.
G4-induction measurements
Stock solutions of FRET2 H-telo, FRET2 Myc and FRET2 c-KIT1 at 1 μM were mixed with FRET2 comp overhang Cy3 oligo (see Supplementary Table 1) in 10 mM Tris buffer and annealed at 95 °C for 10 min, then allowed to cool to room temperature and stored at 4 °C overnight. The samples were excited at 540 nm wavelength via 5 nm excitation slit and emission was measured at 550-750 nm via 5 nm emission slit. Detector voltage was set to 600 V. H-telo, Myc and c-KIT1 FRET systems at 1 μM concentration were studied by titrating in PyPDS from a concentrated stock solution in water followed by fluorescence measurement. Data was analysed using Prism software. Fold induction was calculated according to the following formula:
Where F(Cy5)i and F(Cy3)i denotes respective dyes fluorescence intensity peak maximum at a particular PDS concentration.
Bulk SiR-PyPDS (1) and MYC-488 FRET titration
A fresh 1 μM solution of MYC-488 (same sequence used for in vitro surface experiments) is prepared by annealing in the assay buffer (100 mM KCl and 50 mM KH2PO4, pH 7.4). MYC-488 was annealed by heating the solution at 95 °C for 10 min followed by slow cool down at room temperature and left at 4 °C overnight before being used for FRET titrations.
In a typical experiment 500 μL of a 1 μM MYC-488 solution was placed in quartz cuvette and the emission spectra recorded exciting the sample at 488 nm and recording the emission between 500 and 700 nm with a 5 nm emission slit. Successively, SiR-PyPDS (1) was added (0.5 to 5 μL) from a 1 mM stock solution in the assay buffer (10% DMSO). Spectra were recorded under the same conditions after each SiR-PyPDS (1) addition and FRET between the MYC-488 and SiR is detected by assessing the intensity reduction of the emission of the 488 fluorophore (peak ~515 nm) followed by the increased emission of SiR (peak ~625 nM).
smFRET imaging
Biotinylated oligonucleotides (MYC) were added to PEG-coated surfaces as described in the main manuscript. To directly visualise smFRET between the Alexa Fluor 488 tag on c-MYC and SiR-PyPDS (1) upon binding to c-MYC, we captured two images of SiR-PyPDS (1) emission: 1) Under donor (488 nm) excitation (200 W/cm2), to observe FRET and 2) Under acceptor (647 nm) excitation (150 W/cm2) to observe all PyPDS molecules bound to the surface. A separate set of smFRET experiments were also carried out at a 1000-fold lower concentration of c-MYC (0.001% surface coverage) and higher concentrations of SiR-PyPDS (1) (10 nM), to monitor anti-correlated donor and acceptor emission.
PEG Coating method 1
Coverslips (22 × 22 mm, thickness 0.13–0.17 mm, Menzel Gläser) were first cleaned with argon plasma for at least 1 h (Femto Plasma Cleaner; Diener Electronic, Royal Oak, MI, USA) and then attached to a 9-well PDMS chamber (cut from a CultureWell™ Chambered Coverglass, Sigma, Cat. No. GBL103350-20EA). Each well was passivated with 10 μL of a 4:1 mixture of methoxy- (0.8 mg/mL, SuSoS, Switzerland, Cat. No. PLL(20)-g[3.5]-PEG(2)) and biotin-terminated (0.2 mg/mL, SuSoS, Switzerland, Cat. No., PLL(20)-g[3.5]-PEG(2)/PEG(3.4)-biotin(50%)) PLL/PEG grafted co-polymers in 1x PBS for 30 min. The wells were then washed twice with 10 μL of 1x PBS containing 0.05% tween-20 (Fisher BioReagents, Cat. No. 10113103), then treated with 10 μL of 1x PBS containing 1% tween-20 for 10 min.
PEG Coating method 2
Glass coverslips (22 × 22 mm, thickness 0.13–0.17 mm, VWR) were covalently PEGylated, largely according to an existing protocol19, with minor modifications. Briefly, coverslips were washed then etched by sonication (Ultrasonic cleaner USC100T, VWR), in a series of solvents (10 min. in each of 18.2 MΩ/cm water, acetone, then MeOH, followed by 20 min. in 1 M KOH), rinsed with MeOH, 18.2 MΩ/cm water, then MeOH, dried in a stream of nitrogen, then cleaned with argon plasma for 15 minutes (Femto Plasma Cleaner; Diener Electronic, Royal Oak, MI, USA). The surfaces were then silanized with 1.5 mL 3-aminopropyl triethoxysilane (Fisher Scientific UK, Cat. No. 10677502), 2.5 mL AcOH in ~60 mL MeOH for 20 minutes, with 30 seconds of sonication after 10 minutes. The coverslips were then rinsed with MeOH, 18.2 MΩ/cm water, then MeOH, dried in a stream of nitrogen and then attached to a 9-well PDMS chamber (cut from a CultureWell™ Chambered Coverglass, Sigma, Cat. No. GBL103350-20EA). Each well was passivated by adding 9 μL of a 100:1 aqueous mixture of methoxy- (110 mg/mL, ~22 mM, MW ~5,000, Laysan Bio Inc., AL, USA, Cat. No. MPEG-SVA-5000) and biotin-terminated (1.1 mg/mL, ~220 μM, MW ~5,000, Laysan Bio Inc., AL, USA, Cat. No. Biotin-PEG-SVA-5000) PEGs, each activated at the other terminus as the N-hydroxysuccinimidyl ester, before adding 1 μL of 1 M NaHCO3 (pH 8.5). After overnight incubation in a humid chamber, the coverslips were rinsed well with 18.2 MΩ/cm water and dried with a stream of nitrogen. Each well was then further passivated by adding 9 μL of an aqueous solution of a shorter, methoxy-terminated PEG, activated at the other terminus as the N-hydroxysuccinimidyl ester (10 mg/mL, 30 mM, MS(PEG)4 Methyl-PEG-NHS-Ester, ThermoFisher, Cat. No. 22341), before adding 1 μL of 1 M NaHCO3 (pH 8.5). The coverslips were again incubated overnight in a humid chamber, rinsed well with 18.2 MΩ/cm water, dried with a stream of nitrogen, then stored in a desiccator at -20 °C until needed.
Quantification of binding events
For in vitro binding event measurements, the number of events was determined by counting the number of peaks in an image using the “Find Maxima” function in ImageJ with a noise threshold of 5500. For binding event measurements in cells, a single image typically only yielded a few points, such that it was necessary to acquire a video to obtain a suitable number of binding events. Prior to analysis, a rolling ball background subtraction of 5 px and a 1 px Gaussian blur was applied to all images. Single-molecule tracking was then performed using TrackMate20, with the particle diameter set to 5 px, threshold set to 200, linking distance set to 3 px, gap closing distance set to 3 px and gap frames set to 3. The number of binding events was then quantified as the number of tracks with a track length of 3 or longer.
In vitro single-molecule fluorescence imaging
Binding of G4 ligands to synthetic biotinylated oligonucleotides was imaged at single-molecule resolution by total internal reflection fluorescence microscopy (TIRFM) on glass coverslips coated with polyethylene glycol (PEG) and NeutrAvidin. In this study, we used two different PEG coating procedures described above: one based on passive adsorption (Coating method 1, used for data in Fig. 1, 3 and Extended Data Fig. 2) and the other on covalent coupling (Coating method 2, used for data in Extended Data Fig. 3 and 4 and Supplementary Fig 5). We found similar surface densities of immobilized biotinylated oligonucleotides and degrees of non-specific binding on each surface. Buffers for surface treatment and imaging were freshly filtered each day (0.02 μm syringe filter, Whatman, Cat. No. 6809–2101). Each biotinylated surface was then treated in the same way prior to single-molecule imaging. Wells were first coated with 10 μL of 0.2 mg/mL NeutrAvidin (ThermoFisher, Cat. No. 31000) in 1x PBS containing 0.05% tween-20 for 5 min, washed twice with 10 μL of 1x PBS containing 0.05% tween-20, then treated with 10 μL of 1x PBS containing 1% tween-20 for 10 min. Biotinylated oligonucleotides (c-MYC or c-MYC-mutant, annealed overnight at 100 nM concentration in 100 mM KCl and 50 mM KH2PO4, pH 7.4) were then diluted to 10 nM in 1x PBS containing 0.05% tween-20 and 10 μL added to each well for 5 min. The wells were then washed twice with 10 μL of 1x PBS containing 0.05% tween-20, then treated with 10 μL of 1x PBS containing 1% tween-20 for 10 min. The wells were then washed once with 250 pM of G4 ligand solutions (SiR-PyPDS (1) or SiR-iPyPDS (2)) in PBS and the solution was finally replaced with 9 μL of G4 ligand at 250 pM in PBS. For in vitro ligand displacement experiments, 1 μl of 1mM PhenDC3 was added to the well. For DMS trapping the pre-annealed MYC oligonucleotide (100 nM) was treated with DMS 8% for 20 minutes, quenched by adding 10% β-mercapto-ethanol and used for surface coating.
The general setup used for TIRFM has been described previously21. For the in vitro experiments TIRFM was implemented on a Nikon Eclipse Ti2 inverted microscope with a Perfect Focus System for maintaining focus during acquisition. 488 nm (MLD 488-200, Cobolt) and 640 nm (LBX-638-180-CSB-PP, Oxxius) lasers were used for excitation with clean-up filters. The emission collected by the 1.49 NA oil immersion 60× (90× with internal magnification) objective lens (Nikon) was filtered with long-pass and band-pass filters (520/36 – 67030 and 692/40 – 67038, Edmund Optics) and imaged on an Evolve 512 Delta EMCCD (Photometrics) with a pixel size of 178 nm, confirmed using a Ronchi ruling. The excitation power density was measured by determining the excitation power after the objective and the beam size in the imaging plane, taking ~4-fold near-field enhancement into account. For binding event measurements, a field of view was acquired for each condition with 500 ms exposure time at a power density of 1.4 kW/cm2. For longer residency time measurements, time lapses of 300 frames were acquired every 2 s with an exposure time of 100 ms and a power density of 0.4 kW/cm2. For shorter residency time measurements, time lapses of 300 frames were acquired every 100 ms with an exposure time of 100 ms and a power density of 0.4 kW/cm2.
Live cell imaging
In a typical experiment ~200.000 U2OS cells diluted in 2 ml of DMEM were plated in a 35 mm dish with a 14mm Glass coverslip at the bottom (MatTek) and allowed to adhere overnight. After ~18h, the media was replaced with 2 ml of fresh DMEM media containing SiR-PyPDS (1) or SiR-iPyPDS (2) at a final concentration of 20 nM and cells where further incubated for 30 min. The DMEM media containing SiR molecules was then discarded and cells were washed 2X with PBS pre-warmed at 37 °C. Finally, the media was replaced with PBS containing Hoechst 2μM for nuclear staining, pre-warmed at 37 °C, which was immediately followed by imaging.
The effect of DMS on cellular G4 prevalence was evaluated by treatment prior to SiR-PyPDS (1) labelling: cells were incubated with DMEM containing 20 mM DMS for the indicated time (5, 10 or 20 min). After the desired treatment time DMS was quenched by adding 10% β-mercapto-ethanol in PBS followed by 2X washing with PBS pre-warmed at 37 °C.
Cell cycle synchronisation was performed with mimosine treatment as previously described4. Transcriptional and replication arrest was achieved by co-treatment of cells with DRB and Aphidicolin as previously described17.
Binding of SiR-PyPDS (1) to nuclear G4s was visualised using highly inclined laminated optical sheet (HILO) microscopy15. The microscope setup used has been described previously22. The central plane of the nucleus in U2OS cells was found with either bright-field microscopy or using Hoechst staining. For binding event measurements, 400 frames were acquired for each cell with 100 ms exposure time at a power density of 180 W/cm2. For residency time measurements, time lapses of 70 frames were acquired every 3 s with an exposure time of 500 ms and a power density of 180 W/cm2.
Residence time determination
Time lapses for both in vitro and cell measurements were analysed using image processing and TrackMate20, as described in the previous section. The frequency distribution of residence times was fitted to a single-component exponential decay, to determine the characteristic residence time. This value was corrected for photobleaching as previously described22. The photobleaching rate for in vitro experiments was determined to be 0.001 s-1, compared to 0.066 s-1 for the off rate. This rate was found by measuring the intensity decay of SiR-PyPDS (1) at 30x higher excitation power density, where the photobleaching is much faster than the binding kinetics. This decay was fitted to a single exponential decay and by assuming a linear relationship between power density and photobleaching, the value could be scaled to the actual power density used in the residence time experiments. The photobleaching rate in cells was determined to be 0.01 s-1, compared to 0.16 s-1 for the off rate. This rate was found by fitting the intensity decay of the lysosomal accumulation of SiR-PyPDS (1) to a single exponential decay.
Extended Data
Extended Data Fig. 1. SiR-PyPDS analogues synthesized.
SiR-PyPDS analogues (1, 2, 3 and 4) with different chemical linkers between the PyPDS and the SiR scaffold synthesised in this study. TSTU was used as amide coupling reagent in the synthesis of all 3 analogues.
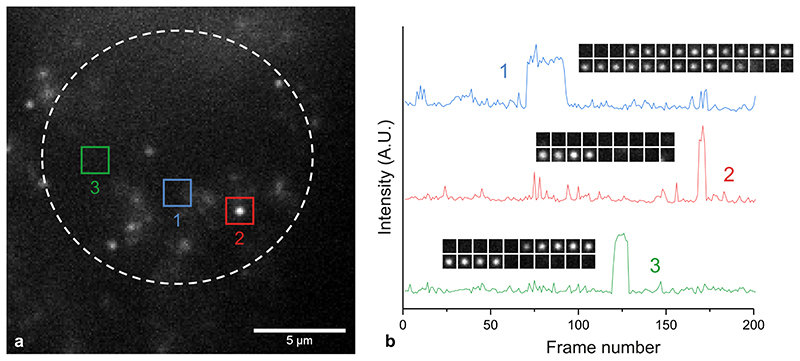
Extended Data Fig. 2. Single-step photobleaching confirms detection of individual probes.
(a) 25 pM SiR-PyPDS binding to MYC in vitro. The red square indicates a single binding event. (b) Intensity traces from three binding events in (a), showing probes undergoing single-step photobleaching. The insets show time lapses for each molecule. Similar single-step photobleaching could be consistently observed in all single-molecule video acquisitions.
Extended Data Fig. 3. FRET between SiR-PyPDS and Alexa Fluor 488-labelled MYC confirms direct binding to G4s.
(a) Emission spectrum of 488-MYC-G4 at 1 μM and SiR-PyPDS at various stoichiometric ratios. As the probe concentration increases, donor emission drops and acceptor emission increases, indicating FRET. (b) In vitro G4 FRET experiment. 250 pM of SiR-PyPDS (shown in red with acceptor excitation) interacting with Alexa Fluor 488-labelled MYC-G4 (with ~1% surface coverage). The green channel shows acceptor emission under donor excitation. FRET between MYC and SiR-PyPDS is highlighted with white arrows. (c) 10 nM SiR-PyPDS interacting with 488-MYC-G4 (0.001% surface coverage). Temporal intensity traces of donor (green) and acceptor (red) emission under donor excitation. Anti-correlated intensity fluctuation upon acceptor photobleaching indicates single-molecule FRET between PyPDS and MYC. (d) Example time lapse of acceptor (top, red) and donor (bottom, green) emission from (c). Experiments a-d were performed as 3 independent replicates all providing similar results.
Extended Data Fig. 4. Single-molecule imaging with SiR-PyPDS can be used to quantify MYC-G4 prevalence in vitro.
(a) Number of detected binding events increases with probe concentrations. (b) MYC fluorescence showing that the concentration of MYC on the surface can be controlled by mixing with a competing biotinylated oligomer. (c) Number of detected events increases with G4 concentration. Sample images for each condition is shown beneath each plot. Error bars indicate mean ± sd. n = 12 measurements taken from 2 independent replicates.
Extended Data Fig. 5. Induction of G4-folding by increasing concentrations of SiR-PyPDS measured with dually labelled FRET oligos:
(a-c) Fluorescence emission spectra under Cy3 excitation for each G4 sequence. Experiments a-c were performed as 3 independent replicates all providing similar results.
Extended Data Fig. 6. The effect on SiR-PyPDS binding on unfolding kinetics of G4 DNA sequences in vitro.
G4 two-phase unfolding kinetics were measured by introducing 10 μM of respective complimentary DNA oligonucleotide at t = 0 to trap the unfolded G4 oligonucleotide state. Data presented here are of best fit of a two-phase association model. Error indicates the standard error of the fit. n = 1 measurement for each condition. Each experiment has been repeated 3 times providing consistent results
Extended Data Fig. 7. Single-step photobleaching confirms detection of individual probes in cells.
(a) 20 nM SiR-PyPDS binding to targets in a living cell. The red square indicates a single binding event. (b) Intensity traces from three binding events in A, showing probes undergoing single-step photobleaching. The insets show time lapses for each molecule. Similar single-step photobleaching could be observed in all single-molecule video acquisitions.
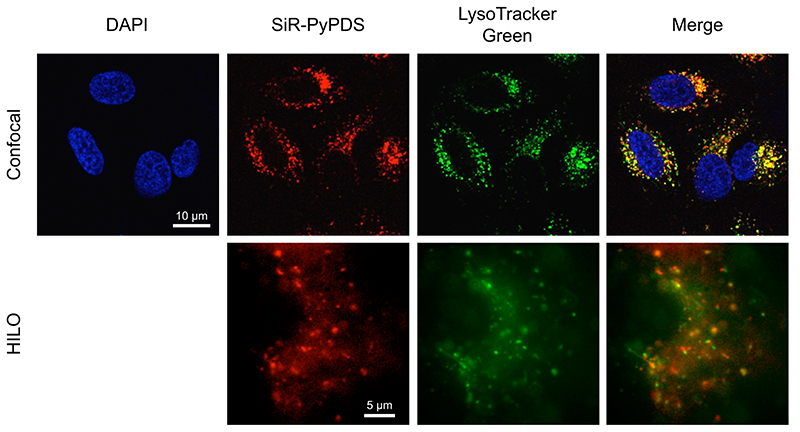
Extended Data Fig. 8. SiR-PyPDS mainly accumulates in lysosomes.
Representative confocal and HILO microscopy images obtained in the presence of SiR-PyPDS (1 μM in confocal and 40 nM in HILO) and LysoTracker Green (50 nM), confirming co-localisation of extranuclear staining with lysosomes. Experiments have been repeated 3 times providing similar results.
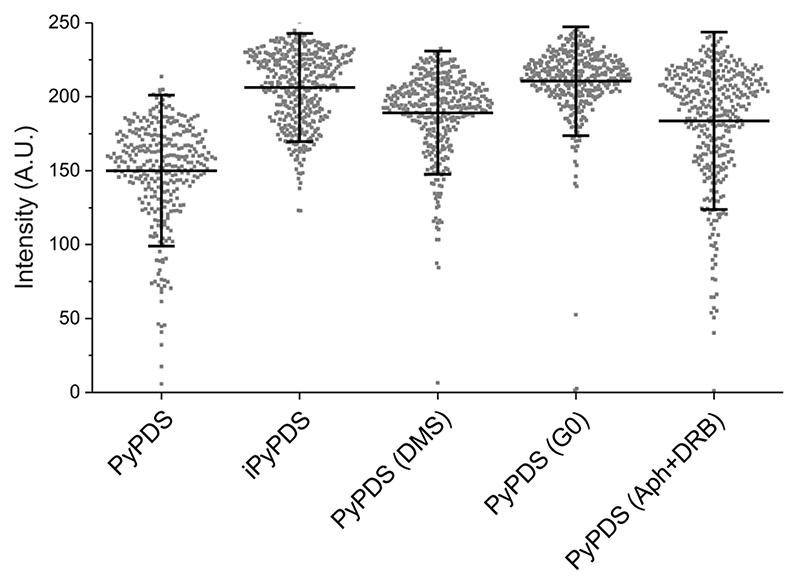
Extended Data Fig. 9. Total nuclear accumulation of SiR-PyPDS and SiR-iPyPDS in U2OS cells.
Total fluorescence intensity measured inside the nuclei of >300 U2OS cells after incubation with 10μM SiR-PyPDS or SiR-iPyPDS by standard confocal microscopy at 633 nm. Each point on the graph represents the total fluorescence of SiR measured at 633 nm per nuclei, data are plotted as the mean of >300 nuclei measured in 3 independent replicates. Total fluorescence measurement revealed comparable ability of the two molecules to accumulate in the nuclei. Error bars indicate mean ± sd.
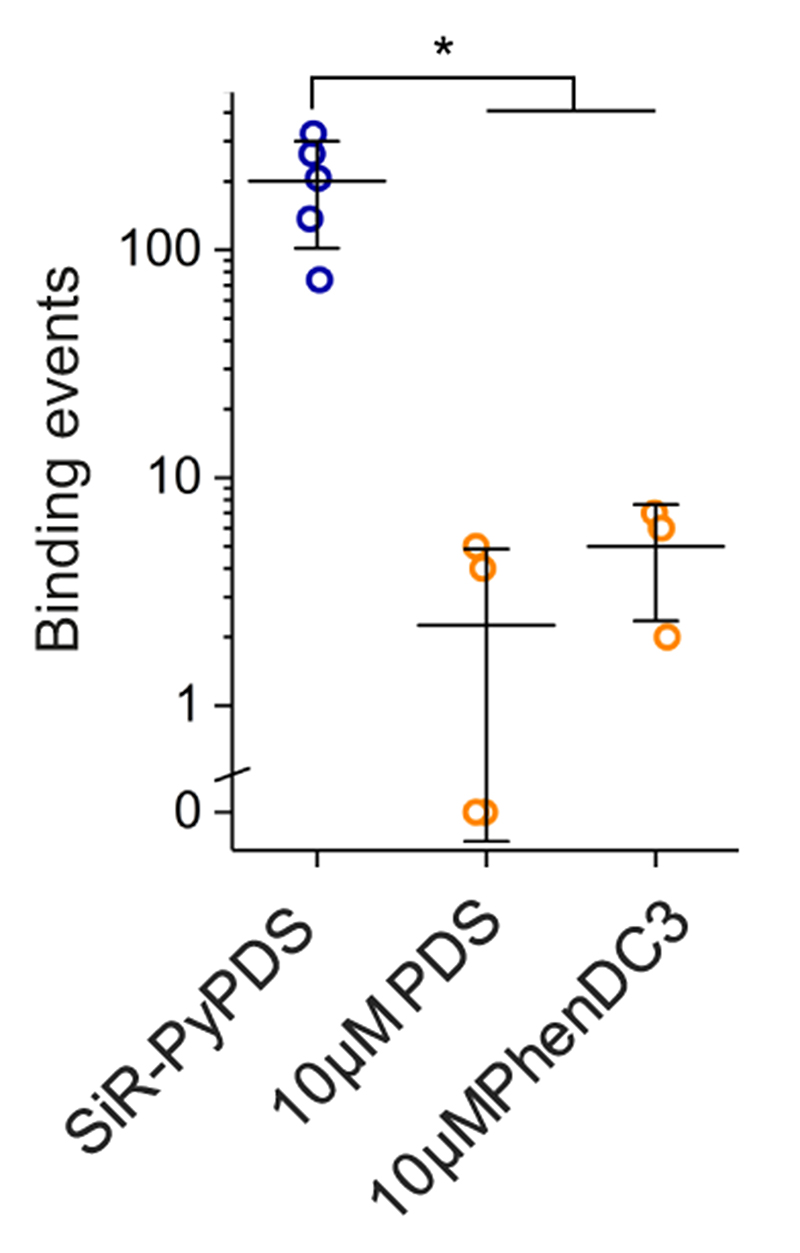
Extended Data Fig. 10. Cellular displacement experiments of SiR-PyPDS with the established G4-ligands PDS and PhenDC3.
Displacement of SiR-PyPDS in cells by competition with 10 μM of unlabelled G4-ligands PDS and PhenDC3. Cells were pre-incubated 30 minutes with PDS or PhenDC3 at 10 μM prior standard single-molecule imaging with SiR-PyPDS. Each point on the graph depicts the number of long-lived SiR-PyPDS event measured in independent replicates. Data are plotted as the mean of 3 or more independent replicates. Error bars indicate mean ± sd. * P < 0.05, two-sided Mann-Whitney U-test. n = 5,3 and 3 measurements taken from 3 independent replicates for no displacement, PDS displacement and PhenDC3 displacement respectively.
Supplementary Material
The fluorescent G4-ligand SiR-PyPDS specifically binds G4-MYC but not single stranded DNA (mut). The control isomer SiR-iPyPDS shows significantly reduced binding to G4-MYC. Videos for final analysis have been collected from 3 or more independent replicates
G4 binding by SiR-PyPDS can be inhibited by addition of 10 μM PhenDC3, demonstrating that observed binding events are G4 specific Videos for final analysis have been collected from 3 or more independent replicates.
Long-lived binding events can be observed in living cells by SiR-PyPDS but not by the control isomer SiR-iPyPDS, suggesting that observed events are G4 specific.
Videos for final analysis have been collected from 3 or more independent replicates.
When cells are treated with unlabelled PDS or PhenDC3, SiR-PyPDS ceases to bind to G4s in cells. White dashed circles indicate the nucleus. Videos for final analysis have been collected from 3 or more independent replicates
Time-lapse imaging enables determination of the residence time of SiR-PyPDS binding to G4s.
Videos for final analysis have been collected from 3 or more independent replicates
When cells are treated with DMS, increased treatment durations result in a reduction in observed G4-binding events, as G4s become trapped in an unfolded state and can therefore no longer be bound by SiR-PyPDS.
Videos for final analysis have been collected from 3 or more independent replicates
G4 binding events can readily be observed during replication (S) and transcription (G1/S) cell cycle phases. In the quiescent state (G0/G1) minimal G4s can be observed. Minimal binding is also seen if replication and transcriptionare inhibited chemically (arrest).
Videos for final analysis have been collected from 3 or more independent replicates
Graphical Abstract.
Acknowledgements
Supported by programme grant funding from Cancer Research UK (C9681/A18618, S.B.) core funding from Cancer Research UK (C14303/A17197, S.B.), a Royal Society University Research Fellowship (UF120277 to S.F.L.), Research Professorship (RP150066 to D.K.), a EPSRC (EP/L027631/1 to D.K.) and a BBSRC David Phillips Fellowship (BB/R011605/1 to M.D.A).
Footnotes
Author Contributions
M.D.A., A.P., D.K. and S.B. conceived and designed the experiments. M.D.A. performed the design, synthesis and biophysical characterization of G4 ligands. A.P. developed the optical setups used for imaging. M.D.A., A.P. and R.T.R. performed in vitro imaging experiments. R.T.R. carried out surface preparation for in vitro experiments. M.D.A. and A.P. performed imaging experiments in cells. A.P. analyzed imaging data. M.C. A.R. and X.Z. contributed to the synthesis and biophysical validation of the ligands. M.D.A., A.P., R.T.R., S.F.L., D.K. and S.B. contributed to the study design. J.S. assisted with DMS experiments. A.R. contributed to cellular staining and imaging. A.R and L.N characterized the fluorescence properties of the G4 ligands. M.D.A., A.P., D.K. and S.B. interpreted the results and co-wrote the manuscript. All authors discussed the results and commented on the manuscript. M.D.A., A.P. and A.R. contributed equally to this work.
Competing Interests
S.B. is a founder and shareholder of Cambridge Epigenetix Ltd.
Data Availability
All data generated during this study are included in this published article (and its supplementary information files).
References
- 1.Sen D, Gilbert W. Formation of parallel four-stranded complexes by guanine-rich motifs in DNA and its implications for meiosis. Nature. 1988;334:364–366. doi: 10.1038/334364a0. [DOI] [PubMed] [Google Scholar]
- 2.Hänsel-Hertsch R, Di Antonio M, Balasubramanian S. DNA G-quadruplexes in the human genome: detection, functions and therapeutic potential. Nat Rev Mol Cell Biol. 2017;18:279–284. doi: 10.1038/nrm.2017.3. [DOI] [PubMed] [Google Scholar]
- 3.Chambers, et al. High-throughput sequencing of DNA G-quadruplex structures in the human genome. Nat Biotechnol. 2015;33:877–881. doi: 10.1038/nbt.3295. [DOI] [PubMed] [Google Scholar]
- 4.Schaffitzel C, et al. In vitro generated antibodies specific for telomeric guanine-quadruplex DNA react with Stylonychia lemnae macronuclei. Proc Natl Acad Sci U S A. 2001;98:8572–8577. doi: 10.1073/pnas.141229498. [DOI] [PMC free article] [PubMed] [Google Scholar]
- 5.Biffi G, Tannahill D, McCafferty J, Balasubramanian S. Quantitative visualization of DNA G-quadruplex structures in human cells. Nat Chem. 2013;3:182–186. doi: 10.1038/nchem.1548. [DOI] [PMC free article] [PubMed] [Google Scholar]
- 6.Hänsel-Hertsch R, et al. G-quadruplex structures mark human regulatory chromatin. Nat Genet. 2016;48:1267–1272. doi: 10.1038/ng.3662. [DOI] [PubMed] [Google Scholar]
- 7.Chen XC, et al. Tracking the dynamic folding and unfolding of RNA G-quadruplexes in live cells. Angew Chem Int Ed. 2018;57:4702–4706. doi: 10.1002/anie.201801999. [DOI] [PubMed] [Google Scholar]
- 8.Laguerre A, et al. Visualization of RNA G-quadruplexes in live cells. J Am Chem Soc. 2015;137:8521–8525. doi: 10.1021/jacs.5b03413. [DOI] [PubMed] [Google Scholar]
- 9.Zhang S, et al. Tang, Real-time monitoring of DNA G-quadruplexes in living cells with a small-molecule fluorescent probe. Nucleic Acids Res. 2018;46:7522–7532. doi: 10.1093/nar/gky665. [DOI] [PMC free article] [PubMed] [Google Scholar]
- 10.Shivalingam A, et al. The interactions between a small-molecule and G-quadruplexes are visualized by fluorescence lifetime imaging microscopy. Nat Commun. 2015;6:8178. doi: 10.1038/ncomms9178. [DOI] [PMC free article] [PubMed] [Google Scholar]
- 11.Lukinavičius G, et al. A near-infrared fluorophore for live-cell super-resolution microscopy of cellular proteins. Nat Chem. 2013;5:132–139. doi: 10.1038/nchem.1546. [DOI] [PubMed] [Google Scholar]
- 12.Rodriguez R, et al. A novel small molecule that alters shelterin integrity and triggers a DNA-damage response at telomeres. J Am Chem Soc. 2008;130:15758–15759. doi: 10.1021/ja805615w. [DOI] [PMC free article] [PubMed] [Google Scholar]
- 13.De Cian A, Delemos E, Mergny JL, Teulade-Fichou MP, Monchaud D. Highly efficient G-quadruplex recognition by bisquinolinium compounds. J Am Chem Soc. 2007;129:1856–1857. doi: 10.1021/ja067352b. [DOI] [PubMed] [Google Scholar]
- 14.Ying L, Green JJ, Li H, Klenerman D, Balasubramanian S. Studies on the structure and dynamics of the human telomeric G-quadruplex by single-molecule fluorescence resonance energy transfer. Proc Natl Acad Sci U S A. 2003;100:14629–14634. doi: 10.1073/pnas.2433350100. [DOI] [PMC free article] [PubMed] [Google Scholar]
- 15.Tokunaga M, Imamoto N, Sakata-Sogawa K. Highly inclined thin illumination enables clear single-molecule imaging in cells. Nat Methods. 2008;5:159–161. doi: 10.1038/nmeth1171. [DOI] [PubMed] [Google Scholar]
- 16.Etheridge TJ, et al. Quantification of DNA-associated proteins inside eukaryotic cells using single-molecule localization microscopy. Nucleic Acids Res. 2014;42:e146. doi: 10.1093/nar/gku726. [DOI] [PMC free article] [PubMed] [Google Scholar]
- 17.Guo JU, Bartel DP. RNA G-quadruplexes are globally unfolded in eukaryotic cells and depleted in bacteria. Science. 2016;353 doi: 10.1126/science.aaf5371. pii: aaf537. [DOI] [PMC free article] [PubMed] [Google Scholar]
- 18.Rodriguez R, et al. Small-molecule-induced DNA damage identifies alternative DNA structures in human genes. Nat Chem Biol. 2012;8:301–310. doi: 10.1038/nchembio.780. [DOI] [PMC free article] [PubMed] [Google Scholar]
- 19.Chandradoss SD, et al. Surface Passivation for Single-Molecule Protein Studies. J Vis Exp. 2014;86 doi: 10.3791/50549. 50549. [DOI] [PMC free article] [PubMed] [Google Scholar]
- 20.Tinevez J-Y, et al. TrackMate: An Open and Extensible Platform for Single-Particle Tracking. Methods. 2017;115:80–90. doi: 10.1016/j.ymeth.2016.09.016. [DOI] [PubMed] [Google Scholar]
- 21.Ponjavic A, et al. Single-Molecule Light-Sheet Imaging of Suspended T Cells. Biophys J. 2018;114:2200–2211. doi: 10.1016/j.bpj.2018.02.044. [DOI] [PMC free article] [PubMed] [Google Scholar]
- 22.Ponjavic A, Ye Y, Laue E, Lee SF, Klenerman D. Sensitive light-sheet microscopy in multiwell plates using an AFM cantilever. Biomed Opt Express. 2018;9:5863–5880. doi: 10.1364/BOE.9.005863. [DOI] [PMC free article] [PubMed] [Google Scholar]
- 23.Chen J, et al. Single-molecule Dynamics of Enhanceosome Assembly in Embryonic Stem Cells. Cell. 2014;156:1274–1285. doi: 10.1016/j.cell.2014.01.062. [DOI] [PMC free article] [PubMed] [Google Scholar]
Associated Data
This section collects any data citations, data availability statements, or supplementary materials included in this article.
Supplementary Materials
The fluorescent G4-ligand SiR-PyPDS specifically binds G4-MYC but not single stranded DNA (mut). The control isomer SiR-iPyPDS shows significantly reduced binding to G4-MYC. Videos for final analysis have been collected from 3 or more independent replicates
G4 binding by SiR-PyPDS can be inhibited by addition of 10 μM PhenDC3, demonstrating that observed binding events are G4 specific Videos for final analysis have been collected from 3 or more independent replicates.
Long-lived binding events can be observed in living cells by SiR-PyPDS but not by the control isomer SiR-iPyPDS, suggesting that observed events are G4 specific.
Videos for final analysis have been collected from 3 or more independent replicates.
When cells are treated with unlabelled PDS or PhenDC3, SiR-PyPDS ceases to bind to G4s in cells. White dashed circles indicate the nucleus. Videos for final analysis have been collected from 3 or more independent replicates
Time-lapse imaging enables determination of the residence time of SiR-PyPDS binding to G4s.
Videos for final analysis have been collected from 3 or more independent replicates
When cells are treated with DMS, increased treatment durations result in a reduction in observed G4-binding events, as G4s become trapped in an unfolded state and can therefore no longer be bound by SiR-PyPDS.
Videos for final analysis have been collected from 3 or more independent replicates
G4 binding events can readily be observed during replication (S) and transcription (G1/S) cell cycle phases. In the quiescent state (G0/G1) minimal G4s can be observed. Minimal binding is also seen if replication and transcriptionare inhibited chemically (arrest).
Videos for final analysis have been collected from 3 or more independent replicates
Data Availability Statement
All data generated during this study are included in this published article (and its supplementary information files).


