Abstract
Fibroblastic reticular cells (FRCs) determine the organization of lymphoid organs and control immune cell interactions. While the cellular and molecular mechanisms underlying of FRC differentiation in lymph nodes and the splenic white pulp have been elaborated to some extent, in Peyer’s patches (PPs) they remain elusive. Using a combination of single-cell transcriptomics and cell fate-mapping in advanced mouse models, we found that PP formation in the mouse embryo is initiated by an expansion of perivascular FRC precursors, followed by FRC differentiation from subepithelial progenitors. Single-cell transcriptomics and cell fate-mapping confirmed the convergence of perivascular and subepithelial FRC lineages. Furthermore, lineage-specific loss and gain-of-function approaches revealed that the two FRC lineages synergistically direct PP organization, maintain intestinal microbiome homeostasis and control anti-coronavirus immune responses in the gut. Collectively, this study reveals a distinct mosaic patterning program that generates key stromal cell infrastructures for the control of intestinal immunity.
Keywords: Peyer’s patch fibroblastic reticular cells, PP-FRC, FRC lineages, T cell zone reticular cells, marginal zone reticular cells, follicular dendritic cells, lymphoid tissue organizer cells
Introduction
Tight regulation of intestinal immune responses is critical for the maintenance of epithelial cell functions to prevent severe diseases such as inflammatory bowel disease1 or colorectal cancer2. Immune cell trafficking and pathogenic cytokine circuits are critical drivers in both intestinal inflammation and cancer progression3. The initiation, sustenance and regulation of such immune processes occur in gut-associated lymphoid tissues including Peyer’s patches (PPs) and mesenteric lymph nodes4. The subepithelial location of PPs provides direct access to intestinal antigens for immune cells leading to the production of vast amounts of protective immunoglobulin A (IgA)5. Distinct topological niches for immune cell activation in PPs are constructed by fibroblastic reticular cells (FRCs) that not only provide a structural scaffold and guidance to immune cells6, but shape immune responses through the provision of essential cytokines and growth factors7. Podoplanin (PDPN)-expressing FRCs of the T cell zone in lymph nodes (TRCs) regulate the migration and survival of T cells through the production of T cell- and dendritic cell-attracting chemokines CCL19 and CCL218, 9. Reticular cells located at the border between the T and B cell zones (TBRCs) in PPs control group 1 innate lymphoid cell (ILC) activity through production of interleukin 15 (IL-15)7. Follicular dendritic cells (FDCs), together with TBRCs, cater to B cells and thereby foster antibody production through the organization of the germinal center (GC)10, 11. While recent studies have provided insight into FRC differentiation programs in LNs and the splenic white pulp10, 11, 12, 13, 14, the origin and differentiation trajectories of PP FRC have remained unexplored.
Secondary lymphoid organ development depends on the interaction of hematopoietic lymphoid tissue inducer (LTi) cells with resident mesenchymal and endothelial lymphoid tissue organizer (LTo) cells15, 16, 17. PP organogenesis is initiated at embryonic day (E)16.5, when LTi cells form clusters along the intestinal wall and induce the differentiation of LTo cells18, 19. This process requires lymphotoxin-β receptor (LTβR)-dependent activation of mesenchymal LTo cells9, 20. During the first week of life, T and B lymphocytes seed the PP primordium, accumulate in proximity to the muscular layer21 and drive the development of distinct FRC niches22, 23. Here, we show that PP FRCs develop from two separate mesenchymal LTo cell lineages. Perivascular and subepithelial PP FRC lineages converge and form mosaic microenvironments in a LTβR- and tumor necrosis factor receptor (TNFR) 1-dependent manner. The cooperation of the two FRC lineages in PPs is crucial for the maintenance of intestinal homeostasis and the induction of anti-coronavirus IgA responses.
Results
Molecular definition of the PP FRC landscape
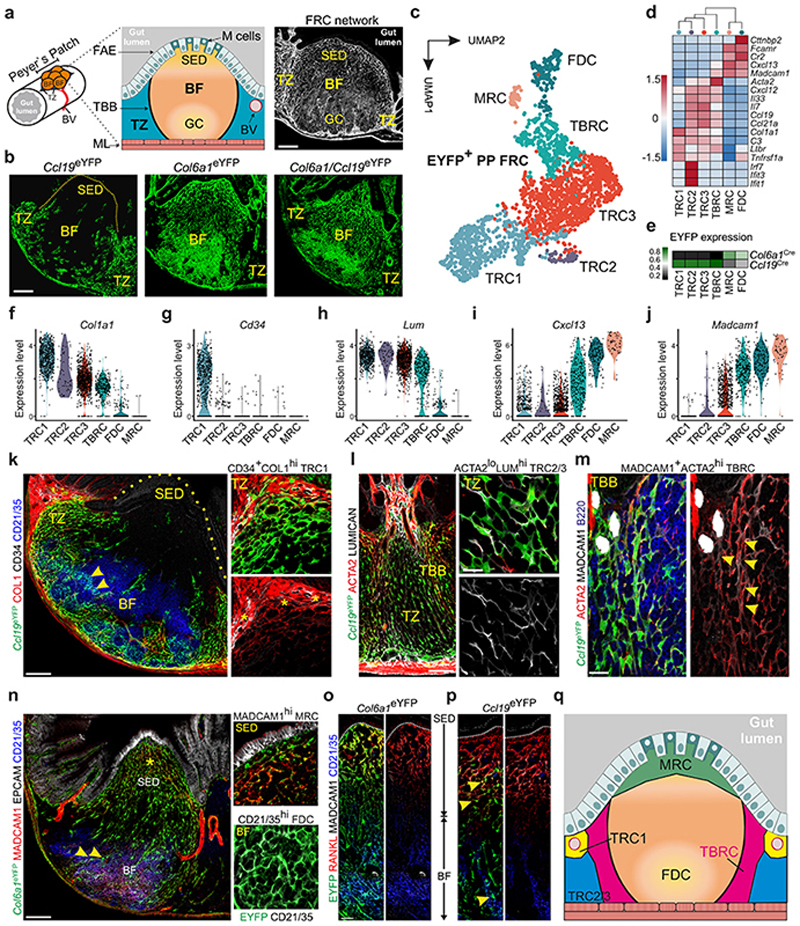
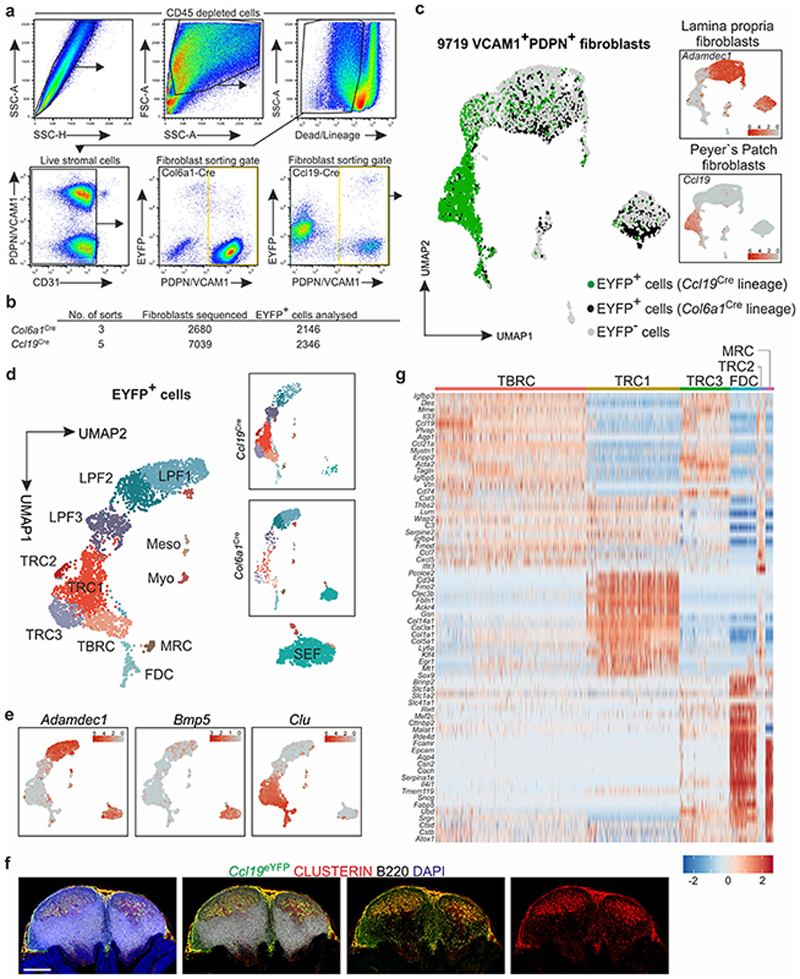
PPs are underpinned by a dense network of FRCs (Fig. 1a). To elaborate the subset composition and topological organization of PP FRCs, we employed well-characterized Ccl19 Cre9 and Col6a1 Cre24 mouse models that permit FRC targeting in secondary lymphoid organs. While FRC networks in PPs were highlighted to different extents when the respective Cre-driver lines were crossed with an enhanced yellow fluorescent protein (EYFP) reporter strain (Fig. 1b), the combination of both lines resulted in targeting of all PP FRCs (Fig. 1b and Extended Data Fig. 1a–c). To define PP FRC subsets and their relation to the observed FRC lineages, we isolated fibroblasts from Col6a1 eYFP and Ccl19 eYFP PPs (Extended Data Fig. 2a–b) and performed droplet-based single cell transcriptomics analysis. In total, 9,719 vascular cell adhesion protein 1 (VCAM1)- and/or PDPN-positive fibroblasts were profiled, which contained 4,492 EYFP-expressing fibroblasts originating from either of the two transgenic lines (Extended Data Fig.2c). Clustering analysis of EYFP-expressing fibroblasts and mapping based on Adamdec1, Bmp5 or Clu expression25, 26 discriminated six Clu-expressing PP FRC populations from Adamdec1-expressing lamina propria fibroblasts and Bmp5-expressing subepithelial fibroblasts (Extended Data Fig. 2d–f). Re-analysis of the six FRC clusters and evaluation of cluster-specific gene expression identified three T cell zone reticular cell subsets (TRC1-3) and TBRCs, while FDCs and marginal zone reticular cells (MRCs) formed individual clusters (Fig 1c–d, Extended Data Fig. 2g). Distribution of EYFP mRNA expression among FRC clusters (Fig. 1e and Extended Data Fig. 2c) and expression of distinct marker genes (Fig. 1f–j) indicated that the TRC populations belong mainly to a cell lineage targeted by the Ccl19 eYFP transgene, while FDCs and MRCs originated mainly from a separate Col6a1 eYFP lineage. High expression of extracellular matrix-associated genes Col1a1, Col3a1, Col5a1 and Col14a1 and expression of the perivascular reticular cell markers Cd34 and Ly6a (Fig. 1f–g, Extended Data Fig. 2g) in TRC1 were indicative for a perivascular niche localization. High-resolution confocal microscopy of Ccl19 eYFP PPs confirmed the presence of CD34+COL1hi TRC1 in the vicinity of blood vessels of the T cell zone (Fig 1k). High expression of Col1a1 and Lum (Fig. 1f,h) and other classical TRC marker genes, but a low level of Acta2 expression (Fig. 1d) identified TRC2 and 3 as bona fide TRCs. TRC2 could be distinguished from TRC3 mainly by the expression of genes related to the interferon system (Fig. 1d, Extended Data Fig. 2g) indicating a switch of TRC3 to an activated state27. High-resolution confocal microscopy of Ccl19 eYFP PPs confirmed the presence of ACTA2low LUMhigh TRC2/3 in the center of the T cell zone (Fig. 1l). Moderate expression of classical TRC marker genes but elevated expression of Acta2 (Fig. 1d), Cxcl13 and Madcam1 (Fig. 1i–j) identified the TBRC cluster and the location of MADCAM1+ACTA2high cells at the T-B border (Fig. 1l–m) is compatible with the designation as TBRC11. The expression of the canonical MRC and FDC markers CD21/CD35 (complement receptors 2 and 1, respectively) and MADCAM1 was particularly high on EYFP+ FRC networks in GCs and the subepithelial dome of Col6a1 eYFP PPs (Fig. 1n). Comparative analysis of FRC networks in the sub-epithelial domes and B cell follicles revealed that the majority of RANKL+ MRCs and CD21/35+ FDCs belong to the Col6a1 eYFP lineage (Fig. 1o), whereas a smaller fraction MRCs and FDCs could be identified in the follicle and SED region of Ccl19 eYFP PPs (Fig. 1k and 1p, arrowheads). Taken together, the molecular definition of the PP FRC landscape reveals two FRC lineages furnishing distinct microenvironmental niches (Fig. 1q).
Figure 1. The FRC landscape of Peyer’s patches.
a, Murine Peyer’s patches (PP) consist of large B cell follicles (BF) and interfollicular T cell zones (TZ), demarcated from the gut lumen through the follicle associated epithelium (FAE) with microfold (M) cells and underpinned by a PDPN+ VCAM1+ FRC network; BV, blood vessel; GC, germinal center; SED, sub-epithelial dome; TBB, T-B cell zone border. b, Confocal microscopy of EYFP+ FRC networks in PP of 6 wk old transgenic mice. c, UMAP analysis of EYFP+ PP FRCs from adult Ccl19 eYFP and Col6a1 eYFP mice. d, Hierarchical clustering of averaged expression of canonical FRC marker genes. e, Heatmap showing averaged EYFP-expression in FRC clusters of the indicated lineages. f-j, Violin plots depicting subset specific expression of indicated genes in single FRCs k, Confocal microscopy analysis of BF and SED in PPs of adult Ccl19 eYFP mice. Arrowheads indicate EYFP+CD21/35+ FDCs. Asterisks indicate CD34hi COL1hi TRCs. l, Confocal microscopy analysis of the TZ and TBB in PPs of adult Ccl19 eYFP mice. m, FRC network in the TBB, arrowheads indicate ACTA2hiMADCAM1+ TBRCs. n, Confocal microscopy analysis of BF and SED in PPs of adult Col6a1 eYFP mice. Higher magnification images on the right show EYFP+MADCAM1+ MRC in the SED and EYFP+CD21/35+ FDC networks in the BF. o, p, Confocal microscopy analysis of FRC networks spanning from SED to BF. Arrowheads show EYFP+ FDCs and MRCs in Ccl19 eYFP mice. n, Schematic depiction of FRC subset location in the PP. Scale bars, 200 μm (a,b,k,n), 100 μm (l), 20 μm (m), 10 μm (l,o,p). Images are representative of 3-5 mice per group, at least 2 independent experiments. ScRNA-sequencing data represents 2220 EYFP+ FRCs, N = 8 biological replicates, 4 independent experiments.
Lineage convergence of PP FRCs
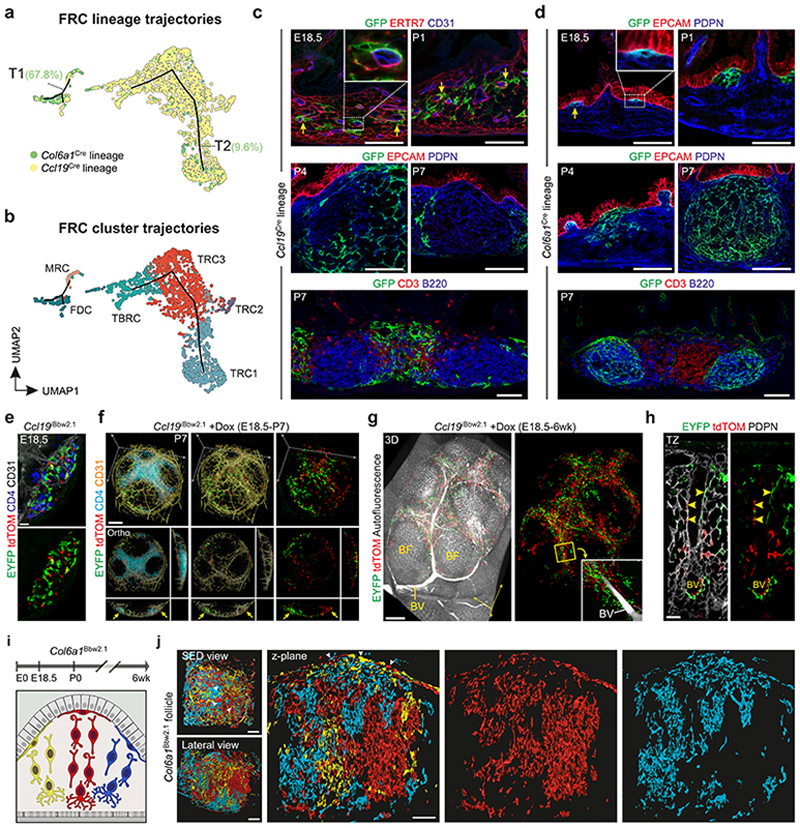
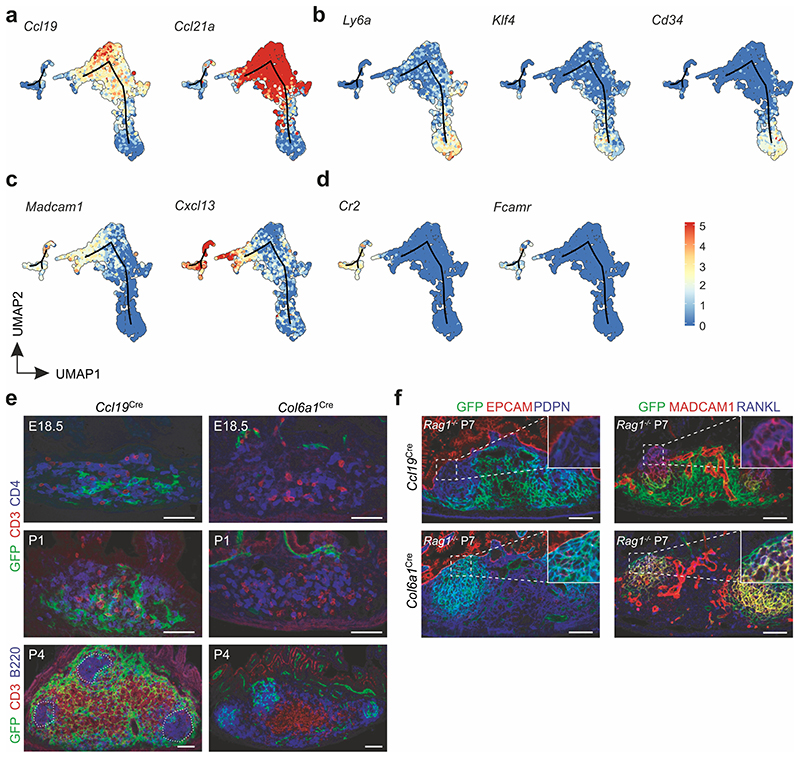
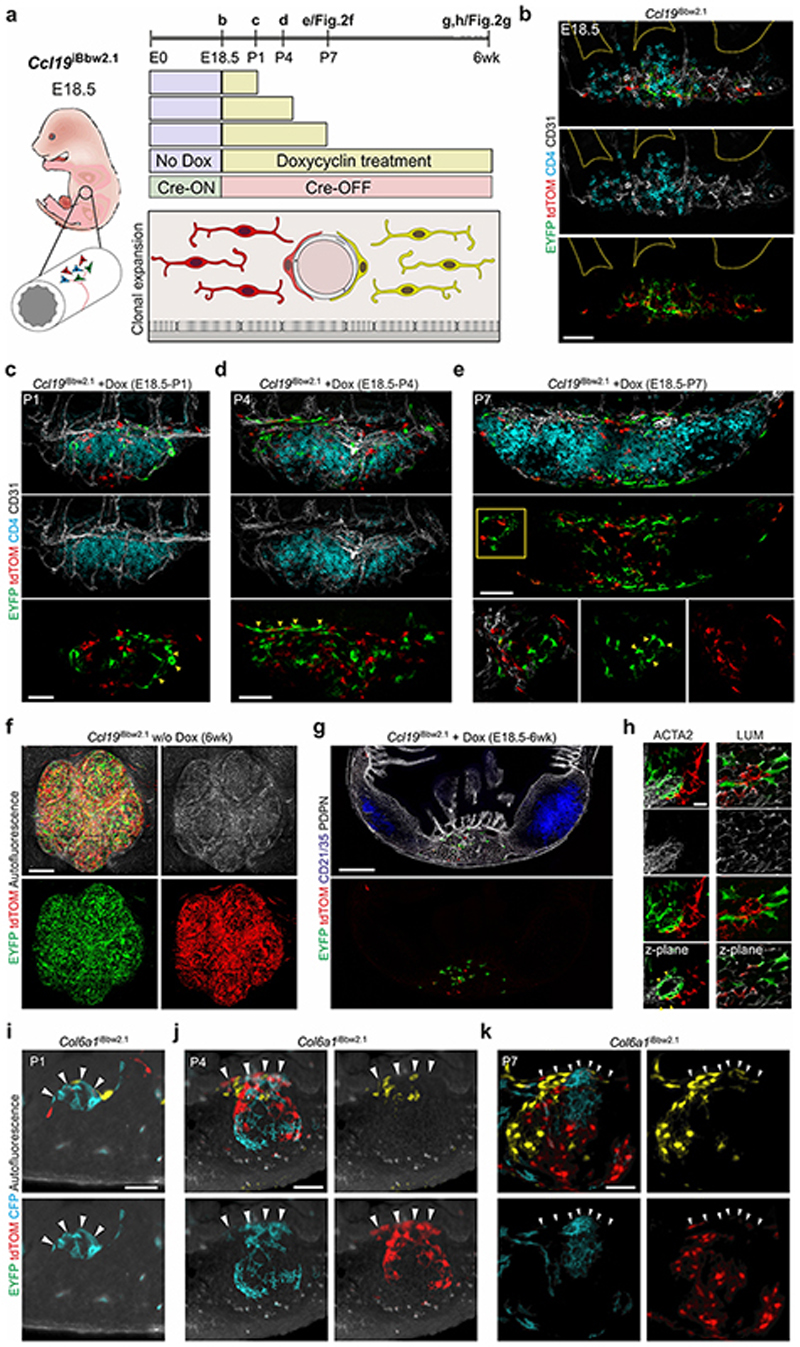
To further elaborate the relation and differentiation trajectories of the Ccl19 Cre and Col6a1 Cre PP FRC lineages, we computed differentiation trajectories based on the single cell transcriptomics data from PP FRCs using the Monocle routine28. The two FRC lineages contributed to two distinct trajectories with the majority (67.8%) of Col6a1 Cre-expressing cells forming a MRC-FDC trajectory (T1), while 90.4% of the cells in the TRC trajectory (T2) belonged to the Ccl19 Cre lineage (Fig. 2a and b). LTβR-dependent FRC maturation marker genes Ccl19 and Ccl21a 9 were enriched in TRC2/3 and TBRC (Extended Data Fig. 3a), while expression of perivascular reticular cell marker genes, e.g. Ly6a, Klf4 and CD34 12, was highest in TRC1 (Extended Data Fig. 3b). The location of Cxcl13 high Madcam1 high MRC on one end and Cr2 int Fcamr int FDC on the other end of T1 (Extended Data Fig. 3c and d) is in line with the proposed developmental relationship between FDCs and MRCs14. To validate the in silico-predicted differentiation trajectories of the two FRC lineages, we first traced the origin and expansion of Ccl19 Cre and Col6a1 Cre LTo cells from E18.5 onwards. Early PP anlagen were identified by the presence of CD3– CD4+ LTi cell aggregates (Extended Data Fig. 3e). At this stage, Ccl19 Cre+ ER-TR7+ cells were found in direct contact with CD31+ endothelial cells (Fig. 2c, arrows). In contrast, E18.5 Col6a1 Cre LTo cells were found adjacent to the epithelial layer (Fig. 2d, arrow). During the first week after birth, Ccl19 Cre-expressing LTo cells increased in numbers along with the expansion of the anlagen and remained in the developing T cell area (Fig. 2c, Extended Data Fig. 3e), while Col6a1 Cre+ cells started to form reticular cell networks underpinning the B cell zone (Fig. 2d, Extended Data Fig.3e). The expansion of both Ccl19 Cre+ and Col6a1 Cre+ networks did not depend on the presence of T and B lymphocytes, as shown in Rag –/– mice (Extended Data Fig. 3f) indicating that contact with LTi cells is sufficient to trigger the activation of either LTo cell subset. Cell fate-mapping using the R26 Brainbow2.1 reporter29 crossed to inducible FRC-specific Ccl19 Tta mice12 (Extended Data Fig. 4a), hereafter named Ccl19 iBbw2.1, facilitated tracking of multi-color reporter gene expression and clonal expansion of LTo cells in PP anlagen (Fig. 2e, Extended Data Fig. 4b). Detection of fate-mapped progeny derived from E18.5 LTo cells in P1 and P4 PP anlagen revealed that Ccl19-expressing perivascular (p)LTo cells clonally expanded along the growing vasculature (Extended Data Fig. 4c,d). Fate-mapped progeny started to form single colored networks in the developing T cell zone of P7 PPs (Fig. 2f, Extended Data Fig. 4e). The T cell zones of adult PPs were populated by progeny derived from E18.5 LTo cells (Fig. 2g, Extended Data Fig. 4f,g), including single-colored TRC cohorts of which some appeared to be connected to blood vessels (Fig. 2h). Furthermore, E18.5 progeny gave rise to cohorts of perivascular TRC1, Lumican (LUM)+ TRC2/3 and ACTA2+ TBRC (Extended Data Fig. 4h). To validate the predicted differentiation trajectories of Col6a1 Cre+ subepithelial (s)LTo cells, we reconstructed whole B cell follicles from adult and developing PPs of Col6a1 Bbw2.1 mice (Fig. 2i and Extended Data Fig. 4i–k) using light sheet microscopy. We found a random distribution of CFP+, YFP+ and TOMATO+ cells in the subepithelial layer directly under the follicle-associated epithelium (FAE) (Fig. 2j, arrowheads). In contrast, single-colored network columns extended from below the subepithelial layer through the SED towards FDC networks in PPs from newborn and adult mice (Fig. 2j and Extended Data Fig. 4i–k), indicating that sLTo cells clonally expand to form mainly MRC and FDC networks in the B cell follicles. Collectively, these data reveal that the progeny of distinct perivascular and subepithelial LTo cell populations converge to shape the PP FRC landscape.
Figure 2. Organization of PP microdomains by two distinct LTo cell populations.
a, Monocle-based trajectory analysis of transcriptomics single cell data, highlighting cells originating from different lineages. Numbers indicate percentage of cells derived from the Col6a1 Cre lineage on trajectories (T) 1 and 2. b, Projection of FRC clusters on Monocle-based trajectories. c, Confocal microscopy analysis of PP primordia at E18.5, P4 and P7 from Ccl19 GFP and d, Col6a1 GFP mice. Boxed areas show perivascular location in c and subepithelial location of GFP+ cells in d. e, Confocal microscopy analysis of E18.5 PP anlagen of Ccl19 iBbw2.1 embryos with EYFP and tdTOMATO reporter expression. f, Images showing whole-mount analysis of PP at P7, harvested from Ccl19 iBbw2.1 pups treated with doxycyclin (Dox) since E18.5. Lower panel shows orthogonal x,y and z views of the upper whole-mount analysis. Arrows indicate single colored cell clusters. g, Images showing whole-mount analysis of PP harvested from adult Ccl19 iBbw2.1 mice treated with Dox since E18.5. Higher magnification image shows a major blood vessel (BV) surrounded by EYFP+ and tdTOMATO+ cell clusters in the T cell zone. h, Confocal microscopic analysis of EYFP+ and tdTOMATO+ progeny of E18.5 progenitors in PDPN+ TRC network at 6 weeks of age. Arrowheads indicate perivascular EYFP+ and tdTOMATO+ TRCs. i, Schematic depiction of light sheet microscopy analysis. j, Light sheet microscopy images of adult Col6a1 iBbw2.1 PP follicle with single-colored cell columns. Scale bars, 50 μm (c,d,j), 20 μm (e,h), 100 μm (f), 500 μm (g). Images are representative of at least 3 mice from 2-4 independent experiments. Monocle analysis is based on scRNA-sequencing data in Fig. 1c, N = 8 biological replicates, 4 independent experiments.
Molecular circuits regulating FRC lineage convergence
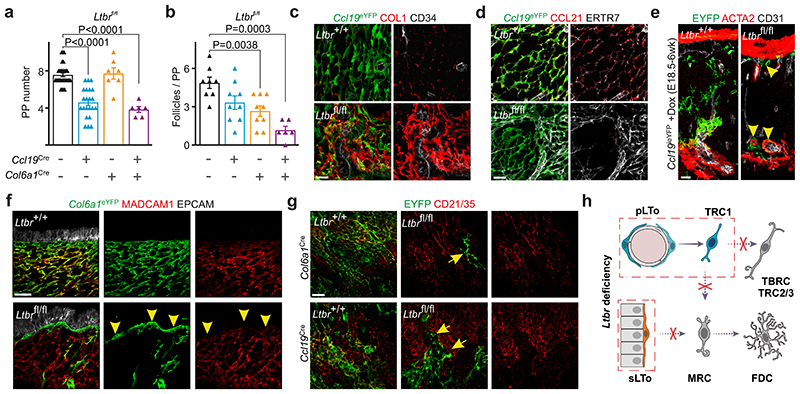
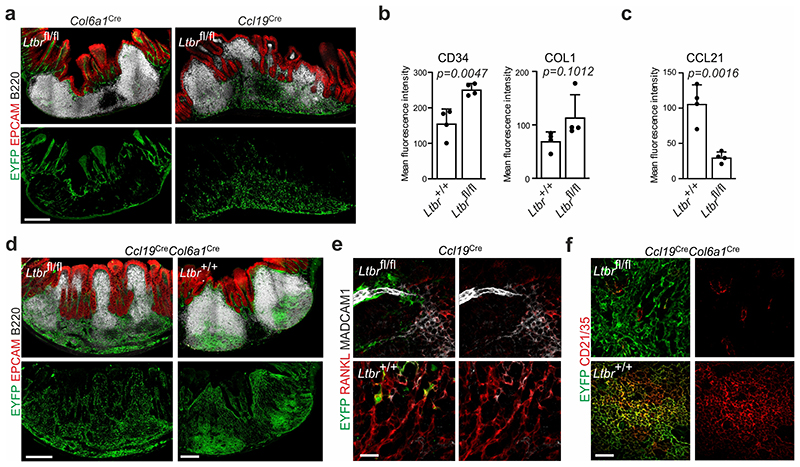
To further dissect the molecular mechanisms underlying FRC lineage convergence in PPs, we genetically ablated two key molecular differentiation pathways in Ccl19 Cre and/or Col6a1 Cre mice, i.e. the LTβR and the TNFR1 signaling pathways. Deletion of Ltbr expression in Ccl19 Cre, but not Col6a1 Cre mice led to a significant reduction in PP numbers (Fig. 3a). On the contrary, Ccl19 Cre and Col6a1 Cre FRC lineages synergistically contributed to follicle compartmentalization (Fig. 3b) and determined B cell cellularity in PPs (Extended Data Figure 5a). FRC lineage differentiation was compromised in Ccl19 eYFP Ltbr fl/fl PPs with EYFP+ cells exhibiting elevated expression of CD34 and COL1 (Fig. 3c, Extended Data Fig. 5b), reduced CCL21 expression and elevated ECM deposition (Fig. 3d, Extended Data Fig. 5c) in comparison to Ltbr-competent FRCs. When we followed the fate of E18.5 pLTo cells in inducible Ccl19 ieYFP Ltbr fl/fl mice to the age of 6 weeks, we found that Ltbr-deficient Ccl19-expressing FRC progenitors remained arrested in the perivascular TRC1 niche (Fig. 3e, arrowheads). Similarly, ablation of Ltbr expression in the Col6a1 Cre lineage resulted in the lack of transgene-expressing MRC and FDC networks and a remaining subepithelial fibroblast layer covering the subepithelial dome (SED) (Fig. 3f, arrowheads). Moreover, lack of LTβR signaling in either of the lineages led to a maturation defect of lineage-derived FDCs demonstrated by the lack of CD21/35 expression on Ccl19 eYFP + or Col6a1 eYFP + cells in the GC regions (Fig. 3g, arrows). Additionally, lack of LTβR signaling in the Ccl19 Cre lineage resulted in the lack of lineage-associated MRCs (Extended Data Fig. 5e). Concomitant ablation of Ltbr expression in Ccl19 eYFP+ and Col6a1 eYFP+ cells completely blocked FDC maturation (Extended Data Fig. 5f) lending further support to the interpretation that the two FRC lineages cooperate in the generation of productive niches for B cells in PPs. In sum, these data indicate that perivascular, Ccl19-expressing LTo cells differentiate into TRC2/3, TBRCs, some MRCs and FDCs in a LTβR-dependent fashion, while subepithelial, Col6a1-expressing sub-epithelial LTo cells depend on LTβR signals to generate MRCs and FDCs (Fig. 3h).
Figure 3. Lymphotoxin-β-receptor signaling dependent FRC organization in PP microdomains.
a-b, Number of PPs and B cell follicles in PPs from adult Ltbr fl/fl (n=30), Ccl19 Cre Ltbr fl/fl (n=22), Col6a1 Cre Ltbr fl/fl (n=7) and Ccl19 Cre Col6a1 Cre Ltbr fl/fl (n=6) mice. c-d, Confocal microscopy analysis showing EYFP+ FRC networks in adult PP. e, Images depict EYFP+ cells representing progeny of E18.5 progenitors in the T cell zone of adult PP of inducible Ccl19 ieYFP mice. Arrowheads indicate perivascular location of Ltbr-deficient EYFP+ cells. f, Confocal microscopy of EYFP+ FRC networks in subepithelial dome and g, B cell follicle, arrowheads in f indicate subepithelial YFP+ cells, arrows in g indicate EYFP+CD21/35- cells. h, Schematic depiction of LTβR signaling in FRC differentiation. Scale bars, 20 μm (c-e,g), 30 μm (f),. Images are representative of 3-4 mice per group, at least 2 independent experiments. (a,b) SEM is indicated; P values as per two-tailed Mann Whitney Test.
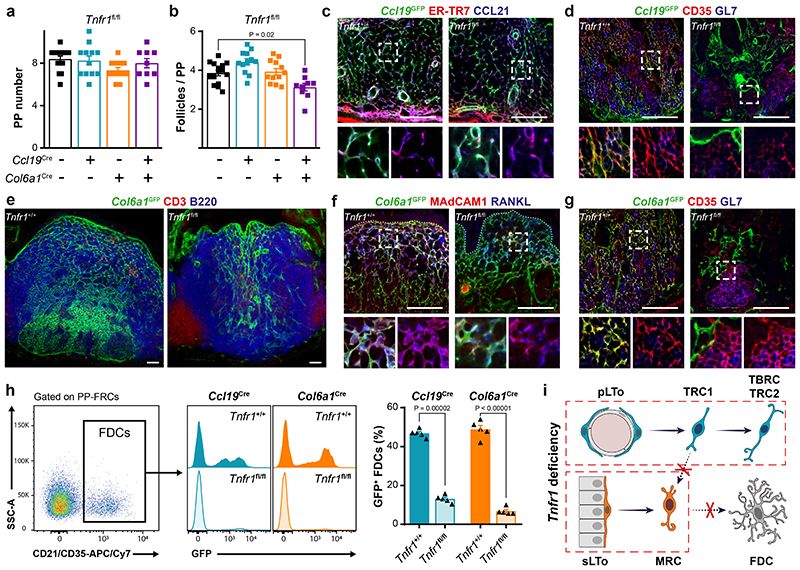
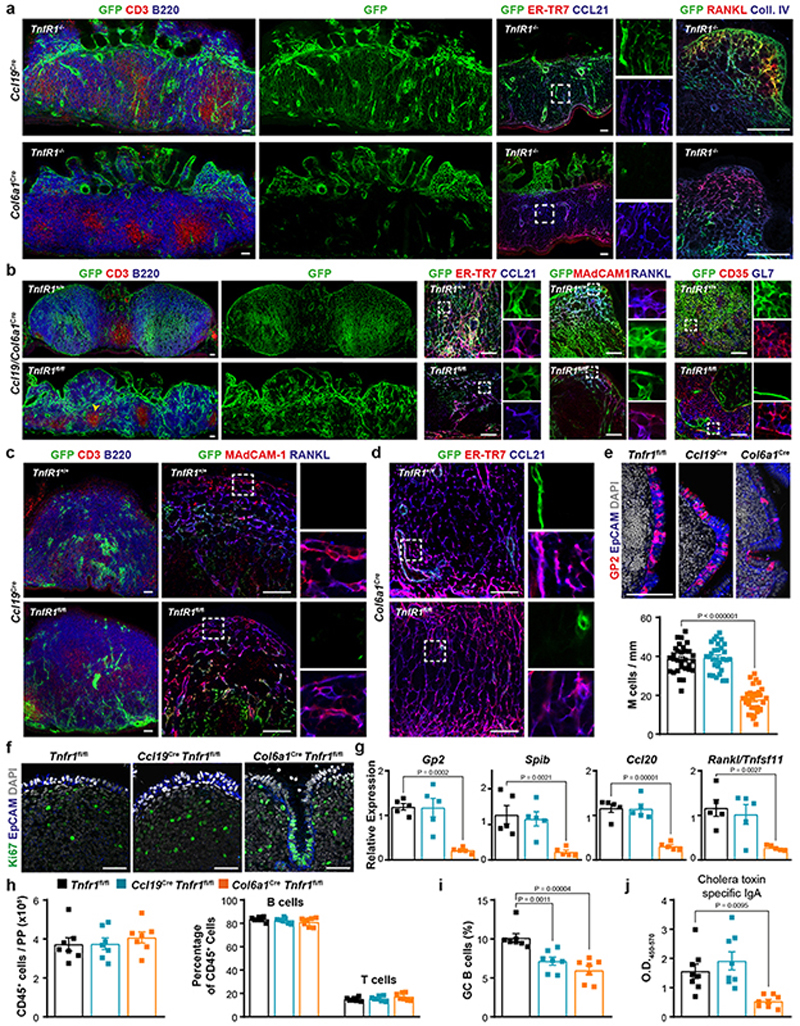
Tnfr1 –/– mice show reduced numbers of PPs with defective lymphoid segregation, and TNF signaling is necessary for FDC differentiation and GC formation30, 31. High resolution confocal microscopic analysis of the two FRC lineages in Tnfr1 –/– PPs revealed an extensive Ccl19 GFP+ network located between the musclular layer and the intestinal villi, characterized by the expression of the TRC markers CCL21 and ER-TR7 (Extended Data Fig. 6a). Col6a1 GFP+ cells were located inside the intestinal villi, some of which were enlarged and contained GFP+ RANKL+ MRC-like cells (Extended Data Fig. 6a). Tnfr1 ablation in the Ccl19 Cre or Col6a1 Cre lineages did not significantly affect PP formation or B cell follicle maturation (Fig.4a–b). However, when Tnfr1 expression was deleted in both lineages, B cell follicle numbers were reduced (Fig. 4b) and B-T cell zone compartmentalization was impaired (Extended Data Fig. 6b) suggesting that both FRC lineages contribute to the TNF-mediated formation of proper B cell environments. To assess the impact of TNFR1 signaling on FRC differentiation in more detail, we characterized the topology and FRC marker expression in both Ccl19 Cre and Col6a1 Cre lineages. While TRC and MRC networks in Ccl19 GFP Tnfr1 fl/fl PPs (Fig. 4c and Extended Data Fig. 6c) were not affected by the lack of TNF stimulation, maturation of GFP+ FDCs was strongly reduced (Fig. 4d). Likewise, Tnfr1 deletion in the Col6a1 lineage blocked the differentiation of FDCs, while MRC development was affected to a lesser extent (Fig. 4e–h and Extended Data Fig. 6d). Previous work has shown that FRCs in PPs regulate the FAE maturation and the differentiation of transcytosing microfold (M) cells by producing receptor activator of NF-κB ligand (RANKL)32, 33. We found that Tnfr1 deletion in the Col6a1 lineage impaired the differentiation of M cells (Extended Data Fig. 6e) and induced the formation of proliferative crypts in the epithelial dome (Extended Data Fig. 6f), which correlated with a reduction in the expression of Tnfsf11 and other molecules involved in M cell differentiation (Extended Data Fig. 6g). Although Tnfr1 deletion in neither of the FRC lineages altered PP immune cell composition (Extended Data Fig. 6h), both the induction of GC B cells (Extended Data Fig. 6i) and the production of specific IgA upon oral immunization with cholera toxin were reduced in Col6a1 Cre Tnfr1 fl/fl PPs (Extended Data Fig. 6j) indicating specific lineage-restricted functions. Collectively, these data reveal that signaling via the LTβR is required for subset formation in both FRC lineages, while TNFR1 signaling enables lineage convergence through the formation of the MRC-to-FDC differentiation trajectory (Fig. 4i).
Figure 4. TNFR1 signaling in FRCs regulates follicle organization.
a-b, Number of PPs and B cell follicles in PPs from adult Tnfr1 fl/fl (n=15), Ccl19 Cre Tnfr1 fl/fl (n=12), Col6a1 Cre Tnfr1 fl/fl (n=12) and Ccl19 Cre Col6a1 Cre Tnfr1 fl/fl (n=9) mice. c-d, Confocal microscopy pictures showing the targeting of CCL21+ER-TR7+ TRCs and CD35+ FDCs by Ccl19 Cre in a Tnfr1 +/+ and Tnfr1 fl/fl background. e-g, Confocal microscopy showing the topology and phenotype of Col6a1 Cre FRC networks in Tnfr1 +/+ and Tnfr1 fl/fl PPs. h, Flow cytometry analysis showing the reduction of GFP+ FDCs after Tnfr1 deletion in the Col6a1 Cre or Ccl19 Cre lineages. CD21/CD35+ FDCs are gated on the PP-FRC population, as in Extended Data Figure 1a (n=5 mice/genotype). i, Schematic depiction of TNFR1 signaling in FRC differentiation. Scale bars, 50 μm. Box shows magnified areas (c,d,f,g). Images are representative of 5-7 mice per group, at least 2 independent experiments. P values as one-way ANOVA (a,b) or two-tailed t-test (h). Mean and SEM are indicated.
FRC lineage convergence governs intestinal homeostasis
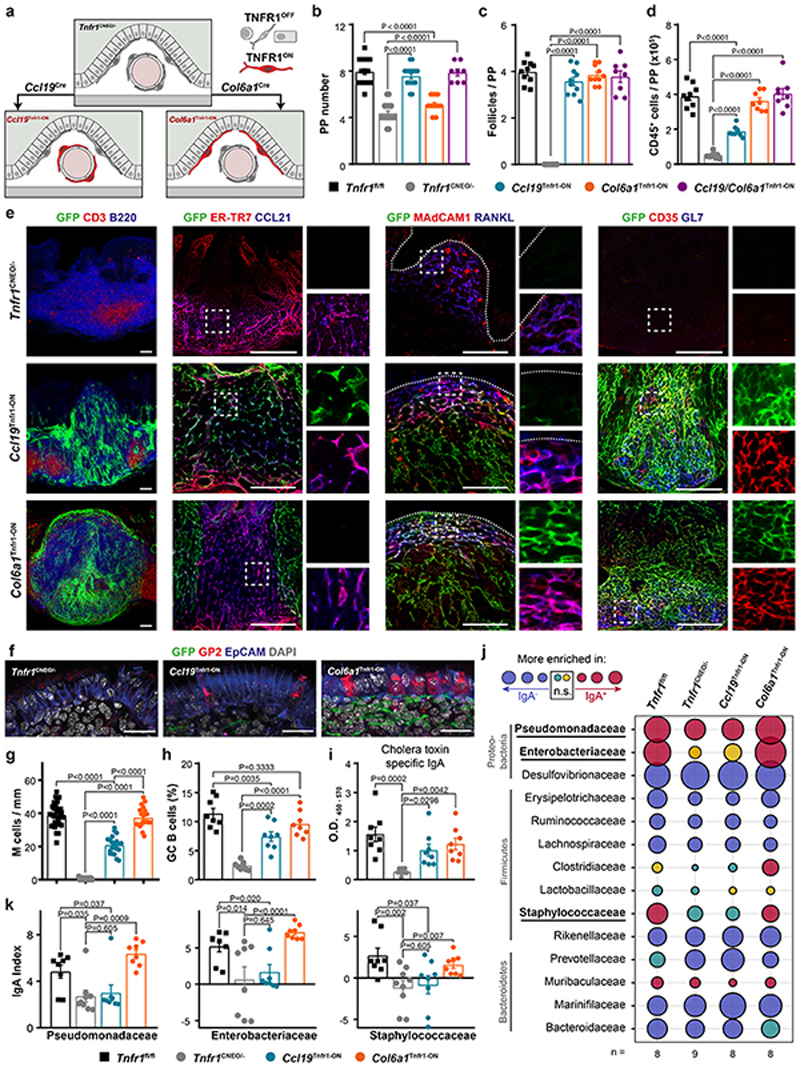
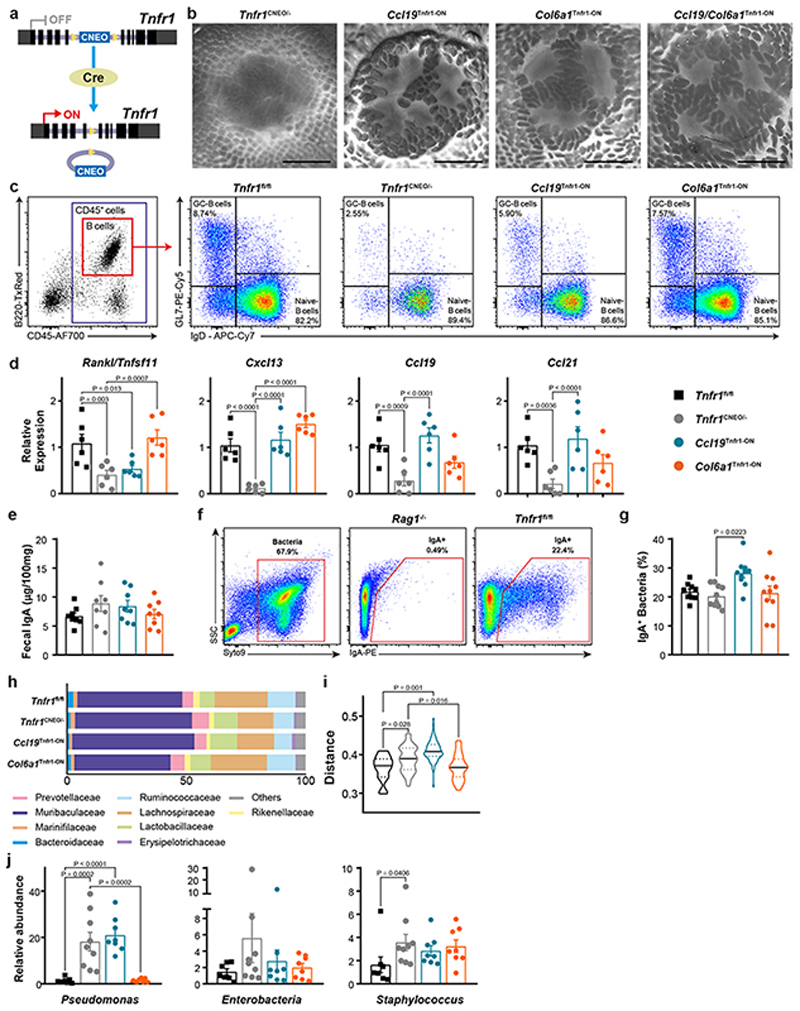
To elaborate the functional importance of the TNFR1-dependent FRC lineage convergence and the impact of B cell follicle organization, we employed a mouse model carrying a conditional gain-of-function Tnfr1 allele (Tnfr1 cneo14) (Fig. 5a and Extended Data Fig. 7a). As expected, Tnfr1 cneo/− mice resembled the Tnfr1 −/− mouse phenotype, including a reduction in the number and size of PPs, a disorganized structure and absence of FDCs and GC B cells (Extended Data Fig. 7b–c). TNFR1 reactivation solely in the Ccl19 Cre lineage (Ccl19 Tnfr1-ON) resulted in the gain of both the number of PPs and B cell follicles when compared to Tnfr1 cneo/− mice (Fig. 5b–c and Extended Data Fig. 7b). Ccl19 Tnfr1-ON PPs contained less immune cells compared to Tnfr1-proficient PPs (Fig. 5d), indicating a compensatory role of the Col6a1 Cre lineage. Indeed, restoration of Tnfr1 in the Col6a1 Cre lineage (Col6a1 Tnfr1-ON) fully recovered B cell follicle development and immune cell content (Fig. 5c–d), but not the number of PPs (Fig. 5b). Notably, TNFR1 reactivation in both lineages (Ccl19/Col6a1 Tnfr1-ON) led to the restoration of the number of PPs, B cell follicles and immune cells (Fig. 5b–d), confirming that TNFR1 signaling is required in both lineages for proper PP development.
Figure 5. Tnfr1 expression by either of the two mesenchymal populations is sufficient to organize PPs.
a, Schematic of Tnfr1 cneo model. b-d, Quantification of the number of PPs, follicles per PP and CD45+ cells in adult Tnfr1 fl/fl, Tnfr1 cneo/-, Ccl19 Tnfr1-ON, Col6a1 Tnfr1-ON and Ccl19/Col6a1 Tnfr1-ON mice. e, Histological analysis of adult PPs from Tnfr1 cneo/-, Tnfr1C cl19-ON and Tnfr1 Col6a1-ON mice showing Cre-mediated GFP expression (green) and the indicated markers for B cells (B220), T cells (CD3), TRCs (ER-TR7 and CCL21), MRCs (MAdCAM-1 and RANKL), FDCs (CD35) and germinal center B cells (GL7). Box shows magnified areas. Dot lines mark the epithelial layer. Scale bar, 50μm. Representative of 5 mice per group. f-g, Confocal images and quantification of GP2+ M cells in the epithelial dome. Scale bar, 25 μm. Several PP follicles from Tnfr1 fl/fl (n=6), Tnfr1 cneo/- (n=4), Ccl19 Tnfr1-ON (n=5) and Col6a1 Tnfr1-ON (n=5) mice were analyzed. h, Flow cytometric analyses characterizing the proportion of GC-B cells in PPs (n=8 mice/genotype). i, ELISA of cholera toxin–specific IgA response. Mice were orally Ccl19/Col6a1 Tnfr1-ON mice. e, Histological analysis of adult PPs from Tnfr1 cneo immunized with cholera toxin 1 week before the examination (n=8 mice/genotype). j, Bubble plot showing IgA responses to major bacteria taxons, defined by the IgA index. Threshold for significant enrichment was determined by paired Wilcoxon test (P<0.05). k, IgA index in fecal bacterial samples of Pseudomonadaceas, Enterobacteriaceae and Staphylococcaceae from the indicated genotypes (Tnfr1 fl/fl n=8, Tnfr1 cneo/- n=9, Ccl19 Tnfr1-ON n=8, Col6a1 Tnfr1-ON n=8). P values as one-way ANOVA (b-d, g-i,k) or Wilconxon rank sum test (j). Mean and SEM are indicated.
Further analyses demonstrated that the structural segregation of B cell follicles and interfollicular T cell zones, as well as the formation of FDC-containing GCs was restored with Tnfr1 being re-expressed on either of the FRC lineages (Fig. 5e). Interestingly, cells of the Ccl19 Cre lineage showed a higher abundance and populated the whole PP except the subepithelial region when Tnfr1 expression was re-introduced (Fig. 5e, arrows). In contrast, re-expression of Tnfr1 in the Col6a1 Cre lineage restored MRC networks in the subepithelial dome extending to the FDC network in the B cell follicle (Fig.5e, arrowheads), further supporting the notion that MRC-to-FDC transition is mainly dependent on TNFR1 signaling.
Similar to the above observations using Tnfr1 conditional knockout mice, we found that restoration of TNFR1 signaling in the Col6a1 Cre was sufficient to promote the normal differentiation of M cells in the follicle-associated epithelium (Fig.5f–g). Restoration of Tnfr1 expression in the Col6a1 Cre lineage led to recovery of Tnfsf11 and Cxcl13 expression, whereas the expression of T cell zone chemokine Ccl19 and Ccl21 required TNFR1 signaling in the Ccl19 Cre lineage (Extended Data Fig.7d). Both Ccl19 Tnfr1-ON and Col6a1 Tnfr1-ON PPs re-established GC B cell activation and the production of specific IgA upon oral immunization with cholera toxin, when compared to TnfR1 cneo/− PPs (Fig.5h,i). Aside from mediating enteric pathogen and toxin neutralization, IgA is responsible for establishing symbiotic relations between the host and intestinal microbiota34. To assess to which extent FRC-dependent PP integrity affects intestinal IgA responses, we performed 16S rRNA sequencing of IgA-bound bacteria. Fecal samples from Tnfr1 cneo/− mice showed no overt changes in bacterial families enriched in the IgA− fraction compared to samples from Tnfr1-proficient mice (Fig. 5j). However, a significant reduction in IgA production against three highly coated bacterial families (Pseudomonadaceae, Enterobacteriaceae, Staphylococcaceae) was observed in Tnfr1-deficient mice (Fig. 5k and Supplementary Table 1). TNFR1 reactivation in Col6a1 Tnfr1-ON, but not in Ccl19 Tnfr1-ON PP, restored the IgA response and microbiota composition (Fig. 5k and Extended Data Fig. 6e–j). Collectively, TNFR1-dependent FRC lineage convergence orchestrates PP organogenesis and functionality with a particular need for TNF-mediated FDC maturation in the Col6a1 Cre lineage to optimize IgA output against commensal bacteria.
FRC lineage convergence supports anti-coronavirus B cell responses
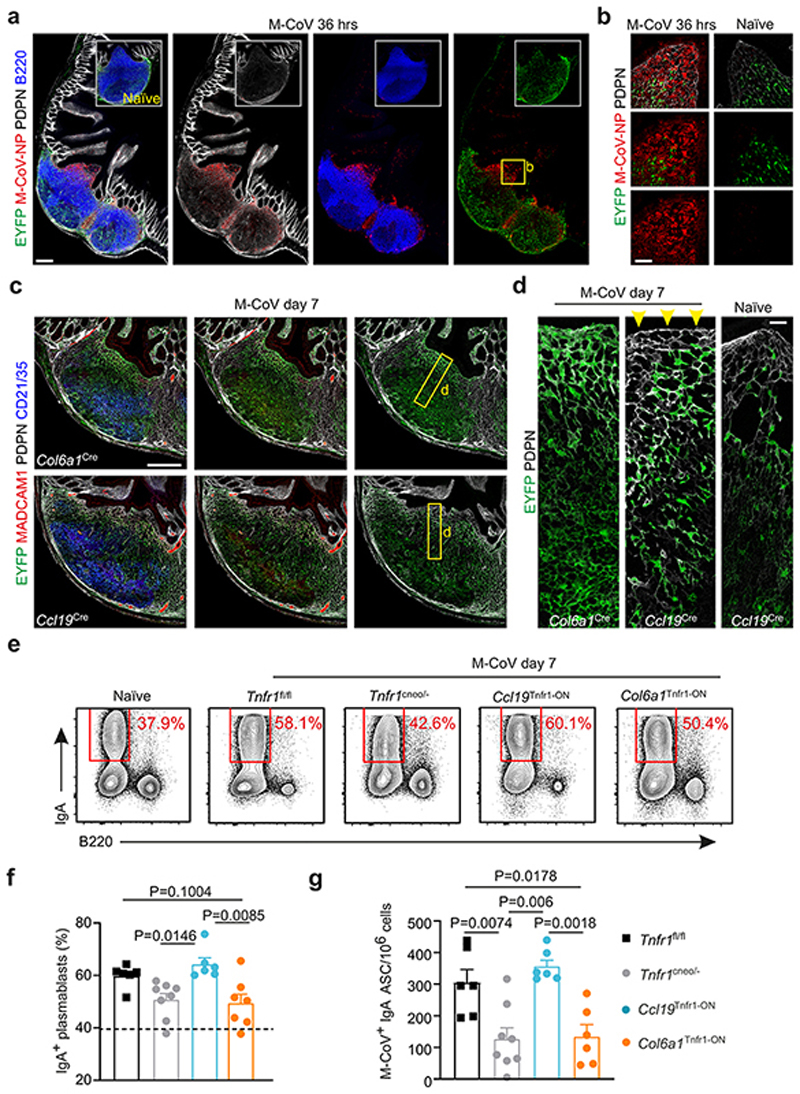
FRCs of lymph nodes have been recognized as key players for the generation of protective immunity against viral infections10, 11, 27. PP FRCs of the Ccl19-Cre lineage regulate intestinal inflammation during infection with the murine coronavirus (M-CoV) via IL-15-mediated control of group 1 ILCs7. High expression of the nucleoprotein (NP) of M-CoV could be detected in the SED and T cell zones of PPs already 36 h after oral infection (Fig. 6a–b). We found elevated Ccl19-Cre activity in FDC and MRC networks at day 7 post infection (Fig. 6c). Subepithelial FRC networks exhibited only minor Ccl19-Cre activity (Fig. 6d) indicating that FRC lineage identity was largely preserved during intestinal M-CoV infection. Since convergence of FRC lineages in the MRC-FDC differentiation trajectory was strictly dependent on Tnfr1 expression, we assessed M-CoV infection in Tnfr1 cneo/- and in lineage-specific Tnfr1 gain-of-function mice. Restriction of Tnfr1 expression to the Ccl19-Cre lineage (Ccl19 Tnfr1-ON), but not to the Col6a1-Cre lineage (Col6a1 Tnfr1-ON), was sufficient for the generation of IgA+ plasmablasts (Fig. 6e–f) and the restoration of M-CoV-specific IgA+ antibody-secreting cells (Fig. 6g) in the lamina propria of infected mice to normal levels. These data indicate that TNFR1-dependent activation of the Ccl19-Cre lineage not only restores PP organogenesis, but also critically contributes to anti-coronavirus IgA responses against M-CoV infection.
Figure 6. FRC lineage convergence and intestinal coronavirus infection.
a, Confocal microscopy analysis of Peyer’s patches (PPs) harvested from Ccl19 eYFP mice, which were intraorally infected with murine coronavirus (M-CoV) 36 h prior analysis. Inserted images show B cell follicles from non-infected (naïve) littermate control mice. Box indicates representative region of the sub-epithelial dome (SED) shown in b. c, Images depict B cell follicles, SEDs and perifollicular T cell zones of PPs from M-CoV infected mice at day 7 after infection. Boxes indicate representative regions shown in d. Arrowheads in d indicate lack of EYFP expression under the follicle associated epithelium. e-f, Flow cytometric analysis of Immunoglobulin IgA-producing plasmablasts and B cells in the lamina propria of M-CoV infected mice (Tnfr1 fl/fl n=6, Tnfr1 cneo/- n=8, Ccl19 Tnfr1-ON n=6, Col6a1 Tnfr1-ON n=6) at day 7 after infection. Numbers indicate percentage of gated population. g, Enumeration of M-CoV+ IgA secreting cells (ASC) per million of B cells. Scale bars, 200 μm (a,c), 30 μm (b), 10 μm (d). Images are representative of 3-4 mice per group, at least 2 independent experiments. (f,g) Mean percentages and SEM are indicated; P values as one-way ANOVA.
Discussion
We have provided an extensive molecular characterization of the PP FRC landscape and the mechanisms that govern PP development and patterning. Consecutive activation of perivascular and subepithelial fibroblast lineages underpins the mosaic nature of PP FRCs. The convergence of both FRC lineages towards the MRC-FDC subsets ensures robust establishment of microenvironmental niches that secure B cell activation and differentiation. Synergistic and partially compensatory mechanisms between both lineages grant the induction of adaptive immune responses against intestinal viral infection and the IgA-dependent regulation of commensal microbiota.
Our study reveals unique patterning in the FRC landscape in PPs when compared to other secondary lymphoid organs. FRCs in the splenic white pulp and lymph node originate solely from perivascular LTo cells with splenic FRC progenitors being located around central arterioles of the primordial white pulp12, while FRC progenitors in lymph nodes appear to reside around venules of the anlagen13, 20. We found that LTi cell accumulation in PP anlagen occurs first in a mesh of post-capillary venules in proximity to the muscular layer leading to LTβR-dependent FRC maturation from perivascular LTo cells. In an important step following the initial activation of perivascular LTo cells and concomitant with increased immigration of T and B cells, progressive LTβR-dependent activation of the subepithelial LTo cells precipitate the formation of MRC networks. Importantly, TNF-mediated stimulation of progenitor cells from both the Ccl19 Cre and the Col6a1 Cre lineage resulted in the activation of the MRC-FDC differentiation trajectory. Since microbial colonization determines FDC formation in intestinal lymphoid organs35 and TLR4-mediated stimulation further promotes FDC activation36, it is most likely that pre- and post-weaning exposure to microbial components drives the TNF-mediated MRC and FDC maturation in the two FRC lineages. In addition, other stromal cell populations in secondary lymphoid organs, such as blood and lymphatic endothelial cells in lymph nodes37, 38, express the TNFR1 and can therefore contribute to the global activation of the stromal cell infrastructure. Hence, FRC lineage convergence in PPs probably underpins – in concert with other activated stromal cells – the recently described weaning reaction that grants maturation of the immune system39 and is important to prevent diseases such as allergies or colitis later in life.
Recent single cell transcriptomics analyses have begun to unravel the complexity of FRC niches in secondary lymphoid organs. It appears that lymph nodes harbor seven to nine different FRC subsets10, 11, while the splenic white pulp is formed by four main FRC populations12. Our study reveals the presence of six major PP FRC subsets, which relate to the previously described subsets in lymph nodes and spleen. MRCs appear to underpin the antigen sampling zone being present in the marginal zone of the splenic white pulp, the subcapsular sinus in lymph nodes and the subepithelial dome of PPs. The PP data confirm that Madcam1 together with the high expression of Cxcl13 appears to be the best suitable cross-organ MRC marker, also on the protein level10, 11. Interestingly, PP MRCs show the expression of FDC genes such as Coch, Sncg, Sox9 11 suggesting that the PP microenvironment requires particular functional adaptations of MRCs. PP FDCs share the high expression of complement receptors (CD25/35) with their counterparts in other lymphoid organs10, 11, 12, but show uniquely high expression of the high affinity receptor for IgM and IgA (FCAMR). Here, we did not find further PP FDC segregation into light and dark zone subsets, a hallmark of activated B cell zones with an ongoing GC reaction in lymph nodes11, 40. Likewise, TBRC in PPs with the Acta2 high Madcam1 high phenotype appear to exhibit different functional properties when compared to Ccl19/Ccl21 low Madcam1 – reticular cells at the lymph node T-B cell zone border10. The FRC population labeled as TRC1 in PPs is located around blood vessels and shares properties with perivascular stromal cells of lymph nodes such as the stemness marker Cd34 10 and the splenic perivascular reticular cell markers Ly6a (stem cell antigen-1), Acta2 and Pdgfrb 12. We consider it highly likely that the perivascular TRC1 population harbors multipotent FRC progenitors in the adult PPs to replenish TRC2 and 3 in the T cell zone, TBRCs and probably B cell zone FRC populations. Two TRC subsets (TRC2 and 3) appeared in our analysis, with TRC2 exhibiting high expression of interferon-induced genes. Such activated FRC subsets appear to be situated specifically in regions, such as SEDs and T cell zones, where exposure to antigen is high and where early infection with M-CoV was detected. Infection with the human severe acute respiratory syndrome coronavirus 2 (SARS-CoV-2) not only induces immunopathological processes in the respiratory system, but is also accompanied with gastro-intestinal complications41. Protection against intestinal pathogens and the maintenance of a protective barrier against commensal bacteria is maintained to a large extent by IgA-producing B cells that are induced in Peyer’s patches42, 43, 44. Thus, it is conceivable that SARS-CoV-2 infection-associated gastro-intestinal disease could be underpinned by deficiencies in antiviral processes in PPs, including the insufficient generation of immune cell niches by dysfunctional FRC networks.
FRC differentiation from the different progenitor populations in PPs is a structured and hierarchical process. Signaling via the LTβR appears to be the main switch, a “signal 1” as suggested for splenic FRCs12 that determines whether perivascular or subepithelial fibroblastic progenitors enter the differentiation trajectory towards immune-interacting fibroblasts. TNF-dependent differentiation of FDCs represents a mandatory second signal and highlights the potential of the two different PP FRC lineages to converge in the FDC subset. However, TNF-mediated stimulation can override the requirement of LTβR-dependent FRC activation, as exemplified in non-classical secondary lymphoid organs such a fat-associated lymphoid clusters (e.g. omental milky spots), which develop and function under conditions of Ltbr-deficiency45. Clearly, FRC convergence from different fibroblastic progenitor populations and the utilization of complementary mechanisms provides a failsafe mechanism for the generation of immune-stimulating environments not only in secondary lymphoid organs, but also in differentiated inflammatory lesions that are commonly known as tertiary lymphoid structures46. In the future, it will be interesting to investigate whether the existence of different fibroblast sources and the mechanisms that we have uncovered here can also contribute to development of other tissues and participate in pathologies like chronic inflammation, fibrosis or tumorigenesis.
Methods
Mice
R26 eYFP, R26 mT/mG and R26 Brainbow2.1 reporter mice and Rag –/– mice were obtained from the Jackson Laboratory. The Ccl19 Cre9, Col6a1 Cre47, Ccl19 Tta12, Ltbr fl/lf48, TnfR1 –/–49, Tnfr1 fl/fl50, Tnfr1 cneo23 strains were described previously. Fate-mapping experiments were performed via treating the pregnant dams with 1 mg doxycycline (Sigma Aldrich) intraperitoneally and maintenance of doxycycline in the drinking water (1 mg/ml). For the commensal microbiota studies, mice were housed in a single room and soiled cage bedding was routinely mixed twice per week and distributed among all cages from weaning (four weeks old) until the onset of the study (10-12 weeks old). All mice were bred and maintained on a C57BL/6 genetic background in the animal facilities of the Biomedical Sciences Research Center “Alexander Fleming” and the Kantonsspital St. Gallen under specific pathogen-free conditions.
Experiments were performed in accordance with all current European and national legislation and were approved by the Institutional Committee of Protocol Evaluation in conjunction with the Veterinary Service Management of the Hellenic Republic Prefecture of Attika and the Swiss federal and cantonal guidelines (Tierschutzgesetz) under the permissions SG01/18, SG12/17, SG11/19 and SG08/18 granted by the Veterinary Office of the Kanton of St. Gallen.
Droplet-based single cell RNA-sequencing analysis
cDNA libraries were generated on a 10X Chromium (10X Genomics)51 following the recommended protocol for the Chromium Single Cell 3′ Reagent Kit (v2 Chemistry and v3 Chemistry) and libraries were sequenced on a NovaSeq 6000 sequencing system from Illumina at the Functional Genomic Center Zurich. CellRanger (v3.0.1)52 was used for an initial pre-processing of sequencing files including mapping to Ensembl GRCm38.94 release as reference. Subsequent quality control was run in R v3.6.0 utilizing functions from scater R/Bioconductor package (v1.11.2)53 and included removal of damaged, cycling and contaminating cells based on several criteria: (1) very high or low UMI counts (>2.5 median absolute deviation from the median across all cells), (2) very high or low total number of detected genes (>2.5 median absolute deviation from the median across all cells), (3) high mitochondrial gene content (> 2.5 median absolute deviations above the median across all cells), (4) expression of one of the cell cycle markers Top2a, Mki67, Cenpf or Pclaf, (5) expression of any of the contamination markers Lyve1, Cldn5, Ptprc, Cd79a, Vil1, Fcer1g, Gfap, S100b, Cd79b or high expression of Cdh5.
A total of 7 727 cells and 26 056 genes expressed in more than one cell remained after quality control with 3 374 cells expressing Eyfp. First, canonical correlation analysis as implemented in the Seurat package (v3.1.1)54 running in R v3.6.2 was used to integrate data across batches (first 17 correlation components were included for integration). Next, all cells remaining after quality control were analysed together and finally only Eyfp expressing cells were re-analyzed. Downstream analysis included normalization, scaling, dimensional reduction with PCA and UMAP and graph-based clustering utilizing functions from the Seurat package. Clusters were characterized based on the expression of canonical marker genes as well as unbiased cluster markers inferred from Wilcoxon test as implemented in the FindMarkers function of the Seurat package.
Trajectory analysis
Differentiation trajectories for FRC clusters were reconstructed using the Monocle 3 analysis toolkit (v0.2.0) running in R v3.6.2. Briefly, cells were assigned to partitions based on the calculated UMAP reduction and trajectories were inferred running the learn_graph function as implemented in the monocle3 package with parameters minimal_branch_length = 30, L1.gamma = 0.1 and L1.sigma = 0.05 in order to smooth graphs.
Antibodies
Anti-CD3 (17A2, AF594, 100240), anti-CD21/CD35 (7E9, APC-Cy7, 123418), anti-CD31 (390, PerCP-Cy5.5, 102420), anti-CD45 (30-F11, AF700, 103128), anti-B220 (RA3-6B2, biotin, 103204), anti-IgD (11-26c.2a, APC-Cy7, 405716), anti-MAdCAM-1 (MECA-367, purified, 120702; MECA-367, biotin, 120706) and anti-VCAM-1 (429, PE-Cy7, 105720) were purchased from Biolegend; anti-aSMA (1A4, eFluor660, 50-9760-82), anti-CD3e (145-2C11, PE-Cy7, 25-0031-82), anti-CD4 (RM4-5, AF700, 56-0042-82), anti-EpCAM (G8.8, purified, 14-5791-81), anti-GL7 (GL7, biotin, 13-5902-82), anti-IgA (mA-6E1, PE, 12-4204-82), anti-podoplanin (eBio8.1.1, eFluor660, 50-5381-82), anti-M-CoV-NP (J3.3), anti-CD34 (RAM34, biotin, 13-0341-82) and anti-RANKL (IK22/5, biotin, 13-5952-82) were purchased from Thermo Fisher; anti-CD31 (MEC13.3, purified, 550274), anti-CD35 (8C12, purified, 558768), anti-B220 (RA3-6B2, PE-CF594, 562290) were purchased from BD Pharmigen; anti-CCL21 (biotin, BAF457) was purchased from R&D Systems; anti-GP2 (2F11-C3, biotin, D278-6) was purchased from MBL; anti-collagen IV (purified, ab6586) and anti-ER-TR7 (purified, ab51824) were purchased from Abcam, anti-YFP (purified, 632459) and anti-TOMATO (purified, 632496) were purchased from Takara. Anti-M-CoV-NP (J3.3, purified, kindly provided by S. Siddell, University of Würzburg, Germany). Unconjugated antibodies were detected with the following secondary antibodies: Alexa Fluor 594-conjugated goat anti-rat-IgG (A11007), Alexa Fluor 594-conjugated goat anti-rabbit-IgG (A-11012), Alexa Fluor 647-conjugated goat anti-rat-IgG (A21247) all purchased from Thermo Fisher. Biotinylated antibodies were detected using AF647-Streptavidin (S21374) from Thermo Fisher, and PE-Cy5-(554062) or APC-Streptavidin (554067) from BD Pharmigen. RANKL and CCL21 expression were detected using the Tyramide SuperBoost Kit (Thermo Fisher, B40936).
Cell isolation and flow cytometry
PPs were harvested and washed with cold PBS. Epithelial cells were removed after incubation in Hank’s balanced salt solution (HBSS) supplemented with 5 mM EDTA, 1 mM DTT and 20 μM HEPES at pH 7.2 for 15 minutes at 37 °C. The remaining tissue was digested using an enzyme mix comprised of HBSS containing 10% fetal bovine serum, 0.8 mg/ml Dispase, 0.1 mg/ml Collagenese P (Roche) and 0.1 mg/ml DNase I (Sigma) for 45 min at 37 °C, as it was described previously55. Cells were washed with cold PBS and suspended in FACS buffer (PBS supplemented with 0.5% bovine serum albumin (BSA) and 5 mM EDTA in PBS) at 107 cells/ml. 100 μl of cell suspension was blocked using 4% of normal mouse serum and was then incubated for 30 min at 4 °C with the indicated antibodies.
The isolation of cells from small intestine lamina propia was performed as previously described56. Small intestines were flushed and after removal of Peyer patches, tissue was harvested and incubated three times for 15 min at 20°C under constant agitation with BSS containing 5% FCS (Lonza), 5 mM EDTA (Sigma), 10 mM HEPES (Sigma) at pH 7.2, and 1 mM DTT in order to dissociate the epithelial layer. The tissue was subsequently washed with BSS containing 10 mM HEPES at pH 7.2 and digested three times for 20 min at 37°C with 120 μg/ml collagenase P (Roche), 25 μg/ml DNAse I (Applichem), and 5 μg/ml Dispase I (Roche) in RPMI-1640. After obtaining a single-cell suspension, cells were purified by a 30%-70% Percoll gradient. Single-cell suspensions were first stained with the fixable viability dye Zombie Aqua (BioLegend) and incubated for 30 min on ice; after washing, cells were incubated for 20 min at 4°C in PBS containing 2% FCS and 10 mM EDTA with fluorochrome-labeled antibodies.
Finally, cells were sorted on a Bio-Rad S3 (Bio-Rad) or BD Melody cellsorter acquired on a BD Canto II (both BD Bioscience) or LSR Fortessa and data were analyzed using Flowjo software (Tree Star Inc).
Tissue processing and microscopy
Small intestines containing PPs were harvested from adult mice, washed with PBS, fixed in 4% PFA for 1 hour or overnight and immersed in 2% agarose. 40-70μm sections were obtained using a Leica VT1200S vibratome and blocked in PBS containing 1% albumin and 0.1% saponin for 30 min. Embryo or newborn small intestine were washed, fixed in PFA 4% for 1 hour and snap-frozen in an OCT-filled mold on a liquid nitrogen-cooled metal surface. 10μm-thick cryosections were rehydrated in wash buffer (0.1% saponin in PBS) for 5 min and blocked in PBS containing 0.5% albumin for 30 min. Sections were incubated with the indicated antibodies and images were acquired with a TCS SP8X White Light Laser confocal system (Leica) and a Zeiss LSM710 confocal microscope.
For whole tissue imaging, PPs were cleared using the ScaleA2 protocol57 for 2 weeks or Focus Clear (CelExplorer) and samples were imaged using the ZEISS Lightsheet Z.1 or LSM710 microscope. Acquired 3D data stacks were reconstructed employing Imaris (Bitplane) software. Images were processed for noise removal and cells were identified as objects based on the intensity of fluorescence in the respective channel and filtered based on size.
PCR
PP total RNA was purified using the RNeasy Mini Kit (Qiagen) and cDNA was synthesized using the M-MLV Reverse Transcriptase (Promega). Real-time (RT) PCR was performed in the CFX96 Real Time System (Bio-Rad) according to the manufacturer’s instructions, using the Platinum SYBR Green qPCR Mix (Thermo Fisher) and with the following primers: Gp2-F 5′-CTGCTACCTCGAAGGGGACT-3′; Gp2-R 5′-CATTGCCAGAGGGAAGAACT-3′; Spib-F GCCCACACTTAAGCTGTTTGTA-3′; Spib-R 5′-CTGTCCAGCCCCATGTAGAG-3′; Ccl20-F 5′-GATGGCCGATGAAGCTTGTG-3′; Ccl20-R 5′-GACTCTTAGGCTGAGGAGGTTC-3′; Rankl-F 5′-AAACAAGCCTTTCAGGGGGC-3′; Rankl-R 5′-TCCAACCATGAGCCTTCCATC-3′; Ccl19-F 5′-CCTTAGTGTGGTGAACACAACA-3′, Ccl19-R 5′-GGGTGCTAATGATGCGGAA-3′, Ccl21-F 5′-GCTGCAAGAGAACTGAACAGACA-3′, Ccl21-R 5′-CGTGAACCACCCAGCTTG-3′, Cxcl13-F 5′-TCTCTCCAGGCCACGGTATTCT-3′ and Cxcl13-R 5′-ACCATTTGGCACGAGGATTCAC-3′, b2m-F 5′-TTCTGGTGCTTGTCTCACTGA-3′, b2m-R 5′-CAGTATGTTCGGCTTCCCATTC-3′. Data were normalized to the housekeeping gene (b2m), analyzed using the 2–ΔΔCT method, and expressed relative to control groups as indicated.
Oral immunization with cholera toxin
Mice were food-deprived for 2 h and then stomach acidity was neutralized via administration of 0.2 ml of a solution containing eight parts HBSS and two parts 7.5% sodium bicarbonate by oral gavage. After 30 min, mice were immunized by oral gavage with 30μg cholera toxin (Sigma Aldrich). Fecal pellets were collected 7 days post immunization and analyzed by ELISA.
Murine coronavirus (M-CoV) infections
Mice were infected orally by gavage with 5×10⁴ pfu of the murine coronavirus (M-CoV) A59 as previously described7. Mice were sacrificed and cells from small intestine lamina propia were isolated for further cytometric analysis of B cell responses and quantification of M-CoV-specific IgA antibody secreting cells using ELISPOT.
ELISA and ELISPOT assay
Total IgA concentration in fecal samples was measured using the IgA Mouse Uncoated ELISA Kit (Thermo Fisher) according to the manufacturer’s instructions. Cholera toxin-coated plates in combination with the IgA Mouse Uncoated ELISA Kit were used for the detection of specific IgA.
ELISPOT assays were performed as previously described by58 using the ELISPOT kit from (MABTECH AB, Nacka Strand Sweden). Briefly, plates were coated overnight at 4°C with 5×10⁵ pfu of M-CoV A59 per well and incubated with 105 lamina propria cells for 24 h at 37°C in a 5% C02 atmosphere. Plates were washed five times with PBS and subsequently biotinylated anti IgA secondary antibody were added for 2 h at room temperature followed with streptavidin-HRP. Spots were visualized using TMB as substrate. The enzymatic reaction was stopped by rinsing the wells with water. Plates were dried overnight, and spots were counted with an ELISPOT-Reader and analyzed with the software ELISPOT 3.1SR (AID, Strassberg, Germany). Specific antibody forming cells of individual mice are expressed as mean of specific spot forming cells (experimental sample – negative control) per 106 cells from duplicate measurements.
Commensal bacteria analysis and IgA-sequencing
Analysis and isolation of IgA-coated bacteria was performed according to a previously described method59, 60. Fecal pellets were resuspended in PBS at 100mg/ml and incubated at 4°C for 20 min with shaking. After homogenization, samples were centrifuged at 50 × g for 15 min at 4°C and the supernatant was transferred into a new tube. Bacteria were washed 3 times in FACS buffer (PBS, 1% BSA and 5 mM EDTA) and pelleted at 12,000 × g for 1 min. Bacterial pellets were blocked with 10% rat serum for 30 min and subsequently stained with anti-mouse IgA-PE antibody for 30 min at 4°C. Samples were thoroughly washed and stained with SYTO 9 green fluorescent nucleic stain (10 μM; Life Technologies) before acquisition on a FACSARIA III (BD).
To isolate the IgA+ fractions, samples were processed as above and enriched by magnetic-activated cell sorting (MACS), using anti-PE MACS beads (Miltenyi Biotec). A 10μl aliquot of total bacteria was centrifuged before IgA enrichment for 16S rRNA sequencing analysis. IgA+ fraction was further purified by FACS sorting and 5 million bacteria were collected from each sample. All bacterial samples were centrifuged and stored at 20°C for further 16S sequencing analysis.
Bacterial DNA from total and IgA-sorted fecal samples was isolated using the QIAamp UCP Pathogen Mini Kit (Qiagen) according to the manufacturer’s instructions. The variable V3-V4 region of the 16S rRNA gene was amplified with universal primers and sequenced on an Illumina Miseq V3 platform (StarSEQ, Mainz, Germany).
Paired-end reads were joined together using PEAR61, and any reads of insufficient quality that prevented joining were discarded (< 6% of total reads). The resulting sequences were analyzed with QIIME2 v2019.1062. Reads were corrected and Amplicon Sequence Variants (ASVs) were obtained by the deblur workflow. Taxonomy was assigned to ASVs using a Naive-Bayes approach of the scikit learn Python library and the SILVA database63. Weighted and unweighted UniFrac distances were used to visualize global differences in bacterial community compositions using Principal Coordinates Analysis. For Ig-A index calculation and statistical analysis, data files from QIIME were analyzed in the R environment. Taxonomy was summarized to phylum, class, order, family, and genus levels. A relative abundance threshold of 0.1% in either the total bacteria or the IgA+ fraction was used to define as “present” a certain taxon. To define the enrichment of each detected taxon in the IgA+ or IgA− fractions a paired Wilcoxon test was used. If a taxon was not detected in a given sample, that sample was excluded. A pseudocount (equal to 0.001, which was the lower limit of detection) was then added to every taxon detected from every sample. The differential representation of each taxon between the IgA+ and IgA− fractions was expressed in the form of an IgA index following the formula: log10(relative abundance in the IgA+ fraction / relative abundance in the bulk population). Wilcoxon rank sum test was used to compare the magnitude of IgA response between different genotypes.
Bacterial qPCR
Fecal DNA extraction and RT-PCR was performed using the reagents stated above. The abundance of specific bacterial groups was normalized with that of the total bacteria. The primers were as follows: for the total bacteria 5′-ACTCCTACGGGAGGCAGCAGT-3′ and 5′-ATTACCGCGGCTGCTGGC-3′; Pseudomonas 5′-ACTTTAAGTTGGGAGGAAGGG-3′ and 5′-ACACAGGAAATTCCACCACCC-3′; Enterobacteria 5′-TGCCGTAACTTCGGGAGAAGGCA-3′ and 5′-TCAAGGCTCAATGTTCAGTGTC-3′; Staphylococcus 5′-ACGGTCTTGCTGTCACTTATA-3′ and 5′-TACACATATGTTCTTCCCTAATAA-3′. Data were analyzed using the 2–ΔΔCT method, and expressed relative to control groups as indicated.
Statistical analysis
Statistical analyses were performed with GraphPad Prism 8, using one-way or two-way ANOVA unless specified otherwise. All of the statistical tests performed are indicated in the figure legends. The data are presented as mean ± s.d.
Extended Data
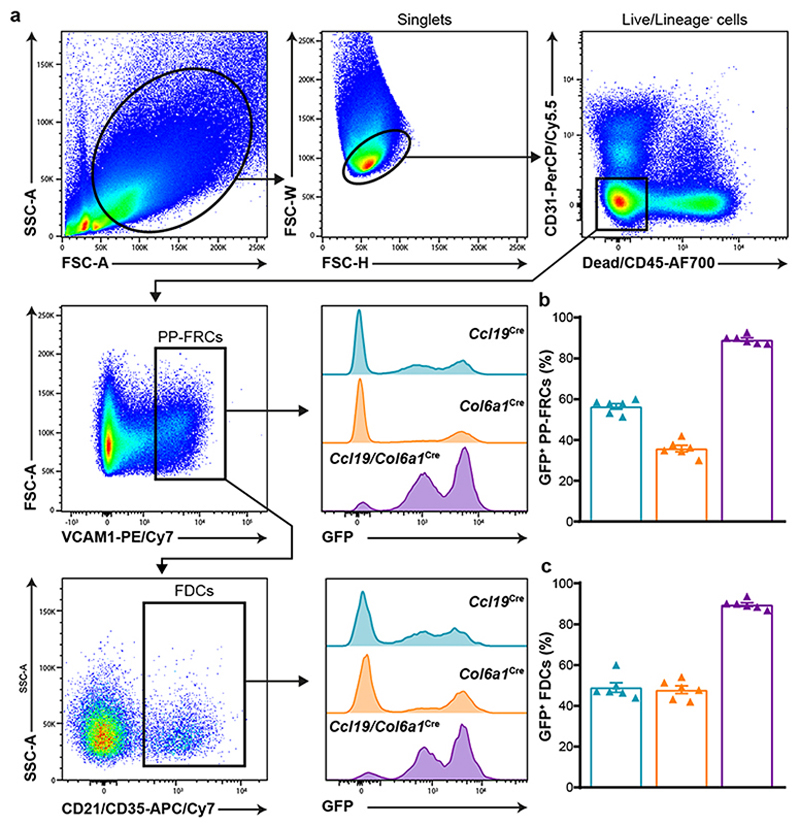
Extended Data Fig. 1. Flow cytometry analysis of PP-FRC and FDC targeting by the Ccl19Cre and Col6a1Cre strains.
a, FACS gating strategy used to analyze Cre-mediated GFP expression in PP-FRCs (live CD31-CD45-VCAM-1hi cells) and CD21/CD35+ FDCs from Ccl19 Cre R26 mTmG, Col6a1 Cre R26 mTmG and Ccl19/Col6a1 Cre R26 mTmG mice. b-c, Bar plot shows the proportion of targeted total FRCs (b) and FDCs (c) in these mice (n= 6 mice/genotype). Mean percentages and SD are indicated.
Extended Data Fig. 2. Single cell RNA sequencing analysis of PP FRC.
a, Flow cytometry based sorting strategy for PDPN+VCAM1+ fibroblasts from adult Ccl19 eYFP and Col6a1 eYFP PPs. b, Statistics for cell sorting and scRNA sequencing. c, UMAPs showing all fibroblasts sequenced, after removal of contaminating cells (see Materials and Methods). Highlighted are EYFP-expressing cells from the two different Cre driver lines, small UMAPs show gene expression to determine Adamdec1 + lamina propria fibroblasts (LPF) and Ccl19 + PP FRCs. d, UMAPs displaying 12 clusters of re-embedded EYFP+ fibroblasts and the contribution of the two Cre driver lines is shown in the boxed split UMAPs. e, Gene expression feature UMAPs showing Adamdec1 expression to determine lamina propria fibroblasts, Bmp5 to determine subepithelial fibroblasts (SEF) and Clu for the identification of PP FRCs among EYFP expressing cells. f, Images showing PP from adult Ccl19 eYFP mice. g, Heatmap displaying top marker gene expression of individual cells for each PP FRC cluster. Meso (Mesothelial cells), Myo (Myocytes); Scale bar, 500 μm. Images are representative of 3 mice. ScRNA-sequencing data represents 9719 fibroblasts (c) or 4492 EYFP+ fibroblasts (d), 8 biological replicates, 4 independent experiments.
Extended Data Fig. 3. Differentiation trajectories of PP FRC.
Gene expression levels of a, Ccl19 and Ccl21a; b, Ly6a, Klf4 and Cd34; c, Madcam1 and Cxcl13; d, Cr2 and Fcamr; e, Images showing PP anlagen at E18.5, P1 and P4 harvested from Ccl19 eYFP and Col6a1 eYFP mice. f, Images showing PP at P7 harvested from RagKOCcl19 eYFP and RagKOCol6a1 eYFP mice. Boxes indicate subepithelial region. Scale bars, 50 μm (e,f). Images are representative of at least 3 mice from 2-4 independent experiments. Monocle analysis is based on scRNA-sequencing data in Fig. 1c, N = 8 biological replicates, 4 independent experiments.
Extended Data Fig. 4. Fate-mapping of perivascular lymphoid tissue organizer cells.
a, Schematic description of fate-mapping experiments in Ccl19 iBbw2.1 mice. Pregnant mice were treated with Doxycyclin (Dox) at embryonic day (E) 18.5 and offsprings were analysed at indicated timepoints. b, Images showing PP anlage at E18.5 harvested from Ccl19 iBbw2.1 embryos. Dashed line indicates intestinal epithelium. c, Images showing PP anlagen at postnatal day (P) 1 and P4 (in d) harvested from Ccl19 iBbw2.1 pups kept on Dox since E18.5. Arrowheads indicate perivascular EYFP+ cell cluster. e, Images showing PP anlage at P7 harvested from Ccl19 1Bbw2.1 pups kept on Dox since E18.5. Boxed area indicates representative area of higher magnification images below, Arrowheads indicate EYFP+ cell cluster. f, Images show whole-mount analysis of adult PP from Ccl19 1Bbw2.1mice, which were kept without (w/o) Dox. g, Images depicting histological section of adult PP harvested from Ccl19 1Bbw2.1mice kept on doxycycline since E18.5. h, Images showing high resolution confocal analysis of EYFP+ and tdTOMATO+ cell clusters in PP from adult Ccl19 iBbw2.1 mice kept on Dox since E18.5.Scale bars, 20 μm (b,c), 50 μm (d), 100 μm (e), 500 μm (f,g), 10 μm (h). Images are representative of at least 3 mice from 2-3 independent experiments.
Extended Data Fig. 5. Peyer’s Patch structure in Ltbr conditional knock out mice.
a, Microscopy images showing PP of adult mice conditionally ablated for Ltbr in indicated Cre mouse lines. b-c, Mean fluorescence intensity analysis of indicated markers enumerated from microscopy images of adult Ccl19 eYFP Ltbr +/+ and Ccl19 eYFP Ltbr fl/fl PPs (n=4 mice per group). d, Confocal microscope images showing sections of adult Ccl19 eYFP Col6a1 eYFP Ltbr fl/fl and Ccl19 eYFP Co/6α1 eYFP Ltbr +/+ PPs. e, Images show EYFP+RANKL+MADCAM1+ MRC networks in PPs of indicated adult mice. f, Images show EYFP+CD21/35+ FDC networks in PPs of indicated adult mice. Scale bars, 500 μm (a,d), 20 μm (e,f). Images are representative of 3-5 mice from 2 independent experiments. (b,c) Mean percentages and SD are indicated; P values as per two-sided Student’s t-test.
Extended Data Fig. 6. Peyer’s Patch structure of Tnfr1 –/– and Tnfr1 conditional knock out mice.
a, Confocal microscopy images display the topology of Ccl19Cre and Col6a1 Cre lineages in Tnfr1 –/– PPs (n=5 mice per group). b, Confocal microscopy analysis of adult PPs from Ccl19/Col6a1 Cre Tnfr1 fl/fl mice. The arrowhead shows the presence of T cell aggregates under an epithelial dome of Ccl19/Col6a1 Cre Tnfr1 fl/fl PPs. c, Images showing the B cell area (left) and the MRC network in Ccl19 Cre Tnfr1 +/+ and Tnfr1 fl/fl mice. d, Confocal images showing TRC networks in Col6a1 Cre Tnfr1 +/+ and Tnfr1 fl/fl mice. e-f, Confocal microscope analysis showing GP2+ M cells and Ki67+ proliferating cells in the epithelial dome of adult Tnfr1 fl/fl, Ccl19 Cre Tnfr1 fl/fl, Col6a1 Cre Tnfr1 fl/fl PPs. M cells were quantified in PP follicles from 5 mice per group. g, Relative expression of Gp2, Spib, Ccl20 and Tnfsf11 in whole PPs measured by real-time PCR (n=5 mice/genotype). h-i, Flow cytometric analyses characterizing the absolute numbers of CD45+ cells, and the proportion of B cells, T cells GC-B cells in PPs (n = 7 mice/genotype). j, ELISA of cholera toxin–specific IgA response. Mice were orally immunized with cholera toxin 1 week before the examination (n=8 mice/genotype). Scale bars, 50 μm. Images are representative of 5 mice per group, at least 3 independent experiments. P values as one-way ANOVA (e,g,h-j). Mean percentages and SEM are indicated.
Extended Data Fig. 7. Structural and functional analysis of Tnfr1 reactivation in PP-FRCs.
a, Schematic description of Tnfr1 cneo model. b, PP stereoscope images from adult Tnfr1 cneo/-, Ccl19 Tnfr1-ON, Col6a1 Tnfr1-ON and Ccl19/Col6a1 Tnfr1-ON mice. Scale bar = 1mm. c, Gating strategy used in Figure 4d and 4i. d, Relative expression of Rankl/Tnfsf11, Cxcl13, Ccl19 and Ccl21 in FACS sorted PP-FRCs, measured by real-time PCR (n = 6 mice/genotype) e, Fecal IgA concentration measured by ELISA (n = 8 mice/genotype). f, Representative flow cytometry plots of IgA-coated bacteria. Rag1 –/– mice were used as a negative control. g, Frequencies of fecal IgA-coated bacteria in the indicated genotypes (n = 8 mice/genotype). h, Quantification of bacterial families with a relative abundance >1% in fecal samples. i, Unweighted UniFrac analysis for total fecal bacteria samples (Tnfr1 fl/fl n=8, Tnfr1 cneo/- n=9, Ccl19 Tnfr1-ON n=8 and Col6a1 Tnfr1-ON n=8). j, Relative abundance of Pseudomonas, Enterobacteria and Staphilococcus in fecal samples measured by qPCR (Tnfr1 fl/fl n=8, Tnfr1 cneo/- n=9, Ccl19 Tnfr1-ON n=8 and Col6a1 Tnfr1-ON n=8). P value as one-way ANOVA (d,e,g,j). Mean and SEM are indicated.
Supplementary Material
Acknowledgements
We would like to thank Michalis Meletiou and Spiros Lalos for technical assistance in mouse genotyping and histology. We thank Kleopatra Dagla and Sofia Grammenoudi for assistance in flow cytometry. This work was supported by the FP7 Advanced ERC Grant MCs-inTEST (grant 340217) to G.K and the Swiss National Science Foundation (grants 166500 and 182583) to B.L. The authors have no conflicting financial interests.
Footnotes
Author contributions
A.P. and L.O. designed and performed experiments, analyzed and interpreted data and wrote the manuscript; H.W.C, U.M., C.G.C. and C.P.S. performed experiments, M.L. analyzed data, V.K. analyzed and interpreted data and wrote the manuscript; B.L. and G.K. conceived and designed the study, discussed the data and wrote the manuscript.
Competing financial interests
B.L., L.O., C.G.C., C.P.S. and H.-W.C. are co-founders and shareholders of Stromal Therapeutics AG. H.-W.C. is part-time employee of Stromal Therapeutics AG. There are no conflicts of interest to report for the remaining coauthors.
Data availability statement
scRNA-seq datasets are available in ArrayExpress (accession number: E-MTAB-9162). The data that support the findings of this study are available from the corresponding authors.
References
- 1.Caruso R, Lo BC, Núñez G. Host-microbiota interactions in inflammatory bowel disease. Nat Rev Immunol. 2020;20:411–426. doi: 10.1038/s41577-019-0268-7. [DOI] [PubMed] [Google Scholar]
- 2.Lasry A, Zinger A, Ben-Neriah Y. Inflammatory networks underlying colorectal cancer. Nat Immunol. 2016;17:230–240. doi: 10.1038/ni.3384. [DOI] [PubMed] [Google Scholar]
- 3.Neurath MF. Targeting immune cell circuits and trafficking in inflammatory bowel disease. Nat Immunol. 2019;20:970–979. doi: 10.1038/s41590-019-0415-0. [DOI] [PubMed] [Google Scholar]
- 4.Macpherson AJ, Geuking MB, Slack E, Hapfelmeier S, McCoy KD. The habitat, double life, citizenship, and forgetfulness of IgA. Immunol Rev. 2012;245:132–146. doi: 10.1111/j.1600-065X.2011.01072.x. [DOI] [PubMed] [Google Scholar]
- 5.Macpherson AJ, Uhr T. Induction of protective IgA by intestinal dendritic cells carrying commensal bacteria. Science. 2004;303:1662–1665. doi: 10.1126/science.1091334. [DOI] [PubMed] [Google Scholar]
- 6.Chang JE, Buechler MB, Gressier E, Turley SJ, Carroll MC. Mechanosensing by Peyer’s patch stroma regulates lymphocyte migration and mucosal antibody responses. Nat Immunol. 2019;20:1506–1516. doi: 10.1038/s41590-019-0505-z. [DOI] [PMC free article] [PubMed] [Google Scholar]
- 7.Gil-Cruz C, et al. Fibroblastic reticular cells regulate intestinal inflammation via IL-15-mediated control of group 1 ILCs. Nat Immunol. 2016;17:1388–1396. doi: 10.1038/ni.3566. [DOI] [PMC free article] [PubMed] [Google Scholar]
- 8.Link A, et al. Fibroblastic reticular cells in lymph nodes regulate the homeostasis of naive T cells. Nat Immunol. 2007;8:1255–1265. doi: 10.1038/ni1513. [DOI] [PubMed] [Google Scholar]
- 9.Chai Q, et al. Maturation of Lymph Node Fibroblastic Reticular Cells from Myofibroblastic Precursors Is Critical for Antiviral Immunity. Immunity. 2013;38:1013–1024. doi: 10.1016/j.immuni.2013.03.012. [DOI] [PMC free article] [PubMed] [Google Scholar]
- 10.Rodda LB, et al. Single-Cell RNA Sequencing of Lymph Node Stromal Cells Reveals Niche-Associated Heterogeneity. Immunity. 2018;48:1014–1028. doi: 10.1016/j.immuni.2018.04.006. e1016. [DOI] [PMC free article] [PubMed] [Google Scholar]
- 11.Pikor NB, et al. Remodeling of light and dark zone follicular dendritic cells governs germinal center responses. Nat Immunol. 2020;21:649–659. doi: 10.1038/s41590-020-0672-y. [DOI] [PMC free article] [PubMed] [Google Scholar]
- 12.Cheng HW, et al. Origin and differentiation trajectories of fibroblastic reticular cells in the splenic white pulp. Nat Commun. 2019;10 doi: 10.1038/s41467-019-09728-3. 1739. [DOI] [PMC free article] [PubMed] [Google Scholar]
- 13.Denton AE, Carr EJ, Magiera LP, Watts AJB, Fearon DT. Embryonic FAP(+) lymphoid tissue organizer cells generate the reticular network of adult lymph nodes. J Exp Med. 2019;216:2242–2252. doi: 10.1084/jem.20181705. [DOI] [PMC free article] [PubMed] [Google Scholar]
- 14.Jarjour M, et al. Fate mapping reveals origin and dynamics of lymph node follicular dendritic cells. J Exp Med. 2014;211:1109–1122. doi: 10.1084/jem.20132409. [DOI] [PMC free article] [PubMed] [Google Scholar]
- 15.Krishnamurty AT, Turley SJ. Lymph node stromal cells: cartographers of the immune system. Nat Immunol. 2020;21:369–380. doi: 10.1038/s41590-020-0635-3. [DOI] [PubMed] [Google Scholar]
- 16.Onder L, Ludewig B. A Fresh View on Lymph Node Organogenesis. Trends Immunol. 2018;39:775–787. doi: 10.1016/j.it.2018.08.003. [DOI] [PubMed] [Google Scholar]
- 17.Jeucken KCM, Koning JJ, Mebius RE, Tas SW. The Role of Endothelial Cells and TNF-Receptor Superfamily Members in Lymphoid Organogenesis and Function During Health and Inflammation. Front Immunol. 2019;10:2700. doi: 10.3389/fimmu.2019.02700. [DOI] [PMC free article] [PubMed] [Google Scholar]
- 18.Veiga-Fernandes H, et al. Tyrosine kinase receptor RET is a key regulator of Peyer’s patch organogenesis. Nature. 2007;446:547–551. doi: 10.1038/nature05597. [DOI] [PubMed] [Google Scholar]
- 19.Yoshida H, et al. IL-7 receptor alpha+ CD3(-) cells in the embryonic intestine induces the organizing center of Peyer’s patches. Int Immunol. 1999;11:643–655. doi: 10.1093/intimm/11.5.643. [DOI] [PubMed] [Google Scholar]
- 20.Onder L, et al. Lymphatic Endothelial Cells Control Initiation of Lymph Node Organogenesis. Immunity. 2017;47:80–92. doi: 10.1016/j.immuni.2017.05.008. [DOI] [PubMed] [Google Scholar]
- 21.Nakagawa R, Togawa A, Nagasawa T, Nishikawa S. Peyer’s patch inducer cells play a leading role in the formation of B and T cell zone architecture. J Immunol. 2013;190:3309–3318. doi: 10.4049/jimmunol.1202766. [DOI] [PubMed] [Google Scholar]
- 22.Debard N, Sierro F, Browning J, Kraehenbuhl JP. Effect of mature lymphocytes and lymphotoxin on the development of the follicle-associated epithelium and M cells in mouse Peyer’s patches. Gastroenterology. 2001;120:1173–1182. doi: 10.1053/gast.2001.22476. [DOI] [PubMed] [Google Scholar]
- 23.Victoratos P, et al. FDC-specific functions of p55TNFR and IKK2 in the development of FDC networks and of antibody responses. Immunity. 2006;24:65–77. doi: 10.1016/j.immuni.2005.11.013. [DOI] [PubMed] [Google Scholar]
- 24.Prados A, Kollias G, Koliaraki V. CollagenVI-Cre mice: A new tool to target stromal cells in secondary lymphoid organs. Sci Rep. 2016;6 doi: 10.1038/srep33027. 33027. [DOI] [PMC free article] [PubMed] [Google Scholar]
- 25.Kinchen J, et al. Structural Remodeling of the Human Colonic Mesenchyme in Inflammatory Bowel Disease. Cell. 2018;175:372–386. doi: 10.1016/j.cell.2018.08.067. e317. [DOI] [PMC free article] [PubMed] [Google Scholar]
- 26.Afanasyeva MA, et al. Clusterin is a potential lymphotoxin beta receptor target that is upregulated and accumulates in germinal centers of mouse spleen during immune response. PLoS One. 2014;9:e98349. doi: 10.1371/journal.pone.0098349. [DOI] [PMC free article] [PubMed] [Google Scholar]
- 27.Perez-Shibayama C, et al. Type I interferon signaling in fibroblastic reticular cells prevents exhaustive activation of antiviral CD8(+) T cells. Sci Immunol. 2020;5:eabb7066. doi: 10.1126/sciimmunol.abb7066. [DOI] [PubMed] [Google Scholar]
- 28.Qiu X, et al. Reversed graph embedding resolves complex single-cell trajectories. Nat Methods. 2017;14:979–982. doi: 10.1038/nmeth.4402. [DOI] [PMC free article] [PubMed] [Google Scholar]
- 29.Livet J, et al. Transgenic strategies for combinatorial expression of fluorescent proteins in the nervous system. Nature. 2007;450:56–62. doi: 10.1038/nature06293. [DOI] [PubMed] [Google Scholar]
- 30.Pasparakis M, et al. Peyer’s patch organogenesis is intact yet formation of B lymphocyte follicles is defective in peripheral lymphoid organs of mice deficient for tumor necrosis factor and its 55-kDa receptor. Proc Natl Acad Sci U S A. 1997;94:6319–6323. doi: 10.1073/pnas.94.12.6319. [DOI] [PMC free article] [PubMed] [Google Scholar]
- 31.Neumann B, Luz A, Pfeffer K, Holzmann B. Defective Peyer’s patch organogenesis in mice lacking the 55-kD receptor for tumor necrosis factor. J Exp Med. 1996;184:259–264. doi: 10.1084/jem.184.1.259. [DOI] [PMC free article] [PubMed] [Google Scholar]
- 32.Nagashima K, et al. Identification of subepithelial mesenchymal cells that induce IgA and diversify gut microbiota. Nat Immunol. 2017;18:675–682. doi: 10.1038/ni.3732. [DOI] [PubMed] [Google Scholar]
- 33.Nagashima K, et al. Targeted deletion of RANKL in M cell inducer cells by the Col6a1-Cre driver. Biochem Biophys Res Commun. 2017;493:437–443. doi: 10.1016/j.bbrc.2017.09.004. [DOI] [PubMed] [Google Scholar]
- 34.Macpherson AJ, Yilmaz B, Limenitakis JP, Ganal-Vonarburg SC. IgA Function in Relation to the Intestinal Microbiota. Annu Rev Immunol. 2018;36:359–381. doi: 10.1146/annurev-immunol-042617-053238. [DOI] [PubMed] [Google Scholar]
- 35.Hanson NB, Lanning DK. Microbial induction of B and T cell areas in rabbit appendix. Dev Comp Immunol. 2008;32:980–991. doi: 10.1016/j.dci.2008.01.013. [DOI] [PMC free article] [PubMed] [Google Scholar]
- 36.El Shikh ME, El Sayed RM, Wu Y, Szakal AK, Tew JG. TLR4 on follicular dendritic cells: an activation pathway that promotes accessory activity. J Immunol. 2007;179:4444–4450. doi: 10.4049/jimmunol.179.7.4444. [DOI] [PubMed] [Google Scholar]
- 37.Fujimoto N, et al. Single-cell mapping reveals new markers and functions of lymphatic endothelial cells in lymph nodes. PLoS Biol. 2020;18:e3000704. doi: 10.1371/journal.pbio.3000704. [DOI] [PMC free article] [PubMed] [Google Scholar]
- 38.Brulois K, et al. A molecular map of murine lymph node blood vascular endothelium at single cell resolution. Nat Commun. 2020;11 doi: 10.1038/s41467-020-17291-5. 3798. [DOI] [PMC free article] [PubMed] [Google Scholar]
- 39.Al Nabhani Z, et al. A Weaning Reaction to Microbiota Is Required for Resistance to Immunopathologies in the Adult. Immunity. 2019;50:1276–1288. doi: 10.1016/j.immuni.2019.02.014. e1275. [DOI] [PubMed] [Google Scholar]
- 40.Rodda LB, Bannard O, Ludewig B, Nagasawa T, Cyster JG. Phenotypic and Morphological Properties of Germinal Center Dark Zone Cxcl12-Expressing Reticular Cells. J Immunol. 2015;195:4781–4791. doi: 10.4049/jimmunol.1501191. [DOI] [PMC free article] [PubMed] [Google Scholar]
- 41.Lamers MM, et al. SARS-CoV-2 productively infects human gut enterocytes. Science. 2020;369:50–54. doi: 10.1126/science.abc1669. [DOI] [PMC free article] [PubMed] [Google Scholar]
- 42.Reboldi A, Cyster JG. Peyer’s patches: organizing B-cell responses at the intestinal frontier. Immunol Rev. 2016;271:230–245. doi: 10.1111/imr.12400. [DOI] [PMC free article] [PubMed] [Google Scholar]
- 43.Craig SW, Cebra JJ. Peyer’s patches: an enriched source of precursors for IgA-producing immunocytes in the rabbit. J Exp Med. 1971;134:188–200. doi: 10.1084/jem.134.1.188. [DOI] [PMC free article] [PubMed] [Google Scholar]
- 44.Ansaldo E, et al. Akkermansia muciniphila induces intestinal adaptive immune responses during homeostasis. Science. 2019;364:1179–1184. doi: 10.1126/science.aaw7479. [DOI] [PMC free article] [PubMed] [Google Scholar]
- 45.Benezech C, et al. Inflammation-induced formation of fat-associated lymphoid clusters. Nat Immunol. 2015;16:819–828. doi: 10.1038/ni.3215. [DOI] [PMC free article] [PubMed] [Google Scholar]
- 46.Buckley CD, Barone F, Nayar S, Benezech C, Caamano J. Stromal cells in chronic inflammation and tertiary lymphoid organ formation. Annu Rev Immunol. 2015;33:715–745. doi: 10.1146/annurev-immunol-032713-120252. [DOI] [PubMed] [Google Scholar]
- 47.Armaka M, et al. Mesenchymal cell targeting by TNF as a common pathogenic principle in chronic inflammatory joint and intestinal diseases. J Exp Med. 2008;205:331–337. doi: 10.1084/jem.20070906. [DOI] [PMC free article] [PubMed] [Google Scholar]
- 48.Wimmer N, et al. Lymphotoxin beta receptor activation on macrophages induces cross-tolerance to TLR4 and TLR9 ligands. J Immunol. 2012;188:3426–3433. doi: 10.4049/jimmunol.1103324. [DOI] [PubMed] [Google Scholar]
- 49.Rothe J, et al. Mice lacking the tumour necrosis factor receptor 1 are resistant to TNF-mediated toxicity but highly susceptible to infection by Listeria monocytogenes. Nature. 1993;364:798–802. doi: 10.1038/364798a0. [DOI] [PubMed] [Google Scholar]
- 50.Van Hauwermeiren F, et al. Safe TNF-based antitumor therapy following p55TNFR reduction in intestinal epithelium. J Clin Invest. 2013;123:2590–2603. doi: 10.1172/JCI65624. [DOI] [PMC free article] [PubMed] [Google Scholar]
- 51.Macosko EZ, et al. Highly Parallel Genome-wide Expression Profiling of Individual Cells Using Nanoliter Droplets. Cell. 2015;161:1202–1214. doi: 10.1016/j.cell.2015.05.002. [DOI] [PMC free article] [PubMed] [Google Scholar]
- 52.Zheng GX, et al. Massively parallel digital transcriptional profiling of single cells. Nat Commun. 2017;8 doi: 10.1038/ncomms14049. 14049. [DOI] [PMC free article] [PubMed] [Google Scholar]
- 53.McCarthy DJ, Campbell KR, Lun AT, Wills QF. Scater: pre-processing, quality control, normalization and visualization of singlecell RNA-seq data in R. Bioinformatics. 2017;33:1179–1186. doi: 10.1093/bioinformatics/btw777. [DOI] [PMC free article] [PubMed] [Google Scholar]
- 54.Stuart T, et al. Comprehensive Integration of Single-Cell Data. Cell. 2019;177:1888–1902. doi: 10.1016/j.cell.2019.05.031. e1821. [DOI] [PMC free article] [PubMed] [Google Scholar]
- 55.Fletcher AL, et al. Reproducible isolation of lymph node stromal cells reveals site-dependent differences in fibroblastic reticular cells. Front Immunol. 2011;2:35. doi: 10.3389/fimmu.2011.00035. [DOI] [PMC free article] [PubMed] [Google Scholar]
- 56.Gil-Cruz C, et al. Microbiota-derived peptide mimics drive lethal inflammatory cardiomyopathy. Science. 2019;366:881–886. doi: 10.1126/science.aav3487. [DOI] [PubMed] [Google Scholar]
- 57.Hama H, et al. Scale: a chemical approach for fluorescence imaging and reconstruction of transparent mouse brain. Nat Neurosci. 2011;14:1481–1488. doi: 10.1038/nn.2928. [DOI] [PubMed] [Google Scholar]
- 58.Gil-Cruz C, et al. T helper cell- and CD40-dependent germline IgM prevents chronic virus-induced demyelinating disease. Proc Natl Acad Sci U S A. 2012;109:1233–1238. doi: 10.1073/pnas.1115154109. [DOI] [PMC free article] [PubMed] [Google Scholar]
- 59.Bunker JJ, et al. Innate and Adaptive Humoral Responses Coat Distinct Commensal Bacteria with Immunoglobulin A. Immunity. 2015;43:541–553. doi: 10.1016/j.immuni.2015.08.007. [DOI] [PMC free article] [PubMed] [Google Scholar]
- 60.Palm NW, et al. Immunoglobulin A coating identifies colitogenic bacteria in inflammatory bowel disease. Cell. 2014;158:1000–1010. doi: 10.1016/j.cell.2014.08.006. [DOI] [PMC free article] [PubMed] [Google Scholar]
- 61.Zhang J, Kobert K, Flouri T, Stamatakis A. PEAR: a fast and accurate Illumina Paired-End reAd mergeR. Bioinformatics. 2014;30:614–620. doi: 10.1093/bioinformatics/btt593. [DOI] [PMC free article] [PubMed] [Google Scholar]
- 62.Bolyen E, et al. Nat Biotechnol. Vol. 37. United States: 2019. Reproducible, interactive, scalable and extensible microbiome data science using QIIME 2; pp. 852–857. [DOI] [PMC free article] [PubMed] [Google Scholar]
- 63.Quast C, et al. The SILVA ribosomal RNA gene database project: improved data processing and web-based tools. Nucleic Acids Res. 2013;41:D590–596. doi: 10.1093/nar/gks1219. [DOI] [PMC free article] [PubMed] [Google Scholar]
Associated Data
This section collects any data citations, data availability statements, or supplementary materials included in this article.
Supplementary Materials
Data Availability Statement
scRNA-seq datasets are available in ArrayExpress (accession number: E-MTAB-9162). The data that support the findings of this study are available from the corresponding authors.


