Abstract
Resource competition and metabolic cross-feeding are among the main drivers of microbial community assembly. Yet, the degree to which these two conflicting forces are reflected in the composition of natural communities has not been systematically investigated. Here we use genome-scale metabolic modeling to assess resource competition and metabolic cooperation potential in large co-occurring groups (up to 40 members) across thousands of habitats. Our analysis revealed two distinct community types, clustering at opposite ends in a trade-off between competition and cooperation. On one end, lie highly cooperative communities, characterized by smaller genomes and multiple auxotrophies. At the other end, lie highly competitive communities, featuring larger genomes, overlapping nutritional requirements, and harboring more genes related to antimicrobial activity. While the latter are mainly present in soils, the former are found both in free-living and host-associated habitats. Community-scale flux simulations showed that, while the competitive communities can better resist species invasion but not nutrient shift, the cooperative communities are susceptible to species invasion but resilient to nutrient change. In accord, we show, through analyzing an additional dataset, that colonization by probiotic species is positively associated with the presence of cooperative species in the recipient microbiome. Together, our analysis highlights the bifurcation between competitive and cooperative metabolism in the assembly of natural communities and its implications for community modulation.
Microbial communities are fundamental constituents of ecosystems across scales1–6. They play a crucial role in essential ecosystem functions like geochemical cycles7, and, as our microbial symbionts, contribute to our physiology and health8. The biological properties of microbial communities are determined by their compositional make-up, which, when perturbed, can also hamper their function. For example, multiple diseases have been linked to compositional changes in the gut microbiome5,8. Thus, an emerging challenge in these and other microbial ecosystems is modulation of communities towards repairing a perturbed state or achieving a new community-level function9. Yet, it remains difficult to predict which group of microbes would form a stable community or how a given community would respond to biotic and abiotic perturbations.
The nature of available nutrients is fundamental to the assembly of a community and the metabolic interactions therein10–12. Previous studies have assessed these using genome-scale metabolic models, which account for metabolic and biosynthetic capabilities of all community members13–15. While these studies attest to the potential of genome-scale modeling to gauge the degree of competition and cooperation in microbial communities, they remain limited in scope due to low numbers of species and habitats analyzed. Furthermore, most previous studies consider pair-wise co-occurrence as an indication of interaction. This limitation discounts the higher-order interactions, which signify the contingency of interactions between a set of species on other species in the community, and are known to play a role in ecosystem function 16–18. Thus, the assessment of the role of metabolic competition and cooperation in shaping community structure has hitherto been limited in scope.
Here, we investigated, through metabolic modelling and genomic analysis, resource competition and cross-feeding in thousands of communities co-occurring across diverse environments spanned by the Earth Microbiome Project (EMP)19. We particularly explored the hypothesis that metabolic competition and cooperation – which, from a biosynthetic perspective, are negatively correlated – will exhibit a trade-off in a habitat-dependent manner. The broad habitat coverage and consideration of large co-occurring groups allowed us to uncover the stark partitioning between competing and cooperating groups, and to suggest strategies to modulate these communities.
Results
Co-occurrence of multi-species groups is prevalent across microbial communities
We started by building metabolic models for individual species spanned by the EMP dataset. For this, we first mapped the 16S rRNA sequences to their closest reference genomes in the NCBI RefSeq database20 (97% sequence similarity cutoff; see Methods, Extended Data 1). We then used these genomes to build genome-scale metabolic models with CarveMe21. This resulted in a collection of unique models for 2986 species. Next, to uncover ecologically-relevant patterns of interactions among these species, we systematically searched for groups of significantly co-occurring species (i.e. groups of species that occur together across samples more often than expected by chance; see illustration in Figure 1a, and Methods for details). Although multiple methods have been proposed to compute co-occurring species in microbial samples, most are limited to species pairs14,22–24. On the other hand, experiments with synthetic communities have underlined the importance of higher-order interactions in community structure and dynamics. The emergent features of complex communities thereby cannot be inferred from pairwise interactions alone18. Supporting this, our previous work showed that the co-occurring communities could be distinguished from random species assemblies more clearly in three and four species groups15.
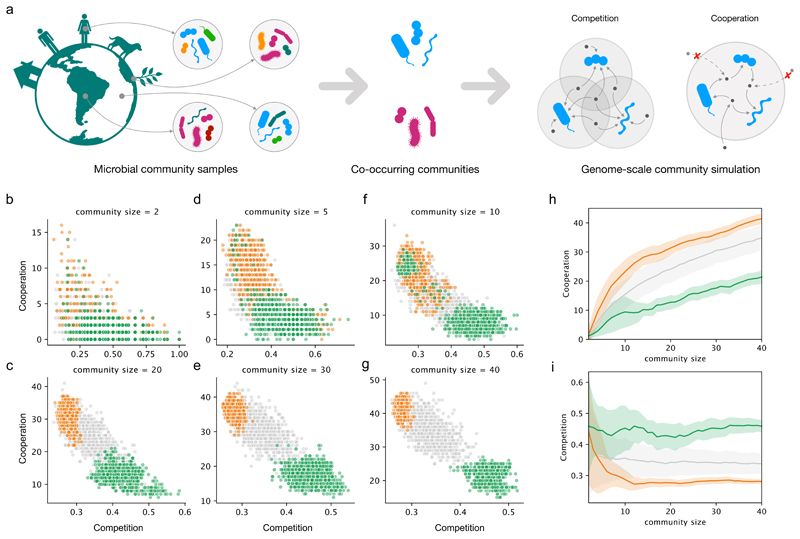
Figure 1. Co-occurring microbial communities are polarized in the competition-cooperation landscape.
a) Schematic of the two main steps in our analysis: identification of frequently co-occurring communities across the Earth Microbiome project samples, followed by the calculation of metabolic resource overlap (MRO) and metabolic interaction potential (MIP) scores. While MRO estimates the degree of competition in terms of overlap in the resource requirements of the community members, MIP assesses cooperation potential as the number of metabolites that the members can provide each other with. b-g) The trade-off between the Competition (MRO) and cooperation (MIP) scores for different community sizes. Green and orange dots mark competitive and cooperative co-occurring communities, respectively. The grey dots represent random assemblies. h) Cooperation potential increases with community size more rapidly for the cooperative groups (orange) than for the competitive (green) or random (grey) communities. i) Competition potential as a function of community size. In h) and i), thick lines and shaded regions show average values and standard deviation, respectively. In b-i, 1000 communities are included for each community size and type (random, competitive, and cooperative)
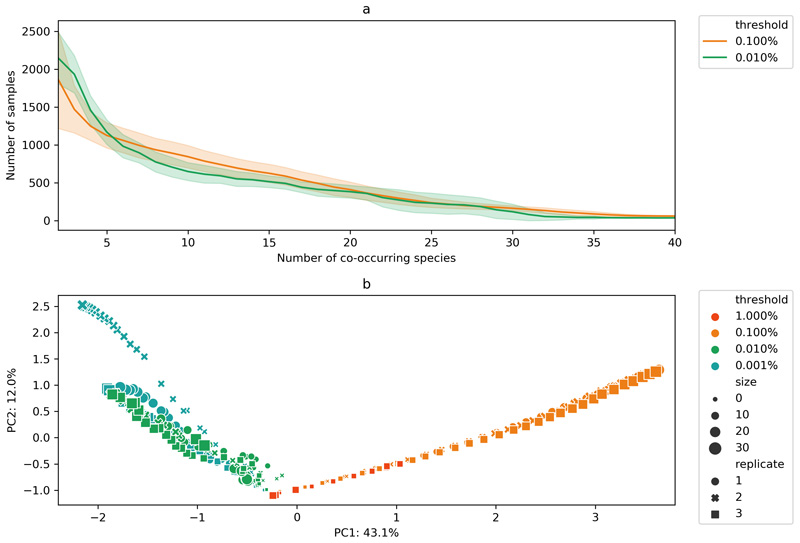
In this work, we tackled higher-order interactions at an unprecedented scale by introducing a new heuristic approach (Methods). In brief, the method begins by computing significantly co-occurring species pairs, and iteratively creates larger assemblies using a sampling approach based on roulette wheel selection. This heuristic approach allowed us to avoid combinatorial explosion and to uncover thousands of co-occurring communities with up to 40 members. The higher-order co-occurring groups are prevalent across samples (Extended Data 2a): a 10-species group co-occurs, on average, in circa 1000 samples, while a 40-species group co-occurs in circa 100 samples. Principal component analysis of the resulting co-occurrence structure in terms of species composition shows two main clusters of co-occurring communities (Extended Data 2b). These clusters are closer to each other for the 2-species groups (i.e. species pairs) but become increasingly distant for higher-order communities indicating a bipartite structure in community assembly.
Co-occurring communities are polarized in the competition-cooperation landscape
We next assessed the extent of resource competition and metabolic inter-dependencies in the identified co-occurring communities using SMETANA15, a constraint-based community modelling approach. Unlike other community simulation methods25–27, SMETANA does not assume any optimality at community or species level; the only assumption being that each species can survive using the available resources (abiotic or those shared by the fellow community members). Using SMETANA, we computed the metabolic resource overlap (MRO) and metabolic interaction potential (MIP) for all co-occurring communities (illustrated in Fig. 1a). As control groups to contrast against the co-occurring communities, random assemblies of the same size as the co-occurring communities were used (1000 communities for each community size). While the MRO quantifies the similarity of the nutritional requirements between all species in a community, reflecting the intra-community risk for resource competition, the MIP indicates the number of metabolites that can be exchanged among the community members to decrease their dependency on the abiotic environment. In this work, we use the MIP value as a proxy measure for cooperative metabolism. MRO and MIP estimate the respective interaction metrics at their theoretical limit and thus do not require the information regarding the resources actually available in the habitat. The operating degree of competition and cooperation in a given community will be thus habitat dependent. The context-independent nature of MRO and MIP makes these suitable for application to co-occurring communities spanning multiple and diverse habitats. Further, the presence of several co-occurring groups of species in diverse habitats suggests that these communities are to some extent independent of their abiotic environment. We also evaluated the ability of MIP to capture biologically meaningful interactions against the data from a systematic screen of pairwise co-cultures of E. coli mutants with engineered amino acid auxotrophies28. We observe that the MIP score is positively associated with higher co-culture growth yields (Supp. Fig. 1). This result, together with the previous comparisons with experimental data15,29, support the relevance of SMETANA simulations.
The SMETANA simulation results revealed a trade-off between competition and cooperation (Fig. 1b). Species within communities with higher cooperation potential thereby have less resource overlap and vice-versa. When compared with the random assemblies, the co-occurring communities not only showed a striking distinction in terms of both competition risk and cooperation potential but also a clear polarization at the opposite ends of the competition-cooperation trade-off spectrum (Fig. 1b). The distinction of the co-occurring groups is more prominent at large community sizes, attesting to the ecological role of higher-order interactions. The co-occurring communities thus segregate into highly competitive (green, Figure 1b–h) and highly cooperative (orange, Figure 1b–h) groups, which also coincide with the two main clusters observed based on species composition (Extended Data 2). This polarization between competitive and cooperative groups suggests adaptation of opposite metabolic strategies by the respective community members.
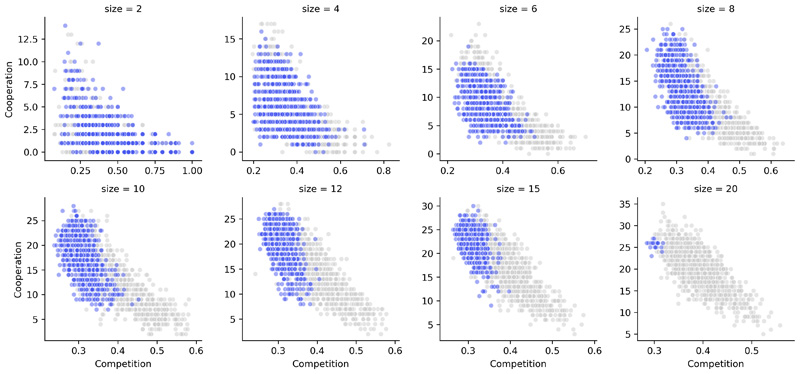
To check if the observed trade-off pattern results from any biases in the EMP data (such as the habitats covered, experimental protocols, or data processing pipelines), we computed co-occurring communities using an independent collection of 16S amplicon data compiled from multiple sources by Chaffron and co-workers30. This analysis also showed a clear trade-off between competition and cooperation with the randomly-assembled communities distributed along the spectrum (Extended Data 3). However, in this case, the co-occurring communities are all located in the cooperative pole. This can be explained by the higher abundance cutoff used in this dataset which – as we discuss in the next section – is one of the distinguishing features between the cooperative and competitive communities.
Members of competitive and cooperative groups have different metabolism and fitness
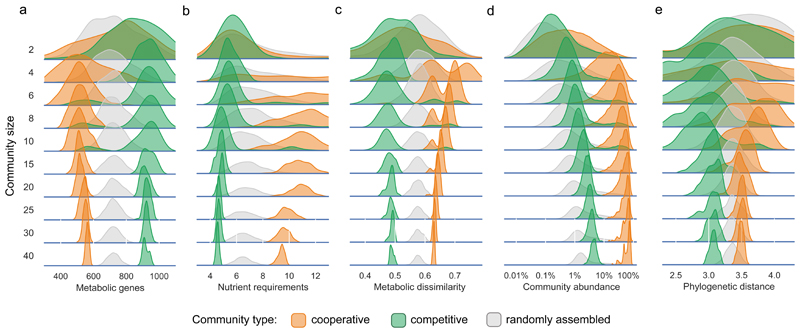
To gain insights into ecological mechanisms underlying the divide of co-occurring communities between competitive and cooperative types, we compared the metabolic features of the respective members. We observed that the species present in cooperative communities have fewer metabolic genes as compared to all species representing the EMP dataset (mean 543 vs 723, Mann-Whitney U = 5.8e7, z = -223.3, p < 0.001) (Fig. 2a). We next compared the estimates of the minimal nutritional requirements of the species comprising the different groups (inorganic compounds were discounted, see Methods). In line with their small metabolic networks, species in cooperative communities have higher nutrient requirements than average (9.9 vs 6.8, Mann-Whitney U = 1.4e8, z = -239.0, p < 0.001) (Fig. 2b). In contrast, species in the competitive communities have, on average, more metabolic genes (mean 919, Mann-Whitney U = 5.7e7, z = 223.6, p < 0.001) and fewer nutritional requirements (mean 5.0, Mann-Whitney U = 1.1e8, z = -225.8, p < 0.001).
Figure 2. Members of the cooperative and competitive communities show distinct genomic and phylogenetic characteristics, and have different abundance profiles.
Shown are the distributions of: a) the number of metabolic genes; b) the number of nutrients required (discounting non-organic compounds); c) the dissimilarity (Jaccard distance) between the metabolic networks of all species pairs; d) the abundance of community members across all the samples wherein the community occurs. The random assemblies in this case correspond to random subcommunities of equal size taken from the same samples; e) phylogenetic distance between all pairs of species within each community type. Each curve represents 1000 communities of a given size and community type.
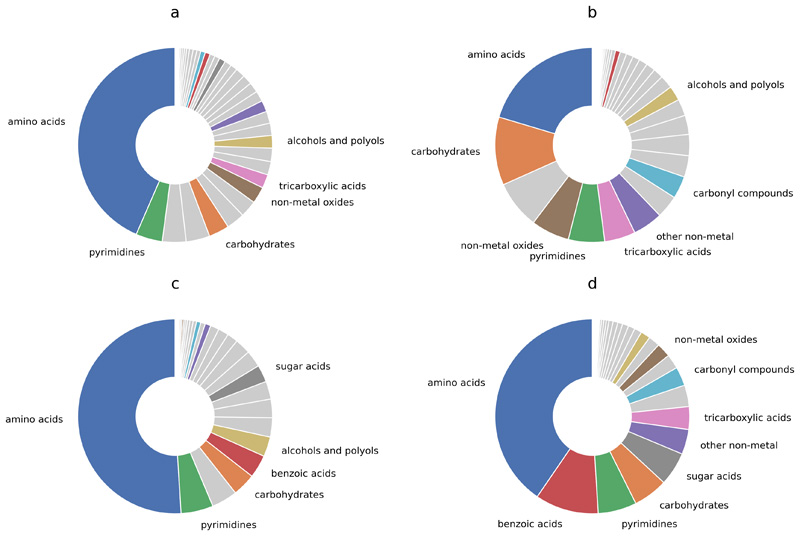
The smaller resource overlap amongst the members of the cooperative communities despite each requiring more nutrients suggests diversification of nutrient requirements within a community. To test this, we calculated the network dissimilarity within each community (defined as the average Jaccard distance between the metabolic networks of its member species). Indeed, the cooperative communities were found to be more dissimilar than expected by chance (10% more, Mann-Whitney U = 1.3e7, z = 91.2, p < 0.001) (Fig. 2c), explaining their lower resource overlap and higher cross-feeding potential. Conversely, the lower dissimilarity in competitive communities (20% lower, Mann-Whitney U = 6.9e6, z = -105.5, p < 0.001) is consistent with their high resource overlap. We also analyzed the nature of the compounds that different communities compete for or exchange within their member species (Extended Data 4). While the cooperative communities mainly require amino acids, the competitive communities showed a wider distribution of requirements, which include amino acids, carbohydrates, and pyrimidines. When comparing the two groups, cooperative communities showed a three-fold higher propensity for amino acid cross-feeding than the competitive communities (Mann-Whitney U = 1.1e8, z = 206.5, p < 0.001).
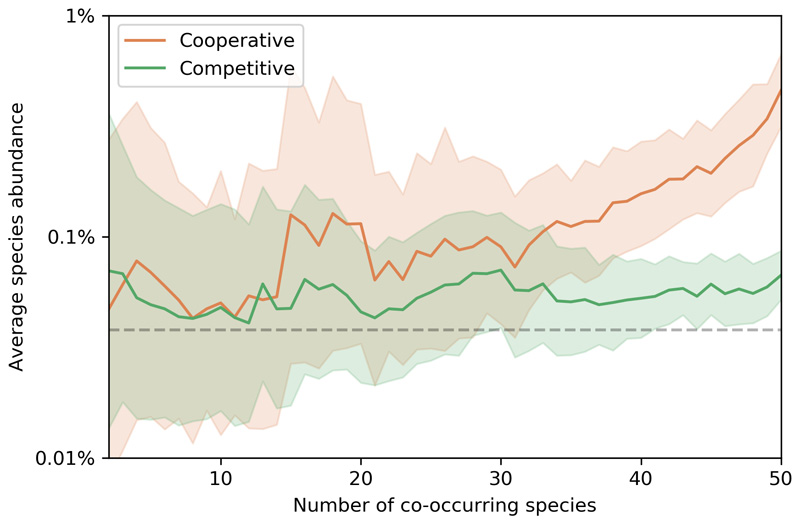
Stark differences in network size and nutrient requirements between the competitive and cooperative groups suggests differential metabolic costs for their member species. We therefore asked whether this difference is reflected in the fitness of the competitive or cooperative communities. To answer this, we calculated the total (relative) abundance of the species that participate in co-occurring communities and compared it with the abundance of random subsets with the same number of species (Fig. 2d). We find that the species forming cooperative communities are more abundant than expected by chance (median 21.6% vs 0.5%, Mann-Whitney U = 3.9e12, z = 1796.0, p < 0.001), representing a large fraction of the total biomass in each sample. In contrast, species participating in competitive communities are only slightly more abundant than that expected by chance (median 1.2% Mann-Whitney U = 1.2e13, z = 1020.0, p < 0.001). Since a given species can be part of multiple co-occurring communities, we analyzed how the fitness of an individual species (in terms of its relative abundance) is related to the total number of co-occurring partners present in each sample (Extended Data 5). While for the competitive species the number of co-occurring species present does not seem to influence their abundance (Spearman’s r = -0.02, p < 0.05), the species participating in cooperative communities have a higher abundance when more cooperative members are present in the same samples (Spearman’s r = 0.28, p < 0.001). Membership of a cross-feeding community thus seems to carry a substantial benefit in terms of increased fitness.
Members of competitive communities have larger potential for antimicrobial activity
Competition for nutrients would be expected to be linked with other, more direct, modes of competition such as production of antimicrobial compounds31. To test this, we annotated all species considered in this study with biosynthetic gene clusters from the antiSMASH database32. Supporting the hypothesis, a higher-than-expected number of genes were found to be associated with lanthipeptide production in species comprising competitive communities (odds ratio 1.7; p < 0.001, hypergeometric test and Benjamini–Hochberg correction for multiple testing). We also find that, across all species in the EMP dataset, the number of biosynthetic gene clusters encoded in the genome is correlated with the genome size (Spearman’s r = 0.67, p < 0.001) and with the number of metabolic genes (Spearman’s r = 0.57, p < 0.001). This supports the notion that the competition for resources and active antagonism are closely linked.
Cooperative communities occupy more diverse habitats and maintain stable abundance
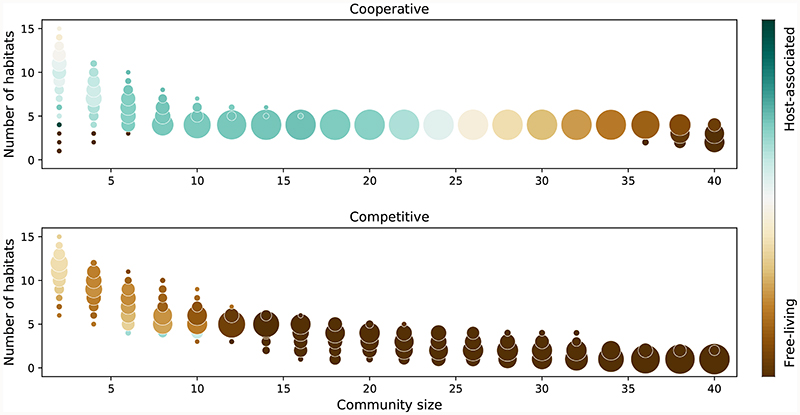
The evolution of metabolic competition and cooperation is expected to be driven by the degree of nutrient availability in the habitat. This in turn would lead to divergence in the habitats of the competitive and cooperative communities. We tested this by using the EMP ontology describing 17 types of habitats (9 free-living and 8 host-associated)19. When counting the number of distinct habitats in which all members of a given community co-occur, we observed a notable difference between competitive and cooperative communities (Fig. 3). The competitive communities are mostly present in free-living environments, with over two-thirds of the respective samples coming from soil33–35. On the other hand, the cooperative communities are present both in free-living and host-associated habitats, including the human body, indoor environments, and wastewater treatment36–39. Interestingly, we noted several indoor environment samples where competitive and cooperative communities co-exist. These samples come from the Home Microbiome Project, a study that tracked the microbiome of 18 individuals and 4 pets at multiple body sites, as well as multiple indoor surfaces during 6 weeks. These samples thus likely represent encounters of bacteria from soil, pets, and humans during daily-life activity.
Figure 3. Cooperative communities occupy more diverse habitats.
Circle position indicates the total number of habitats (according to EMPO level 3) for given community size, and the circle size indicates the fraction of communities that live in that number of habitats (out of 1000 computed communities per size). The circle color indicates the ratio between host-associated and free-living habitats
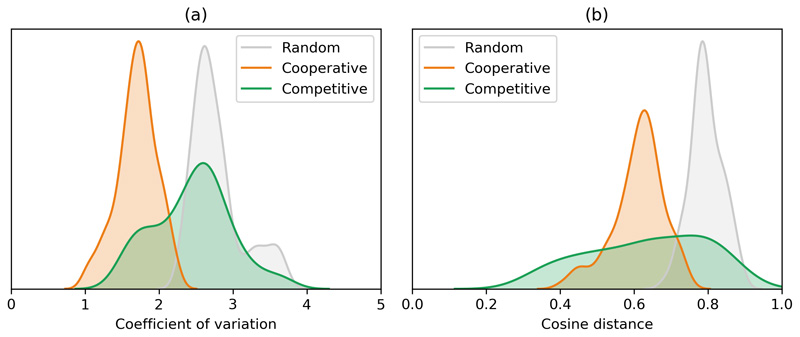
The high habitat diversity of the cooperative communities supports their advantage as a group, enabling movement between different environments as largely self-sufficient modules. However, to maintain their function, and exchange all required metabolic precursors in suitable amounts, these modules would need to maintain a stable composition in terms of the relative abundance of its members. To verify this, we queried the temporal stability of cooperative and competitive communities in the samples from the home microbiome project by using two different metrics: individual stability (i.e. how stable is the abundance of each species over time), and group stability (i.e. how stable is the relative abundance between community members over time) (Methods). The cooperative communities were found to be more stable than expected by chance (Extended Data 6), both in terms of individual stability (1.6-fold lower coefficient of variation in the abundance of each species, Mann-Whitney U = 0.0, z = -11.9, p < 0.001) and group stability (1.9-fold higher similarity of abundance profiles, Mann-Whitney U = 36, z = 11.8, p < 0.001). Competitive communities, on the other hand, showed no coherent trend. Previous theoretical work on community stability has shown that purely cooperative communities should be unstable and competitive interactions are required to re-establish stability40. Given that communities of co-occurring species exist as part of larger microbiomes, it is likely that competitive interactions with other species and/or resource limitations play a role in their stabilization. Together, the habitat preference analysis brings forward cooperative communities as functionally-coupled modules that can successfully migrate between different environments.
Evolution of division of labor in cooperative communities
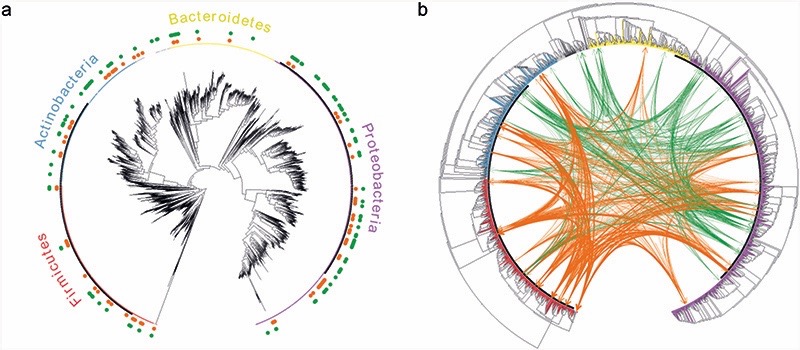
We next investigated the loss (or gain) of genes involved in metabolism by the members of the competitive and cooperative groups. To address this, we reconstructed a phylogenetic tree spanning all species in the EMP dataset using 40 universal marker genes (Methods) and calculated the distance within the members of cooperative and competitive communities. Members of both competitive and cooperative groups are observed across the four main phyla (Fig. 4a), indicating that polarization of metabolic strategies is a broadly distributed phenomenon. We also observe a broad distribution across multiple taxonomic levels (Supp. Fig. 2). Further, we observe that the species participating in cooperative communities are phylogenetically slightly more distant than expected by chance (1.04-fold, Mann-Whitney U = 3.1e7, z = 46.6, p < 0.001), whereas those in the competitive communities are closer (1.1-fold, Mann-Whitney U = 1.6e7, z = -82.1, p < 0.001) (Fig. 2e). This agrees with metabolic dissimilarity as one of the distinguishing features between cooperative and competitive communities (Fig. 2c).
Figure 4. Members of both competitive and cooperative communities are observed across the four main phyla.
Shown are the phylogenetic trees for all the species in the EMP dataset that could be mapped to reference genomes (2986 species in total). a) distribution of competitive (green) and cooperative (orange) species across the four main phyla; b) predicted cross-feeding interactions between the 50 most frequently occurring species in competitive (green) and cooperative (orange) communities. The edge width represents the SMETANA score for each interaction (indicating the frequency and total number of exchanged compounds).
To gain insights into the link between phylogenetic relatedness and metabolic dependencies, we calculated cross-feeding scores between the 50 most frequently co-occurring species within each community type (Methods). As expected, we observe stronger interactions between species in cooperative communities (Fig. 4b). Notably, inter-phylum interactions seem to be a rule rather than an exception (3 times more frequent than intra-phylum interactions, Mann-Whitney U = 257, z = 11.6, p < 0.001). Cross-feeding interactions are predominant in Firmicutes with both Actinobacteria and Proteobacteria. In agreement, interactions between these phyla have been experimentally observed41 and reported in systematic reviews of microbial interactions42,43.
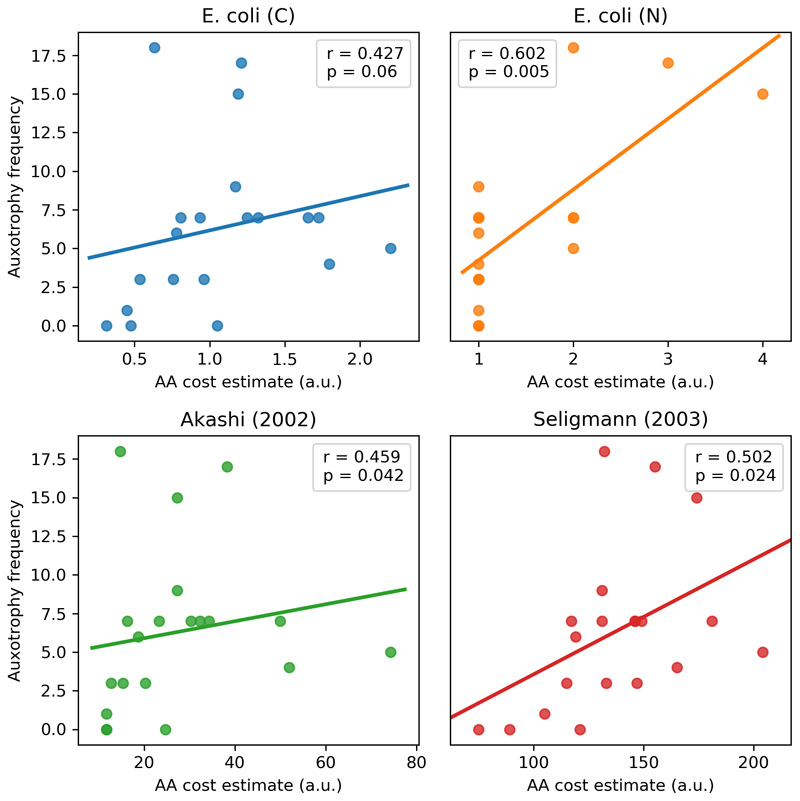
Our results identify amino acids as the most exchanged group of metabolites in cooperative communities (Extended Data 4). This agrees with previous experimental observations reporting amino acid exchange in various communities12,42,44. We also observe that the frequency of amino acid auxotrophies among members of cooperative communities is correlated with the respective amino acid production costs45 (Extended Data 7). This supports that our results are not biased due to differences in auxotrophy assessment across different species (in which case, there would be no link to the metabolic cost of amino acids). Moreover, engineered complementary amino acid auxotrophies have been shown to enable the stable assembly of synthetic microbial communities28,46. Spontaneous acquisition of amino acid auxotrophies and cross-feeding has also been observed during laboratory evolution of E. coli 47. However, there is still limited evidence for the co-evolution of amino acid exchanges within multi-species consortia in natura 48. Do complementary auxotrophies precede community assembly or are they a consequence of co-evolution?
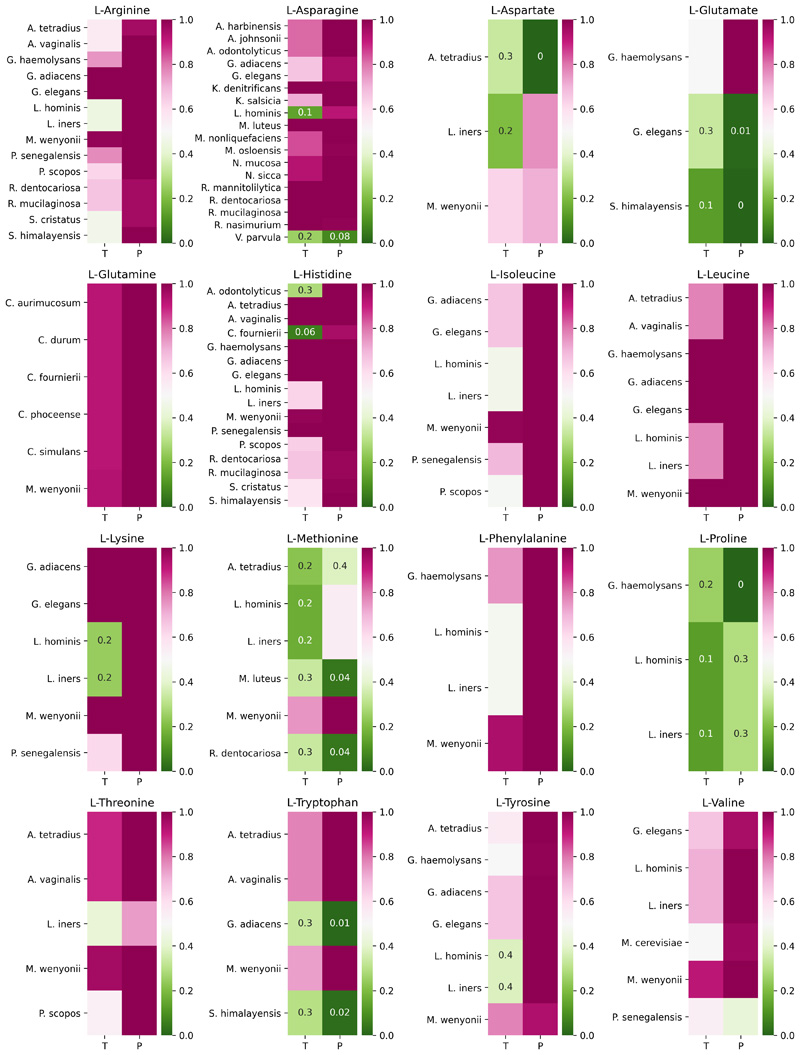
To address this question, we assessed whether the amino acid auxotrophies in the members of the cooperative communities have been acquired after speciation or inherited from an ancestral species. For a reliable assessment, we used two complementary approaches; one based on taxonomy (fraction of auxotrophic species within the same genus), and the other on phylogeny (ancestral state reconstruction along the phylogenetic tree). While a majority of amino acid auxotrophies (81 out of 117) seem to have been inherited (Extended Data 8), we also observe a few cases (12 in total) indicative of recent auxotrophy acquisition (the remaining 24 are not conclusive). The former implies pre-existing auxotrophies that were acquired (or retained) due to the availability of the corresponding nutrients from either abiotic or biotic environment. The latter, together with the higher abundance of cooperative species (Fig. 2d), suggests adaptive gene loss and were found to be most frequent for proline (G. haemolysans, L. hominis, L. inners) and methionine (A. tetradius, M. luteus, R. dentocariosa). Thus, both the assembly of species with pre-existing auxotrophies and subsequent gene loss appear to have contributed to the establishment of natural communities.
We further explored whether autroxophy retention or acquisition was mainly driven by environmental availability or the secretion from co-occurring species. We measured the fraction of amino acid auxotrophies within a community that can be compensated for through other community members (Supp. Fig. 3) and observed that this fraction follows a saturation curve as a function of community size (i.e. for a sufficiently large community size, eventually all auxotrophies can be compensated for by other members). Furthermore, we observe that this curve saturates earlier for cooperative communities compared to competitive and randomly-assembled communities. Therefore, the amino acid auxotrophies between species present in cooperative communities are more complementary than expected by chance (Wilcoxon one-sided signed-rank test W = 433.0, p < 0.001), likely suggesting division of labor.
Cooperative and competitive communities show contrasting sensitivity to perturbations
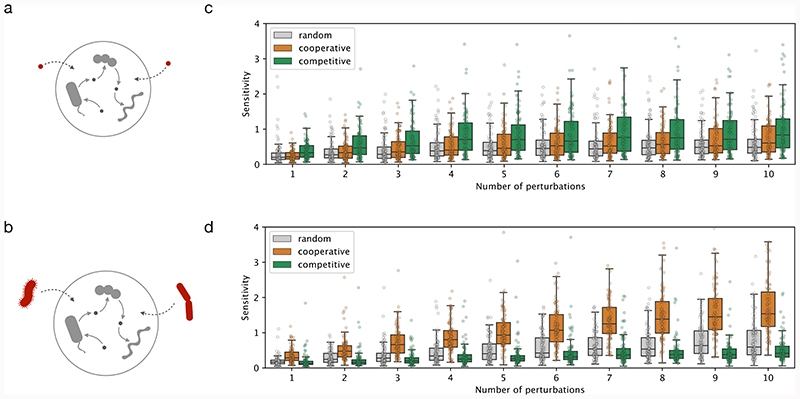
We next asked whether the distinct metabolic characteristics of cooperative and competitive communities result in differential response to abiotic and biotic perturbations. To answer this, we created 100 community models of each type (with 10 members per community, randomly sampled from the most frequently co-occurring species) and simulated their response to abiotic (changes in nutrient availability) and biotic perturbations (introduction of a foreign, i.e., non-member, species) (Fig. 5a–b). In particular, we analyzed how sensitive the network of cross-feeding interactions is to introduced perturbations (Methods), with lower sensitivity values being an indicator of community resilience.
Figure 5. Cooperative and competitive communities show contrasting sensitivity to perturbations.
a) schematic illustration of abiotic perturbations, changes in medium composition as simulated herein; b) schematic illustration of biotic perturbations, introduction of foreign species in the community as simulated herein; c-d) Simulation results, summarized as sensitivity of cooperative, competitive, and control (randomly-assembled) communities as a function of the number of abiotic (c) and biotic (d) perturbations. Each boxplot shows simulation results for 100 communities with 10 replicates per community. The box extends from the 1st to the 3rd quartile, with the line at the median, and the whiskers represent an interval of 1.5 * IQR (interquartile range).
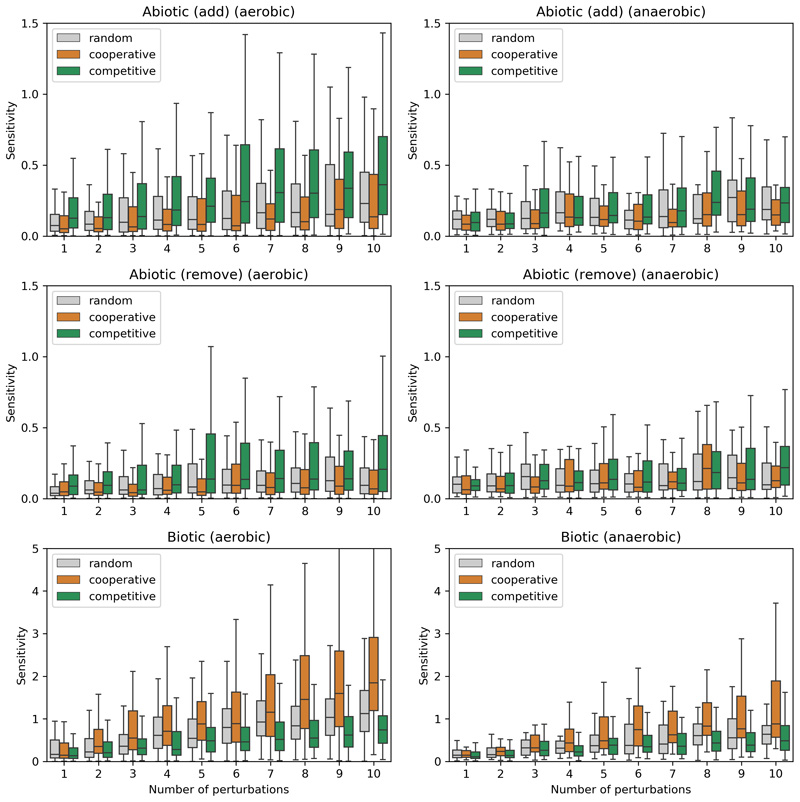
The competitive communities were found to be more sensitive to abiotic perturbations than either cooperative or randomly-assembled communities (1.5-fold more, Mann-Whitney U = 3.4e5, z = 12.3, p < 0.001) (Fig. 5c). This was indeed expected as the former are mostly driven by competition for shared resources, and the introduction of different nutrients can result in niche expansion. In accord, the difference is less striking when the perturbations are performed in anaerobic environments (Extended Data 9). On the other hand, competitive communities are less likely to be perturbed by foreign species (1.3-fold less, Mann-Whitney U = 3.8e5, z = -9.30, p < 0.001) (Fig. 5d). In agreement with these results, Goldford et al have recently shown that the assembly of plant and soil-derived communities (the kind of habitats where we find competitive communities to be prevalent) is primarily determined by the carbon source, and is much less influenced by the species diversity in the inoculum49.
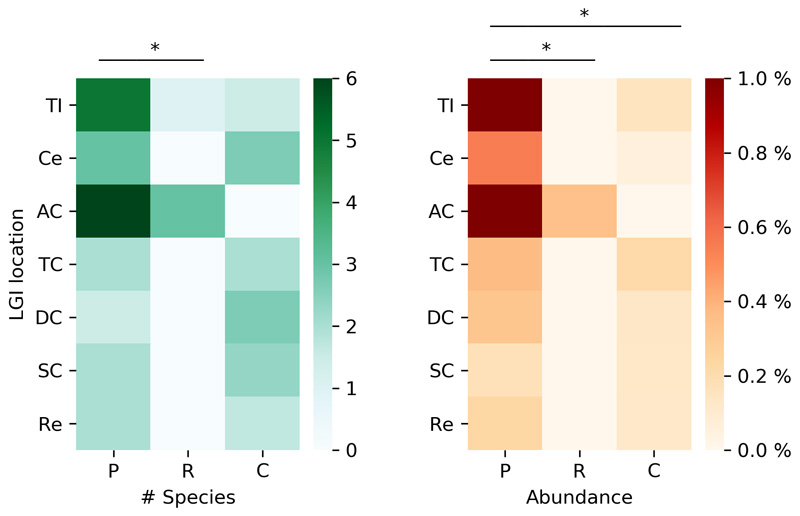
Cooperative communities, on the other hand, do not seem to be too sensitive to abiotic perturbations (only 1.04-fold higher than random controls, Mann-Whitney U = 4.6e5, z = 3.48, p < 0.001), but quite sensitive to the introduction of foreign species (2-fold more than random controls, Mann-Whitney U = 2.3e5, z = 20.6, p < 0.001) (Fig. 5d). The median sensitivity of the response appears to linearly increase with the number of species introduced (R2 = 0.988, p < 0.001). This is consistent with these communities having multiple cross-feeding interactions, which can be "intercepted" by the invading species. To test this, we analyzed the species invasion pattern in a recent study in which a host-specific response to colonization by probiotics was observed, with the identification of individuals as either permissive or resistant to colonization50. In light of our results, we hypothesized that the microbiomes of the permissive and the resistant individuals will be characterized by the presence of cooperative and competitive species, respectively. Confirming this, the individuals permissive to colonization have an increased presence of cooperative species along the lower gastrointestinal (LGI) tract, both in terms of total number of species per location (Wilcoxon one-sided signed-rank test, W = 28.0, p < 0.01) and their relative abundance (Wilcoxon one-sided signed-rank test, W = 28.0, p < 0.01) (Extended Data 10). Notably, this difference is more striking in the early LGI tract (terminal ileum, cecum, ascending colon). Thus, supporting our hypothesis, the presence of cooperative species is linked with the colonization by probiotic species.
Discussion
In this work, we observe a competition-cooperation trade-off among microbial communities that, although intuitive, had not been reported before. This is most likely due to the limited scale of the previous studies in terms of the number of species, number of environments, and the degree of co-occurrence. For example, two early studies13,14 considered circa 150 species. The latter study observed a positive correlation between co-occurrence and competition but not with cooperation, suggesting niche filtering as the main driver of species assembly. Further, as the polarization becomes more striking at higher-order co-occurrence (Figure 1b), it is not surprising that this pattern was not previously reported.
The polarization of co-occurring microbial communities into competitive and cooperative groups and its spread across the phylogenetic tree indicates two different, habitat-driven, evolutionary paths in community assembly. Competitive communities retain diverse metabolic capabilities to exploit the available nutrients, which indirectly antagonizes competitors, and to reduce dependencies on other species. The members of these communities also harbor more potential for antimicrobial compound production. Cooperative communities, on the other hand, harbor complementary auxotrophies and exhibit stable proportions across habitats, in line with inter-species dependencies. The advantage of the interdependencies in this group is reflected in their high relative abundance (Figure 2d). Our phylogenetic analysis indicates adaptive gene loss in metabolic networks. Consistent with an adaptive process, auxotrophies for amino acids with high biosynthetic costs are more common (Extended Data 7). Collectively, metabolic capabilities, antimicrobial production potential, phylogenetic analysis, and differences in habitat preference and relative abundances, highlight the evolutionary conflict and cooperation in the two co-occurring groups identified in our study.
Our analysis suggests joint role of abiotic habitat and evolutionary gene loss in determining whether a competitive or cooperative community will be established. The competitive species are generally restricted to free-living habitats wherein the resources are likely to be more scarce making competition more prevalent. In contrast, the nutritional richness of the host-associated habitats seems to support the cooperative species, which exhibit complementary auxotrophies, in part resulting from gene loss. This adaptation not only confers a fitness advantage but is also likely to facilitate the survival of these species during migration between the hosts and the external environment as a highly self-sufficient group. The generally higher abundance and diverse habitat occupation of the cooperative highlight the advantages offered by the division of metabolic labor.. This dichotomy between competition and cooperation is in certain ways analogous to that between the red queen and the black queen hypotheses51,52. The former is reflected in competitive species as they tend to retain most biosynthetic capabilities and harbor genes useful for active antagonism; the latter is reflected in gene loss in cooperative species leading to dependencies on fellow community members. Our results provide evidence that both theories are operating in natura as two extremes in a metabolic trade-off between competition and cooperation.
The existence of the two community types with contrasting metabolic make-up and habitat preference means that the strategies to modulate or re-engineer these communities also need to be separately tailored. Our in silico results, with support from previously published experimental data49,50, show that the competitive and cooperative communities are more malleable through, respectively, abiotic and biotic perturbations. However, our results are still limited and subject to biases due to the exclusion of species without a reference genome assembly, and due to variable quality of gene annotations – on which the models are based – across different species. These findings could, in future, be further refined to consider metagenome-assembled genomes53, improving coverage at species and strain levels, and by accounting for viral54 and fungal55 interactions. Altogether, we conclude that devising intervention strategies tailored to communities according to their position in the competition-cooperation landscape would be key to the modulation of complex microbial ecosystems.
Methods
Mapping OTUs to reference genomes
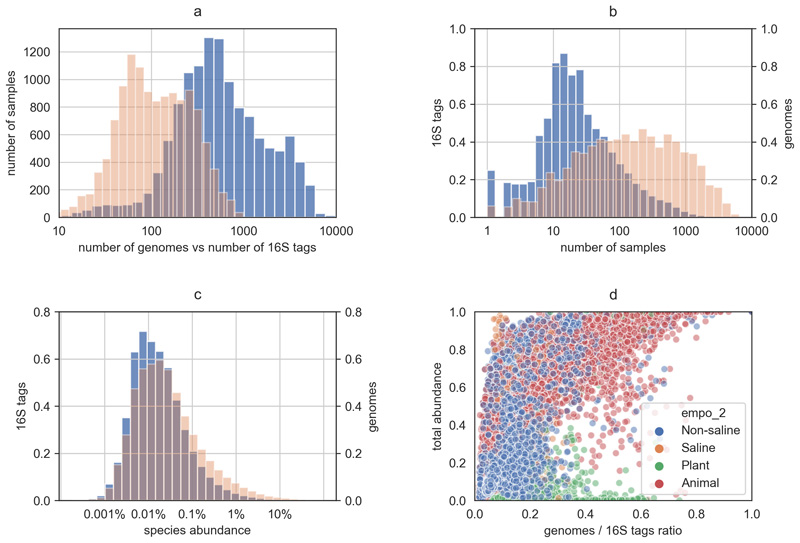
The EMP dataset provides 16S tags with multiple lengths. The abundance table with the longest reads (150 bp) was downloaded from the EMP portal (http://www.earthmicrobiome.org). All reference/representative bacterial genomes were downloaded from NCBI RefSeq (release 84). The 16S tags from the EMP data were mapped to those extracted from the reference genomes using diamond with a 97% identity threshold and a 95% alignment coverage. If multiple genomes were found, the ones with the highest alignment identity and length were selected. As expected, a large fraction of OTUs did not have a matching assembled genome (and some OTUs matched the same genomes). Overall, the diversity in each sample is reduced by almost an order of magnitude (from an average of 990 OTUs per sample to an average of 159 genomes) (Extended Data 1a). Nevertheless, we observe an enrichment regarding species prevalence (7.4-fold increase, Mann-Whitney U-test: p < 0.001) and abundance (2.5-fold increase, Mann-Whitney U-test: p < 0.001) (Extended Data 1b,c), indicating that the unmapped OTUs are associated with less prevalent and less abundant species. This was also reflected when we compared the fraction of OTUs covered per sample (mean 20.8%) to their respective abundance (mean 40.6%) (Extended Data 1d).
Computing co-occurrence
We computed higher-order co-occurrence using an iterative algorithm that begins with small sizes (N=2) and gradually computes groups of larger sizes. At the beginning of each iteration, all combinations of species are evaluated for co-occurrence by counting the total number of samples in which they co-occur. We calculate the number of co-occurring observations expected by chance using a binomial distribution and the probability of observing each species individually. We also calculate FDR-corrected p-values (q = 0.05), and select all species combinations that: 1) co-occur in at least 10 samples; 2) co-occur at least twice more than expected by chance; 3) pass the FDR-correction test. The 1000 most frequently co-occurring sets of species are selected as the best solutions for this iteration. In the next iteration, larger sets are created by extending all sets with a new element from the complete list of species in a combinatorial manner. To cope with the combinatorial explosion, at each iteration we only propagate a population of 10,000 solutions to the next iteration. This population is selected using roulette wheel selection with a probability proportional to the co-occurrence frequency. The presence/absence of a species in any sample is evaluated with a relative abundance cutoff. In particular, using cutoff values of 0.1% and 0.01% originated the two different community types analyzed in this study. We tried higher and lower cutoff values, without any observable differences in the results (Extended Data 2).
This method is implemented as a standalone python package, HiOrCo, openly available at https://github.com/cdanielmachado/hiorco.
Community simulation and media calculation
All community simulations and calculations of minimal media composition were performed using SMETANA v1.0. The mathematical formulation, as well as the description of the different scores, such as MIP and MRO, are described in the original publication15. The tool is implemented as a standalone python package, openly available at https://github.com/cdanielmachado/smetana.
Phylogenetic analysis
A maximum likelihood-approximate phylogenetic tree of 2992 species of Prokaryotes was built using ETE3 toolkit56 with JTT model57 by aligning protein sequences of the 40 conserved universal marker genes58,59 with default parameters in ClustalOmega aligner60 and FastTree2 tree-builder61. A cophenetic distance matrix was constructed from the tree using the ape package62 in R (v3.4.4). Phylogenetic trees were visualized and exported with iTOL63.
To estimate the ancestral state of amino acid auxotrophies, we first calculated auxotrophies for all reference species using genome-scale metabolic models. We then used the make.simmap function from the phytools64 library in R (v.3.4.4) with 100 stochastic character mappings followed by the describe.simmap function to obtain posterior probabilities of auxotrophic ancestral state (considered as a discrete trait). This method relies on stochastic character mapping that is sampled from a Markov chain Monte Carlo Bayesian posterior probabilities distribution65.
Simulating community response to perturbations
For each of the two types of communities (competitive and cooperative), we selected the 50 most representative species (i.e., those that are most frequently present in all co-occurring communities), and used them to randomly generate 100 communities of 10 species each. Each community was subject to multiple random perturbations with N perturbation elements (up to 10). In the abiotic case, the perturbations consisted of 100 random perturbations per community adding N additional nutrients to the growth medium. The biotic case consisted of 10 random perturbations per community, introducing N foreign species. The sensitivity to perturbations is calculated as follows:
where N is the number of perturbations, (x,y) is a pair of species in community C, and Sx,y is the SMETANA score for cross-feeding interactions between x and y, defined as:
where SCS (species coupling score), MPS (metabolite production score) and MUS (metabolite uptake score) are calculated as defined in Zelezniak et al.15, and M is the complete set of metabolites that can be produced and consumed.
Community stability analysis
Individual species stability was calculated as the coefficient of variation of the relative species abundance across all time points in a given sample:
where xi,t is the relative abundance of species i at time point t and N is the number of time points.
Group stability was calculated as the average cosine distance Di,j between the time-course profiles of every pair of species in a group and is defined as:
where K is the number of species in the group. For each sample, we computed the stability of the competitive and cooperative subcommunities present in those samples as well as the stability of 100 randomly-assembled subcommunities.
Statistical analysis
All statistical tests used in this manuscript were performed with SciPy version 1.2.1.
Extended Data
Extended Data Fig. 1. Mapping of OTUs to reference genomes.
a) comparison of sample diversity in terms of OTUs (blue) and genomes (orange); b) comparison of species prevalence in terms of OTUs and genomes across samples; c) species abundance distribution; d) total abundance of each sample that is captured by the mapped genomes in comparison to the ratio of genomes to OTUs.
Extended Data Fig. 2. Summary of higher-order co-occurrence analysis.
a) Average number of samples where all species in a co-occurring community can be found together as a function of community size (computed for the threshold values used in this work); b) Principal component analysis of co-occurring communities computed using different abundance thresholds. Marker size indicates co-occurring community size (up to 30 species) and marker shapes indicates independent runs of the algorithm (3 runs for each threshold). Numbers on x and y axis indicate percentage of explained variance for the respective principle component.
Extended Data Fig. 3. Simulation results using an independent dataset.
Simulation results for competition (MRO score) and cooperation potential (MIP score) for microbial communities obtained from Chaffron et al.1. Blue dots represent co-occurring communities of different sizes (up to 1000 per size) and grey dots represent randomly-assembled communities of similar size (1000 communities per size).
Extended Data Fig. 4. Summary of metabolite requirements for growth and cross-fed metabolites.
a) compounds competed for in cooperative communities; b) compounds competed for in competitive communities; c) cross-fed compounds in cooperative communities; d) cross-fed compounds in competitive communities. Compound classification according to the Human Metabolome Database (HMDB). Only the ten most frequent compound classes are colored and labeled.
Extended Data Fig. 5. Abundance of co-occurring species as a function of the total number of co-occurring partners present in a sample.
The colored line denotes the average abundance for each type of community, the shadowed area indicates standard deviation, and the dashed grey line indicates the average species abundance across all species and samples (in all cases the average is calculated as the mean value in log-space, i.e. representing the geometric mean of the relative abundance values).
Extended Data Fig. 6. Abundance stability in co-occurring communities.
Community stability measured in terms of: a) individual stability (lower coefficient of variation per species indicates higher stability); b) group stability (lower cosine distance indicates higher covariation of species abundance within each community).
Extended Data Fig. 7. Auxotrophy frequency is associated with amino acid production cost.
Spearman correlation between amino acid production costs and their auxotrophy frequency across species participating in cooperative communities. The data on amino acid production costs was obtained from Barton et al (ref 45).
Extended Data Fig. 8. Acquisition of amino acid auxotrophies.
Analysis of evidence for recent acquisition of amino acid auxotrophies using two complementary approaches: taxonomy based (T), measuring the fraction of auxotrophic species at genus level; phylogeny based (P), estimating the probability of the auxotrophy existing in the most recent ancestor of the species. Green color in both columns is indicative of a consensus.
Extended Data Fig. 9. Sensitivity of co-occurring communities to different types of perturbations.
This is an extended version of Figure 5 where the simulations are performed in aerobic and anaerobic environments separately. For abiotic perturbations we further test the effect of removal of compounds from the growth medium.
Extended Data Fig. 10. Association between the presence cooperative species and colonization of the human gut microbiome.
Presence of cooperative species in the lower gastrointestinal (LGI) tract of patients permissive to probiotic colonization (P), patients resistant to colonization (R) and control patients (C). Asterisks indicate significance of Wilcoxon signed-rank test (p < 0.05).
Supplementary Material
Acknowledgments
The authors would like to acknowledge Niv Zmora and Eran Elinav for providing data and feedback on the probiotics study, Kai Blin for assistance with the antiSMASH database, and Sebastian Schmidt for fruitful discussions. This project has received funding from the European Union’s Horizon 2020 research and innovation programme under grant agreement No 686070.
Footnotes
Author Contributions
D.M. developed the co-occurrence computation method and performed the simulations and data analysis. D.M. and S.A implemented the software for metabolic modelling. O.M.M. performed the phylogenetic analysis. Y.K. mapped the OTUs to reference genomes. P.B. supervised the phylogenetic analysis. Kaustubh R.P. and Kiran R.P. conceived the study. D.M. and Kiran R.P. wrote the manuscript. All authors read and revised the final manuscript.
Competing Interests
The authors declare no competing interests for this study.
Data and code availability
All the data and code required to generate the results and figures presented in this article are publicly available in the following repository: https://github.com/cdanielmachado/cooccurrence.
References
- 1.Fierer N. Embracing the unknown: disentangling the complexities of the soil microbiome. Nat Rev Microbiol. 2017;15:579–590. doi: 10.1038/nrmicro.2017.87. [DOI] [PubMed] [Google Scholar]
- 2.Raaijmakers JM, Mazzola M. Soil immune responses. Science. 2016;352:1392–1393. doi: 10.1126/science.aaf3252. [DOI] [PubMed] [Google Scholar]
- 3.Sunagawa S, Coelho LP, Chaffron S, al e. Structure and function of the global ocean microbiome. Science. 2015;348:1261359–1261359. doi: 10.1126/science.1261359. [DOI] [PubMed] [Google Scholar]
- 4.Louca S, Parfrey LW, Doebeli M. Decoupling function and taxonomy in the global ocean microbiome. Science. 2016;353:1272–1277. doi: 10.1126/science.aaf4507. [DOI] [PubMed] [Google Scholar]
- 5.Gilbert JA, et al. Current understanding of the human microbiome. Nature Medicine. 2018;24:392–400. doi: 10.1038/nm.451!. [DOI] [PMC free article] [PubMed] [Google Scholar]
- 6.Arumugam M, et al. Enterotypes of the human gut microbiome. Nature. 2011;473:174–180. doi: 10.1038/nature09944. [DOI] [PMC free article] [PubMed] [Google Scholar]
- 7.Cavicchioli R, et al. Scientists’ warning to humanity: microorganisms and climate change. Nature Reviews Microbiology. 2019;17:569–586. doi: 10.1038/s41579-019-0222-5. [DOI] [PMC free article] [PubMed] [Google Scholar]
- 8.Cho I, Blaser MJ. The human microbiome: at the interface of health and disease. Nature Reviews Genetics. 2012;13:260–270. doi: 10.1038/nrg3182. [DOI] [PMC free article] [PubMed] [Google Scholar]
- 9.Lawson CE, et al. Common principles and best practices for engineering microbiomes. Nature Reviews Microbiology. 2019:1–17. doi: 10.1038/s41579-019-0255-9. [DOI] [PMC free article] [PubMed] [Google Scholar]
- 10.Armstrong RA, McGehee R. Competitive Exclusion. The American Naturalist. 1980;115:151–170. doi: 10.1086/283553. [DOI] [Google Scholar]
- 11.Tan J, Zuniga C, Zengler K. Unraveling interactions in microbial communities - from co-cultures to microbiomes. Journal of Microbiology. 2015;53:295–305. doi: 10.1007/s12275-015-5060-1. [DOI] [PubMed] [Google Scholar]
- 12.Zengler K, Zaramela LS. The social network of microorganisms — how auxotrophies shape complex communities. Nature Reviews Microbiology. 2018;16:383. doi: 10.1038/s41579-018-0004-5. [DOI] [PMC free article] [PubMed] [Google Scholar]
- 13.Freilich S, et al. Competitive and cooperative metabolic interactions in bacterial communities. Nature Communications. 2011;2:589. doi: 10.1038/ncomms1597. [DOI] [PubMed] [Google Scholar]
- 14.Levy R, Borenstein E. Metabolic modeling of species interaction in the human microbiome elucidates community-level assembly rules. Proceedings of the National Academy of Sciences. 2013;110:12804–12809. doi: 10.1073/pnas.1300926110. [DOI] [PMC free article] [PubMed] [Google Scholar]
- 15.Zelezniak A, et al. Metabolic dependencies drive species co-occurrence in diverse microbial communities. Proceedings of the National Academy of Sciences. 2015;112:6449–6454. doi: 10.1073/pnas.1421834112. [DOI] [PMC free article] [PubMed] [Google Scholar]
- 16.Billick I, Case TJ. Higher Order Interactions in Ecological Communities: What Are They and How Can They be Detected? Ecology. 1994;75:1529–1543. doi: 10.2307/1939614. [DOI] [Google Scholar]
- 17.Friedman J, Higgins LM, Gore J. Community structure follows simple assembly rules in microbial microcosms. Nature Ecology & Evolution. 2017;1:1–7. doi: 10.1038/s41559-017-0109. [DOI] [PubMed] [Google Scholar]
- 18.Morin M, Pierce EC, Dutton RJ. Changes in the genetic requirements for microbial interactions with increasing community complexity. eLife. 2018;7 doi: 10.7554/elife.37072. [DOI] [PMC free article] [PubMed] [Google Scholar]
- 19.Thompson LR, al e. A communal catalogue reveals Earth's multiscale microbial diversity. Nature. 2017 doi: 10.1038/nature24621. [DOI] [PMC free article] [PubMed] [Google Scholar]
- 20.O’Leary NA, al e. Reference sequence (RefSeq) database at NCBI: current status taxonomic expansion, and functional annotation. Nucleic Acids Research. 2015;44:D733–D745. doi: 10.1093/nar/gkv1189. [DOI] [PMC free article] [PubMed] [Google Scholar]
- 21.Machado D, Andrejev S, Tramontano M, Patil KR. Fast automated reconstruction of genome-scale metabolic models for microbial species and communities. Nucleic Acids Research. 2018;46:7542–7553. doi: 10.1093/nar/gky537. [DOI] [PMC free article] [PubMed] [Google Scholar]
- 22.Freilich S, et al. The large-scale organization of the bacterial network of ecological co-occurrence interactions. Nucleic Acids Research. 2010;38:3857–3868. doi: 10.1093/nar/gkq118. [DOI] [PMC free article] [PubMed] [Google Scholar]
- 23.Barberán A, Bates ST, Casamayor EO, Fierer N. Using network analysis to explore cooccurrence patterns in soil microbial communities. The ISME Journal. 2011;6:343–351. doi: 10.1038/ismej.2011.119. [DOI] [PMC free article] [PubMed] [Google Scholar]
- 24.Faust K, et al. Microbial Co-occurrence Relationships in the Human Microbiome. PLoS Computational Biology. 2012;8:e1002606. doi: 10.1371/journal.pcbi.1002606. [DOI] [PMC free article] [PubMed] [Google Scholar]
- 25.Zomorrodi AR, Maranas CD. OptCom: A Multi-Level Optimization Framework for the Metabolic Modeling and Analysis of Microbial Communities. PLOS Computational Biology. 2012;8:e1002363. doi: 10.1371/journal.pcbi.1002363. [DOI] [PMC free article] [PubMed] [Google Scholar]
- 26.Khandelwal RA, Olivier BG, Röling WFM, Teusink B, Bruggeman FJ. Community Flux Balance Analysis for Microbial Consortia at Balanced Growth. PLOS ONE. 2013;8:e64567. doi: 10.1371/journal.pone.0064567. [DOI] [PMC free article] [PubMed] [Google Scholar]
- 27.Chan SHJ, Simons MN, Maranas CD. SteadyCom: Predicting microbial abundances while ensuring community stability. PLOS Computational Biology. 2017;13:e1005539. doi: 10.1371/journal.pcbi.1005539. [DOI] [PMC free article] [PubMed] [Google Scholar]
- 28.Mee MT, Collins JJ, Church GM, Wang HH. Syntrophic exchange in synthetic microbial communities. Proceedings of the National Academy of Sciences. 2014;111:E2149–E2156. doi: 10.1073/pnas.1405641111. [DOI] [PMC free article] [PubMed] [Google Scholar]
- 29.Ponomarova O, et al. Yeast Creates a Niche for Symbiotic Lactic Acid Bacteria through Nitrogen Overflow. Cell Syst. 2017;5:345–357.:e346. doi: 10.1016/j.cels.2017.09.002. [DOI] [PMC free article] [PubMed] [Google Scholar]
- 30.Chaffron S, Rehrauer H, Pernthaler J, Mering Cv. A global network of coexisting microbes from environmental and whole-genome sequence data. Genome Research. 2010;20:947–959. doi: 10.1101/gr.104521.109. [DOI] [PMC free article] [PubMed] [Google Scholar]
- 31.Amarasekare P. Interference competition and species coexistence. Proceedings of the Royal Society of London. Series B: Biological Sciences. 2002;269:2541–2550. doi: 10.1098/rspb.2002.2181. [DOI] [PMC free article] [PubMed] [Google Scholar]
- 32.Blin K, et al. antiSMASH 5.0: updates to the secondary metabolite genome mining pipeline. Nucleic Acids Research. 2019;47:W81–W87. doi: 10.1093/nar/gkz310. [DOI] [PMC free article] [PubMed] [Google Scholar]
- 33.Crump BC, Amaral-Zettler LA, Kling GW. Microbial diversity in arctic freshwaters is structured by inoculation of microbes from soils. The ISME Journal. 2012;6:1629–1639. doi: 10.1038/ismej.2012.9. [DOI] [PMC free article] [PubMed] [Google Scholar]
- 34.O’Brien SL, et al. Spatial scale drives patterns in soil bacterial diversity. Environmental Microbiology. 2016;18:2039–2051. doi: 10.1111/1462-2920.13231. [DOI] [PMC free article] [PubMed] [Google Scholar]
- 35.Zarraonaindia I, Owens SM, Weisenhorn P, al e. The Soil Microbiome Influences Grapevine-Associated Microbiota. mBio. 2015;6 doi: 10.1128/mbio.02527-14. [DOI] [PMC free article] [PubMed] [Google Scholar]
- 36.Lax S, Smith DP, Hampton-Marcell J, al e. Longitudinal analysis of microbial interaction between humans and the indoor environment. Science. 2014;345:1048–1052. doi: 10.1126/science.1254529. [DOI] [PMC free article] [PubMed] [Google Scholar]
- 37.Nolan MJ, et al. Molecular-based investigation of Cryptosporidium and Giardia from animals in water catchments in southeastern Australia. Water Research. 2013;47:1726–1740. doi: 10.1016/j.watres.2012.12.027. [DOI] [PubMed] [Google Scholar]
- 38.Haig SJ, Quince C, Davies RL, Dorea CC, Collins G. Replicating the microbial community and water quality performance of full-scale slow sand filters in laboratory-scale filters. Water Research. 2014;61:141–151. doi: 10.1016/j.watres.2014.05.008. [DOI] [PubMed] [Google Scholar]
- 39.Koehler AV, Haydon SR, Jex AR, Gasser RB. Cryptosporidium and Giardia taxa in faecal samples from animals in catchments supplying the city of Melbourne with drinking water (2011 to 2015) Parasites & Vectors. 2016;9 doi: 10.1186/s13071-016-1607-1. [DOI] [PMC free article] [PubMed] [Google Scholar]
- 40.Coyte KZ, Schluter J, Foster KR. The ecology of the microbiome: Networks, competition, and stability. Science. 2015;350:663–666. doi: 10.1126/science.aad2602. [DOI] [PubMed] [Google Scholar]
- 41.Rivière A, Gagnon M, Weckx S, Roy D, Vuyst LD. Mutual Cross-Feeding Interactions between Bifidobacterium longum subsp. longum NCC2705 and Eubacterium rectale ATCC 33656 Explain the Bifidogenic and Butyrogenic Effects of Arabinoxylan Oligosaccharides. Applied and Environmental Microbiology. 2015;81:7767–7781. doi: 10.1128/AEM.02089-15. [DOI] [PMC free article] [PubMed] [Google Scholar]
- 42.D’Souza G, et al. Ecology and evolution of metabolic cross-feeding interactions in bacteria. Natural Product Reports. 2018;35:455–488. doi: 10.1039/C8NP00009C. [DOI] [PubMed] [Google Scholar]
- 43.Pacheco AR, Segrè D. A multidimensional perspective on microbial interactions. FEMS Microbiology Letters. 2019;366 doi: 10.1093/femsle/fnz125. [DOI] [PMC free article] [PubMed] [Google Scholar]
- 44.Pacheco AR, Moel M, Segrè D. Costless metabolic secretions as drivers of interspecies interactions in microbial ecosystems. Nature Communications. 2019;10:1–12. doi: 10.1038/s41467-018-07946-9. [DOI] [PMC free article] [PubMed] [Google Scholar]
- 45.Barton MD, Delneri D, Oliver SG, Rattray M, Bergman CM. Evolutionary Systems Biology of Amino Acid Biosynthetic Cost in Yeast. PLOS ONE. 2010;5:e11935. doi: 10.1371/journal.pone.0011935. [DOI] [PMC free article] [PubMed] [Google Scholar]
- 46.Campbell K, et al. Self-establishing communities enable cooperative metabolite exchange in a eukaryote. eLife. 2015;4 doi: 10.7554/eLife.09943. [DOI] [PMC free article] [PubMed] [Google Scholar]
- 47.D’Souza G, Kost C. Experimental Evolution of Metabolic Dependency in Bacteria. PLOS Genetics. 2016;12:e1006364. doi: 10.1371/journal.pgen.1006364. [DOI] [PMC free article] [PubMed] [Google Scholar]
- 48.Harcombe W. Novel Cooperation Experimentally Evolved Between Species. Evolution. 2010;64:2166–2172. doi: 10.1111/j.1558-5646.2010.00959.x. [DOI] [PubMed] [Google Scholar]
- 49.Goldford JE, et al. Emergent simplicity in microbial community assembly. Science. 2018;361:469–474. doi: 10.1126/science.aat1168. [DOI] [PMC free article] [PubMed] [Google Scholar]
- 50.Zmora N, et al. Personalized Gut Mucosal Colonization Resistance to Empiric Probiotics Is Associated with Unique Host and Microbiome Features. Cell. 2018;174:1388–1405.:e1321. doi: 10.1016/j.cell.2018.08.041. [DOI] [PubMed] [Google Scholar]
- 51.Valen LV. A New Evolutionary Law. Evol Theory. 1973;1:1–30. [Google Scholar]
- 52.Morris JJ, Lenski RE, Zinser ER. The Black Queen Hypothesis: Evolution of Dependencies through Adaptive Gene Loss. mBio. 2012;3 doi: 10.1128/mbio.00036-12. [DOI] [PMC free article] [PubMed] [Google Scholar]
- 53.Pasolli E, et al. Extensive Unexplored Human Microbiome Diversity Revealed by Over 150,000 Genomes from Metagenomes Spanning Age Geography, and Lifestyle. Cell. 2019;176:649–662.:e620. doi: 10.1016/j.cell.2019.01.001. [DOI] [PMC free article] [PubMed] [Google Scholar]
- 54.Bosch AATM, Biesbroek G, Trzcinski K, Sanders EAM, Bogaert D. Viral and Bacterial Interactions in the Upper Respiratory Tract. PLOS Pathogens. 2013;9:e1003057. doi: 10.1371/journal.ppat.1003057. [DOI] [PMC free article] [PubMed] [Google Scholar]
- 55.Peleg AY, Hogan DA, Mylonakis E. Medically important bacterial–fungal interactions. Nature Reviews Microbiology. 2010;8:340–349. doi: 10.1038/nrmicro2313. [DOI] [PubMed] [Google Scholar]
- 56.Huerta-Cepas J, Serra F, Bork P. ETE 3: Reconstruction Analysis, and Visualization of Phylogenomic Data. Molecular Biology and Evolution. 2016;33:1635–1638. doi: 10.1093/molbev/msw046. [DOI] [PMC free article] [PubMed] [Google Scholar]
- 57.Jones DT, Taylor WR, Thornton JM. The rapid generation of mutation data matrices from protein sequences. Bioinformatics. 1992;8:275–282. doi: 10.1093/bioinformatics/8.3.275. [DOI] [PubMed] [Google Scholar]
- 58.Ciccarelli FD. Toward Automatic Reconstruction of a Highly Resolved Tree of Life. Science. 2006;311:1283–1287. doi: 10.1126/science.1123061. [DOI] [PubMed] [Google Scholar]
- 59.Mende DR, Sunagawa S, Zeller G, Bork P. Accurate and universal delineation of prokaryotic species. Nature Methods. 2013;10:881–884. doi: 10.1038/nmeth.2575. [DOI] [PubMed] [Google Scholar]
- 60.Sievers F, et al. Fast scalable generation of high-quality protein multiple sequence alignments using Clustal Omega. Molecular Systems Biology. 2014;7:539–539. doi: 10.1038/msb.2011.75. [DOI] [PMC free article] [PubMed] [Google Scholar]
- 61.Price MN, Dehal PS, Arkin AP. FastTree 2 - Approximately Maximum-Likelihood Trees for Large Alignments. PLoS ONE. 2010;5:e9490. doi: 10.1371/journal.pone.0009490. [DOI] [PMC free article] [PubMed] [Google Scholar]
- 62.Paradis E, Schliep K. ape 5.0: an environment for modern phylogenetics and evolutionary analyses in R. Bioinformatics. 2018;35:526–528. doi: 10.1093/bioinformatics/bty633. [DOI] [PubMed] [Google Scholar]
- 63.Letunic I, Bork P. Interactive tree of life (iTOL) v3: an online tool for the display and annotation of phylogenetic and other trees. Nucleic Acids Research. 2016;44:W242–W245. doi: 10.1093/nar/gkw290. [DOI] [PMC free article] [PubMed] [Google Scholar]
- 64.Revell LJ. phytools: an R package for phylogenetic comparative biology (and other things) Methods in Ecology and Evolution. 2012;3:217–223. doi: 10.1111/j.2041-210X.2011.00169.x. [DOI] [Google Scholar]
- 65.Bollback JP. SIMMAP: Stochastic character mapping of discrete traits on phylogenies. BMC Bioinformatics. 2006;7:88. doi: 10.1186/1471-2105-7-88. [DOI] [PMC free article] [PubMed] [Google Scholar]
Associated Data
This section collects any data citations, data availability statements, or supplementary materials included in this article.
Supplementary Materials
Data Availability Statement
All the data and code required to generate the results and figures presented in this article are publicly available in the following repository: https://github.com/cdanielmachado/cooccurrence.


