Abstract
The transcriptome contains rich information on molecular, cellular, and organismal phenotypes. However, experimental and statistical limitations constrain sensitivity and throughput of genetic screening with single-cell transcriptomics readout. To overcome these limitations, we introduce targeted Perturb-seq (TAP-seq), a sensitive, inexpensive, and platform-independent method focusing single-cell RNA-seq coverage on genes of interest, thereby increasing the sensitivity and scale of genetic screens by orders of magnitude. TAP-seq permits routine analysis of 1,000s of CRISPR-mediated perturbations within a single experiment, detects weak effects and lowly expressed genes, and decreases sequencing requirements up to 50-fold. We apply TAP-seq to generate perturbation-based enhancer-target gene maps for 1,778 enhancers within 2.5% of the human genome. Thereby, we show that enhancer-target association is jointly determined by 3D contact frequency and epigenetic states, allowing accurate prediction of enhancer targets throughout the genome. In addition, we demonstrate that TAP-seq can identify cell subtypes with only 100 sequencing reads per cell.
Introduction
Genetic perturbation studies have been instrumental for delineating causal relationships between genes and phenotypes1,2. Compared with unimodal readouts, such as growth or reporter gene expression, single-cell transcriptomics provides a greater wealth of data on molecular and cellular phenotypes. Thus, pooled CRISPR screens that couple genetic perturbations with single-cell transcriptomics (‘Perturb-seq’, also referred to as ‘CROP-seq’, etc.) have emerged as powerful tools to characterize the consequences of genetic perturbations3–9. In these experiments, each cell stochastically receives one guide RNA out of a guide RNA library, enabling high numbers of perturbations to be assayed in a single experiment. Single-cell RNA-seq is then used to retrieve the identity of the gRNA in each cell along with its effect on the transcriptome, including changes in the expression of single genes4,7–9, as well as large transcriptomic rearrangements3–6,8. Diverse applications have been pursued, including the characterization of genetic regulators of signaling pathway activity6,8 and cellular differentiation5, or the mapping of gene regulatory networks7,9. Moreover, measuring gene expression in single cells obviates the need for cellular assays, and can be applied to any cell type, including rare populations5 and primary cells which cannot be cultivated extensively3.
However, three major factors currently limit a widespread use of Perturb-seq type of experiments. First, costs are prohibitive even for non-genome scale screens4. Second, lowly expressed genes and small effects are not measured efficiently4,7–9. Third, data analysis suffers from a potentially insurmountable multiple testing problem. For example in a hypothetical genome-wide Perturb-seq screen, 20,000 hypotheses on gene expression changes need to be tested for each of 20,000 knockouts (i.e. 400 million total tests). To deal with this problem, previous studies focused on hypothesis-driven analyses of just parts of the data generated in whole-transcriptome screens. For example, differential gene expression testing was restricted to pre-defined candidate genes7,9,10 or genes were grouped into gene signatures3,4,6,8. Alternatively cells were mapped to known reference cell (sub)types or states4,5,11,12, making effective use only of cell-state or cell-type specific marker genes. Measuring the entire transcriptome provides no clear benefit if a hypothesis on perturbation effects exists; in turn, a targeted readout of only relevant genes could overcome limitations, enable genome-scale screens, and open novel applications, such as combinatorial screens, screens in diverse genetic backgrounds, or diverse cell types.
Here, we demonstrate that targeted Perturb-seq (TAP-seq) turns the necessity of restricting the hypothesis space into a virtue for overcoming the hitherto prohibitive sequencing requirements and lack of sensitivity. By amplifying genes-of-interest, rather than the whole transcriptome from single cells, TAP-seq enables single-cell genetic and functional genomic screens at 50-fold higher scale and lower cost. TAP-seq identifies gene expression changes more sensitively, compared to Perturb-seq, and robustly distinguishes cell (sub-)types and differentiation stages. We demonstrate the use of TAP-seq by perturbing all putatively active enhancers in two large genomic regions and querying the effects on expressed genes in the same regions. This allowed us to sensitively identify enhancer target genes based on functional evidence, rather than predictions from indirect measures such as interactions in 3D space13,14. We thereby provide the first high-resolution function-based enhancer-target gene map for a sizeable fraction of the human genome.
Results
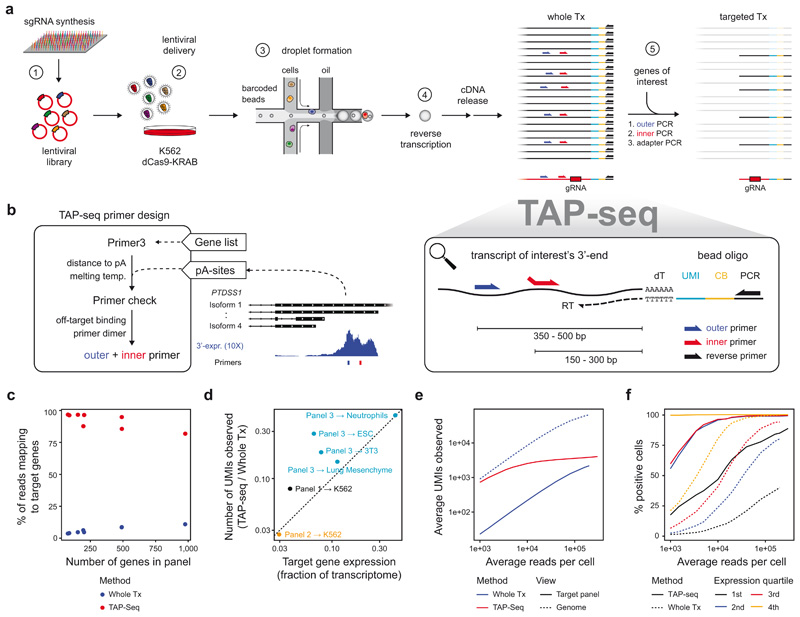
We have established targeted Perturb-seq (TAP-seq) (Figure 1a), that is designed to be compatible with various 3’ single-cell library preparation methods, and is implemented here for 10X Genomics15 and Drop-seq16. In these protocols, cellular and molecular barcodes as well as a universal PCR handle are introduced during reverse transcription. Following cDNA retrieval, TAP-seq uses the universal PCR handle and gene-specific primers to amplify transcripts-of-interest in two semi-nested multiplex PCRs, and a third PCR to add Illumina sequencing adapters (Figure 1a, Extended Data Figure 1). The gRNA-encoding CROP-seq6 vector is also targeted during that process. A primer design pipeline that positions primers in a specified distance from the polyadenylation site while avoiding off-targets and primer dimers (Figure 1b) is provided as an R package on GitHub (https://github.com/argschwind/TAPseq).
Figure 1. TAP-seq permits efficient expression profiling of target genes in single cells.
a. Overview of the method UMI, unique molecular identifier; CB, cell barcode; RT, reverse transcription. b. Schematic presentation of the TAP-seq primer design pipeline. c. Fraction of reads mapping to target genes, comparing TAP-seq and whole transcriptome (Whole Tx) readout for all target gene panels used in this study. d. For three different panels and five different cell types, library complexity was quantified as the number of UMIs observed. Complexity of TAP-seq libraries as fraction of complexity of whole-transcriptome libraries (y-axis) is plotted against the fraction of the transcriptome targeted (x-axis). e. Deeply sequenced TAP-seq (panel 1, 74 target genes) and whole transcriptome libraries were downsampled to a given average number of reads per cell (x-axis). The average number of UMIs observed on the target panel (solid lines, shown for both methods) or across the entire genome (dashed line, only shown for whole transcriptome analysis) is shown. f. Data were downsampled as described in e, and for each gene from the panel, the fraction of cells displaying expression of that gene was computed. Genes were then classified into four bins based on their mean expression in whole transcriptome data, and average positivity scores across all genes in the bin are shown.
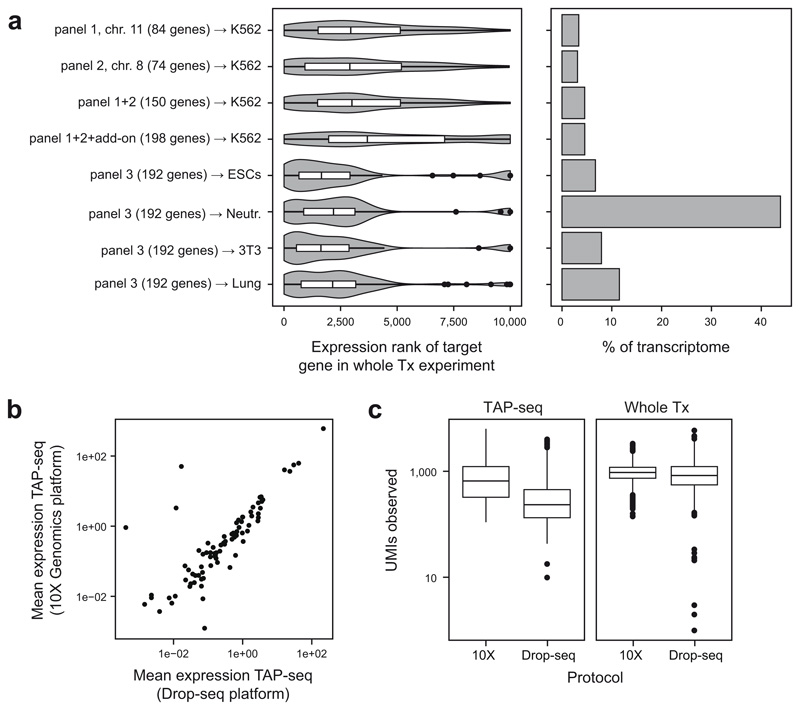
To evaluate TAP-seq, we first designed three primer panels, targeting 74 to 198 genes of widely varying expression levels, corresponding to between 3 and 43% of the transcriptome of K562 cells (panel 1, 2), two different mouse cell lines (panel 3), or two mouse primary cell types (panel 3) (Extended Data Figure 2a, Table S1, see Methods section for target gene selection, and Extended Data Figure 2b,c for a comparison of 10X Genomics15 and Drop-Seq16). Across all panels and cell types, between 87 and 96 % of sequencing reads mapped to the selected target sequences (Figure 1c). When using a substantially larger panel of 1,000 genes (Extended Data Figure 3), the mapping rate decreased to 81%. Thus, byproducts and off-target amplicons were rare, and the protocol amplified target genes irrespective of cell type and in primary cells.
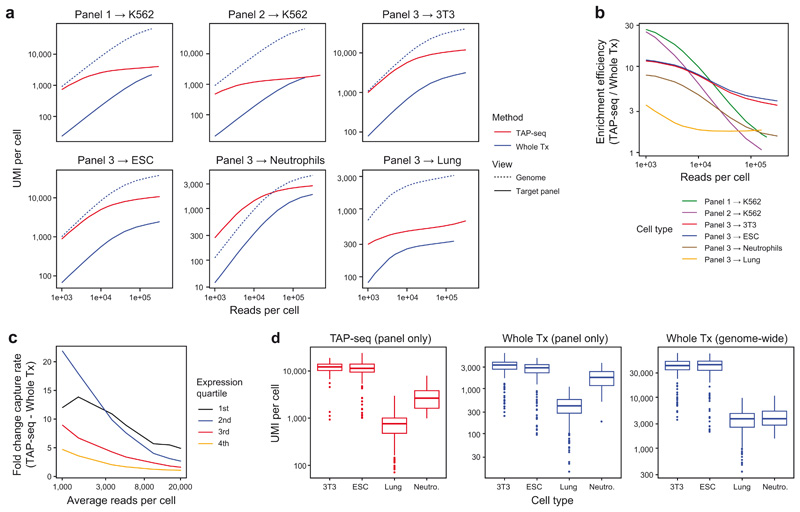
To quantify TAP-seq’s molecular sensitivity, library complexity and enrichment performance, we sequenced TAP-seq and whole transcriptome libraries close to saturation. The number of molecules observed was generally higher than expected from the whole transcriptome analysis (Figure 1d), and the same on-panel capture efficiency was achieved by TAP-seq at a 10- to 100-fold lower sequencing depth (Figure 1e, Extended Data Figure 4a,b). Detection efficiency of lowly expressed genes was increased (Figure 1f, Extended Data Figure 4). Together, these analyses show that the targeted PCR efficiently captures target genes without leading to a decrease in library complexity.
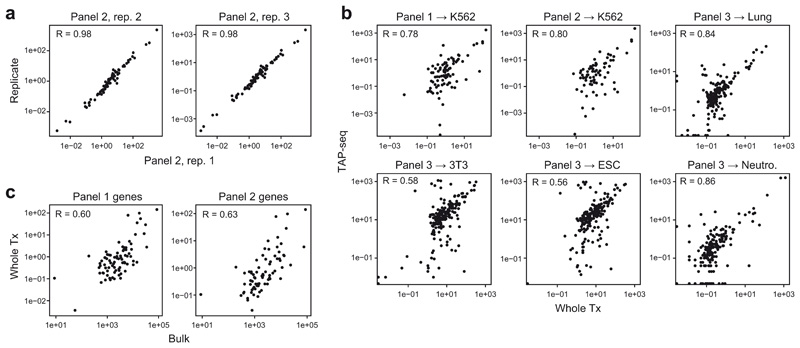
The reproducibility of TAP-seq between different replicate experiments with the same panel remains high (Pearson R = 0.98, Extended Data Figure 5a). Pearson correlations of absolute gene quantification between TAP-seq and whole transcriptome sequencing were between 0.56 and 0.86, as expected from highly multiplexed PCR (Extended Data Figure 5b). For comparison, bulk RNA-seq and whole transcriptome 10X Genomics data displayed a Pearson correlation between 0.60 and 0.63 on the respective genes (Extended Data Figure 5c). As shown below (Figure 2), TAP-seq allows highly sensitive detection of relative gene expression changes, and such measures do not depend on absolute expression level detection-accuracy. Using primer redesign and replacement experiments, we found that, given accurate annotations of polyadenylation sites, no manual optimization of primers is necessary and TAP-seq is robust with regard to variations of primer sequence (see Note S1).
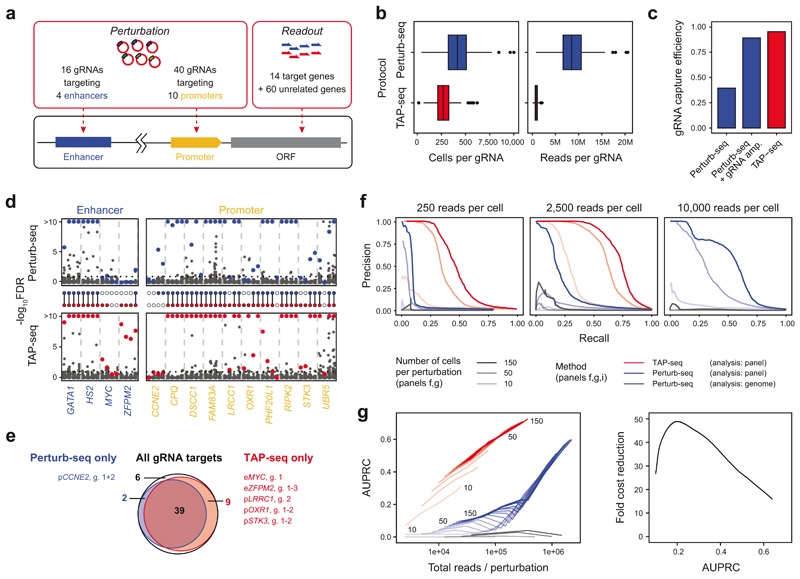
Figure 2. TAP-seq sensitively detects gene expression changes.
a. Illustration of the experimental design. b. Number of cells and reads for each gRNA in whole transcriptome (Whole Tx) and TAP-seq experiments. n=86 gRNAs per group. See Methods section on Data Visualization for definition of box plot elements. c. gRNA capture efficiency was computed using a generative model that takes into account multiplicity of infection4,20. See also Extended Data Figure 6d. d. Benjamini-Hochberg adjusted p-values from differential expression tests, comparing cells carrying a given gRNA and cells carrying a non-targeting (‘scrambled’) control. For each target (x-axis labels), four guides (columns) were analyzed separately. Colored dots correspond to target genes, dark grey dots to all other genes in the panel. HBE1 was analyzed as target gene for HS2 enhancer. See Note S3 on ‘Sensitivity analysis (differential expression)’ for the statistical test used. A total of n=60,106 cells were included into the tests, see panel b for the distribution of cells per gRNA. e. Venn diagram comparing gRNA targets identified by TAP-seq and whole transcriptome readout. g., gRNA ID. f. Data from both methods were downsampled to various average read depths per cell (different panels), and 10-150 cells per gRNA (line opacity). For each sampling run, differential expression testing was performed relative to 500 cells containing scrambled gRNAs. Precision-Recall curves were computed assuming that the intended gRNA targets constitute the full set of true positives. See Extended Data Figure 8a,b for an analysis accounting for off-target effects. g. Areas under the precision-recall curves (AUPRC) are plotted as a function of sequencing depth (left panel). The fold cost reduction was estimated from the difference in sequencing depth quantified as a function of desired AUPRC (right panel). Data from n=60,106 cells and 9,750 sampling runs, see Note S3 section on ‘Sensitivity analysis (differential expression)’.
TAP-seq sensitively detects gene expression changes
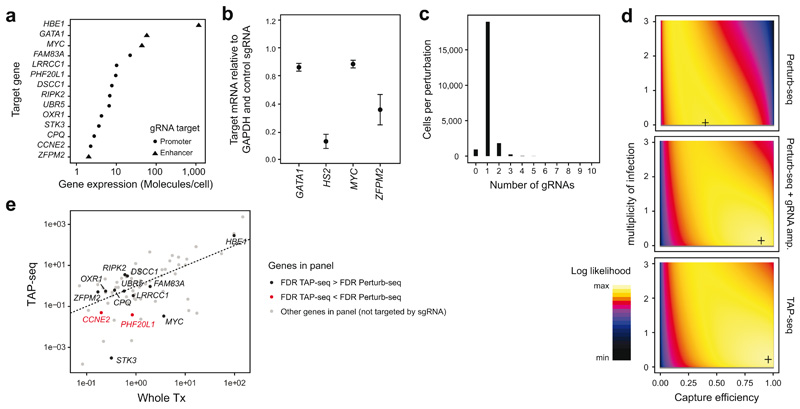
To establish TAP-seq as readout for functional genomics screens, we generated a test dataset with a known ground truth. We infected dCas9-KRAB-expressing K562 cells with a pool of lentiviruses carrying 56 gRNA sequences17–19 targeting one of 10 promoters or 4 well-described enhancers, as well as 30 control gRNAs (Figure 2a, Table S2 sheet ‘Chr. 8 control library’). These perturbations were designed to specifically down-regulate their known target genes in cis and exerted widely varying effect sizes (Extended Data Figure 6a,b), allowing a quantitative benchmarking of differential expression tests. For TAP-seq, we used a primer panel including the known promoter/enhancer target genes, 60 presumably unrelated genes of similar expression level (‘panel 2’), and the gRNA sequence from the CROP-seq6 vector.
In the resulting dataset, each gRNA was covered by a median of 268.5 cells and 0.8 million reads (Figure 2b). From the same pool of cells, we generated whole transcriptome Perturb-seq data, covering each gRNA with a median of 415.5 cells and 8 million reads (Figure 2b). TAP-seq captured gRNA identity with an efficiency of 95%, as compared to 39% in the Perturb-seq setting or 89% in Perturb-seq with additional targeted gRNA amplification20 (Figure 2c, Extended Data Figure 6c,d). Therefore, TAP-seq increased the fraction of informative cells available for differential gene expression testing over a classical Perturb-seq design.
Despite lower cell numbers and 10-fold lower total sequencing depth, TAP-seq outperformed Perturb-seq in differential expression testing: 48 out of 56 (86%) perturbations (i.e. gRNAs leading to an expression change of a promoter or enhancer target) were identified from TAP-seq data, whereas only 41 perturbations (73%) could be identified with Perturb-seq (Figure 2d,e; see Extended Data Figure 7 and Note S2 for the choice of statistical test). Notably, Perturb-seq missed many enhancer perturbations which elicited weak effects (Figure 2d, Extended Data Figure 6b). For two genes (CCNE2 and PHF20L1), statistical power in TAP-seq was lower than in Perturb-Seq; these genes had disproportionally little coverage in TAP-seq, indicative of a lower amplification efficiency (Extended Data Figure 6e, Note S1).
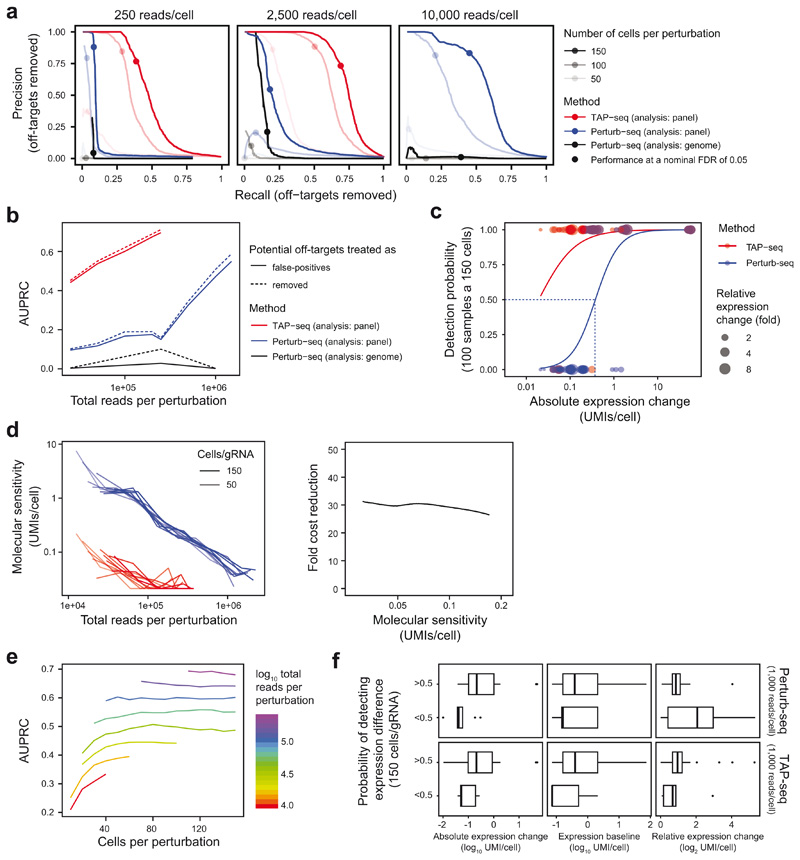
To quantitatively compare the power of TAP-seq and Perturb-seq for differential expression testing, we downsampled to specific numbers of reads per cell, and numbers of cells per gRNA. We then computed the recall (or sensitivity) of the assay as the fraction of true gRNA-target gene pairs identified at a given read and cell coverage, as well as its precision, i.e. the fraction of positives that are true positives. Of note, precision is underestimated in these analyses, since true off-target effects are classified as false positives. We then derived precision-recall curves (Figure 2f, Extended Data Figure 8a,b) and computed the area under the curve (AUPRC) as a performance measure (Figure 2g). These analyses demonstrated that the same performance in differential gene expression testing is achieved in TAP-seq at a 19- to 49-fold lower read depth, compared to Perturb-seq (Figure 2g). Importantly, for the analysis of the Perturb-seq experiment, only genes that were part of the 74 genes from the target panel were tested for differential expression. When the analysis was performed across all detected genes, precision dropped drastically due to an excessive number of false positive hits (Figure 2f,g). These results emphasize the need for hypothesis-driven analysis in Perturb-seq and related experimental designs.
We quantified the absolute expression change required for an effect to be detected to be approximately 0.03 UMI/cell, corresponding to approximately one molecule per cell (Extended Data Figure 8c-f, Note S2). Further analyses of the ground truth dataset allowed us to derive recommendations for the experimental design of TAP-seq screens, provided in Note S2. These findings suggest that hypothesis-free analyses of single-cell genetic screens are strongly dominated by false positives and fail to robustly identify weak hits.
Function-based enhancer-target gene maps for 2.5% of the human genome
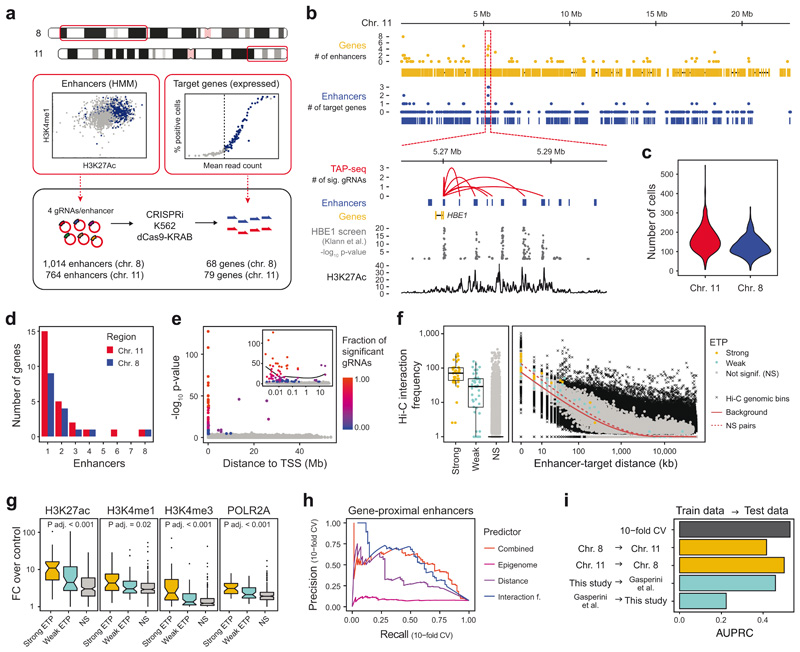
To demonstrate the performance of TAP-seq at scale, we set out to generate function-based enhancer-target gene maps in K562 cells, covering 2.5% of the human genome. Since enhancers predominantly affect genes in their proximity, assigning enhancer-target gene pairs (ETPs) is a well-suited task for TAP-seq. To comprehensively test all possible interactions within genomic regions, we perturbed all 1,778 putatively active enhancers predicted21 based on ENCODE data in two regions on chromosome 8 and 11, and identified effects on expressed protein-coding genes within the same regions (Figure 3a,b). Thus, in each cell, 68 (chr. 8) or 79 (chr. 11) target genes, plus control enhancers, were measured.
Figure 3. A perturbation-based screen of enhancer targets across 2.5% of the human genome.
a. All enhancers in two regions of chromosome 8 and 11, as determined by the GenoSTAN HMM21, were selected, and four gRNAs were designed for each enhancer. All expressed genes on the same genomic regions, except HBG1/2, were selected for targeted readout. Highly expressed HBG1/2 were omitted from the screen to achieve a higher cost-efficiency. b. Top panels: The number of enhancers per gene (yellow), and the number of genes per enhancer (blue) across the selected region on chromosome 11. Bottom panels: Zoom-in on the HBE1 locus. Enhancers are connected to target genes via red arcs. Results are compared to p-values from a FACS-based CRISPRi screen of enhancers regulating HBE1 22, as well as H3K27Ac ChIP-seq signal. P-values are from linear regression as described in ref. 22. c. Number of cells profiled per enhancer perturbation depicted as a violin plot (n=1790 enhancer perturbations). d. Number of enhancers identified for the 147 target genes. For 106 genes, no candidate enhancer was identified. e. The distance between candidate enhancer and target gene transcriptional start site (TSS) is plotted against the TAP-seq p-value. The fraction of individual gRNAs per enhancer causing significant effects is color coded. Inset shows x-axis in logarithmic scale. A total of n=231,667 cells were included in the tests, see panel c for the distribution of cells per perturbation and Note S3 section on ‘Enhancer screen analysis’ for a description of the statistical test used. f. Relationship between Hi-C interaction frequency39, linear distance of the enhancer to the TSS of the target gene, and TAP-seq result. ‘Strong’ enhancer-target pairs (ETPs) are supported by at least 50% of candidate gRNAs for a given enhancer, see also main text. Hi-C genomic bins are all measured interactions within the genomic regions used to estimate expected background interaction frequencies, see Note S3 section Hi-C and chromatin analyses section for details. See Methods section on Data Visualization for definition of box plot elements. g. Relationship between ChIP-seq signal of various chromatin marks40 and TAP-seq results. ‘Strong’ enhancers have at least one target gene supported by at least 50% of gRNAs. p-values are from Kruskal-Wallis tests assessing overall differences between ETP classes, see table S4 for p-values of pairwise comparisons and number of samples per group. h,i. Performance of machine-learning based classifiers in predicting ETPs. Only genes with at least one enhancer were included. h. Random forest classifiers were trained on the indicated set of features and performance was assessed in a 10-fold cross validation (CV) scheme. i. Random forest classifiers were trained on a given dataset (train data), and performance of the classifier on another dataset (test data) was tested. Areas under the precision-recall curves are shown, see Extended Data Figure 9i for curves.
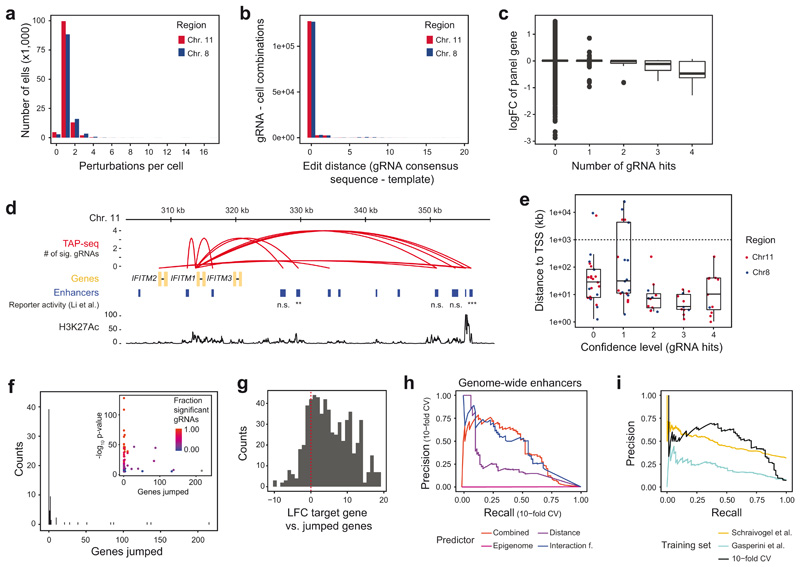
Four gRNAs were designed per target enhancer and introduced into K562 cells at a low multiplicity of infection, followed by selection for stable expression (Extended Data Figure 9a,b, Table S2). An average of 37 cells per gRNA or 143 cells per enhancer were profiled, for a total of 7,055 gRNA perturbations in 231,667 cells (Figure 3c). For each enhancer and gRNA, we identified differentially expressed genes using the statistical test established in the preceding section. We observed a total of 81 significant cis-acting ETPs, involving 24-32% of the genes profiled within the respective genomic region, and 4.4% of the tested enhancers (Figure 3d, Table S3). A previous study using Perturb-seq identified enhancers for only ~3.5-6% of expressed genes9, underscoring the higher sensitivity of TAP-seq. For the analyses below, we further classified our hits into 36 ‘strong’ ETPs supported by at least 50% of the gRNAs targeting the enhancer, and 45 ‘weak’ ETPs (Extended Data Figure 9c).
To gauge the ability of TAP-seq to identify bona fide enhancers, we compared our results to published enhancer-target gene associations (Figure 3b, Extended Data Figure 9d). For example, we validated 4 out of 5 enhancers identified in a CRISPRi screen for HBE1 enhancers using a fluorescent reporter22 (Figure 3b).
In an analysis of the whole dataset, we observed several trends. First, most enhancers, and virtually all enhancers from strong ETPs, are located close (10-50kb) to their respective target gene’s transcriptional start site (TSS, Figure 3e, Extended Data Figure 9e). However, in 48% of cases (33% of strong ETPs), at least one other gene was located between the enhancer and target TSS (Extended Data Figure 9f); these genes were on average expressed 1,000-fold lower compared to the true enhancer target (Extended Data Figure 9g). Second, interaction frequencies from Hi-C were significantly elevated in strong and weak ETPs (Figure 3f) and contained more information on the potential to form functional interactions than linear distance (see Figure 3h below). Third, enhancers of strong ETPs were enriched for active chromatin marks H3K27ac, H3K4me1/3 and RNA Polymerase II compared to non-significant ETPs with a similar distance to TSS distribution (Figure 3g, Table S4).
We next integrated these results into machine-learning models to predict ETPs. In a quantitative analysis across all genes with at least one associated enhancer, a joint model (of linear distance, interaction frequency, and epigenome features) identified 75% of all 61 ETPs from 3,781 potential ETPs with an enhancer-TSS distance of below 300kb at a precision of 50% (Figure 3h, see Extended Data Figure 9h for an analysis of 34,493 potential ETPs across the entire data set). A model trained on data from chromosome 11 efficiently predicted ETPs on chromosome 8, and vice versa (Figure 3i). When trained on all data from this study, our model predicted ETPs identified in a Perturb-seq study9 (75% recall at a precision of 40%); the converse did not work effectively (Figure 3i, Extended Data Figure 9i). Together, these analyses demonstrate that a model based on enhancer activity and contact frequency can predict ETPs genome-wide. Furthermore, a model trained on TAP-seq data allows more accurate genome-wide predictions compared to a model trained on Perturb-seq data.
TAP-seq identifies cell-types and differentiation states with shallow sequencing
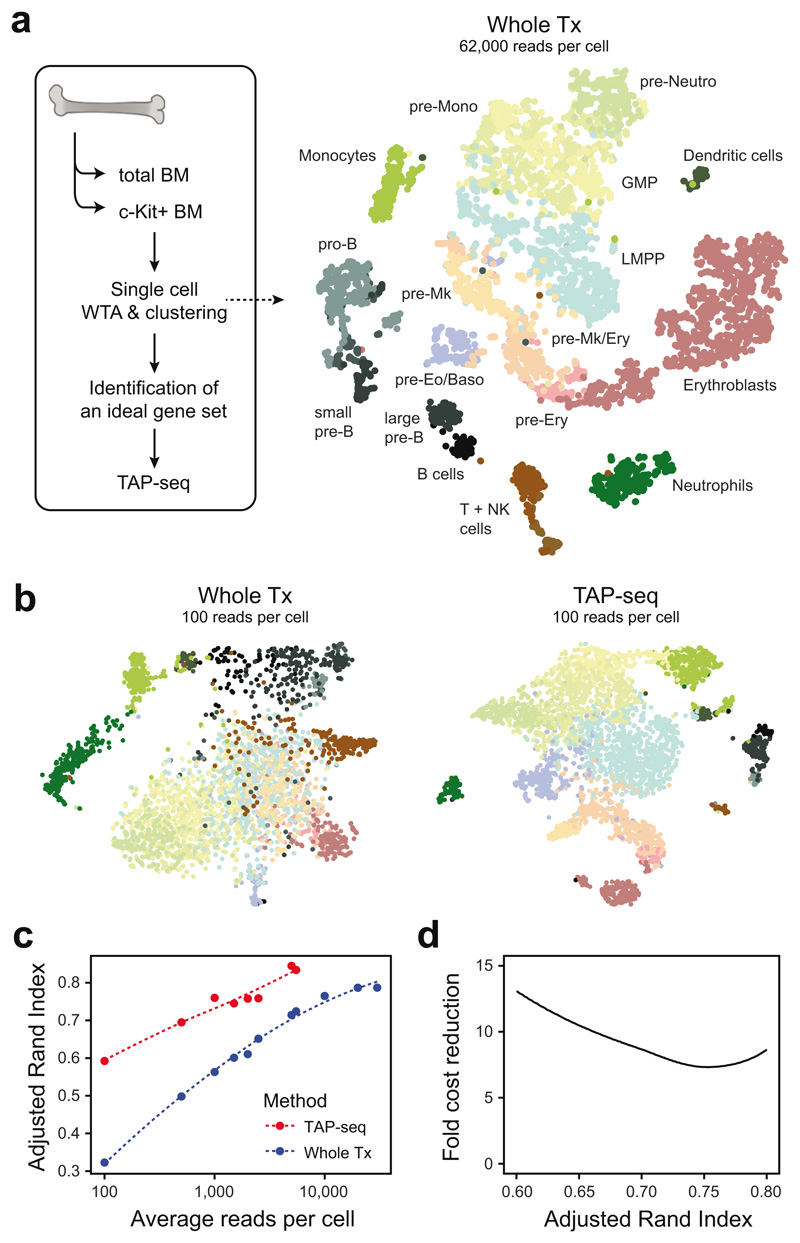
Single cell perturbation screens are also used to define changes in cell type abundance and cell state3,5,6. Typically, this is performed with whole transcriptome readouts, but potentially could be done with much fewer reads. Here, we applied TAP-seq to murine bone marrow (BM) to evaluate its ability to distinguish cell types, including similar progenitor cell states from immature, c-Kit+ BM23,24. Using a whole transcriptome reference dataset of total and immature BM cells25, we identified 184 genes which optimally distinguished 18 different cell types (Figure 4a, see Online Methods for gene selection using a whole transcriptome reference). TAP-seq libraries were then generated from the same BM fractions included in the reference dataset. Cell types were identified by unsupervised clustering and marker gene expression, and confirmed via label transfer26 from the whole transcriptome reference (Extended Data Figure 10a-b).
Figure 4. TAP-seq permits efficient identification of cell types and differentiation states at very low read depths.
a. Whole transcriptome (Whole Tx) sequencing data from mouse total bone marrow and c-Kit+ bone marrow25 (GEO GSE122465) was projected using t-SNE (right panel). Cell type annotations were taken from ref. 25; abbreviations used: GMP, Granulocyte or Monocyte Precursor; LMPP, Lymhpoid-Primed Multipotent Progenitor; Mono, Monocyte; Mk, Megakaryocyte; Neutro, Neutrophil; Ery, Erythroid. A maximally informative gene set allowing to distinguish all cell types involved was then identified using LASSO (see methods). n=4,957 cells. b. t-SNE projection of whole transcriptome and TAP-seq data, downsampled to an average read depth of 100 reads per cell. Color indicates the cell type identified in non-downsampled data (see panel a for color code). n=4,957 cells (Whole Tx) or 11,794 cells (TAP-seq). c. Data from both methods were downsampled to various average read depths and unsupervised clustering was performed using the Seurat pipeline26. Average read depth per cell is plotted against the overlap between clusters identified in downsampled data and reference clusters, as quantified by the adjusted Rand Index. d. The fold difference in sequencing reads between TAP-seq and whole transcriptome is plotted as a function of Rand Index.
To compare the ability of TAP-seq and whole transcriptome readout to distinguish between cell states at lower sequencing depths, gene expression data were downsampled to defined average read depths. Unsupervised clustering was then applied and compared to ground truth labels obtained from our deeply sequenced reference. The results show that only 100 average reads per cell reliably distinguish cell types and differentiation stages in TAP-seq (Figure 4b). A quantitatively similar performance is therefore achieved at a 7- to 12-fold lower sequencing depth (Figure 4c, d). Similar decreases in sequencing requirements were obtained when using supervised methods for cell type identification (i.e. label transfer from a reference data set)26 (Extended Data Figure 10d-f). In summary, TAP-seq outperforms non-targeted approaches in cell type mapping, and reliably identifies cell types and differentiation states at an extremely low sequencing depth.
Discussion
In conclusion, targeted Perturb-seq (TAP-seq) enables genome-scale CRISPR screens that use transcriptomics as a readout. By focusing sequencing coverage on genes of interest, TAP-seq lowers sequencing requirements up to 50-fold, and solves the multiple hypothesis testing problem typically encountered in whole transcriptome screens. It increases the sensitivity towards small expression changes and lowly expressed genes, and retrieves the gRNA identity efficiently. Unlike previous high-throughput27–29 and low-throughput30 targeted single-cell RNA-seq methods, its modular design ensures platform-independent, robust genetic screens.
TAP-seq is applicable to a broad range of functional genomics applications, including studies of gene regulatory networks7,19,31, signaling pathways6,32, and combinatorial regulatory logic7,32,33, where phenotypes of interest are represented by expression changes in small sets of genes. When applied to more complex transcriptomic signatures, e.g. of cellular differentiation/state, or immune cell activation, informative sets of genes can be defined a priori using a whole transcriptome reference. Alternatively, gene panels such as the L1000 panel34 could be used (Extended Data Figure 3), which has been shown to capture the majority of information contained in the full transcriptome across a wide range of perturbations34. We make L1000 primers for TAP-seq available upon request.
We applied TAP-seq to generate dense enhancer-promoter interaction maps within 2.5% of the human genome, screening over 7,000 distinct CRISPRi perturbations. Previous applications of Perturb-seq for enhancer targets7,9 had remained limited to large effect sizes and identified enhancers only for a small fraction of candidate genes (3.5-6% in ref. 9 compared to 24-32% reported here). We identified ~80 novel enhancer-target gene pairs and found that physical proximity in 3D, and to a smaller extent chromatin activity, determine the regulatory potential of an enhancer. This allowed us to derive quantitative rules of enhancer-target gene interactions.
A potential caveat of these analyses is that dCas9-KRAB does not specifically inactivate enhancers, but rather inhibits transcriptional activity both at promoters and enhancers35. Since targeting dCas9-KRAB to gene-proximal sites with lower levels of H3K27 acetylation did not induce a measurable effect on the gene, the CRISPRi effect does not simply spread to the promoter along linear DNA; also, enhancers within 1kb of the target TSS were excluded. In future studies, results from CRISPRi-screens using dCas9-KRAB could be compared to dCas9-LSD35, or expanded by potentially stronger dual-activator and -inhibitor constructs36.
TAP-seq scales single-cell genetic screens to 1,000s of gRNA mediated perturbations. Based on the analysis of the comprehensive test dataset with known ground truth, we derive recommendations on experimental design and required sequencing depth (Note S2). In the future, a further increase in throughput can be achieved by combining TAP-seq with ongoing developments of ultra-high throughput single-cell capture strategies37,38. Taken together, targeted Perturb-Seq enables genetic screens at unprecedented resolution and throughput.
Online methods
Vectors and cloning strategies
Lentiviral packaging vectors pMD2.G and psPAX2 were a gift from Didier Trono (Addgene plasmids #12259 and #12260). CROPseq-Puro was a gift from Christoph Bock (Addgene plasmid #86708). UCOE-SFFV-dCas9-BFP-KRAB was a gift from Jonathan Weissman (Addgene plasmids #60955 and #85969).
CROPseq-Puro-F+E was cloned by replacing the original tracrRNA with the optimized F+E tracrRNA sequence41 using site-directed mutagenesis and Gibson assembly. One whole CROPseq-Puro spanning PCR was done with overlapping mutagenesis primers fwd 5’-TGT TTA AGA GCT ATG CTG GAA ACA GCA TAG CAA GTT TAA ATA AGG CTA GTC CGT TAT CAA CTT GAA AAA G and rev 5’-TAT TTA AAC TTG CTA TGC TGT TTC CAG CAT AGC TCT TAA ACA GAG ACG TAC AAA AAA GAG CAA GAA G using LongAmp DNA polymerase (NEB). The PCR product was DpnI digested to deplete residual unamplified circular CROPseq-Puro template. The digested and gel-purified PCR product was then circularized with Gibson assembly Mastermix (NEB) to generate CROPseq-Puro-F+E.
Cloning of individual sgRNAs
sgRNA sequences targeting MYC, GATA1, ZFPM2 and HS2 enhancers were described previously18,19 and sgRNAs targeting ZFPM2 enhancer42 were designed in Benchling. All protospacer sequences are shown in Table S2. sgRNAs were cloned into CROP-seq vectors using Gibson assembly or restriction ligation.
CROPseq-Puro or CROPseq-Puro-F+E was digested with BsmBI (NEB) and the backbone fragment (8.3 kb) was gel extracted. sgRNAs were ordered as ssDNA fwd and rev oligo pairs with 35 nt 5’ homology (5’-GGC TTT ATA TAT CTT GTG GAA AGG ACG AAA CAC CG, with the last G corresponding to the sgRNA transcriptional start G), 19 nt sgRNA sequence and 3’ homology to CROPseq-Puro (5’-GTT TTA GAG CTA GAA ATA GCA AGT TAA AAT AAG GC) or CROPseq-Puro-F+E (5’-GTT TAA GAG CTA TGC TGG AAA CAG CAT AGC AAG TT). Oligos were mixed at equimolar ratio and annealed by heating to 95 °C for 5 min and ramping to 4 °C over 5 min. Annealed oligos were cloned into CROPseq-Puro or CROPseq-Puro-F+E using Gibson Assembly Master Mix (NEB) or NEBuilder HiFi DNA Assembly Master Mix (NEB) at a backbone:insert ratio of 1:20. Reactions were transformed into NEB Stable chemically competent E. coli and were grown out at 30 or 32 °C to reduce the rate of plasmid recombination.
For sgRNA cloning using restriction-ligation, oligos were ordered with sticky-end overhangs matching the BsmBI digested CROPseq-Puro and CROPseq-Puro-F+E backbone, fwd and rev oligos were annealed and phosphorylated using T4 PNK and cloned into digested and dephosphorylated backbones using T4 DNA Ligase (NEB). Transformation was done as described above.
Enhancer targeting sgRNA design
For the enhancer screen in Figure 3, candidate enhancers were defined as DNase hypersensitive sites with a histone modification pattern indicative of active enhancers. For each candidate enhancer, we included 4 gRNAs in the screen (Table S2). In detail, K562 DNase hypersensitive (HS) hotspots were obtained from the ENCODE reference epigenome40 (experiment ENCSR921NMD) and chromatin annotations were obtained by GenoSTAN21, a chromatin state HMM model. DNase HS hotspots that overlapped with GenoSTAN active enhancer annotations (Enh.15, EnhWF.2, EnhF.10) by at least 50 bases were included as candidate enhancers. For each enhancer, candidate gRNAs were identified based on the presence of a PAM and ranked by putative on-target activity, as determined using the activity model from ref. 17. Candidate gRNAs were then aligned to the genome to determine off-target effects: Guides with alignment near a transcriptional start site (TSS) were always excluded. Guides with alignment to other genomic positions were excluded, if a sufficient number of guides with positive activity scores exist. After these filtering steps, the four gRNAs with the highest activity scores were selected.
Cloning of sgRNA libraries
Enhancer targeting libraries used in Figure 3 were ordered as 89 nt ssDNA SureGuide high-fidelity libraries from Agilent, including 35 nt 5’ and 3’ homologies matching CROPseq-Puro-F+E. All protospacer sequences are shown in Table S2. Libraries were amplified using 5’-GTA TTT CGA TTT CTT GGC TTT ATA TAT CTT GTG G and 5’-GAC TAG CCT TAT TTA AAC TTG CTA TGC TGT TTC extending the homologies to 50 bp. Amplification was done with Q5 Hot Start HiFi 2x Master Mix (NEB), 0.5 μM fwd primer, 0.5 μM rev primer and 2 nM sgRNA library using cycling conditions 95 °C 3 min – 14 x [98 °C 10 sec, 51 °C 15 sec, 72 °C 10 sec] - 72 °C 1 min. Optimal cycle number was determined as highest cycle number before the appearance of concatemeric PCR products on a High Sensitivity dsDNA Bioanalyzer. Amplified sgRNA libraries were cloned into CROPseq-Puro-F+E using NEBuilder HiFi DNA Assembly Master Mix (NEB) at a backbone:insert ratio of 1:20. Assembled libraries were transformed into electrocompetent Lucigen Endura E. coli and grown out on plates for 16 h at 30 °C for ≥ 100x library coverage. Colonies were pooled and plasmid preparations were done using Zymopure II Plasmid Maxiprep kit (Zymo Research). In parallel, > 20 colonies were picked per library and Sanger validated.
Libraries targeting known enhancers and promoters (see Table S2) as used in Figure 2 and 3 were generated from ssDNA oligos, which were annealed and amplified in separate reactions, followed by pooled Gibson cloning into CROPseq-Puro-F+E as described above. sgRNA sequences targeting promoters and non-targeting sgRNAs were taken from CRISPRi v2 libraries17, sgRNA sequences targeting MYC, GATA1, ZFPM2 and HS2 enhancers were described above.
Cell culture
HEK 293FT cells were maintained in DMEM (Thermo, 41965039) supplemented with 10 % fetal bovine serum (FBS), 2 mM L-Glutamine, 1 mM Na-pyruvate, 0.1 mM NEAA, 500 μg/ml G418 and Penicillin/Streptomycin (P/S) (Sigma Aldrich and Thermo). K562 (from ATCC, CCL-243) and stable clones thereof were cultivated in RPMI-1640 (Thermo 21875034) supplemented with 10 % FBS and P/S. NIH 3T3 cells were cultivated in DMEM (Thermo, 41965039) supplemented with 10 % FBS and P/S. Mouse embryonic stem cells (mESC) were cultivated under FCS/LIF conditions as described43.
Lentivirus production
Lentivirus was produced in HEK 293FT cells. Cells were grown to 90 to 95 % confluency in medium without G418 in 6-well plates. Lentiviral packaging vectors pMD2.G and psPAX2 and the transfer plasmid were mixed 1:1:1 and transfected using Lipofectamine 3000 (Thermo). 6 hours post-transfection, cells were split into a 10 cm plate in medium without G418. 3 days post-transfection, cell culture supernatant was collected, cleared through a 0.45 μm filter and lentivirus was 20 x concentrated with Lenti-X concentrator (Takara/Clontech).
Lentiviral transduction and generation of stable cell lines
For stable selection of K562 and K562 dCas9-KRAB cell lines, exponentially growing cells were diluted to 0.5 x 10^6 cells/ml and polybrene was added to a final concentration of 10 μg/ml. Concentrated virus was added to cells or cells were added to virus. 24 hours post infection, cells were collected and resuspended in K562 medium for antibiotic or fluorescence activated cell sorting (FACS) selection.
K562 CRISPRi polyclonal cell line expressing dCas9-KRAB was generated by transduction of K562 with UCOE-SFFV-dCas9-BFP-KRAB at high multiplicity of infection (MOI). 4 d and again 7 d after infection, cells were sorted for high BFP expression and polyclonal cell line was checked regularly for the percentage of BFP-positive cells.
Infection of K562 CRISPRi with CROP-seq vectors was done at low MOI to get mostly single infected cells. To set MOIs, the timepoint of highest cell death and the maximum percentage of dead cells during Puromycin selection was determined: Cell death of around 90 % 4 d after infection showed a low number of multiply infected cells as determined from CROP-seq vector reads in TAP-seq and whole transcriptome Perturb-Seq data. 24 h after infection, cells were collected and diluted to 0.5 x 10^6 cells/ml with medium containing Puromycin (Thermo) at a final concentration of 2 ng/μl. Cell growth was monitored during selection by cell counting and viable cell staining using Trypan-blue.
qPCR based measurement of CRISPRi effects
The CRISPRi effect on known enhancer-target gene pairs (ETPs) MYC, GATA1, HS2 enhancer and ZFPM2 was measured using qPCR. K562 dCas9-KRAB polyclonal cells infected with CROP-seq vectors were harvested 10 to 14 days after infection and Puromycin selection. Supernatant was removed and total RNA was prepared using NucleoSpin RNA Plus (Macherey Nagel). RT was performed using DNaseI-digested RNA and SuperScript II. qPCR was done with SYBR-Green PCR master mix (Thermo). Data were processed using ddCt method and standard deviations of the 2^ddCt values from biological replicates were calculated. qPCR primer sequences: GAPDH fwd 5’-TGG TAT CGT GGA AGG ACT CAT GAC, GAPDH rev 5’-ATG CCA GTG AGC TTC CCG TTC AGC. ZFPM2 primer sequences were taken from ref. 42, MYC/GATA1/HDAC from ref. 19, hemoglobin gene primers from ref. 18.
Primary cell samples
For bone marrow samples and lung samples, C57BL/6 mice were bred and housed under pathogen-free conditions at the central animal facility of the German Cancer Research Center (DKFZ) or EMBL.
Bone marrow was extracted and cells were sorted as described previously25. In short, femurs, tibiae, hips and spines were dissected and cleaned from surrounding tissue. Bones were crushed in cell suspension medium and dissociated cells were filtered, red blood cell lysis was performed and cells were lineage-depleted using Dynabeads Untouched Mouse CD4 Cells Kit. Lineage-depleted bone and bone marrow cells obtained following crushing and digestion were stained with FACS c-Kit antibody, and sorted as described. For the isolation of neutrophils, single viable cells were isolated using forward/sideward scatter and DAPI dye exclusion, and CD11b+/Ly6G+ neutrophils were isolated.
Lung mesenchymal cells were provided by the group of C. Scholl, DKFZ. In short, lungs were perfused with cold PBS and instilled with collagenase I. Lungs were removed while trachea was clamped. The lungs were cleaned from non-respiratory tissue and minced. Following depletion of erythrocytes, mesenchymal cells were sorted as Dapi–/Epcam–/CD45–/CD31–/Pdgfra+/Sca1–/Npnt+.
Preparation of cells for scRNA-seq
After Puromycin selection for 14 days, K562 dCas9-KRAB cells infected with CROP-seq vectors were collected and resuspended in PBS. FACS was carried out on a BD FACSAria Fusion flow cytometer (BD Biosciences) selecting single cells using forward and sideward scatter, viable cells using Draq7 dye exclusion and dCas9-BFP-KRAB intermediate to high expressing cells using BFP signal. Sorted cells were collected by centrifugation for 9 min at 200 g (RT) and resuspended in PBS to 1 x 10^6 cells/ml as determined by cell counting. Cells were stored on ice for up to 1 h. Cell counts were double-checked directly before loading on the 10X Genomics Chromium controller.
For NIH 3T3, mESCs, mouse lung mesenchyme, and mouse neutrophils, defined numbers of viable cells, as measured using dye exclusion with DAPI or Draq7, were sorted and pooled for 10X Genomics.
scRNA-seq with whole transcriptome readout
Whole transcriptome single-cell 3’ RNA-seq libraries were generated using 10X Genomics Chromium 3’ reagent kit v2 according to the manufacturer’s guidelines. Cell input was set to a targeted cell recovery of 8,000 cells per lane. Sample indexing was done using i7 Multiplex Kit (10X Genomics).
TAP-seq target gene selection
For the target gene panels 1 and 2 (used in Figures 1-3), genes were selected based on chromosomal location, while excluding non-expressed genes. For the large-scale enhancer screen, the highly expressed genes HBG1/2 were omitted from the panels to achieve higher cost efficiency. The K562 add-on panel (Figure 1c and S2a) was designed to target 48 genes expressed in K562 which are downstream targets of Oct4, as part of an experiment not included into this manuscript. Target genes are listed in Table S1.
For the target gene panel 3 (used in Figure 1 and Extended Data Figures 2,3) 150 genes were selected for relatively uniform expression between NIH 3T3 cells, mESCs, lung mesenchyme, and neutrophils. Average expression of all genes was calculated for each cell type using available whole transcriptome single-cell RNA-seq data (refs. 25,44–46), and used to calculate mean values and coefficients of variation across the four cell types. Mean values were stratified into 30 bins, and for each bin, 5 genes from the lowest decile of CV were randomly selected. Additionally, 12 genes with highly specific expression to each cell type were added to the panel.
For the bone marrow experiment in Figure 4, target genes were identified using a machine learning based workflow. Whole transcriptome data from total bone marrow and c-Kit+ bone marrow from mouse was downloaded from NCBI GEO (GSE122465, ref. 25), and the original cell type annotation from ref. 25 was used. For each cell type, we then identified the 20 differentially expressed (DE) genes with the highest log-fold change compared to all remaining cell types to create a list of 267 candidate genes. We then used a generalized linear model of the multinomial family with a LASSO penalty to select an optimal set of genes whose expression distinguished all populations. Four final gene panels were compared in their ability to distinguish cell types, using a cross validation scheme: a) 238 genes selected using an optimal lambda penalty parameter, as determined by 10-fold CV, b) 126 genes selected using a more stringent parameter, c) a list of 92 genes provided by an expert hematologist (S. Haas, DKFZ Heidelberg) and d) the union of b and c (192 genes). While a, b and d provided a similar well type classification performance (Cohen’s Kappa 0.8-0.85 in 10-fold CV), c performed worse (Cohen’s Kappa 0.65). Panel d was selected because it contained several genes considered informative for the annotation of cell types (Figure 4b). Primers were successfully designed for 184 of the 192 target genes. Target gene selection for cell types using a whole transcriptome references is implemented in the TAP-seq R-package for primer design.
All primer panels used in this study are available from the corresponding authors upon request.
TAP-seq primer panel design
A customized pipeline based on Primer347,48 was devised to design targeted PCR primers. Primers were designed based on protein-coding exon annotations for the target genes (Gencode GRCh38.89). Available Drop-seq or 10X Genomics scRNA-seq data were used to identify expressed isoforms and likely polyadenylation (polyA) sites for every target gene of interest. If multiple polyA sites were found, the most downstream site was chosen. The most downstream annotated 3’ end was used if no polyA site could be identified. If several transcript isoforms overlapped with the inferred polyA sites or no polyA sites were found, their annotations were merged (union) to form a consensus annotation for primer design. Transcript sequences were extracted (hg38) for all target genes and nested forward primers were designed around the 3’ end: Outer forward primers were selected to result in 350-500 bp long amplicons, which were then used to design inner forward primers that yield 150-300 bp long amplicons. The Drop-seq reverse primer used for all PCR reactions was provided to optimize compatibility. Ten forward and reverse primers were designed per target gene and aligned against a human genome and transcriptome database using blast to identify potential off-target annealing. The inner and outer primers with the fewest exonic, intronic and intergenic off-target alignments (in that order) were selected for every gene, and all primers were assessed for multiplex suitability with Primer3’s check_primers functionality. Primers were synthesized as separate oligos and purified by desalting (Sigma Aldrich). All TAP-seq gene panel primer sequences used in this study are listed in Table S1.
TAP-seq library preparation using 10X Genomics Chromium
The protocol described here was optimized using 10X Genomics 3’ reagent kit v2, but can be used for v3 chemistry, since the oligo handle sequence (PartialRead1) is identical between v2 and v3. All oligonucleotide sequences described here are shown in Table S6. A step-by-step protocol for TAP-seq is provided as Supplementary Protocol, and was made available at Protocol Exchange49.
Cell barcoding and reverse transcription
10X Genomics Chromium run for TAP-seq was done with cells sorted as described above and following 10X Genomics user guidelines for 3’ reagent kit v2 with the following modifications: For GEM generation and barcoding, no 10X RT primer (containing the template-switch oligo) was added to the single cell master mix (10X v2 Protocol Step 1.1). To correct for the missing volume, 3.8 μl H2O or low-TE was added. For large-scale experiments in Figure 3, the 10X Chromium run was performed with a modified chip loading protocol (adapted from ref. 50): 28 μl of beads were loaded per 10X lane and 10X RT Enzyme was replaced by 10 μl Superscript IV (Thermo, 200 U/μl). We then continued with the 10X 3’ reagent kit v2 protocol until GEM-RT incubation (10X v2 Protocol Step 1.5). After GEM-RT incubation, cDNA was cleaned up according to the manufacturer’s protocol, eluted using 35 μl Elution Solution I and stored at 4 °C as input for TAP-seq PCR1.
PCR1 and PCR2 with gene-specific outer and inner primers
Pooled gene-specific nested primers were used as forward primers in PCR1 and PCR2. A primer PartialRead1 annealing to the PCR handle on 10X Genomics 3’ beads served as reverse primer for both PCRs. Forward outer and inner primer panels were generated by pooling all single oligos (100 μM in H2O) in equimolar ratio. CROP-seq vector derived Polymerase II transcripts were amplified with CROPouter and CROPinner primers, which were added in 8x excess relative to each single primer in the outer and inner primer mix. CROPouter and CROPinner primers were not added in mouse bone marrow TAP-seq experiments.
PCR1 was done with 35 μl purified cDNA from 10X GEM-RT, 2.5 μl 100 μM gene-specific outer primer mix, 2 μl 12 μM CROPouter, 4 μl 10 μM PartialRead1 and 50 μl KAPA HiFi Hotstart Readymix in 100 μl total volume. Per 10X Genomics lane, one 100 μl reaction was set up. Cycling conditions were 95 °C 3 min – 11x [98 °C 20 sec, 67 °C 60 sec, 72 °C 60 sec] – 72 °C 5min – 4 °C. Cycle number was increased to 12 cycles for the large-scale enhancer screen in Figure 3. PCR product was purified using 1.5x AMPure XP (Beckman) with two 80 % EtOH washes, elution was done in 30 μl Elution Buffer (Qiagen). Typical yield from PCR1 was 50 to 250 ng per reaction.
PCR2 was done with 10 ng PCR1 product, 2.5 μl 100 μM gene-specific inner primer mix, 2 μl 12 μM CROPinner primer and 4 μl 10 μM PartialRead1 in a 100 μl reaction using KAPA HiFi Hotstart Readymix. Cycling conditions were 95 °C 3 min – 8x [98 °C 20 sec, 67 °C 60 sec, 72 °C 60 sec] – 72 °C 5min – 4 °C. Product was purified as above and eluted in 30 μl Elution Buffer. Typical yield from PCR2 was 50 to 100 ng per reaction.
PCR3 with Illumina primers
PCR3 adds Illumina adapters to generate a sequencing-ready library. PCR3 was done using 10 ng PCR2 purified product, 4 μl 10 μM Targeted10X and 2.5 μl 10 μM Illumina reverse primer N7XX in a 100 μl Reaction with KAPA HiFi Hotstart Readymix. Cycling conditions were 95 °C 3 min – 8x [98 °C 20 sec, 60 °C 15 sec, 72 °C 45 sec] – 72 °C 5min – 4 °C. Product was purified as above and eluted in 30 μl Elution Buffer. Typical yield from PCR3 was 300 to 600 ng per reaction. Product was checked on a High Sensitivity DNA Bioanalyzer (Agilent). Sample bioanalyzer traces are shown in Extended Data Figure 1.
Illumina sequencing
TAP-seq produces Illumina sequencing ready libraries identical to 10X Genomics single-cell 3’ libraries using standard Illumina Read 1 and Read 2 primers. The cell barcode and UMI is encoded in Read 1 (26 cycles), Read 2 contains the cDNA fragment (~58 cycles). Sample index sequences are sequenced as i7 index read (8 cycles).
TAP-seq library preparation from Drop-seq
The first steps of the Drop-seq protocol until Exonuclease I treatment were implemented as described16. The Drop-seq template switch oligo (TSO) was left out to avoid full-length cDNA amplification in parallel to targeted amplification. Starting with 2,000 beads from Exonuclease I treatment, TAP-seq was performed as described above, with the following modification: As reverse primer for PCR1/2, an oligo ISPCR was added instead of PartialRead1. As reverse primer for PCR3, Targeted10X was replaced by New-P5 smart PCR hybrid oligo. All oligonucleotide sequences are described in Table S6.
Methods for computational data analysis
All computational analysis methods are available in Note S3.
Data visualization
All plots were generated using the ggplot2 (v. 3.1.0), gviz (1.24.0), and pheatmap (v. 1.0.10) packages in R 3.5.1. Boxplots are defined as follows: The middle line corresponds to the median; lower and upper hinges correspond to first and third quartiles. The upper whisker extends from the hinge to the largest value no further than 1.5 * IQR from the hinge (where IQR is the inter-quartile range, or distance between the first and third quartiles). The lower whisker extends from the hinge to the smallest value at most 1.5 * IQR of the hinge. Data beyond the end of the whiskers are called “outlying” points and are plotted individually51.
Statistics and Reproducibility
Statistical analyses were performed using R and scripts available at https://github.com/argschwind/TAPseq_manuscript. Statistical details for each experiment are also provided in the figure legends.
Extended Data
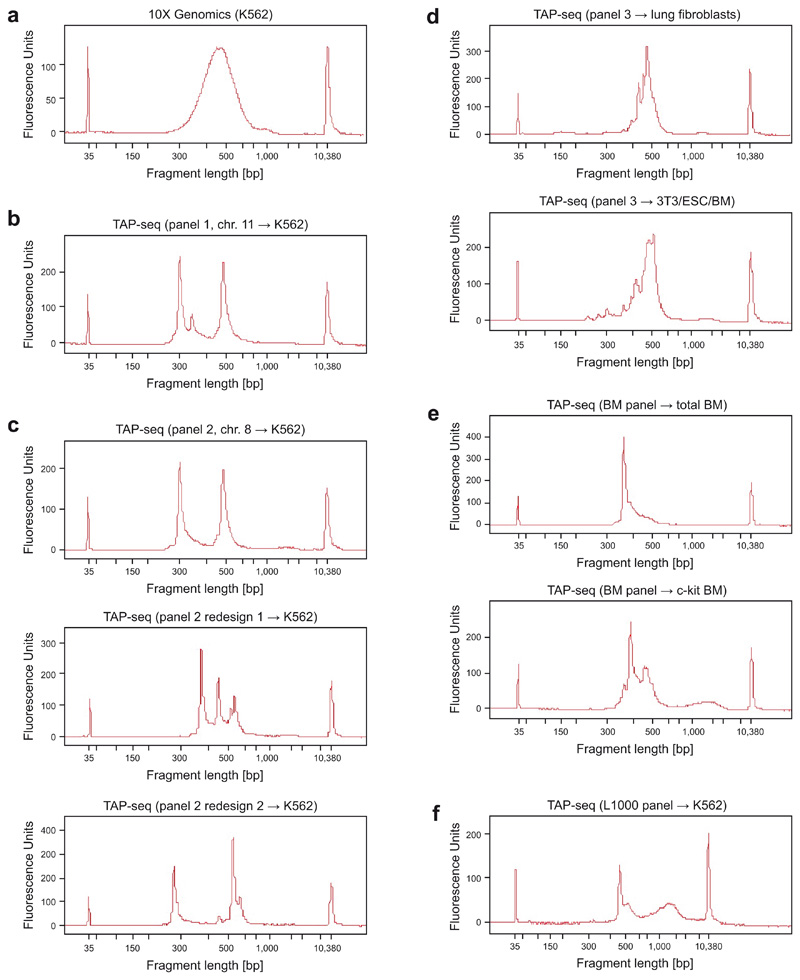
Extended Data Fig. 1. Sample bioanalyzer traces for libraries from TAP-seq and 10X Genomics.
a. Standard 10X Genomics protocol. b. TAP-seq library using panel 1 and cDNA from 10X Genomics K562 cells as input material. Strong peaks in TAP-seq profile correspond to highly expressed genes in the primer panel (HBG1, HBG2, HBE1), as validated by sub-cloning of bands and Sanger sequencing (not shown). c-f. Remaining target gene panels applied to different cell types and cell lines.
Extended Data Fig. 2. Choice of target genes and single cell capture platform.
a. Left panel: Expression ranks of genes used for the three test panels. An x-axis value of 1 refers to highest expression. See y-axis labels for number of target genes, and refer to Methods section on ‘data visualization’ for a description of violin plot elements. Right panel: Fraction of the transcriptome covered by these panels, computed from a whole transcriptome reference data set from the same cell type (y-axis labels). For panels 1+2, K562 cells were used, panel 3 was applied to mouse embryonic stem cells (ESCs), mouse 3T3 cells, mouse neutrophils (Neutr.), and mouse lung mesenchymal cells (Lung). b. Mean gene expression levels for 10X Genomics and Drop-seq based TAP-seq. Panel 1 was used in both cases. n=84 genes are shown. c. Number of UMIs observed per cell for both TAP-seq and whole transcriptome readout (Whole Tx), using 10X Genomics or Drop-seq for RNA capture and reverse transcription. Experiments were downsampled to an average of 1,000 reads per cell.
Extended Data Fig. 3. Analysis of the L1000 panel.
a. Spearman correlation in mean gene expression levels between TAP-seq and whole transcriptome readout (Whole Tx) for a panel targeting the L1000 gene set34. n=963 genes were covered in TAP-seq and are included in the plot. b. Principal component analysis of the TAP-seq dataset and the whole transcriptome dataset. Principal component loadings of all genes annotated in cyclebase v352 are shown, with the peak-time of expression color-coded. In the whole transcriptome dataset, PC1-3 were not significantly associated with GO-terms (not shown). n=8734 cells (TAP-seq) and 8282 cells (Whole Tx).
Extended Data Fig. 4. Analysis of library complexity in TAP-seq and whole transcriptome 10x Genomics.
a. Deeply sequenced TAP-seq and whole transcriptome (Whole Tx) libraries were downsampled to a given average number of reads per cell (x-axis). The average number of UMIs observed on the target panel (solid lines, shown for both methods) or across the entire genome (dashed line, only shown for whole transcriptome readout) is shown. See also Figure 1e. b. Deeply sequenced TAP-seq and whole transcriptome libraries were down-sampled to a given average number of reads per cell (x-axis). The ratio in UMIs observed on the target gene panel between TAP-seq and whole transcriptome sequencing is plotted as a measure of enrichment efficiency c. For K562 cells and panel 1, gene detection levels were compared between genes of different expression levels. See also Figure 1f. d. Number of molecules observed per cell in different cell types at 160,000 reads per cell. n=109 3T3 cells, 160 ESCs, 130 Lung cells and 55 Neutrophils. See Methods section on ‘data visualization’ for a description of box plot elements.
Extended Data Fig. 5. Analysis of reproducibility in TAP-seq and whole transcriptome 10X Genomics.
a. Pearson correlation in mean gene expression levels across all genes of panel 2 (n=74 genes) between three biological replicates. b. Pearson correlation between whole transcriptome 10X Genomics and TAP-seq for various panels and cell lines/cell types (see Extended Data Figure 2a for number of genes per panel). c. Pearson correlation between whole transcriptome 10X Genomics and bulk RNA-seq (GEO: GSM2343836), across the n=84 genes of panel 1 and the n=74 genes of panel 2.
Extended Data Fig. 6. Technical properties of the ground truth perturbation experiment.
a. Gene expression level in K562 cells of the various gRNA target genes used. b. Enhancer gRNAs were validated by pooled transduction of K562 dCas9-KRAB cells with all four enhancer-targeting guides, and the effect on target gene expression was quantified by qPCR. HBE1 was analyzed as target gene for the HS2 enhancer. n=3 replicates. c. Histogram of the number of gRNAs identified per cell in the TAP-seq experiment of Figure 2. d. The number of gRNAs observed per cell (see also in c) was fitted with a generative model of gRNA capture efficiency and multiplicity of infection4,20. Log-likelihood is plotted as a function of the parameters; the maximum likelihood estimate is marked by a cross. Data from n=21,977 (TAP-seq), n=7,994 (Perturb-Seq) or n=37,971 cells (Perturb-seq + gRNA amp.) was used. e. Mean expression per gene for whole transcriptome 10X Genomics compared to TAP-seq, with perturbation target genes highlighted. n=74 genes from panel 2 are shown. Two genes for which perturbation effects were detected with a lower efficiency in TAP-seq are highlighted in red.
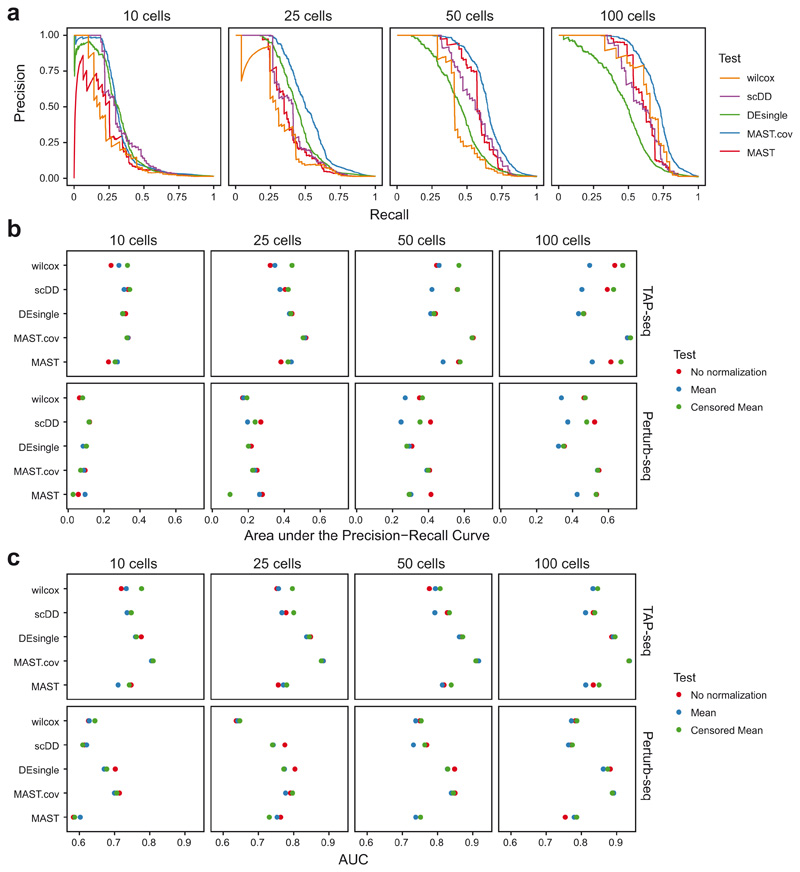
Extended Data Fig. 7. Comparison of differential expression testing methods.
a. Comparison using Precision-Recall curves, as in Figure 2f. TAP-seq data were downsampled to 10, 25, 50 or 100 cells per gRNA. For each sampling run, differential expression testing was performed using a simple (two-sided) Wilcoxon test, MAST53, DEsingle54 and scDD55, as well as MAST with the number of genes observed as an additional covariate. Precision-Recall curves were computed assuming that the intended gRNA targets constitute the full set of true positives. Data were normalized across cells using the censored mean, i.e. division with the mean expression of all genes not part of the highest decile. b. Performance comparison in terms of area under the Precision-Recall curve for different data normalization strategies and tests. c. Performance comparison in terms of area under the ROC curve.
Extended Data Fig. 8. Additional analyses of the ground truth perturbation dataset.
a. Precision-Recall curves, as in Figure 2f. Potentially true gRNA off-target or downstream effects were identified by differential expression testing across all cells, and then excluded from the analysis. Points indicate performance at a nominal FDR of 0.05. See Note S3 section ‘Sensitivity analysis (differential expression)’ for detail on the statistical test used. b. Comparison of Area under the precision-recall curves (AUPRC) for n=100 cells per perturbation, sampled to various read depths. Potential gRNA off-target and downstream effects were treated as false positives (solid lines, same as in Figure 2g) or excluded (dashed lines). c. The absolute effect of a gRNA-mediated perturbation in UMIs/cell was quantified from non-downsampled whole transcriptome data (x-Axis). The probability of observing these effects as significant was the quantified by drawing 100 samples using 150 cells per sample and 1,000 average reads per cell (y-Axis). Lines derive from a logistic regression. The UMI difference required for achieving a 50% detection probability was used as a measure of molecular sensitivity (dotted line). Data from n=60,106 cells and 9,750 sampling runs. d. Like Figure 2g, but using molecular sensitivity as defined in panel c as the measure of sensitivity. Down-sampling was restricted to 50-150 cells per perturbation, since estimates of molecular sensitivity were otherwise driven by excessive sampling noise. Data from n=60,106 cells and 7,150 sampling runs. e. AUPRC plotted in relationship to number of cells per perturbation and total number of reads (data from Figure 2g). f. For of n=56 each gRNA targets, the absolute and relative expression change elicited by the perturbation, as well as the expression baseline, were computed from whole transcriptome data without subsampling (x-axis). Data from both methods were then downsampled repeatedly to 150 cells per perturbation and 10,000 (Perturb-seq) or 1,000 (TAP-seq) reads per cell to determine the probability of detecting a change (y-axis). Refer to methods section on ‘data visualization’ for a definition of box plot elements.
Extended Data Fig. 9. Additional analyses of the enhancer screen.
a. Number of detected gRNAs/perturbations per cell were plotted. b. Levenshtein edit distance between the consensus sequence of a gRNA in a given cell, and the template sequence, showing that in 93 % (chr. 8) or 95 % (chr. 11) of cases, there were no mismatches between consensus and template. c. Fold change in gene expression of enhancer targets is plotted in relation to the number of gRNAs supporting an enhancer-target gene pair (ETP). Number of ETPs per confidence level: 0=1, 1=21, 2=12, 3=11, 4=11. d. Zoom-in on a region surrounding the IFITM locus shows identification previously known enhancers56. e. Distance to transcription start site (TSS) was plotted against confidence level, as calculated from the number of individual gRNAs with a detected effect on the target gene. Number of ETPs per confidence level: 0=1, 1=21, 2=12, 3=11, 4=11. See Methods section on ‘data visualization’ for a definition of boxplot elements. f. Number of genes jumped between an enhancer and the identified target gene was plotted (main panel). Inset shows association strength, calculated from the proportion of gRNAs that support the ETP, plotted against the number of jumped genes. g. Histogram of log-fold expression differences between jumped genes and the respective true enhancer target. h. Like Figure 3h, but including all 34,493 potential ETPs across the whole dataset, instead of just gene-proximal ETPs. i. Precision-Recall curves for classifiers trained on the dataset generated in this study, and applied to the dataset from ref. 9 (orange line), or classifiers trained on the dataset from ref. 9 and applied to this dataset.
Extended Data Fig. 10. Additional analyses of the mouse bone marrow experiment.
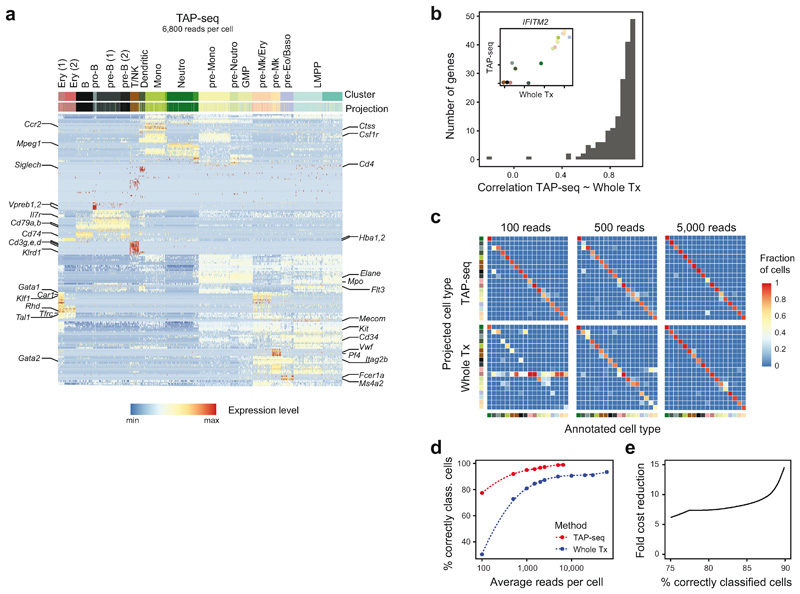
a. Heatmap depicting the expression of all 182 target genes across 11,794 cells, as measured by TAP-seq. Top row (‘Cluster’) depicts the result of unsupervised clustering, second row (‘Projection’) depicts the result of transferring labels26 from the whole transcriptome reference data set (see Figure 4a for color code). b. Gene expression correlations across populations. Mean gene expression for each gene in the mouse bone marrow panel was computed for each cell type, and the Pearson correlation between TAP-seq and whole transcriptome readout (Whole Tx) across n=18 cell types was computed. Main panel shows Pearson correlation coefficients for all tested genes across cell types. Inset shows expression of IFITM2 as measured by TAP-seq and whole transcriptome readout for each cell type (color code as described in Figure 4a). c. Data from both methods were downsampled to various average read depths and an identical number of cells, and labels were transferred26 from the non-downsampled reference. For each cell type plotted on the x-axis, the fraction of cells projected to the cell types plotted on the y-axis was quantified (color code as described in Figure 4a). d. Average read depth per cell is plotted against the fraction of cells correctly classified. e. The fold difference in sequencing reads between TAP-seq and whole transcriptome is plotted as a function of the fraction of cells correctly classified.
Supplementary Material
List of primer panel sequences used for TAP-seq. For each target gene, the sequences as well as the genome-wide rank in gene expression (from whole transcriptome 10X Genomics) are shown.
Significant enhancer-target pairs identified in this study. See methods, section on ‘Enhancer screen analysis’ for description of the statistical test used to compute p values. A total of n=231,667 cells were included into the tests.
Pairwise comparisons of chromatin activity between enhancers from strong, weak and non-significant ETPs. p-values were calculated using Wilcoxon signed-rank tests. See Note S3 section Hi-C and chromatin analyses for description of chromatin activity and selection of non-significant ETPs.
Acknowledgements
This work was supported by grants from the European Research Council Advanced Investigator Grant (AdG-294542 and AdG-742804 to L.M.S.) and the Emerson Collective (award 643577 to L.V. and L.M.S.). D.S. was supported by a fellowship from the EMBL Interdisciplinary Postdoc (EIPOD) program under Marie Sklodowska-Curie Actions COFUND (grant agreement number 664726). A.R.G. was supported by an Early Postdoc.Mobility fellowship (project number P2LAP3_171806) from the Swiss National Science Foundation (SNSF). We thank P. Collier, I. Gupta, H. Tilgner and D. Pavlinic for advice on 10X Chromium; S. Vonesch, K. Roy and J. Smith for advice on gRNA library cloning; V. Benes and D. Pavlinic for Illumina sequencing; M. Paulsen and team for flow cytometry service; S. Haas, J. Al-Sabah, C. Baccin, L. Ballenberger, L. Martins, C. Scholl and K.-M. Noh for providing cell samples; A. Rabinowitz for advice on the analysis of Hi-C data.
Footnotes
Author contributions
D.S., L.V., A.R.G. and L.M.S. conceptualized the project, with contributions by J.O.K. D.S., D.R.L., P.J., and J.H.M. performed experiments. A.R.G. developed primer design pipeline. A.R.G. and L.V. performed data analysis. L.M. and C.M. implemented Drop-seq. D.S., A.R.G., L.V. and L.M.S. wrote the manuscript. All authors commented on the manuscript.
Competing interest statement
The authors declare no competing financial interests.
Reporting summary
Further information on research design is available in the Nature Research Reporting Summary linked to this article.
Data availability
All data are available from GEO GSE135497. A summary of all genomics data used for each figure is provided in Table S5. ENCODE bulk RNA- and ChIP-seq data is available from encodeproject.org (Experiment IDs: ENCSR545DKY, ENCSR000AKP, ENCSR000EWC, ENCSR000EWA, ENCSR000EWB, ENCSR388QZF, ENCSR921NMD). Hi-C data from ref. 39 is available from GEO GSE63525. Mouse bone marrow single-cell RNA-seq data is available from GEO GSE122465.
Code availability
The TAP-seq R-package for primer design is available through http://bioconductor.org (https://dx.doi.org/10.18129/B9.bioc.TAPseq). Code required to reproduce the analyses of this paper, as well as a pipeline for TAP-seq data processing, is available at https://github.com/argschwind/TAPseq_manuscript and https://github.com/argschwind/TAPseq_workflow.
References
- 1.Steinmetz LM, et al. Systematic screen for human disease genes in yeast. Nat Genet. 2002;31:400–404. doi: 10.1038/ng929. [DOI] [PubMed] [Google Scholar]
- 2.Winzeler EA, et al. Functional characterization of the S. cerevisiae genome by gene deletion and parallel analysis. Science. 1999;285:901–6. doi: 10.1126/science.285.5429.901. [DOI] [PubMed] [Google Scholar]
- 3.Shifrut E, et al. Genome-wide CRISPR Screens in Primary Human T Cells Reveal Key Regulators of Immune Function. Cell. 2018;175:1958–1971.e15. doi: 10.1016/j.cell.2018.10.024. [DOI] [PMC free article] [PubMed] [Google Scholar]
- 4.Dixit A, et al. Perturb-Seq: Dissecting Molecular Circuits with Scalable Single-Cell RNA Profiling of Pooled Genetic Screens. Cell. 2016;167:1853–1866.e17. doi: 10.1016/j.cell.2016.11.038. [DOI] [PMC free article] [PubMed] [Google Scholar]
- 5.Jaitin DA, et al. Dissecting Immune Circuits by Linking CRISPR-Pooled Screens with Single-Cell RNA-Seq. Cell. 2016;167:1883–1896.e15. doi: 10.1016/j.cell.2016.11.039. [DOI] [PubMed] [Google Scholar]
- 6.Datlinger P, et al. Pooled CRISPR screening with single-cell transcriptome readout. Nat Methods. 2017;14:297–301. doi: 10.1038/nmeth.4177. [DOI] [PMC free article] [PubMed] [Google Scholar]
- 7.Xie S, Duan J, Li B, Zhou P, Hon GC. Multiplexed Engineering and Analysis of Combinatorial Enhancer Activity in Single Cells. Mol Cell. 2017;66:285–299.e5. doi: 10.1016/j.molcel.2017.03.007. [DOI] [PubMed] [Google Scholar]
- 8.Adamson B, et al. A Multiplexed Single-Cell CRISPR Screening Platform Enables Systematic Dissection of the Unfolded Protein Response. Cell. 2016;167:1867–1882.e21. doi: 10.1016/j.cell.2016.11.048. [DOI] [PMC free article] [PubMed] [Google Scholar]
- 9.Gasperini M, et al. A Genome-wide Framework for Mapping Gene Regulation via Cellular Genetic Screens. Cell. 2019;176:377–390. doi: 10.1016/j.cell.2018.11.029. [DOI] [PMC free article] [PubMed] [Google Scholar]
- 10.Van Der Wijst MGP, et al. Single-cell RNA sequencing identifies celltype-specific cis-eQTLs and co-expression QTLs. Nat Genet. 2018;50:493–497. doi: 10.1038/s41588-018-0089-9. [DOI] [PMC free article] [PubMed] [Google Scholar]
- 11.van Galen P, et al. Single-Cell RNA-Seq Reveals AML Hierarchies Relevant to Disease Progression and Immunity. Cell. 2019;176:1265–1281.e24. doi: 10.1016/j.cell.2019.01.031. [DOI] [PMC free article] [PubMed] [Google Scholar]
- 12.Cuomo AS, et al. Single-cell RNA-sequencing of differentiating iPS cells reveals dynamic genetic effects on gene expression. bioRxiv. 2019 doi: 10.1101/630996. [DOI] [PMC free article] [PubMed] [Google Scholar]
- 13.Sanyal A, Lajoie BR, Jain G, Dekker J. The long-range interaction landscape of gene promoters. Nature. 2012;489:109–113. doi: 10.1038/nature11279. [DOI] [PMC free article] [PubMed] [Google Scholar]
- 14.Krivega I, Dean A. Enhancer and promoter interactions—long distance calls. Curr Opin Genet Dev. 2012;22:79–85. doi: 10.1016/j.gde.2011.11.001. [DOI] [PMC free article] [PubMed] [Google Scholar]
- 15.Zheng GXY, et al. Massively parallel digital transcriptional profiling of single cells. Nat Commun. 2017;8:14049. doi: 10.1038/ncomms14049. [DOI] [PMC free article] [PubMed] [Google Scholar]
- 16.Macosko EZ, et al. Highly Parallel Genome-wide Expression Profiling of Individual Cells Using Nanoliter Droplets. Cell. 2015;161:1202–1214. doi: 10.1016/j.cell.2015.05.002. [DOI] [PMC free article] [PubMed] [Google Scholar]
- 17.Horlbeck MA, et al. Compact and highly active next-generation libraries for CRISPR-mediated gene repression and activation. Elife. 2016;5 doi: 10.7554/eLife.19760. [DOI] [PMC free article] [PubMed] [Google Scholar]
- 18.Hilton IB, et al. Epigenome editing by a CRISPR-Cas9-based acetyltransferase activates genes from promoters and enhancers. Nat Biotechnol. 2015;33:510–517. doi: 10.1038/nbt.3199. [DOI] [PMC free article] [PubMed] [Google Scholar]
- 19.Fulco CP, et al. Systematic mapping of functional enhancer–promoter connections with CRISPR interference. Science (80-) 2016;354:769–773. doi: 10.1126/science.aag2445. [DOI] [PMC free article] [PubMed] [Google Scholar]
- 20.Hill AJ, et al. On the design of CRISPR-based single-cell molecular screens. Nat Methods. 2018;15:271–274. doi: 10.1038/nmeth.4604. [DOI] [PMC free article] [PubMed] [Google Scholar]
- 21.Zacher B, et al. Accurate Promoter and Enhancer Identification in 127 ENCODE and Roadmap Epigenomics Cell Types and Tissues by GenoSTAN. PLoS One. 2017;12:e0169249. doi: 10.1371/journal.pone.0169249. [DOI] [PMC free article] [PubMed] [Google Scholar]
- 22.Klann TS, et al. CRISPR–Cas9 epigenome editing enables high-throughput screening for functional regulatory elements in the human genome. Nat Biotechnol. 2017;35:561–568. doi: 10.1038/nbt.3853. [DOI] [PMC free article] [PubMed] [Google Scholar]
- 23.Tusi BK, et al. Population snapshots predict early haematopoietic and erythroid hierarchies. Nature. 2018;555:54–60. doi: 10.1038/nature25741. [DOI] [PMC free article] [PubMed] [Google Scholar]
- 24.Paul F, et al. Transcriptional heterogeneity and lineage commitment in myeloid progenitors. Cell. 2015;163:1663–1677. doi: 10.1016/j.cell.2015.11.013. [DOI] [PubMed] [Google Scholar]
- 25.Baccin C, et al. Combined single-cell and spatial transcriptomics reveal the molecular, cellular and spatial bone marrow niche organization. Nat Cell Biol. 2020;22:38–48. doi: 10.1038/s41556-019-0439-6. [DOI] [PMC free article] [PubMed] [Google Scholar]
- 26.Stuart T, et al. Comprehensive Integration of Single-Cell Data. Cell. 2019;177:1888–1902. doi: 10.1016/j.cell.2019.05.031. [DOI] [PMC free article] [PubMed] [Google Scholar]
- 27.Fan HC, Fu GK, Fodor SPA. Combinatorial labeling of single cells for gene expression cytometry. Science (80-) 2015;347 doi: 10.1126/science.1258367. 1258367. [DOI] [PubMed] [Google Scholar]
- 28.Shum EY, Walczak EM, Chang C, Christina Fan H. Quantitation of mRNA Transcripts and Proteins Using the BD Rhapsody™ Single-Cell Analysis System. Advances in Experimental Medicine and Biology. 2019:63–79. doi: 10.1007/978-981-13-6037-4_5. [DOI] [PubMed] [Google Scholar]
- 29.Vallejo AF, et al. Resolving cellular systems by ultra-sensitive and economical single-cell transcriptome filtering. bioRxiv. 2019 doi: 10.1101/800631. [DOI] [PMC free article] [PubMed] [Google Scholar]
- 30.Uzbas F, et al. BART-Seq: cost-effective massively parallelized targeted sequencing for genomics, transcriptomics, and single-cell analysis. Genome Biol. 2019;20:155. doi: 10.1186/s13059-019-1748-6. [DOI] [PMC free article] [PubMed] [Google Scholar]
- 31.Dunn S-J, Martello G, Yordanov B, Emmott S, Smith aG. Defining an essential transcription factor program for naïve pluripotency. Science (80-) 2014;344:1156–1160. doi: 10.1126/science.1248882. [DOI] [PMC free article] [PubMed] [Google Scholar]
- 32.Horn T, et al. Mapping of signaling networks through synthetic genetic interaction analysis by RNAi. Nat Methods. 2011;8:341–346. doi: 10.1038/nmeth.1581. [DOI] [PubMed] [Google Scholar]
- 33.Zetsche B, et al. Multiplex gene editing by CRISPR–Cpf1 using a single crRNA array. Nat Biotechnol. 2016;35:31–34. doi: 10.1038/nbt.3737. [DOI] [PMC free article] [PubMed] [Google Scholar]
- 34.Subramanian A, et al. A Next Generation Connectivity Map: L1000 Platform and the First 1,000,000 Profiles. Cell. 2017;171:1437–1452.e17. doi: 10.1016/j.cell.2017.10.049. [DOI] [PMC free article] [PubMed] [Google Scholar]
- 35.Kearns NA, et al. Functional annotation of native enhancers with a Cas9-histone demethylase fusion. Nat Methods. 2015;12:401–403. doi: 10.1038/nmeth.3325. [DOI] [PMC free article] [PubMed] [Google Scholar]
- 36.Li K, et al. Interrogation of enhancer function by enhancer-targeting CRISPR epigenetic editing. Nat Commun. 2020;11:485. doi: 10.1038/s41467-020-14362-5. [DOI] [PMC free article] [PubMed] [Google Scholar]
- 37.Rosenberg AB, et al. Single-cell profiling of the developing mouse brain and spinal cord with split-pool barcoding. Science (80-) 2018;360:176–182. doi: 10.1126/science.aam8999. [DOI] [PMC free article] [PubMed] [Google Scholar]
- 38.Datlinger P, et al. Ultra-high throughput single-cell RNA sequencing by combinatorial fluidic indexing. bioRxiv. 2019 doi: 10.1101/2019.12.17.879304. 2019.12.17.879304. [DOI] [PMC free article] [PubMed] [Google Scholar]
- 39.Rao SSP, et al. A 3D Map of the Human Genome at Kilobase Resolution Reveals Principles of Chromatin Looping. Cell. 2014;159:1665–1680. doi: 10.1016/j.cell.2014.11.021. [DOI] [PMC free article] [PubMed] [Google Scholar]
- 40.Dunham I, et al. An integrated encyclopedia of DNA elements in the human genome. Nature. 2012;489:57–74. doi: 10.1038/nature11247. [DOI] [PMC free article] [PubMed] [Google Scholar]
- 41.Chen S, et al. Genome-wide CRISPR Screen in a Mouse Model of Tumor Growth and Metastasis. Cell. 2015;160:1246–1260. doi: 10.1016/j.cell.2015.02.038. [DOI] [PMC free article] [PubMed] [Google Scholar]
- 42.Mendenhall EM, et al. Locus-specific editing of histone modifications at endogenous enhancers. Nat Biotechnol. 2013;31:1133–1136. doi: 10.1038/nbt.2701. [DOI] [PMC free article] [PubMed] [Google Scholar]
- 43.Deliu E, et al. Haploinsufficiency of the intellectual disability gene SETD5 disturbs developmental gene expression and cognition. Nat Neurosci. 2018;21:1717–1727. doi: 10.1038/s41593-018-0266-2. [DOI] [PubMed] [Google Scholar]
- 44.Zheng GXY, et al. Massively parallel digital transcriptional profiling of single cells. Nat Commun. 2017;8:14049. doi: 10.1038/ncomms14049. [DOI] [PMC free article] [PubMed] [Google Scholar]
- 45.Velten L, et al. Single-cell polyadenylation site mapping reveals 3’ isoform choice variability. Mol Syst Biol. 2015;11:812. doi: 10.15252/msb.20156198. [DOI] [PMC free article] [PubMed] [Google Scholar]
- 46.Xie T, et al. Single-Cell Deconvolution of Fibroblast Heterogeneity in Mouse Pulmonary Fibrosis Article Single-Cell Deconvolution of Fibroblast Heterogeneity in Mouse Pulmonary Fibrosis. CellReports. 2018;22:3625–3640. doi: 10.1016/j.celrep.2018.03.010. [DOI] [PMC free article] [PubMed] [Google Scholar]
- 47.Untergasser A, et al. Primer3—new capabilities and interfaces. Nucleic Acids Res. 2012;40:e115. doi: 10.1093/nar/gks596. [DOI] [PMC free article] [PubMed] [Google Scholar]
- 48.Koressaar T, Remm M. Enhancements and modifications of primer design program Primer3. Bioinformatics. 2007;23:1289–1291. doi: 10.1093/bioinformatics/btm091. [DOI] [PubMed] [Google Scholar]
- 49.Schraivogel D, Velten L, Gschwind AR, Steinmetz LM. A protocol for Targeted Perturb (TAP)-seq and targeted single-cell RNA-seq. Protoc Exch. 2020 doi: 10.21203/rs.3.pex-864/v1. [DOI] [Google Scholar]
- 50.Tilgner H, et al. Microfluidic isoform sequencing shows widespread splicing coordination in the human transcriptome. Genome Res. 2018;28:231–242. doi: 10.1101/gr.230516.117. [DOI] [PMC free article] [PubMed] [Google Scholar]
- 51.Wickham H. ggplot2: Elegant Graphics for Data Analysis. Springer; New York: 2009. [DOI] [Google Scholar]
- 52.Santos A, Wernersson R, Jensen LJ. Cyclebase 3.0: a multi-organism database on cell-cycle regulation and phenotypes. Nucleic Acids Res. 2015;43:D1140–D1144. doi: 10.1093/nar/gku1092. [DOI] [PMC free article] [PubMed] [Google Scholar]
- 53.Finak G, et al. MAST: a flexible statistical framework for assessing transcriptional changes and characterizing heterogeneity in single-cell RNA sequencing data. Genome Biol. 2015;16:278. doi: 10.1186/s13059-015-0844-5. [DOI] [PMC free article] [PubMed] [Google Scholar]
- 54.Miao Z, Deng K, Wang X, Zhang X. DEsingle for detecting three types of differential expression in single-cell RNA-seq data. Bioinformatics. 2018;34:3223–3224. doi: 10.1093/bioinformatics/bty332. [DOI] [PubMed] [Google Scholar]
- 55.Korthauer KD, et al. A statistical approach for identifying differential distributions in single-cell RNA-seq experiments. Genome Biol. 2016;17:222. doi: 10.1186/s13059-016-1077-y. [DOI] [PMC free article] [PubMed] [Google Scholar]
- 56.Li P, et al. Coordinated regulation of IFITM1, 2 and 3 genes by an IFN-responsive enhancer through long-range chromatin interactions. Biochim Biophys Acta - Gene Regul Mech. 2017;1860:885–893. doi: 10.1016/j.bbagrm.2017.05.003. [DOI] [PMC free article] [PubMed] [Google Scholar]
Associated Data
This section collects any data citations, data availability statements, or supplementary materials included in this article.
Supplementary Materials
List of primer panel sequences used for TAP-seq. For each target gene, the sequences as well as the genome-wide rank in gene expression (from whole transcriptome 10X Genomics) are shown.
Significant enhancer-target pairs identified in this study. See methods, section on ‘Enhancer screen analysis’ for description of the statistical test used to compute p values. A total of n=231,667 cells were included into the tests.
Pairwise comparisons of chromatin activity between enhancers from strong, weak and non-significant ETPs. p-values were calculated using Wilcoxon signed-rank tests. See Note S3 section Hi-C and chromatin analyses for description of chromatin activity and selection of non-significant ETPs.
Data Availability Statement
All data are available from GEO GSE135497. A summary of all genomics data used for each figure is provided in Table S5. ENCODE bulk RNA- and ChIP-seq data is available from encodeproject.org (Experiment IDs: ENCSR545DKY, ENCSR000AKP, ENCSR000EWC, ENCSR000EWA, ENCSR000EWB, ENCSR388QZF, ENCSR921NMD). Hi-C data from ref. 39 is available from GEO GSE63525. Mouse bone marrow single-cell RNA-seq data is available from GEO GSE122465.
The TAP-seq R-package for primer design is available through http://bioconductor.org (https://dx.doi.org/10.18129/B9.bioc.TAPseq). Code required to reproduce the analyses of this paper, as well as a pipeline for TAP-seq data processing, is available at https://github.com/argschwind/TAPseq_manuscript and https://github.com/argschwind/TAPseq_workflow.


