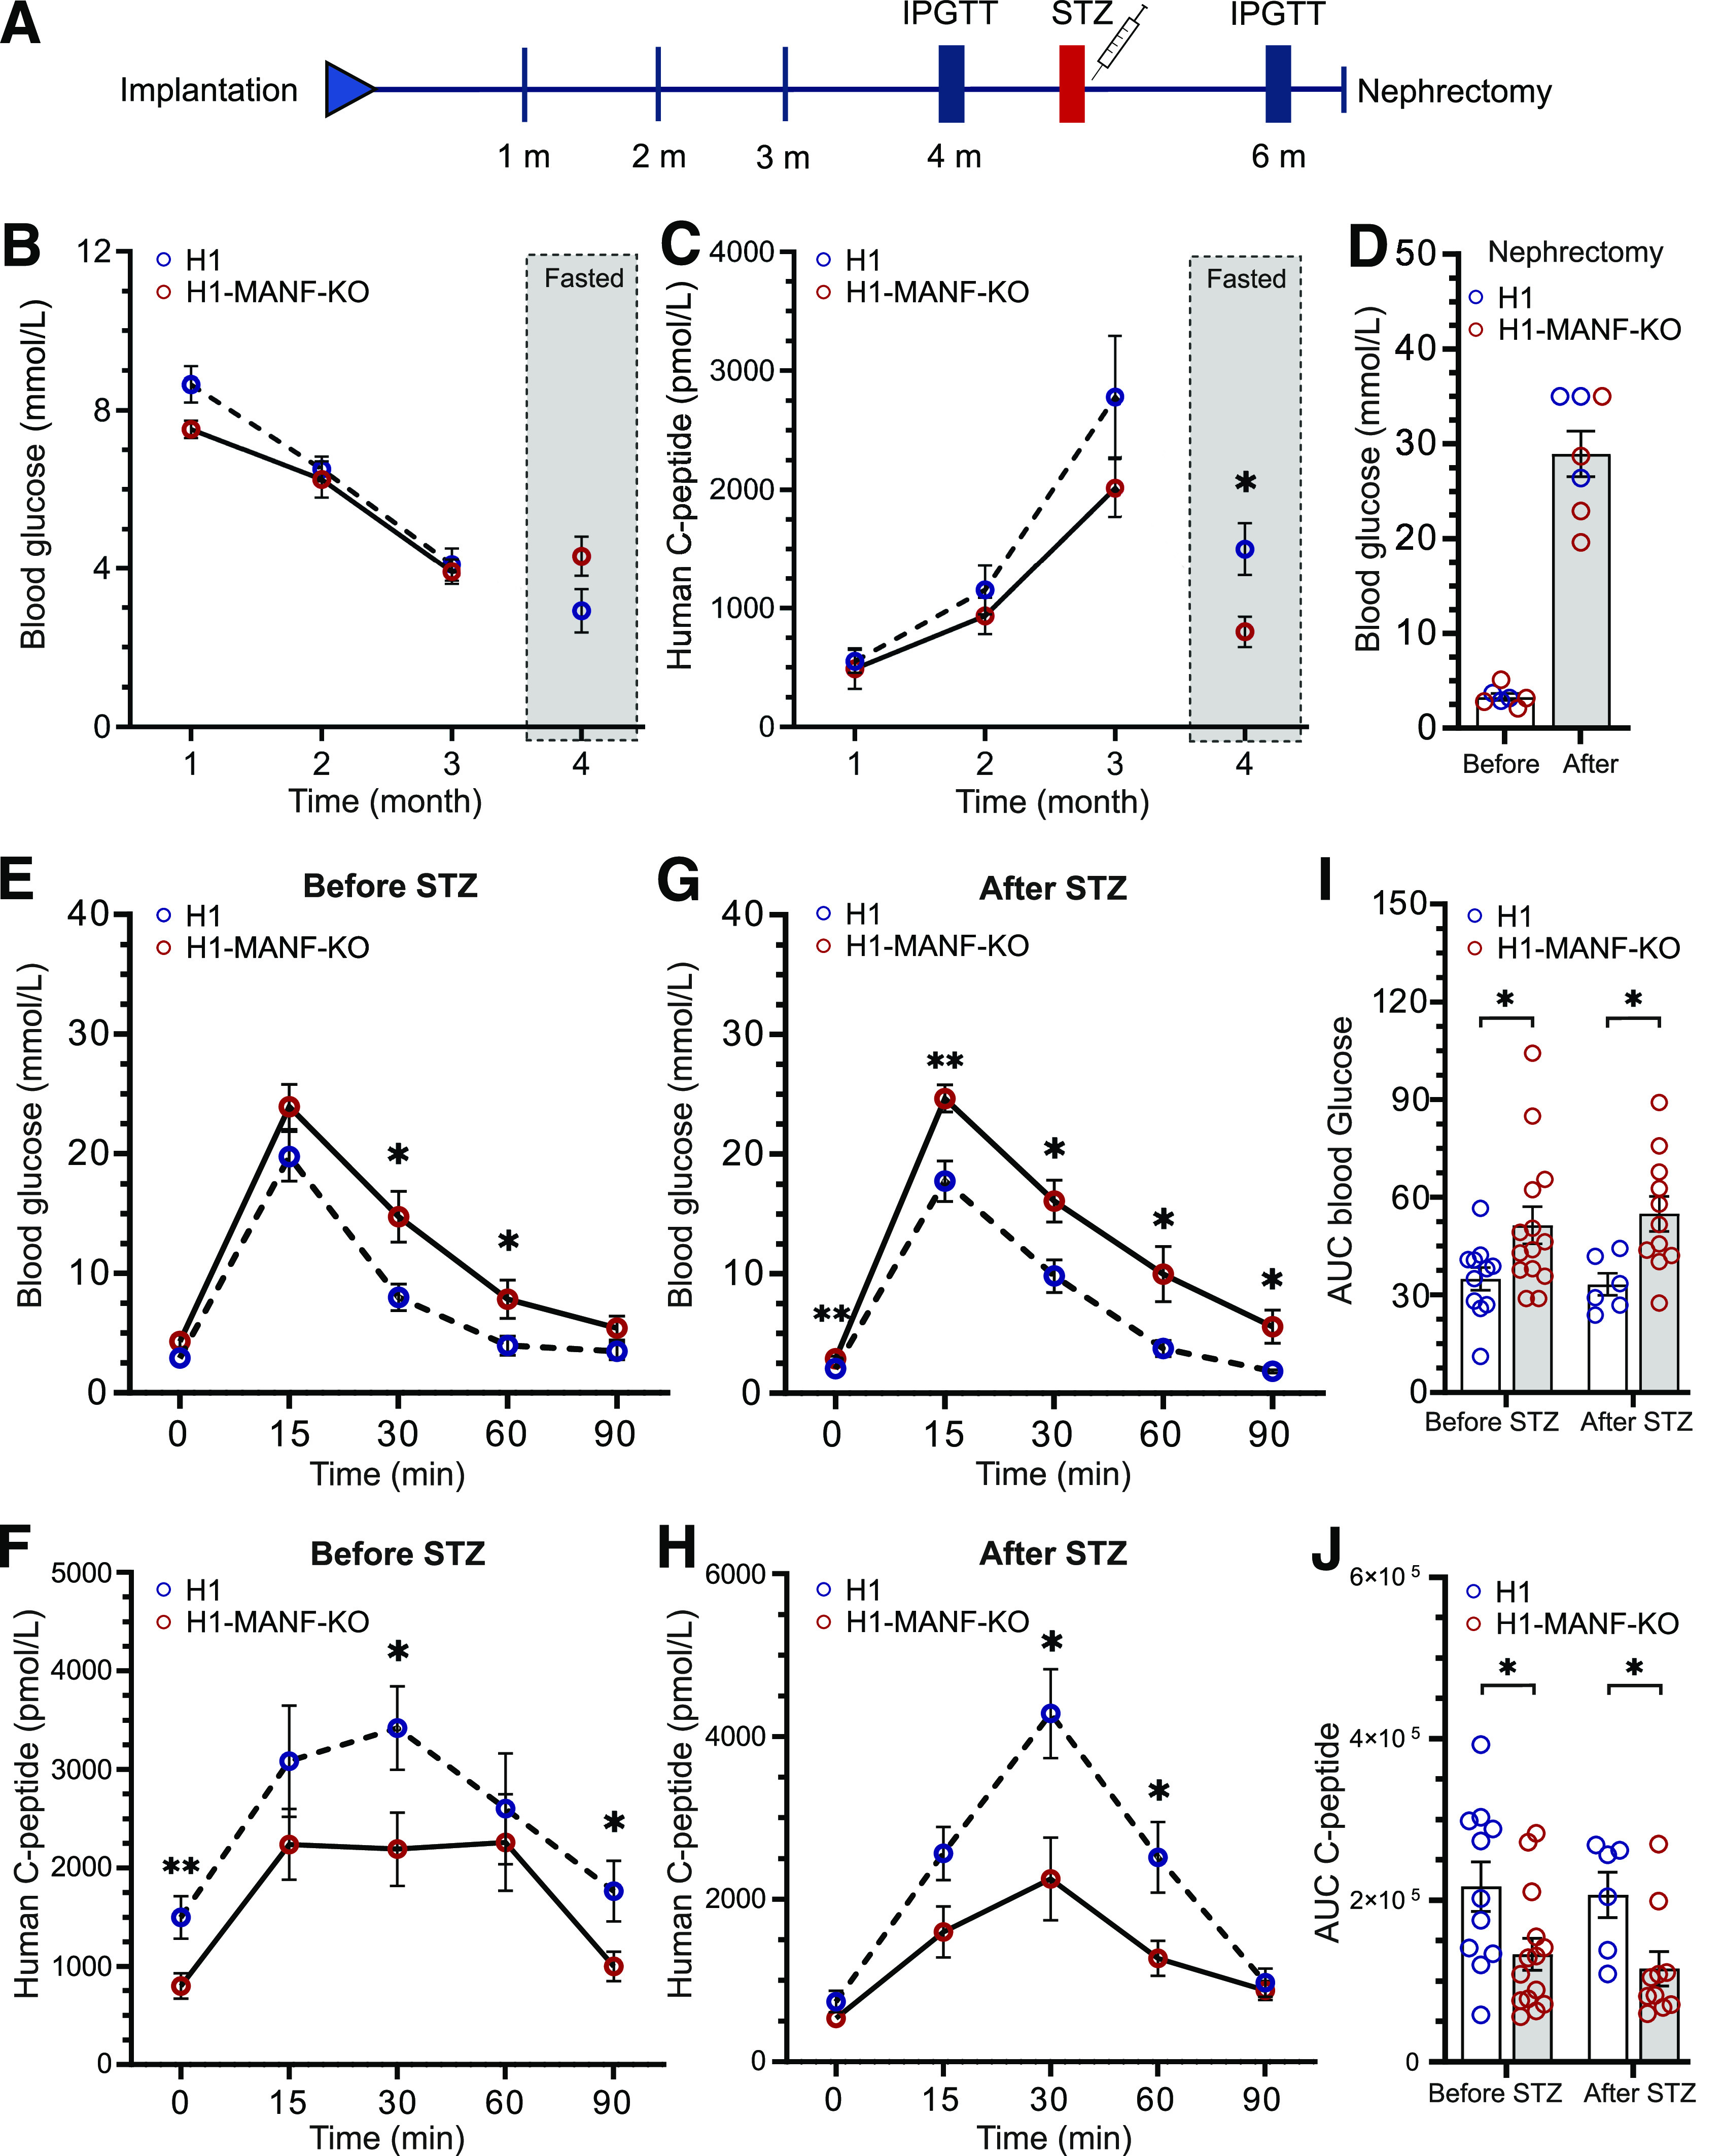
Figure 4.

Impaired response to glucose of MANF KO cells in vivo. A: Schematic presentation of the in vivo workflow. B: Monthly follow-up of H1 and H1-MANF-KO in vivo functionality by measuring the blood glucose levels of implanted mice. Measurements of the first 3 months were done on randomly fed mice, while for the last month, mice were fasted (N = 11 for H1 and 14 for H1-MANF-KO). C: Monthly follow-up of H1 and H1-MANF-KO in vivo functionality by measuring the circulating human C-peptide levels of implanted mice. Measurements were done on randomly fed mice for the first 3 months, while for the last month, mice were fasted (N = 11 for H1 and 14 for H1-MANF-KO). D: Blood glucose measurements before and after removing the implanted kidney of STZ-induced diabetic mice by surgical unilateral nephrectomy (N = 7). E: Blood glucose measurements during an IPGTT of fasted H1- and H1-MANF-KO–implanted mice before STZ treatment (N = 11 for H1 and 14 for H1-MANF-KO). F: Levels of circulating human C-peptide during an IPGTT of fasted H1- and H1-MANF-KO–implanted mice before STZ treatment (N = 11 for H1 and 14 for H1-MANF-KO). G: Blood glucose measurements during an IPGTT of fasted H1- and H1-MANF-KO–implanted mice after STZ treatment (N = 6 for H1 and 11 for H1-MANF-KO). H: Levels of circulating human C-peptide during an IPGTT of fasted H1- and H1-MANF-KO–implanted mice after STZ treatment (N = 6 for H1 and 11 for H1-MANF-KO). I: Quantification of the efficiency of the implanted grafts to regulate the mice blood glucose during IPGTT by measuring the area under the curve (AUC) of E and G. J: Quantification of the ability of the implanted grafts to secrete human C-peptide by measuring the AUC of F and H. H1 is presented as blue circles, and H1-MANF-KO is presented as red circles. Data are presented as mean ± SEM. *P < 0.05; **P < 0.001. m, months.
